
Energy Efficiency Policies and...
131
Energy Efficiency Policies and Indicators A Report by the World Energy Council October 2001
-
Upload
duongduong -
Category
Documents
-
view
218 -
download
0
Transcript of Energy Efficiency Policies and...

Energy Efficiency Policies and Indicators
A Report by the World Energy Council
October 2001

Energy Efficiency Policies and Indicators
Copyright 2001 World Energy Council
All rights reserved. No part of this publication may be reproduced, stored in a retrieval system ortransmitted in any form or by any means electronic, electrostatic, magnetic, mechanical, photocopy, recording or otherwise, without prior permission of the copyright holder.
Published October 2001 by: World Energy Council 5th Floor, Regency House 1-4 Warwick Street London W1B 5LT United Kingdom

Energy Efficiency Policies and Indicators - WEC Report 2001
i
Member Committees of the WEC
Albania Hungary Peru Algeria Iceland Philippines Angola India Poland Argentina Indonesia Portugal Australia Iran (Islamic Rep) Romania Austria Ireland Russian Federation Belarus Israel Saudi Arabia Belgium Italy Senegal Bolivia Japan Singapore Botswana Jordan Slovakia Brazil Kenya Slovenia Bulgaria Korea (Republic) South Africa Cameroon Latvia Spain Canada Libya/GSPLAJ Sri Lanka Chile Lithuania Swaziland China Luxembourg Sweden Congo (Democratic Republic) Macedonia (Republic) Switzerland Côte d'Ivoire Malaysia Syria (Arab Rep) Croatia Mali Taiwan, China Czech Republic Mexico Tanzania Denmark Monaco Thailand Egypt (Arab Rep) Mongolia Trinidad & Tobago El Salvador Morocco Tunisia Estonia Namibia Turkey Ethiopia Nepal U S A Finland Netherlands Ukraine France New Zealand United Kingdom Gabon Niger Uruguay Germany Nigeria Venezuela Ghana Norway Yemen Greece Pakistan Hong Kong, China Paraguay

Energy Efficiency Policies and Indicators - WEC Report 2001
ii
Energy Efficiency Workgroup
Chairman/Président Dr François Moisan, ADEME, France Vice-Chairman Mr Keiichi Yokobori APERC, Japan Secretary/Sécrétariat Dr Didier Bosseboeuf, ADEME, France
Technical coordination / coordination technique : Prof. Bruno Lapillonne, ENERDATA s.a. Mr Ivan Jaques, APERC, Japan Dr Mentor Poveda, OLADE, Ecuador Dr Oleg A Sinyugin, Dr Ivan Jaques (APERC) Co-authors : Dr Wolfgang Eichhammer, FHG/ISI, Germany Dr Philippe Menanteau, IEPE, France Prof. Jean-Pierre Orfeuil, Paris University, France Prof. Bertrand Château, ENERDATA s.a., France Mr Marc LaFrance, APERC, Japan Corresponding Members of WEC committees or ADEME's Network Algeria F. Habbeche APRUE Australia M. Bonou APERC Bulgaria Dr. Metodi Konstantinoff State Energy Efficiency Agency Cameroon B. Bignom, J.P. Ghonnang Ministry of Mines Water Resources & Energy Canada M. Nouhi Office de l’efficacité de l’énergie Chile J. Bravo Oliva National Energy Commission Colombia G. Jaimes UPME Czech Rep. M. Barton Czech Energy Agency Estonia Y. Rudi Estonian Energy Research Institute Germany Dr. W. Eichhammer FhG-ISI Greece M. Iatridis CRES Hong Kong, China Mr. L. T. Lee Energy Efficiency Office Hungary Dr L. Molnar Energy Centre India S. S. Ias Energy Management Center Indonesia Ms M. Ayuni Ministry of Energy and Natural Resources Energy Conservation Italy Dr. G. Perrella ENEA Japan Mr. F. Sato Energy Conservation Center Korea Dr. D. G. Oh Korea Energy Management Corporation Latvia Mr. Ints Viksna LAS Lithuania R. Jarmokas Energy Agency Malaysia Mr. Thiagarajan Velumail Ministry of Energy Mexico Dr Lourdes Melgar Secretaria de Energia New Zealand Gary Eng APERC Nigeria Dr. A.A. Esan Energy Commission Peru Gastón Miranda Zanardi,
Iris Cárdenas Pino Ministry of Energy and Mines
Philippines Ms. Helen B. Arias Public Relations Office Papua New Guinea M. Bonou APERC Poland KAPE KAPE Romania Nicoleta Timis Romanian Agency for Energy Conservation Russia Dr.Victor Shakhin Energy Ministry Slovenia Franc Beravs Agency for Efficient Energy Use Slovakia Štefan Herich Slovak Energy Agency South Africa Chris Cooper South African National Energy Association Switzerland Bernard Perrin Swiss Federal Office of Energy Taiwan, China Huang Wu MOEA Turkey Tülin KESKİN National Energy Conservation Center (EEI) United States Marc LaFrance APERC Vietnam Tran Thanh Lien APERC

Energy Efficiency Policies and Indicators - WEC Report 2001
iii
Foreword
This Report has been produced under the guidance of the World Energy Council's Programme Committee. More than 50 WEC Member Committees and other contributors have enthusiastically participated in the collaborative process of this study, particularly by providing information for a questionnaire on energy efficiency policy and measures. We would like to express our thanks to all the experts without whom the work would not have been completed. This study has been carried out in collaboration between ADEME and APERC, with strong support from OLADE. This international co-operation has added a lot of value to the report by expanding its geographical coverage and thus providing a new dimension to the data collection and its interpretation. We greatly appreciate contributions of the technical co-ordination team, in particular that of Bruno Lapillonne from ENERDATA S.A. They helped us in the development of homogeneous indicators, in the survey processing, and in drafting some chapters. We would also like to thank the six writers of the cases studies included in this report for their expertise in the field of international comparison of energy efficiency policies assessment: Oleg Sinyugin, Ivan Jaques and Marc LaFrance (APERC), Philippe Menanteau (IEPE), Wolfgang Eichhammer (FhG/ISI) and Jean-Pierre Orfeuil (Paris University). Finally, we extend our thanks to Mrs Elena Nekhaev from the WEC London office who encouraged and advised us in our work. Didier Bosseboeuf ........................................................................................ François Moisan
Keiichi Yokobori General secretary of the WEC service Co-chairmen of the WEC service on energy efficiency policy on energy efficiency policy

Energy Efficiency Policies and Indicators - WEC Report 2001
iv
Remerciements
Ce service a été effectué sous le patronage du Comité des Programmes du Conseil Mondial de l’Energie. Plus de 50 comités nationaux et équipes économiques ont participé efficacement et activement au bon déroulement de cette étude, particulièrement en répondant au questionnaire sur les politiques et mesures nationales. Nous voudrions adresser nos remerciements à tous les experts sans qui le travail n’aurait pu être accompli. Cette fois-ci, ce service a été organisé dans le cadre d’une étroite collaboration entre l’ADEME et l’APERC, avec un très fort support de Mr Mentor Poveda de l’OLADE. Cette collaboration a certainement contribué à fournir une valeur ajoutée par rapport aux études précédentes, en étendant la couverture géographique, mais surtout en apportant une nouvelle légitimité à la collecte de données et à son interprétation. Nous tenons à remercier l’équipe de coordination technique qui nous a aidé à élaborer des indicateurs homogènes pour le rapport, à synthétiser l’enquête et qui a participé à l’écriture de certains chapitres de ce rapport, et plus particulièrement B. Lapillonne d’ENERDATA s.a. Nous voudrions également remercier les six auteurs des études de cas incluses dans ce rapport pour leur grande expertise sur la comparaison internationale de l’évaluation des politiques d’efficacité énergétique : Oleg Sinyugin, Ivan Jaques, Marc LaFrance (APERC), Philippe Menanteau (IEPE), Wolfgang Eichhammer (FhG/ISI) et Jean-Pierre Orfeuil (Université de Paris). Notre remerciement va aussi à Madame Elena Nekhaev qui nous a beaucoup encouragés et conseillés dans notre travail. Didier Bosseboeuf ........................................................................................ François Moisan
Keiichi Yokobori Secrétaire général du service WEC Co-présidents du service WEC politique d’efficacité énergétique politique d’efficacité énergétique
Energy Efficiency Policies and Indicators - WEC Report 2001
v
Summary For the Tokyo and Houston Conference of the World Energy Council (WEC), ADEME was in charge of the coordination of a study called “Energy Efficiency Policies”. This study aimed at describing energy efficiency trends through various indicators and evaluating efficiency policies. For the Buenos Aires Congress, this study was updated and enlarged to a wider range of countries. For that purpose, ADEME was associated to APERC, Asia and Pacific Energy Research Centre, and more recently to OLADE, Latin American Energy Organisation. This study was carried out during the last three years with the technical assistance of ENERDATA s.a. and active contributions of more than 50 countries. The first objective of that study is to describe and explain the trends in energy efficiency performance in these countries. For that purpose a selection of indicators is analysed and compared. The methodology used is directly adapted from the European project on energy efficiency indicators, ODYSSEE (Ademe/EnR/SAVE Project). The second objective is to describe and evaluate energy efficiency policies carried out in a sample of countries all over the world. For that purpose, a survey was carried out in about 50 countries, representative of all world regions. The survey focused on six policy measures, whose evaluation was completed by detailed case studies prepared by selected experts. Beyond a description of measures that have been implemented, the aim of that survey was to pinpoint the most interesting experiences and to draw some conclusions on their advantages and drawbacks. In particular, this study aims at identifying the policy measures, which have proven to be most effective, so as to make recommendations for countries that are newly embarked in energy demand management policies. The Kyoto Protocol objectives and, more recently, the constraints on energy supply have enhanced the priority given to energy efficiency policies. Almost all OECD countries are implementing new instruments adapted to their national circumstances. With its large country coverage and its updating, this report provides a comprehensive and valuable source of information. The tentative to associate indicators to policy measures represents an original approach to energy efficiency evaluation. Non OECD countries are implementing regulations to prevent a too fast increase of their electricity demand: beside a pre-eminent role of market instruments (voluntary agreements, labels, information dissemination), regulatory measures are still effective where the market fails to give the right signals (buildings, appliances). The experience accumulated these last years in a context of low energy prices should be of great interest to design new efficient policies. Transport remains the sector where the experience is the weakest. Air quality in cities is a strong argument for developing new technologies, even if local pollution prevention is sometimes in conflict with CO2 emissions (e.g. at the engine design level).

Energy Efficiency Policies and Indicators - WEC Report 2001
vi
Résumé Pour les congrès de Tokyo et Houston du Conseil Mondiale de l’Energie (CME), l’ADEME a été chargée de coordonner une étude intitulée « Politiques d’efficacité énergétique ». Cette étude avait pour but de décrire les tendances de l’efficacité énergétique au travers de multiples indicateurs et d’évaluer les politiques d’efficacité énergétique mises en oeuvre. Pour le congrès de Buenos Aires, cette étude a été actualisée et étendue à un échantillon plus large de pays. Pour ce faire, l’ADEME s’est associée à l’APERC, Asia and Pacific Energy Research Centre, et plus récemment avec l’OLADE, Organisation Latino Américaine de l’Energie. Cette étude a été menée durant les trois dernières années avec l’assistance technique d’ENERDATA s.a. et les contributions de plus de 50 pays. Le premier objectif de cette étude est de décrire et expliquer les tendances des performances d’efficacité énergétique dans ces pays. Dans ce but une sélection d’indicateurs sont analysés et comparés. La méthodologie utilisée est directement adaptée du projet européen sur les indicateurs d’efficacité énergétique, ODYSSEE (projet ADEME/EnR/SAVE). Le second objectif est de décrire et évaluer les politiques d’efficacité énergétique mises en oeuvre dans un échantillon de pays au niveau mondial. Dans ce but, une enquête a été effectuée dans 50 pays environ, représentatifs de toutes les régions du monde. L’enquête s’est concentrée sur 6 types de mesures, dont l’évaluation a été complétée par des études de cas détaillées préparées par des experts. Au-delà d’une description des mesures mises en oeuvre, le but de l’enquête est de repérer les expériences les plus intéressantes et d’en tirer des conclusions sur leurs avantages et limites. En particulier, l’étude vise à identifier les mesures qui se sont révélées les plus efficaces pour faire des recommandations pour les pays les moins avancés dans les politiques de maîtrise de leur consommation. Les objectifs du protocole de Kyoto et, plus récemment, les contraintes sur l’offre ont renforcé la priorité donnée aux politiques d’efficacité énergétique. Presque tous les pays de l’OCDE ont mis en œuvre de nouveaux instruments adaptés à leurs caractéristiques nationales. Ce rapport, avec sa couverture très large des pays et son niveau de mise à jour, fournit une source d’information exhaustive et de haute qualité. La tentative d’associer les indicateurs aux politiques constitue une approche originale d’évaluation de l’efficacité énergétique. Les pays non OCDE sont en train d’instaurer un certain nombre de réglementations pour prévenir une augmentation trop forte de leur demande d’électricité : malgré un rôle croissant des instruments dits de marché (accords volontaires, label, information, dissémination), les mesures réglementaires sont toujours utilisées quand les mécanismes de marché sont insuffisants pour donner le “bon” signal aux consommateurs (bâtiments, équipements électroménagers). L’expérience acquise ces dernières années dans un contexte de bas prix de l’énergie devrait être particulièrement intéressante pour concevoir de nouvelles politiques efficaces. Les transports demeurent le secteur où l’expérience est la moins importante. La qualité de l’air dans les villes est un argument fort pour développer de nouvelles technologies, même si la prévention locale de la pollution est parfois en conflit avec les objectifs d’émissions de CO2 (par exemple, au niveau de la conception des véhicules).

Energy Efficiency Policies and Indicators - WEC Report 2001
vii
Contents
MEMBER COMMITTEES OF THE WEC ........................................................................... i
ENERGY EFFICIENCY WORKGROUP.............................................................................ii
FOREWORD ...........................................................................................................................iii
REMERCIEMENTS............................................................................................................... iv
SUMMARY............................................................................................................................... v
RÉSUME ..................................................................................................................................vi
LIST OF TABLES................................................................................................................... ix
LIST OF BOXES..................................................................................................................... ix
LIST OF FIGURES.................................................................................................................. x
INTRODUCTION ........................................................................................................ 1
1. ENERGY EFFICIENCY PROGRESS ACHIEVED ........................................... 7
1.1. Introduction .............................................................................................................. 7
1.2. Energy Efficiency Indicators ................................................................................... 8
1.3. Overall Efficiency Performance .............................................................................. 9
1.4. Energy Efficiency in Industry ............................................................................... 24
1.5. Energy Efficiency in Transport............................................................................. 28
1.6. Energy Efficiency in the Household and Service Sectors ................................... 34
1.7. Conclusions ............................................................................................................. 40
2. EVALUATION OF ENERGY EFFICIENCY POLICIES AND MEASURES .... 41
2.1. Introduction ............................................................................................................ 41
2.2. Energy Pricing ........................................................................................................ 45
2.3. Institutions and Programmes ................................................................................ 55
2.4. Efficiency Standards for New Dwellings and Buildings ..................................... 57 2.4.1. Description of Measures and their Diffusion........................................................ 57 2.4.2. Impact of Measures and Programmes................................................................... 63 2.4.3. Conclusions and Recommendations..................................................................... 66
2.5. Labelling and Efficiency Standards for Household Electrical Appliances ....... 68

Energy Efficiency Policies and Indicators - WEC Report 2001
viii
2.5.1. Description of Measures and their Diffusion........................................................ 68 2.5.2. Impact of Measures and Programmes................................................................... 71 2.5.3. Conclusions and Recommendations..................................................................... 75
2.6. Fiscal Measures on Cars and Motor Fuels ........................................................... 77 2.6.1. Car Purchase Tax.................................................................................................. 77 2.6.2. Car Ownership Tax............................................................................................... 78 2.6.3. Taxation on Motor Fuels ...................................................................................... 79 2.6.4. Other Economic and Fiscal Instruments............................................................... 82 2.6.5. Conclusions and Recommendations..................................................................... 83
2.7. Energy Audits ......................................................................................................... 86 2.7.1. Description and Scope .......................................................................................... 86 2.7.2. Impact of Audit Programme and Efficiency Measures......................................... 89 2.7.3. Conclusions and Recommendations..................................................................... 91
2.8. Economic and Fiscal Incentives............................................................................. 92 2.8.1. Economic Incentives............................................................................................. 92 2.8.2. Fiscal Incentives ................................................................................................... 94 2.8.3. The Financing of Incentives ................................................................................. 94 2.8.4. Conclusions and Recommendations..................................................................... 95
2.9. Other Regulations................................................................................................... 97
3. CONCLUSIONS AND RECOMMENDATIONS.............................................. 98
3.1. Evaluation of energy efficiency policies and measures ....................................... 98 3.1.1. Institutional setting ............................................................................................... 98 3.1.2. Building codes .................................................................................................... 100 3.1.3. Labelling and standards for electrical appliances ............................................... 100 3.1.4. Car taxes and incentives ..................................................................................... 102 3.1.5. Energy audits ...................................................................................................... 104 3.1.6. Economic incentives........................................................................................... 104 3.1.7. Impact of liberalization on energy efficiency : a preliminary assessment from Latin American countries .............................................................................................. 106 3.1.8. Other measures ................................................................................................... 108
3.2. Energy efficiency policy monitoring ................................................................... 108
3.3. General conclusions and recommendations ....................................................... 110 3.3.1. The overall impact of a package of measures..................................................... 110 3.3.2. Regulatory instruments : carrot and stick is the most efficient policy................ 112 3.3.3. Market instruments and the necessary equilibrium between supply and demand measures ......................................................................................................................... 114 3.3.4. Energy efficiency policies in the new decade..................................................... 114
Annex 1: Case studies on energy efficiency policy measures...........................................120 Annex 2: Questionnaire synthesis ......................................................................................201

Energy Efficiency Policies and Indicators - WEC Report 2001
ix
List of Tables
Table 1.1. Variations in final energy intensity – the role of structural changes (%/year)......... 21 Table 2.1. Classification of countries/economies covered by the WEC survey. ...................... 43 Table 2.2. Classification of energy efficiency measures covered by the survey....................... 44 Table 2.3. Types of thermal building codes.............................................................................. 58 Table 2.4. Number of revisions of thermal building codes. ..................................................... 59 Table 2.5. Types of building codes by country or region. ........................................................ 60 Table 2.6. Development of energy saving standards for non-residential buildings in Japan. .. 62 Table 2.7. Labelling in OECD countries: implementation status. ............................................ 70 Table 2.8. Labelling in non-OECD countries: implementation status...................................... 70 Table 2.9. Mandatory efficiency standards in OECD countries: implementation status.......... 71 Table 2.10. Efficiency standards in non-OECD countries: implementation status. ................. 71 Table 2.11. Reference specific consumption of new cars sold in IEA countries...................... 78 Table 2.12. Long term elasticity of car fuel demand with fuel price. ....................................... 81 Table 2.13. Carbon emissions from passenger cars per unit of GDP. ...................................... 84 Table 2.14. Estimation of specific taxes paid over the lifetime of a car................................... 85
List of Boxes
Box 1.1. The world regions used in the WEC study. ................................................................. 7 Box 1.2. Energy intensities at purchasing power parities........................................................... 8 Box 1.3. Definitions and measurement of energy consumption................................................. 9 Box 1.4. Different variations in primary and final energy intensity: the case of France. ......... 15 Box 1.5. Average energy price for final consumers. ................................................................ 18 Box 1.6. Final energy intensity at constant GDP structure....................................................... 20 Box 1.7. Energy intensity of transport. ..................................................................................... 28 Box 1.8. Average unit consumption per equivalent car............................................................ 30 Box 2.1. Energy pricing in China. ............................................................................................ 45 Box 2.2. Gasoline versus diesel: the case of France................................................................. 82 Box 2.3. Evaluation of the cost effectiveness of measures....................................................... 88 Box 2.4. Evaluation of the cost effectiveness of the industrial energy audit subsidy programme
in France. .......................................................................................................................... 90 Box 2.5. Example of incentive schemes: the case of Japan...................................................... 93 Box 2.6. Financing energy efficiency: the case of Thailand..................................................... 93 Box 2.7. Fiscal incentives: the case of Japan............................................................................ 94 Box 2.8. Guarantee funds for energy efficiency investments: the case of France. ................... 95

Energy Efficiency Policies and Indicators - WEC Report 2001
x
List of Figures
Figure 1.1. Primary energy intensity by world region. ............................................................. 10 Figure 1.2. Variation of the total energy intensity of the world................................................ 11 Figure 1.3. Variation of primary energy intensity by world region. ......................................... 12 Figure 1.4. Primary energy intensity (with and without traditional fuels), 1980-99. ............... 13 Figure 1.5. Primary energy intensity and GDP per capita, 1998. ............................................. 14 Figure 1.6. Variation of primary and final energy intensity between 1980 and 1999. ............. 16 Figure 1.7. Primary energy intensity by sector, 1980 and 1999................................................ 17 Figure 1.8. Final energy intensity and average energy price, 1998........................................... 18 Figure 1.9. Electricity intensity and average electricity price, 1998......................................... 19 Figure 1.10. Final energy intensity variation – the role of structural changes, 1990-98. ......... 21 Figure 1.11. Energy prices and energy intensity at constant structure, 1990-98. ..................... 22 Figure 1.12a. Final energy intensities adjusted to EU economic structure, 1998..................... 23 Figure 1.13. Energy intensity of industry. ................................................................................ 24 Figure 1.14a. Energy efficiency change in manufacturing industry, 1980-90. ......................... 25 Figure 1.15. Intensity of manufacturing industry adjusted to EU structure, 1998.................... 26 Figure 1.16. Average unit consumption of energy for steel production. .................................. 27 Figure 1.17. Average unit consumption of energy for cement production. .............................. 28 Figure 1.18. Energy intensity of transport. ............................................................................... 29 Figure 1.19. Consumption of gasoline per equivalent-car........................................................ 30 Figure 1.20. Unit consumption of gasoline, and average price of gasoline, 1998.................... 31 Figure 1.21. Unit consumption of diesel by vehicles, and average price of diesel, 1998......... 32 Figure 1.22. Unit consumption of diesel by trucks................................................................... 33 Figure 1.23. Energy consumption for road transport per equivalent car, and average price of
fuels. ................................................................................................................................. 34 Figure 1.24a. Unit consumption of electricity by households (OECD).................................... 35 Figure 1.25. Unit household consumption for electrical appliances and lighting. ................... 36 Figure 1.26. Household consumption of electricity per unit of GDP, and electricity prices. ... 37 Figure 1.27a. Electricity intensity in the service sector (OECD).............................................. 38 Figure 1.28a. Electricity consumption per employee in the service sector (OECD). ............... 39 Figure 2.1a. Average gasoline prices: OECD........................................................................... 46 Figure 2.2. Share of tax in the price of gasoline. ...................................................................... 48 Figure 2.3a. Average diesel prices: OECD............................................................................... 48 Figure 2.4. Share of taxes in the price of diesel........................................................................ 50 Figure 2.5a. Average electricity price (households): OECD. ................................................... 51 Figure 2.6a. Average electricity price (industry): OECD. ........................................................ 52 Figure 2.7. Share of taxes in the price of electricity (households): OECD. ............................. 54 Figure 2.8. Pending energy saving regulations in Germany compared to existing building code
(WSVO 1995)................................................................................................................... 64 Figure 2.9. Theoretical impact of three building code revisions on the energy consumption of
the building stock.............................................................................................................. 66 Figure 2.10. Examples of endorsement and comparison labels................................................ 69 Figure 2.11. Transfer of energy labels (Thailand, Mexico, Iran).............................................. 72 Figure 2.12. Sales of refrigerators and freezers of label class A and B in the EU.................... 73 Figure 2.13. Specific consumption of new refrigerators and freezers in the EU...................... 74 Figure 2.14. Impact of efficiency standards on refrigerators and freezers in Japan. ................ 74 Figure 2.15. Impact of efficiency standards on refrigerators in the USA. ................................ 75 Figure 2.16. Average car purchase tax, excluding VAT (US$/vehicle). .................................. 77

Energy Efficiency Policies and Indicators: WEC Report 2001
1
Introduction For the Tokyo and Houston Conference of the World Energy Council (WEC), ADEME was in charge of the coordination of a study called “Energy Efficiency Policies”. This study aimed at describing energy efficiency trends through various indicators and evaluating efficiency policies. For the Buenos Aires Congress, this study was updated and enlarged to a wider range of countries. For that purpose, ADEME was associated to APERC, Asia and Pacific Energy Research Centre, and more recently to OLADE, Latin American Energy Organisation. This study was carried out during the last three years with the technical assistance of ENERDATA s.a. and active contributions of more than 50 countries. The first objective of that study is to describe and explain the trends in energy efficiency performance in these countries. For that purpose a selection of indicators is analysed and compared. The methodology used is directly adapted from the European project on energy efficiency indicators, ODYSSEE (Ademe/EnR/SAVE Project). The second objective is to describe and evaluate energy efficiency policies carried out in a sample of countries all over the world. For that purpose, a survey was carried out in about 50 countries, representative of all world regions. The survey focused on six policy measures, whose evaluation was completed by detailed and case studies prepared by selected experts. Beyond a description of measures that have been implemented, the aim of that survey was to pinpoint the most interesting experiences and to draw some conclusions on their advantages and drawbacks. In particular, this study aims at identifying the policy measures, which have proven to be most effective, so as to make recommendations for countries that are newly embarked in energy demand management policies. This report presents the results and conclusions of that study. It is made of two main parts: the review of the energy efficiency progress achieved (chapter 1) and the evaluation of policies and measures (chapter 2). In a last chapter, some recommendations are made, especially for countries that want to learn from the experience of the most advanced countries in terms of energy efficiency policies. In introduction, it is useful to recall the overall framework of energy efficiency policies, to clarify the definition used all along this report and, finally, to explain why evaluation of energy efficiency is important. Definition and Scope of Energy Efficiency The focus of this report is on the evaluation of energy efficiency policy and trends. What means, more precisely, « energy efficiency » ? Insulating a house makes it obviously more energy efficient from an engineering point of view: less energy is consumed for the same comfort. But this technical improvement at the micro level may be not visible at the macro-level - the whole stock of dwelling-, if, at the same time, more houses are built and/or if the comfort is improved in dwellings.

Energy Efficiency Policies and Indicators: WEC Report 2001
2
The same can be said for industry: each factory individually can decrease its energy consumption per unit of output with more energy efficient techniques, but this may be not visible at the level of the overall industrial sector, because of an increase in the production or because of a larger share of energy intensive industries in the production. Energy efficiency is not just a technical matter, it is also a matter of efficient services: making a phone call instead of a physical visit, recycling bottles, reducing heat at night, using wood instead of concrete for houses, all result in a decrease in energy consumption for identical or very similar services. Again, such improvements may exist at the micro-level but may not be directly visible at the macro-level: assessing energy efficiency also means measuring the overall impacts of all the improvements at the micro level on the evolution of the energy consumption. In some cases, because of financial constraints due to high energy prices, consumers may decrease their energy consumption through a reduction in welfare or production level. Such reductions do not necessarily result in increased overall energy efficiency of the economy, and are highly reversible. They should not be associated to energy efficiency. Of course, assessing energy efficiency from a policy view point does not mean reviewing each particular dwelling or factory; but certainly it means figuring out, or measuring, how far all these improvements at the micro level did contribute to the actual evolution of the energy consumption in the various sectors, and for the whole country. Energy efficiency has, thus, a broader sense that what is usually understood with an implicit reference to technological efficiency only: it encompasses all changes that result in decreasing the amount of energy used to produce one unit of economic activity (e.g. the energy used per unit of GDP or value added) or to meet the energy requirements for a given level of comfort. Energy efficiency is associated to economic efficiency and includes technological, behavioural and economic changes. Energy efficiency improvements refer to a reduction in the energy used for a given energy service (heating, lighting...) or level of activity. This reduction in the energy consumption is not necessarily associated to technical changes, since it can also result from a better organisation and management (e.g. domotics) or improved economic efficiency in the sector (e.g. overall gains of productivity). Energy Efficiency Policies in Market Economies In market economies, energy efficiency is first of all a matter of individual behaviour and rationale of energy consumers. Avoiding unnecessary consumption of energy, or choosing the most appropriate equipment to reduce the cost of the energy contribute to decrease individual energy consumption without decreasing individual welfare; it also contributes to increase the overall energy efficiency of the national economy. Avoiding unnecessary consumption is certainly a matter of individual behaviour, but it is also, often, a matter of appropriate equipment : thermal regulation of room, or automatic switch off of lights in unoccupied hotel rooms are good examples of how equipment can reduce the influence of individual behaviour.

Energy Efficiency Policies and Indicators: WEC Report 2001
3
Making the « good » investment decision, for domestic appliances or industrial devices, from the energy efficiency view point, certainly relies on a sound economic rationale. Good price signals are necessary, but they are not enough. Indeed certain conditions are required to develop and structure the market for efficient equipment and devices: - the availability of efficient appliances and production devices ; - a good information of consumers about these equipment and devices ; - and, finally, the availability of technical, commercial and financial services when necessary. Any cost related decision concerning energy efficiency, at the individual level, is, more or less, based on a trade-off between the immediate cost and the future decrease in energy expenses expected from increased efficiency: the higher the energy price, observed or expected, the more attractive are the energy efficient solutions. Financial constraints, desire of immediate profit or attitude against uncertainty, often lead the final consumers to overemphasise the immediate cost of equipment and devices in their economic appraisal, which usually do not benefit to the selection of efficient equipment or devices. Public measures are therefore necessary in market economies to reinforce the role of prices, first of all to create the appropriate market conditions for efficient equipment, secondly to drive the consumer choice towards the most cost effective solutions. They also aim at alleviating the recognised failures in market mechanisms. Three major sources of failures in market mechanisms are usually pinpointed to justify the implementation of policy measures: - the information is missing or partial, and cannot be improved with acceptable costs ; - decision-makers for energy efficiency investments (in buildings, appliances, equipment...) are not always the final users that have to pay the heating or cooling bill : the overall cost of energy service is not revealed by the market ; - financial constraints of individual consumers are often much more severe than what national discount rate or long term interest rate do reveal, resulting in a preference to short term profitability : implicit discount rates in industry are over 20% compared to less than 10% for public discount rates, and 4-6% for long term interest rates. Energy efficiency policy is therefore considered here with a broad sense. It includes all public interventions (« policy measures ») aiming at improving the energy efficiency of a country, through adequate pricing, institutional setting, regulations and economic or fiscal incentives. Energy efficiency programmes refer to a combined set of policy measures.
Energy Efficiency Policies and Indicators: WEC Report 2001
4
Energy Efficiency and Energy Pricing In market economies, where most energy prices to final consumers are deregulated, prices normally reflect accurately supply costs and thus participate to the macro-economic optimality. But, for several reasons, prices often reflect only part of the overall costs, only the part that is immediately supported by suppliers: no or partial internalisation of environmental externalities, no or partial integration of long run marginal development costs, cross subsidies among consumers etc... As a result, decision made by final consumers are often far away from what the global economic optimality would suggest, creating a gap between the actual achievements in energy efficiency and what could be achieved in case of an accurate price system accounting for all costs involved. Taxation is an usual mean used by governments to reduce or suppress such prices distortions at the consumer level. In that sense, taxation is always complementary to energy efficiency policies and measures. It is hardly just a component of these policies and measures because of its much larger socio-economic aspects, but it certainly determines the effectiveness of such policies measures. Energy Efficiency and Non Price Measures The main role of non price measures is then to create the necessary conditions to speed up the development and the structuration of the market of efficient equipment: - information and communication towards final consumers, - risk sharing with producers and distributors, - R&D and dissemination in the field of energy efficiency, - implementation of specific financing mechanisms. Information and communication have two main targets: - increase the awareness of final consumers about the individual and national benefits of energy efficiency ; - open the range of possibilities for the technical decisions to be made by the final consumers and reveal the overall costs of all possibilities. Sharing the economic risk with the producers and distributors of efficient equipment and devices can take several forms: loan, subsidy, tax credit etc. The main target is to overcome the commercial difficulty raised by the initial extra cost of efficient equipment and devices as compared to less efficient ones. Supporting R&D and dissemination costs by public funds, and letting the valorisation through advanced energy efficient techniques, equipment and devices to private interests, aims at speeding up the industrialisation of efficient equipment and devices and at decreasing their costs on the market.

Energy Efficiency Policies and Indicators: WEC Report 2001
5
Implementing specific financing mechanisms has two targets: - for consumers, to reduce the market unbalance (due to financial constraints) between cost effective solutions with high investment-low operating costs (energy efficient), on the one side, low investment-high operating costs (less efficient) on the other side. - for suppliers, to help implementing production or distribution activities in the field of energy efficient products and services. Energy Efficiency Policies Evaluation Energy efficiency policies and measures are not free. Whatever is the organisation and implementation scheme of the policy, whatever are the measures taken; there is a cost for the taxpayer. As a general statement, energy efficiency policies and measures are economically sound if the macro-economic benefit of increased energy efficiency due to these policies and measures overcome the overall cost for the taxpayers. And the bigger is the difference between the benefit and the cost, the more attractive and effective are the policies and measures. Evaluating energy efficiency policies and measures is therefore a necessity for two basic reasons: - rationale management of public budget, - cost effectiveness of energy efficiency goals achievement. Assuming that micro-decision related to energy efficiency are usually cost-effective at the consumer level, the question of energy efficiency policy evaluation can be raised at two levels: - from the taxpayer viewpoint, what is the public cost involved in the policies and measures ; - from the macro-economic viewpoint, what is the benefit resulting from the actual progress in energy efficiency achieved through the policies and measures. Several difficulties rapidly emerge when one attempts to assess energy efficiency progress. First of all, from a conceptual viewpoint, energy efficiency is at the same time a pure economic concept (similar to that of productivity) and a political concept (the result of energy efficiency policy); the boundary between these two concepts is never clear. Secondly, from a methodological viewpoint, it is difficult to separate out the various causes behind actual energy efficiency improvement observed: more energy efficient socio-economic structures, price mechanism, results of sectoral policy measures; etc. A good illustration is the example of cars. How to measure the energy efficiency of cars: in terms of technology, of drivers’ behaviour, of pattern of use...?

Energy Efficiency Policies and Indicators: WEC Report 2001
6
Energy efficiency indicators designed and calculated in this project aim at giving solutions to these difficulties, in three ways:
• Overall macro-economic indicators tend to reconcile the macro-economic and political concepts of energy efficiency, measuring separately the main components of the overall energy intensity of the GDP: those linked to the structure of the economy and those linked to sectoral energy efficiencies.
• Sectoral indicators aim first at reconciling the economic appraisal of energy efficiency
in the sectors with the technical appraisal of efficiency improvement of dwellings, vehicles, industrial process etc., second at relating these technical appraisals with the evaluation of actual energy savings, from which economic benefits can be estimated.
• Comparative indicators across countries, based on homogeneous data, aim at allowing
comparison across countries in order to mark out, in energy efficiency achievements, what could be due to differences in policies and measures and to taxation and pricing policies.

Energy Efficiency Policies and Indicators: WEC Report 2001
7
1. Energy Efficiency Progress Achieved 1.1. Introduction This chapter reviews recent energy efficiency trends by world region and in selected countries on the basis of a set of homogeneous indicators. For European Union (EU) countries, the indicators are derived from the ODYSSEE database, which has been developed over some years at the EU level (ADEME/SAVE/EnR project). For the APEC region,1 the data were prepared by the Asia and Pacific Energy Research Centre (APERC). For Latin America, OLADE2 supplied data for its member countries in the same format from its information system SIEE. For other countries and for world regions, data were taken from the world energy database ENERDATA. This database relies on harmonised data from international organisations (International Energy Agency (IEA), EUROSTAT, World Bank), as well as national organisations (electricity utilities, energy ministries). It provides a consistent coverage of the world, split by main regions, and is kept well up-to-date so as to take into account the most recent trends (Box 1.1).
Box 1.1. The world regions used in the WEC study. The world is divided into seven main regions. Europe and Asia, because of their size and heterogeneity, are split into sub-regions and main countries: three sub-regions for Europe; two countries and three sub-regions for Asia.
Europe: - Western Europe - Former Soviet Union (FSU) - Central and Eastern European countries (CEECs)
North America: USA, Canada
Latin America: Mexico, Central America, Caribbean, South America
Asia: - China - Japan - Newly industrialised economies (NICs)3 - ASEAN4 - South Asia (India, Pakistan)
Africa
Middle East
Oceania: Australia, New Zealand, small Pacific islands
1. Asia Pacific Economic Cooperation, comprises 21 members economies on the Pacific Rim from
Asia, America and Oceania. 2. Latin American Energy Organisation, gathers 26 countries of Latin America and the Caribbean. 3. Republic of Korea; Singapore; Taiwan, China; Hong Kong, China. 4. Association of South East Asian Nations (without Singapore, here included with NICs).

Energy Efficiency Policies and Indicators: WEC Report 2001
8
This chapter will start with a presentation of the methodology used to characterise energy efficiency trends; in other words, what indicators are proposed at the level of the whole economy and at the level of economic sectors. Then a comparison of energy efficiency trends across the countries under consideration will be presented; first the overall energy efficiency trends, then the trends by sector (industry, transport, households, and services). Particular attention will be given to the relationships between, on the one hand, energy efficiency achievements (as assessed from the indicators) and, on the other hand, economic development (in particular the role of structural changes in the economy) and energy efficiency policies. Although historical trends will be recalled, the focus is on the period following the counter oil shock, i.e. 1986-99. 1.2. Energy Efficiency Indicators The energy efficiency indicators considered here are designed to monitor changes in energy efficiency and to allow comparisons between countries of their relative energy efficiency situations. Two types of ratios are considered for the description of energy efficiency: economic ratios, and techno-economic ratios. Economic ratios are used each time energy efficiency is measured at a high level of aggregation, i.e. at the level of the whole economy or of a sector. Indeed, at such a level it is not possible to characterise the activity with technical or physical indicators. These economic ratios, referred to as energy intensities, are defined as ratios between energy consumption, measured in energy units (tonnes of oil equivalent (toe)), and indicators of economic activity, measured in monetary units at constant prices (gross domestic product (GDP), value added, etc.). To make these energy intensities more comparable, unless otherwise specified they are all converted to purchasing power parities at 1995 prices and parities (see Box 1.2).
Box 1.2. Energy intensities at purchasing power parities. GDP and value added data for all countries need to be converted to the same currency (e.g. US dollars) to enable comparison. However, conversion using normal exchange rates does not give a true impression of the actual differences in economic activity, because of differences in general price levels. In order to reflect the relative purchasing power of different currencies, a conversion based on purchasing power parity (PPP) is used. A given amount of US dollars when converted into any currency at the PPP rate buys the same basket of goods and services. Using PPP rates instead of exchange rates to express GDP narrows the difference between OECD countries and less developed countries, and even more between OECD countries and Central and Eastern European countries. Furthermore, the use of PPP increases the value of GDP in many countries, and thus decreases energy intensities. As energy intensities are measured at constant prices, the trends will be the same whether exchange rates or PPP rates are used. For a better comparison of energy efficiency performance, some indicators are adjusted to a reference economic structure. The PPP rates used are those calculated by the World Bank.

Energy Efficiency Policies and Indicators: WEC Report 2001
9
Techno-economic ratios are calculated at a disaggregated level (by sub-sector or end-uses) by relating energy consumption to an indicator of activity measured in physical terms (tonnes of steel, number of passenger-kilometres, etc.) or to a consumption unit (e.g. per vehicle, dwelling, etc.). These techno-economic ratios are called unit consumption. For a better comparison of energy efficiency performance between countries, some indicators are adjusted to a reference structure. However, even if the comparison is improved, not all structural differences can be taken into account. The list of indicators calculated in this study is given in Appendix 1. These indicators are available by country on the WEC web site (www.worldenergy.org). In order to allow a meaningful comparison of energy efficiency between countries, these indicators need to be based on common definitions; in particular the definition of energy consumption needs to be the same for all countries. The definition used in this report is given in Box 1.3.
Box 1.3. Definitions and measurement of energy consumption. The definitions adopted in this report are as follows: Primary electricity (i.e. nuclear, hydro and geothermal) is converted to tonnes of oil equivalent (toe) according to IEA conventions: 0.26 toe/MWh (10.9 GJ) for nuclear, 0.086 toe/MWh (3.6 GJ) for hydro, and 0.86 toe/MWh (36 GJ) for geothermal. Final consumption of electricity is converted to tonnes of oil equivalent according to its calorific value, i.e. 0.086 toe/MWh (3.6 GJ). This differs from conventions used in some countries (e.g. France and Brazil). Non-conventional fuels are excluded unless otherwise specified. This is for two reasons: firstly, the degree of accuracy with which the quantities consumed are measured is very unequal between countries; secondly, when relating energy consumption to macro-economic variables (such as GDP) it may be questionable to include fuels that are partly non-monetarised. This significantly affects the consumption levels in countries such as Brazil or Thailand compared to official statistics, which usually include these traditional fuels. For Brazil, however, alcohol used as a motor fuel is included in the consumption figures. Non-energy uses (or feedstocks) are excluded from final energy consumption, since the objective is to monitor efficiency of energy use, which by definition does not include the use of energy products as raw materials. 1.3. Overall Efficiency Performance An overall impression of energy efficiency performance is given by the primary energy intensity (or total energy intensity), which relates the total consumption of the region or country to its GDP. Primary energy intensity measures how much energy each country or region requires to generate one unit of GDP. It is therefore more an indicator of “energy productivity” than a true indicator of efficiency from a technical viewpoint. Its value reflects the nature of the economic activity of the country (the “economic structure”) and the structure of the energy mix, as well as the technical energy efficiency.
Energy Efficiency Policies and Indicators: WEC Report 2001
10
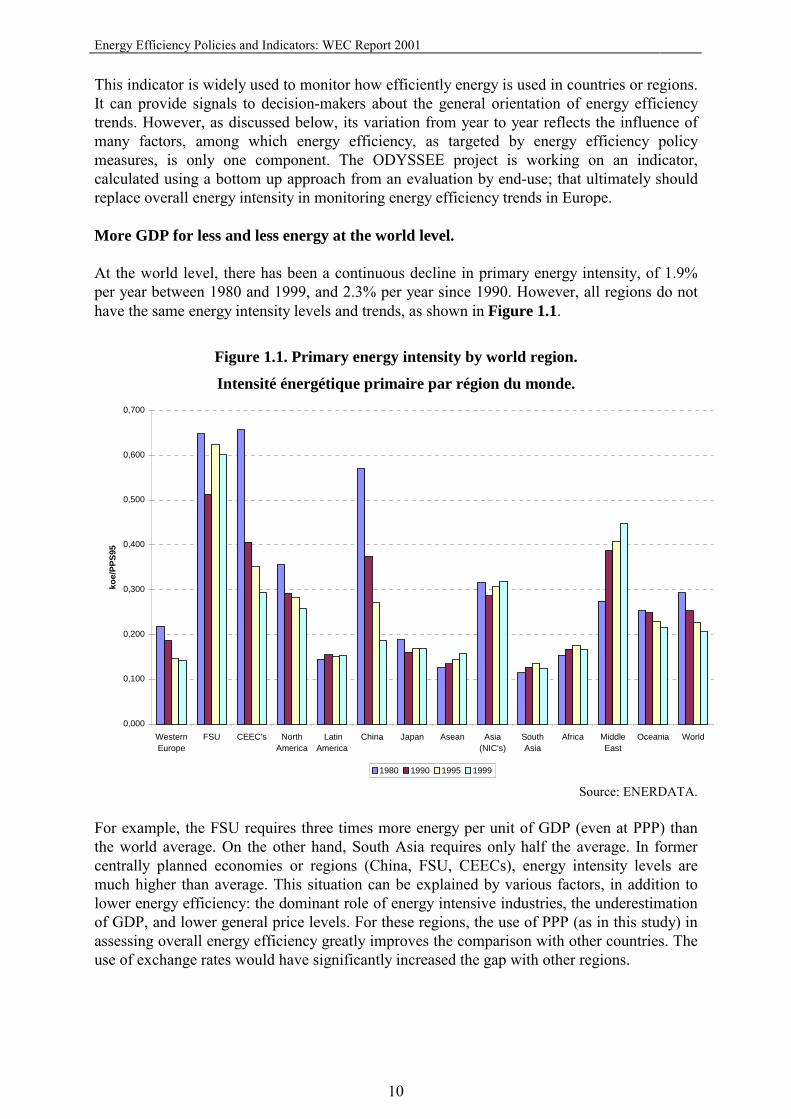
This indicator is widely used to monitor how efficiently energy is used in countries or regions. It can provide signals to decision-makers about the general orientation of energy efficiency trends. However, as discussed below, its variation from year to year reflects the influence of many factors, among which energy efficiency, as targeted by energy efficiency policy measures, is only one component. The ODYSSEE project is working on an indicator, calculated using a bottom up approach from an evaluation by end-use; that ultimately should replace overall energy intensity in monitoring energy efficiency trends in Europe. More GDP for less and less energy at the world level. At the world level, there has been a continuous decline in primary energy intensity, of 1.9% per year between 1980 and 1999, and 2.3% per year since 1990. However, all regions do not have the same energy intensity levels and trends, as shown in Figure 1.1.
Figure 1.1. Primary energy intensity by world region.
Intensité énergétique primaire par région du monde.
Source: ENERDATA. For example, the FSU requires three times more energy per unit of GDP (even at PPP) than the world average. On the other hand, South Asia requires only half the average. In former centrally planned economies or regions (China, FSU, CEECs), energy intensity levels are much higher than average. This situation can be explained by various factors, in addition to lower energy efficiency: the dominant role of energy intensive industries, the underestimation of GDP, and lower general price levels. For these regions, the use of PPP (as in this study) in assessing overall energy efficiency greatly improves the comparison with other countries. The use of exchange rates would have significantly increased the gap with other regions.
0,000
0,100
0,200
0,300
0,400
0,500
0,600
0,700
WesternEurope
FSU CEEC's NorthAmerica
LatinAmerica
China Japan Asean Asia(NIC's)
SouthAsia
Africa MiddleEast
Oceania World
koe/
PPS9
5
1980 1990 1995 1999

Energy Efficiency Policies and Indicators: WEC Report 2001
11
Most of the improved energy performance of the world economy comes from more rapid growth in countries with low energy intensity. Because of the large differences in energy intensities among world regions, any change in the share of each region in world economic activity (measured by GDP) automatically affects the average. The FSU and CEECs, with the highest energy intensity level, have experienced negative economic growth, whereas the highest growth took place in South East Asia, a region with much lower energy intensities (Figure 1.1). To check the influence of this structural factor, a fictive energy intensity of the world can be calculated assuming a constant share of each region in world GDP (e.g. 1990 shares). The decrease of world energy intensity with a constant GDP structure is less impressive: 1.5% per year between 1980 and 1999, and 1% per year since 1990. Comparison of the variation of the actual and fictive world energy intensity between 1990 and 1999 shows that more than half (55%) of the decrease observed is actually due to more rapid growth in countries with low energy intensities (Figure 1.2). If the regional shares of GDP had remained constant, the decrease in total energy intensity would have been only 1% per year. The rate of decrease has even reduced since 1990; the fall was 1.5% per year between 1980 and 1990.
Figure 1.2. Variation of the total energy intensity of the world.
Variation de l'intensité énergétique totale du monde.
Source: ENERDATA. In China, Central and Eastern Europe, North America, Western Europe and Oceania, the energy used per unit of GDP regularly decreases. This decrease in primary energy intensity results from the combined effect of large energy price increases following the second oil shock, and of the implementation of energy conservation programmes and more recently CO2 abatement policies in most countries.
-2 ,5
-2 ,0
-1 ,5
-1 ,0
-0 ,5
0 ,0
1 98 0 -9 9 1 9 9 0 -9 9
%/ y
ear
a c tu a l a t 1 9 9 0 G D P m ix ch a n g e in G D P m ix b y re g io n
Energy Efficiency Policies and Indicators: WEC Report 2001
12
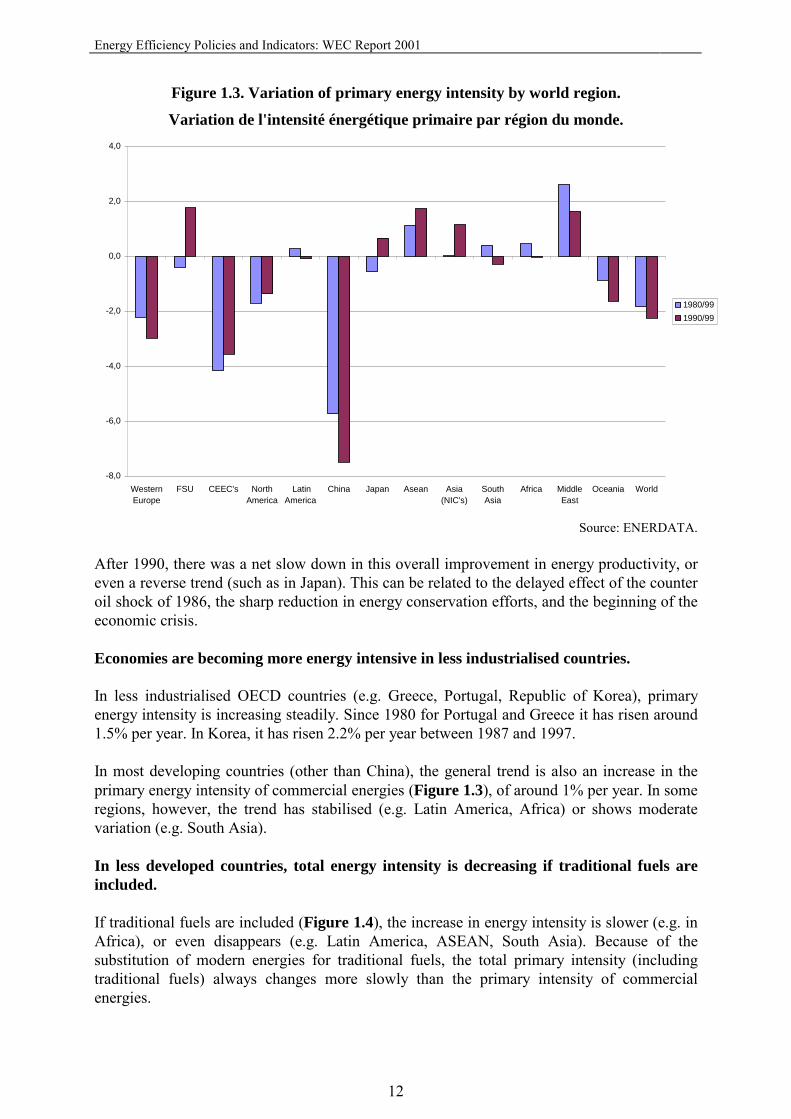
Figure 1.3. Variation of primary energy intensity by world region.
Variation de l'intensité énergétique primaire par région du monde.
Source: ENERDATA. After 1990, there was a net slow down in this overall improvement in energy productivity, or even a reverse trend (such as in Japan). This can be related to the delayed effect of the counter oil shock of 1986, the sharp reduction in energy conservation efforts, and the beginning of the economic crisis. Economies are becoming more energy intensive in less industrialised countries. In less industrialised OECD countries (e.g. Greece, Portugal, Republic of Korea), primary energy intensity is increasing steadily. Since 1980 for Portugal and Greece it has risen around 1.5% per year. In Korea, it has risen 2.2% per year between 1987 and 1997. In most developing countries (other than China), the general trend is also an increase in the primary energy intensity of commercial energies (Figure 1.3), of around 1% per year. In some regions, however, the trend has stabilised (e.g. Latin America, Africa) or shows moderate variation (e.g. South Asia). In less developed countries, total energy intensity is decreasing if traditional fuels are included. If traditional fuels are included (Figure 1.4), the increase in energy intensity is slower (e.g. in Africa), or even disappears (e.g. Latin America, ASEAN, South Asia). Because of the substitution of modern energies for traditional fuels, the total primary intensity (including traditional fuels) always changes more slowly than the primary intensity of commercial energies.
-8,0
-6,0
-4,0
-2,0
0,0
2,0
4,0
WesternEurope
FSU CEEC's NorthAmerica
LatinAmerica
China Japan Asean Asia(NIC's)
SouthAsia
Africa MiddleEast
Oceania World
1980/991990/99

Energy Efficiency Policies and Indicators: WEC Report 2001
13
Figure 1.4. Primary energy intensity (with and without traditional fuels), 1980-99.
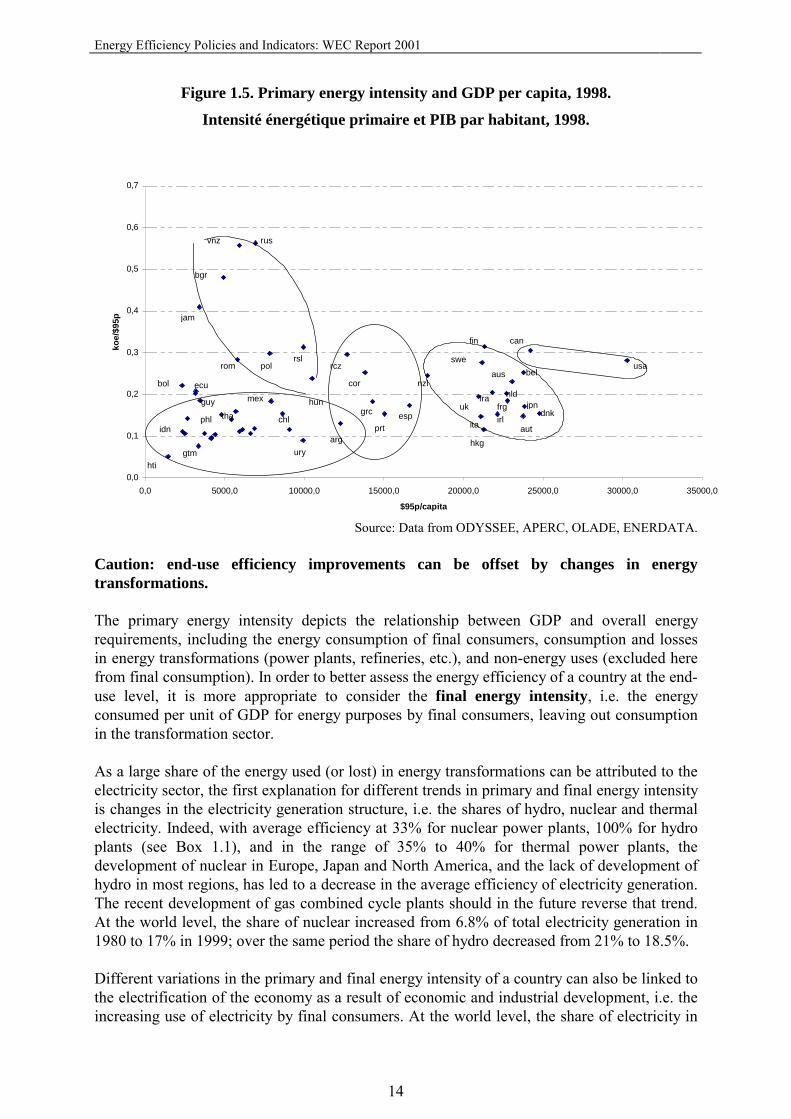
Source: ENERDATA. Economic development results in less energy use per unit of GDP. Countries can be ranked according to their average GDP per capita and level of primary energy intensity, both measured at PPP. As shown in Figure 1.5, five groups of countries can be identified: North America (USA, Canada); most EU countries and Japan; less developed OECD countries (e.g. Republic of Korea, Portugal and Greece); most developing countries (apart from some oil exporting countries); and European countries in transition (e.g. Russia, Bulgaria). This figure shows that, in general, primary energy intensity tends to decrease with economic development (measured by per capita GDP). However, different situations can be observed at any given level of development. Indeed, for similar levels of GDP per capita, great disparities exist in primary energy intensity. For example, between Finland and Italy in the EU, or between Portugal and Korea. The greatest disparities are between CEECs and developing countries with similar level of GDP per capita; CEECs require between two and five times more energy to generate one unit of GDP than developing countries. This shows the large potential for energy efficiency improvements in CEECs, both from a technical and economic viewpoint. Explanations for some of these differences will be discussed later in this report.
-7,00
-6,00
-5,00
-4,00
-3,00
-2,00
-1,00
0,00
1,00
2,00
3,00
4,00
WesternEurope
FSU CEEC's NorthAmerica
LatinAmerica
China Japan Asean Asia(NIC's)
SouthAsia
Africa MiddleEast
Oceania World
totalconventional
Energy Efficiency Policies and Indicators: WEC Report 2001
14
Figure 1.5. Primary energy intensity and GDP per capita, 1998.
Intensité énergétique primaire et PIB par habitant, 1998.
Source: Data from ODYSSEE, APERC, OLADE, ENERDATA. Caution: end-use efficiency improvements can be offset by changes in energy transformations. The primary energy intensity depicts the relationship between GDP and overall energy requirements, including the energy consumption of final consumers, consumption and losses in energy transformations (power plants, refineries, etc.), and non-energy uses (excluded here from final consumption). In order to better assess the energy efficiency of a country at the end-use level, it is more appropriate to consider the final energy intensity, i.e. the energy consumed per unit of GDP for energy purposes by final consumers, leaving out consumption in the transformation sector. As a large share of the energy used (or lost) in energy transformations can be attributed to the electricity sector, the first explanation for different trends in primary and final energy intensity is changes in the electricity generation structure, i.e. the shares of hydro, nuclear and thermal electricity. Indeed, with average efficiency at 33% for nuclear power plants, 100% for hydro plants (see Box 1.1), and in the range of 35% to 40% for thermal power plants, the development of nuclear in Europe, Japan and North America, and the lack of development of hydro in most regions, has led to a decrease in the average efficiency of electricity generation. The recent development of gas combined cycle plants should in the future reverse that trend. At the world level, the share of nuclear increased from 6.8% of total electricity generation in 1980 to 17% in 1999; over the same period the share of hydro decreased from 21% to 18.5%. Different variations in the primary and final energy intensity of a country can also be linked to the electrification of the economy as a result of economic and industrial development, i.e. the increasing use of electricity by final consumers. At the world level, the share of electricity in
0,0
0,1
0,2
0,3
0,4
0,5
0,6
0,7
0,0 5000,0 10000,0 15000,0 20000,0 25000,0 30000,0 35000,0
$95p/capita
koe/
$95p
rusvnz
bol
gtm
phlidn
mex
chl
uryarg
cor nzl
grc
hkg
usa
dnk
nldfrg
ita
uktha
can
fra
jam
prtesp
swe
fin
aus belrom
bgr
hun
rslpol rcz
hti
jpn
autirl
guy
ecu

Energy Efficiency Policies and Indicators: WEC Report 2001
15
final consumption has increased from 12.5% in 1980 to 18% at present. Except in the FSU, the total increase over this period is between 5% and 8%. Indeed, any increase in the market share of electricity implies increased losses in the electricity sector, unless the electricity is produced from hydro, which it usually is not. As a result of these two influences, primary energy intensity decreases more slowly or increases more rapidly than final energy intensity in all regions except Latin America (Figure 1.6). In some regions, a relative stabilisation of primary intensity in fact hides improvements in end-use energy efficiency (e.g. NICs). In other words, where there are energy efficiency improvements, they are larger at the final consumption stage than at the level of the whole economy. On average, increased losses in energy transformations led to an increase in primary energy intensity of 0.5% per year. This factor partially offset energy efficiency improvements of final consumers in those regions with declining trends (FSU, CEECs and North America). In regions with an increasing energy intensity, such as ASEAN, South Asia and the Middle East, the annual increase in primary intensity is greater by this amount (Figure 1.6). The gap between final and primary energy intensity variations is all the more important when significant changes take place in the electricity generation mix. In particular, in countries that have developed large-scale nuclear electricity generation (mostly France, USA and Japan), the decrease in final energy intensity was faster than that of their primary intensity. In these countries, the rate of reduction of primary energy intensity does not reflect appropriately progress in energy efficiency at the end-use level, as part of the energy efficiency progress is offset by increasing transformation losses due to nuclear electricity generation (see Box 1.4).
Box 1.4. Different variations in primary and final energy intensity: the case of France.
Between 1980 and 1990 France experienced, one of the lowest decreases in primary energy intensity among Western European countries (0.6% per year), and one of the highest decreases in final energy intensity (2.1% per year). This means that 70% of the overall energy efficiency improvement achieved in France between 1980 and 1990 by final consumers was offset by the increase in transformation losses. This phenomenon was reinforced by the rapid penetration of electricity for space heating and industrial thermal uses.

Energy Efficiency Policies and Indicators: WEC Report 2001
16
Figure 1.6. Variation of primary and final energy intensity between 1980 and 1999.
Variation des intensités final et primaire entre 1980 et 1999.
Source: ENERDATA. Most of the decrease in primary energy intensity can be attributed to the industry sector. Figure 1.7 shows primary intensity by sector (industry, transport, households and services, and transformation) for the two years 1980 and 1999, so as to show how each sector contributed to the variation in primary intensity. The sum of the three first sectors corresponds to final energy intensity; the energy sector represents the difference between the primary and the final intensity (i.e. it is mostly energy used in energy transformations, as well as non-energy uses). The reduction in energy intensity in the industry sector is clearly visible for all OECD countries and most non-OECD countries. The increasing role of transport is another striking trend which can be seen in these variations. In other words, the increase in the intensity of that sector has slowed down the decrease in total energy intensities, and in the late 1980s was responsible for the increase observed in primary intensity. As discussed above, the share of the energy sector in primary energy intensity is increasing everywhere.
-7,0
-6,0
-5,0
-4,0
-3,0
-2,0
-1,0
0,0
1,0
2,0
3,0
WesternEurope
FSU CEEC's NorthAmerica
LatinAmerica
China Japan Asean Asia(NIC's)
SouthAsia
Africa MiddleEast
Oceania World
PrimaryFinalDifference

Energy Efficiency Policies and Indicators: WEC Report 2001
17
Figure 1.7. Primary energy intensity by sector, 1980 and 1999.
Intensité primaire par secteur, 1980 et 1999.
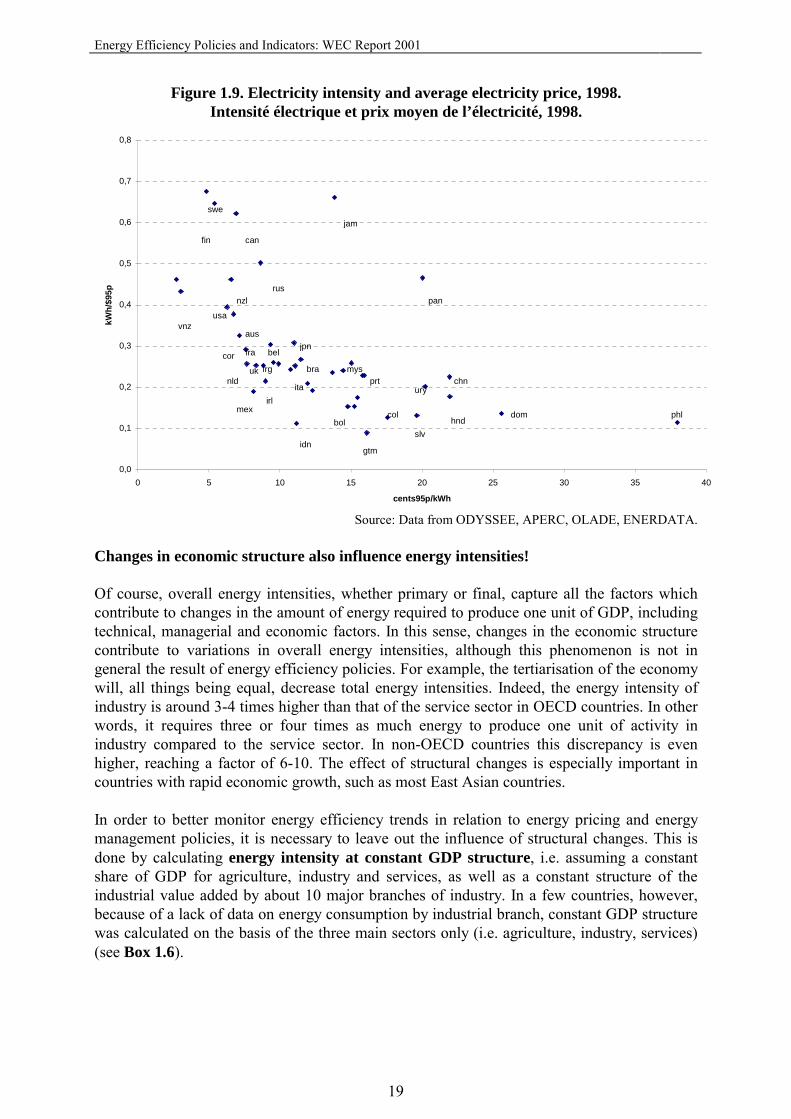
Source: ENERDATA. Countries with high energy prices have the lowest energy intensity – but prices alone do not explain the intensity levels achieved. To see the influence of energy prices on the amount of energy used by final consumers, one can examine the relation between final energy intensity and average prices to final consumers. Energy intensity tends to be lower in countries with the highest energy prices, with the exception of CEECs, which are undergoing a process of price adjustment. However, prices alone cannot explain the intensity level. For a given price level significant differences exist in energy intensities. For example, in the group of countries with lower prices (Canada, Korea, Japan), energy intensities vary by a factor of 2.5; in countries with higher prices, intensities vary by a factor of two (Figure 1.8). For electricity, the overall relationship between electricity intensity and the average electricity price is even more striking, as are the discrepancies between the intensities of countries with similar price level (Figure 1.9). For countries with an average price between 5 and 10 US cents/kWh, the electricity intensity varies by a factor of three. However, as the average price increases there is a decrease in the intensity level, down to a limit of around 0.1-0.2 kWh per US dollar of GDP (at 1995 prices and purchasing parities). Differences in economic structures and in climate, as well as in energy efficiency policy, can contribute to the explanation of these differences, as discussed below.
0,0000
0,1000
0,2000
0,3000
0,4000
0,5000
0,6000
0,7000
W Europe FSU
CEEC's
North A
merica
Latin
America
China
Japa
nAse
an
Asia N
IC
South
Asia
industrytransporthouseholdstransformation

Energy Efficiency Policies and Indicators: WEC Report 2001
18
Box 1.5. Average energy price for final consumers. An average price to final consumers is calculated for each sector (industry, transport, households and services) as a weighted average of the price of each type of energy (the weight is the share of each type of energy in the sector’s consumption). For electricity and gas, the price corresponds to the average price paid by the consumer. The average energy price in a country is a weighted average over each consuming sector.
Figure 1.8. Final energy intensity and average energy price, 1998. Intensité énergétique finale et prix moyen de l’énergie, 1998.
Source: Data from ODYSSEE, APERC, OLADE, ENERDATA.
0,000
0,050
0,100
0,150
0,200
0,250
0 100 200 300 400 500 600
$95p/toe
koe/
$95p
arg
usa
ukfra
aut
can
cor
aus
dnk
tha
jpn
col
brachl ita
Energy Efficiency Policies and Indicators: WEC Report 2001
19
Figure 1.9. Electricity intensity and average electricity price, 1998. Intensité électrique et prix moyen de l’électricité, 1998.
Source: Data from ODYSSEE, APERC, OLADE, ENERDATA. Changes in economic structure also influence energy intensities! Of course, overall energy intensities, whether primary or final, capture all the factors which contribute to changes in the amount of energy required to produce one unit of GDP, including technical, managerial and economic factors. In this sense, changes in the economic structure contribute to variations in overall energy intensities, although this phenomenon is not in general the result of energy efficiency policies. For example, the tertiarisation of the economy will, all things being equal, decrease total energy intensities. Indeed, the energy intensity of industry is around 3-4 times higher than that of the service sector in OECD countries. In other words, it requires three or four times as much energy to produce one unit of activity in industry compared to the service sector. In non-OECD countries this discrepancy is even higher, reaching a factor of 6-10. The effect of structural changes is especially important in countries with rapid economic growth, such as most East Asian countries. In order to better monitor energy efficiency trends in relation to energy pricing and energy management policies, it is necessary to leave out the influence of structural changes. This is done by calculating energy intensity at constant GDP structure, i.e. assuming a constant share of GDP for agriculture, industry and services, as well as a constant structure of the industrial value added by about 10 major branches of industry. In a few countries, however, because of a lack of data on energy consumption by industrial branch, constant GDP structure was calculated on the basis of the three main sectors only (i.e. agriculture, industry, services) (see Box 1.6).
0,0
0,1
0,2
0,3
0,4
0,5
0,6
0,7
0,8
0 5 10 15 20 25 30 35 40
cents95p/kWh
kWh/
$95p
jamswe
fin can
pannzlrus
vnzusa
aus
corjpn
hnddom phl
slv
urychn
mex
idngtm
colirl
belfra
nld uk frg bra mys
itaprt
bol

Energy Efficiency Policies and Indicators: WEC Report 2001
20
Box 1.6. Final energy intensity at constant GDP structure. The final energy intensity at constant GDP structure is a fictive value of final energy intensity calculated assuming that the GDP structure by sector is unchanged from the base year, only taking into account the actual variation in the energy intensity of each sector. This intensity provides an assessment of energy efficiency trends without the influence of changes in GDP structure. The difference in the variations of final energy intensity and final energy intensity at constant GDP structure over time shows the influence of structural changes. It is calculated in one of two ways: constant structure between the three mains sectors (agriculture, industry, services); or constant structure between 10 main industrial branches, and agriculture and services. Table 1.1 and Figure 1.10 compare the actual evolution of final energy intensity with that of the intensity at constant economic structure. The difference between these intensities shows the influence of structural changes in the economy. The intensity at constant GDP structure can be considered a macro-economic indicator of energy efficiency trends. Before 1986, in Italy, Brazil, Mexico, Korea, Thailand and China, progress with end-use energy efficiency, as measured by intensity at constant structure, was higher than expected from the reduction in final energy intensity. This means that part of the efficiency improvement was masked by the increasing share in GDP of energy intensive sectors. It was the reverse situation in Austria, France, Japan and the USA, where final intensity at constant structure decreased less than final energy intensity. In Austria, structural changes explain about 25% of the decrease in final energy intensity between 1980 and 1986; in Japan and the USA the figure is around 15%. Since 1986 structural changes have been the main driving forces behind the reduction of final energy intensity in Japan and France. In the USA and Brazil, structural changes contributed to lowering energy intensity. In several EU countries on the other hand, structural changes have tended to increase overall final intensity – energy intensive sectors have grown in importance (e.g. in the UK, Austria, Italy). Between 1990 and 1998, structural changes were less significant (Figure 1.10). The actual intensity and the intensity at constant structure vary almost in the same way for most countries (especially Denmark, Italy, the Netherlands, the UK and Korea). In general, there is still a shift towards less energy intensive sectors and branches (except in Austria, Mexico and Sweden).

Energy Efficiency Policies and Indicators: WEC Report 2001
21
Table 1.1. Variations in final energy intensity – the role of structural changes (%/year).
1980-1986 1986-1998 IE IES ST IE IES ST
AUSTRIA -2,1 -1,6 -0,5 -1 -1,3 0,3 DENMARK -2,7 -2,7 0 -1,8 -1,8 0 FRANCE -2 -1,9 -0,1 -0,8 -0,5 -0,3 ITALY -1,8 -2,3 0,5 0 -0,1 0,1 UK -2 -1,1 -1,6 0,5 JAPAN -2,8 -2,4 -0,4 -0,3 0,1 -0,4 USA * -3,2 -2,8 -0,4 -1,2 -0,9 -0,3 BRAZIL -0,2 -0,3 0,1 1,5 1,8 -0,3 MEXICO 1,4 1,1 0,3 -1,2 -1,4 0,2 KOREA * -3,1 -3,7 0,6 1,3 1,1 0,2 CHINA -4,3 -5,6 1,3 -4,5 -7,4 2,9 THAILAND 0,9 0,6 0,3 1,6 1,2 0,4 * At constant structure of GDP by main sector. USA: 1997; Thailand: 1996.
Notes: IE: final energy intensity (actual value). IES: final energy intensity at constant structure of GDP and industrial value added – indicator of overall energy efficiency (for USA, Korea and Brazil at constant structure by main sectors only).
ST: impact of structural changes (<0 means changes in the economic structure towards less intensive sectors).
Figure 1.10. Final energy intensity variation – the role of structural changes, 1990-98.
Variation de l’intensité énergétique finale – influence des changements de structure, 1990-98.
Note: Korea, Mexico, USA at constant structure by main sector.
-15
-10
-5
0
5
10
Austria Denmark France Italy Netherland Sweden UK Japan Korea Mexico USA
ActualAt constant structure

Energy Efficiency Policies and Indicators: WEC Report 2001
22
Energy price variations and energy efficiency progress – controversial conclusions from observations on selected industrialised countries. Looking more closely at a group of industrialised countries, and at more precise energy efficiency indicators (energy intensities at constant economic structure), it appears that there is no direct relation between the size of the price variations and energy efficiency progress (Figure 1.11). In all countries in the sample (except Korea), the intensity decreased on average over the period; however, for half of the countries, this was a period of decrease in average energy prices to final consumers. In addition, the size of the intensity reduction is not correlated to the price variation. For example, in Austria, energy efficiency improved by 0.5% per year between 1990 and 1998, while the average price to final consumers decreased by around 2% per year; in Japan intensity increased in the context of the same price variation.
Figure 1.11. Energy prices and energy intensity at constant structure, 1990-98.
Comparisons of energy intensity levels are probably more relevant with intensities adjusted to the same economic and energy structures. Differences in final energy intensity can be explained by many factors, among which energy efficiency is only one. As explained above, different economic structures will result, all things being equal, in different intensities. Therefore, to make comparisons more meaningful for assessing differences in overall energy efficiency performance, the intensities have to be adjusted for differences in economic structure between countries. This adjustment is easy to make: a fictive final energy intensity can be calculated for each country using the economic and industrial structure of a reference country or region, but keeping its own sectoral energy intensities. Here the EU average is taken as the reference. The adjusted intensities can be referred to as final energy intensities adjusted to EU economic structure (see Figure 1.12).
-1,5
-1
-0,5
0
0,5
1
1,5
-5 -4 -3 -2 -1 0 1 2 3 4 5
energy prices (%/y)
inte
nsity
at c
onst
ant s
truc
ture
(%/y
)
fra
uk
aut
cor
usa
chl
nzl
jpn
ita
prt
dnk
nld

Energy Efficiency Policies and Indicators: WEC Report 2001
23
Figure 1.12a shows this adjustment to the level of industrial branches. Due to data limitations, this indicator can only be calculated for a limited sample of countries. In Figure 1.12b, the adjustment is made only on basis of main economic sectors (agriculture, industry and services). For CEECs, this adjustment generally reduces the intensity. For the EU, it narrows the range between countries. For developing countries, in which agriculture, usually a sector with a low intensity, still contributes significantly to GDP, the adjustment increases intensity.
Figure 1.12a. Final energy intensities adjusted to EU economic structure, 1998. Intensités énergétiques finales ajustées à la structure économique de l’UE, 1998.
Figure 1.12b. Final energy intensities adjusted to EU economic structure, 1998. Intensités énergétiques finales ajustées à la structure économique de l’UE, 1998.
0
0,05
0,1
0,15
0,2
0,25
0,3
0,35
0,4
aut fra frg uk dnk usa can rus chn arg bol chl m ex ury col idn per phl tha jpn cor bra
koe/
$95p
actualadjusted to EU average structure (except industry)
0
0 ,0 2
0 ,0 4
0 ,0 6
0 ,0 8
0 ,1
0 ,1 2
0 ,1 4
0 ,1 6
0 ,1 8
a u t d n k fra ita u k frg jp n c o r b ra th a
koe/
$95p
a c tu a la d ju s te d to E U a v e ra g e s tru c tu re
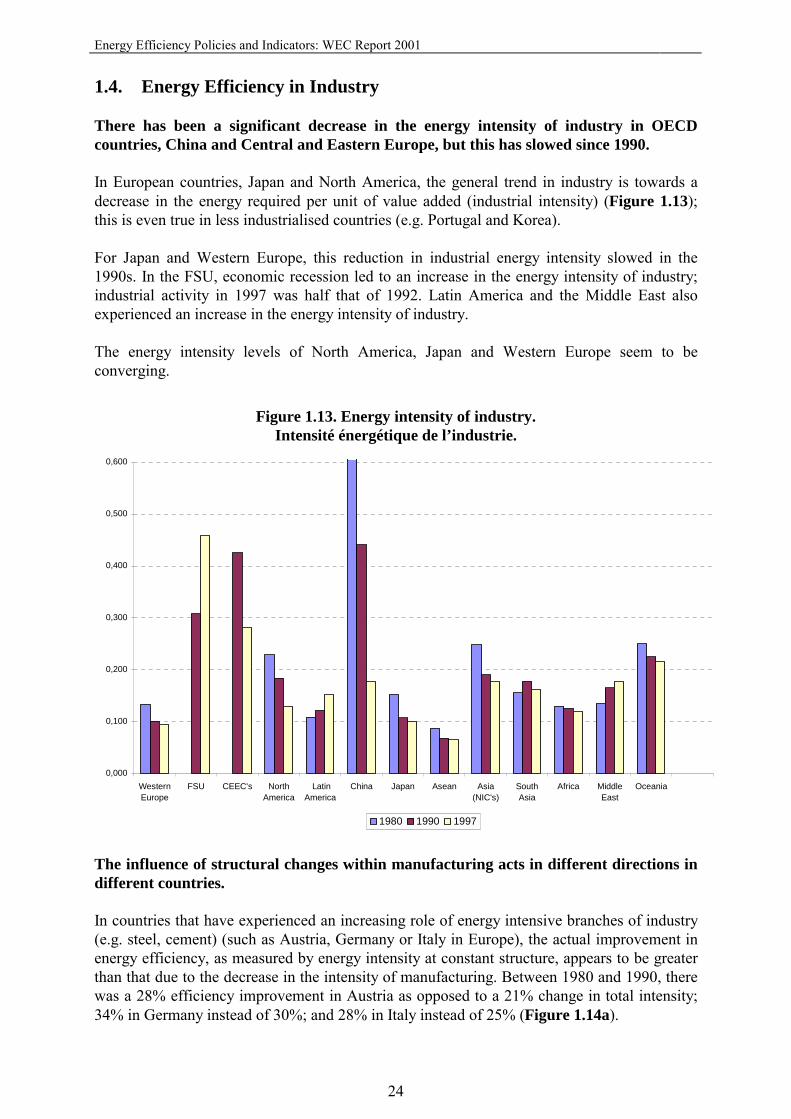
Energy Efficiency Policies and Indicators: WEC Report 2001
24
1.4. Energy Efficiency in Industry There has been a significant decrease in the energy intensity of industry in OECD countries, China and Central and Eastern Europe, but this has slowed since 1990. In European countries, Japan and North America, the general trend in industry is towards a decrease in the energy required per unit of value added (industrial intensity) (Figure 1.13); this is even true in less industrialised countries (e.g. Portugal and Korea). For Japan and Western Europe, this reduction in industrial energy intensity slowed in the 1990s. In the FSU, economic recession led to an increase in the energy intensity of industry; industrial activity in 1997 was half that of 1992. Latin America and the Middle East also experienced an increase in the energy intensity of industry. The energy intensity levels of North America, Japan and Western Europe seem to be converging.
Figure 1.13. Energy intensity of industry. Intensité énergétique de l’industrie.
The influence of structural changes within manufacturing acts in different directions in different countries. In countries that have experienced an increasing role of energy intensive branches of industry (e.g. steel, cement) (such as Austria, Germany or Italy in Europe), the actual improvement in energy efficiency, as measured by energy intensity at constant structure, appears to be greater than that due to the decrease in the intensity of manufacturing. Between 1980 and 1990, there was a 28% efficiency improvement in Austria as opposed to a 21% change in total intensity; 34% in Germany instead of 30%; and 28% in Italy instead of 25% (Figure 1.14a).
0,000
0,100
0,200
0,300
0,400
0,500
0,600
WesternEurope
FSU CEEC's NorthAmerica
LatinAmerica
China Japan Asean Asia(NIC's)
SouthAsia
Africa MiddleEast
Oceania
1980 1990 1997

Energy Efficiency Policies and Indicators: WEC Report 2001
25
In other countries, such as Denmark, Japan and Korea, the shift in industrial structure has taken place in the other direction, towards less energy intensive industries (e.g. electronic goods, parachemicals). In such cases, part of the decrease in energy intensity of manufacturing is due to such structural changes. In other words, the intensity decrease overestimates the actual efficiency improvement due to technical and managerial influences. In Japan, for example, energy intensity has decreased by 36% in manufacturing industry, whereas the actual energy efficiency improvement was 30% between 1980 and 1990.
Figure 1.14a. Energy efficiency change in manufacturing industry, 1980-90.
Evolution de l’efficacité énergétique de l’industrie manufacturière, 1980-90.
Since 1990, in most European countries structural changes within manufacturing have been marginal. Although different situations could be observed before 1990, since then there has been a more uniform trend in most European countries (except Austria and the UK), with a moderate influence of structural changes. In Japan, structural changes contributed significantly to the decrease in the amount of energy required per unit of value added in industry (Figure 1.14b). On average, energy efficiency improvements continue in Europe at a lower rate than before 1990. They were around 1% per year after 1990, compared to 2% to 3% per year before 1990. The comparison of the energy intensity levels of manufacturing is more relevant if the intensities are adjusted to the same structure (e.g. the EU average) (Figure 1.15).
-20
-10
0
10
20
30
40
aut dnk ita frg cor jpn
%
actual intensity decreaseintensity decrease at constant structurestructural changes

Energy Efficiency Policies and Indicators: WEC Report 2001
26
Figure 1.14b. Energy efficiency change in manufacturing industry, 1990-98.
Evolution de l’efficacité énergétique de l’industrie manufacturière, 1990-98.
Figure 1.15. Intensity of manufacturing industry adjusted to EU structure, 1998. Intensité énergétique de l’industrie ajustée à la structure de l’UE, 1998.
-10
-5
0
5
10
15
aut dnk ita fra frg uk cor jpn
%
actual intensity decreaseintensity decrease at constant structurestructural changes
0
0,05
0,1
0,15
0,2
0,25
0,3
aut dnk fra ita uk frg jpn cor tha
koe/
$95p
actualadjusted to EU average structure

Energy Efficiency Policies and Indicators: WEC Report 2001
27
Higher energy efficiency results from higher overall productivity of production factors, but also from more energy saving processes. Producing more GDP or more value added for less energy consumed results from the use of improved energy saving techniques or managerial practices. It results also from an increase in the overall productivity of production factors (more productive capital, more productive labour, etc.), i.e. more value added per unit of physical output. Obtaining a clearer picture of energy efficiency improvements related to energy conservation policy requires a greater level of disaggregation, and the use of techno-economic ratios which filter out the influence of productivity changes and relate the energy consumed to the physical output. In energy intensive industries, a reduction in the consumption of energy per tonne of output of steel and cement can be observed in most countries. This certainly explains the overall energy efficiency improvement outlined above. There is even a relative convergence in the unit consumption for cement production (Figure 1.17) in most OECD countries. For the other countries the situation is more diverse, due to differences in production processes and products.
Figure 1.16. Average unit consumption of energy for steel production.
Consommation unitaire moyenne de l’acier.
Source: Data from ODYSSEE, APERC and ENERDATA.
0
0,2
0,4
0,6
0,8
1
1,2
1,4
aut frg uk swe ita fra bel jpn can aus cor mex rus tha twn phl chl chn
toe/
t 198019901998

Energy Efficiency Policies and Indicators: WEC Report 2001
28
Figure 1.17. Average unit consumption of energy for cement production. Consommation unitaire moyenne du ciment.
Source: Data from ODYSSEE, APERC. 1.5. Energy Efficiency in Transport Great disparities exist between OECD countries in the energy intensity of transport. The energy intensity of the transport sector (see Box 1.7 for definition) appears to be very similar among European countries and Japan, while North America and Oceania stand at much higher levels: 2.2 times higher for North America, 1.9 times for Oceania (Figure 1.18). However, only part of the discrepancies in overall energy intensities between these regions can be explained by the differences in the transport sector (about 30% of the discrepancy between North America and Western Europe).
Box 1.7. Energy intensity of transport. There is no good indicator to grasp the overall efficiency trends in the transport sector, mainly because of the difficulty of separating out the energy used by different modes of transport, especially road transport. The indicator usually considered to provide the best overall picture is the energy consumed in the transport sector per unit of GDP. This energy intensity does not have the same status as for other sectors, as transport activities take place in all sectors and it is not possible to define a macro-economic indicator of activity that is characteristic of the sector.
0
0,02
0,04
0,06
0,08
0,1
0,12
0,14
0,16
0,18
0,2
frg gbr swe ita prt fra jpn can aus nzl rus tha twn chl mex
toe/
t 198019901998

Energy Efficiency Policies and Indicators: WEC Report 2001
29
Energy efficiency improvement in transport is almost absent in OECD countries, except in North America, which starts from a very high level of intensity. North America and Oceania are among the few regions to have experienced a drastic increase in the overall energy efficiency of the transport sector since 1973, without interruption. This situation can be mainly explained by the dramatic improvement in the efficiency of cars following the implementation of the CAFE standards for the fuel economy of new cars in the USA. The average specific consumption of cars decreased by almost 40% in the USA between 1973 and 1993 (starting from a level double that in Europe). Western European countries did not experience any significant improvement in the overall energy efficiency of the transport sector until 1990. Only limited energy efficiency programmes were implemented in that sector, and technical improvements in the fuel efficiency of vehicles were offset, in most cases, by a worsening of traffic conditions and behavioural factors (e.g. a shift to bigger cars, more use of air conditioning). As a result, over the 1980s the energy intensity of transport increased rapidly in Western Europe. Since 1990, however, the energy intensity of transport has decreased. This phenomenon results from the combined effect of energy efficiency improvements, the continuous increase in motor fuel prices, new priorities given to energy efficiency measures in the transport sector (especially urban transport in relation to environmental protection), and the level of saturation in car ownership. In less developed regions or in emerging economies, the energy intensity of transport is usually increasing rapidly, because of increased ownership of cars and motorcycles, and the substitution of road transport for rail or water transport for the movement of goods. Poor economic conditions have, however, reversed that trend in recent years.
Figure 1.18. Energy intensity of transport. Intensité énergétique du transport.
0,000
0,010
0,020
0,030
0,040
0,050
0,060
0,070
0,080
0,090
WesternEurope
FSU CEEC's NorthAmerica
LatinAmerica
China Japan Asean Asia(NIC's)
SouthAsia
Africa MiddleEast
Oceania World
1980 1990 1995 1999

Energy Efficiency Policies and Indicators: WEC Report 2001
30
Vehicle efficiency increased up to 1986, but traffic congestion has reduced efficiency. In Europe, there is a relative convergence of the unit consumption per equivalent car for the majority of countries, in the range 0.8 to 1.1 toe (Figure 1.19). For most countries, this unit consumption is a proxy for the performance of cars (see Box 1.8). Italy and Japan stand out with a lower value, due to a lower utilisation of vehicles (km/year) and a larger share of small vehicles. The average distance travelled by car per year in these two countries is about 25% lower than the average of European countries.
Figure 1.19. Consumption of gasoline per equivalent-car. Consommation d'essence par voiture équivalent
Source: Data from ODYSSEE, APERC and OLADE. In Europe and Japan, the average consumption per equivalent car decreased until the mid 1980s, but has increased since then. This reverse in the trend can be explained by different factors: the increasing use of cars; the levelling off and even decrease in the fuel efficiency of new cars; and a deterioration in traffic conditions, which has increased the gap between the theoretical specific consumption of new cars (as indicated by the manufacturers) and the actual specific consumption. In the USA, the average consumption per car has dramatically decreased since 1973, by about 35%, or from 2.3 toe/car to 1.5 toe/car. However, its present level is still 50% higher than the European average because of higher distances travelled and more energy intensive cars.
Box 1.8. Average unit consumption per equivalent car. The drawback with evaluating average road transport consumption on a simple per vehicle basis is that all types of vehicles are put on the same level. Motorcycles, cars, pick-ups, trucks and buses are added together, with one motorcycle counting the same as one car. If, for example, the number of motorcycles is increasing more rapidly than the number of cars, the average unit consumption will decrease rapidly, since a motorcycle uses much less fuel than a car (by a factor of between 50 and 100). Any change in the composition of the stock of
0
0,5
1
1,5
2
2,5
1980 1981 1982 1983 1984 1985 1986 1987 1988 1989 1990 1991 1992 1993 1994 1995 1996 1997 1998 1999
toe/
car
jpnauscannzlautnldfrgdnkgbrfrafinsweitausaargphl

Energy Efficiency Policies and Indicators: WEC Report 2001
31
vehicles will affect the unit consumption, even if the vehicles do not change from a technical point of view (i.e. there is no technical progress). To understand how much of the variation in unit consumption can be attributed to structural changes in the composition of the stock of vehicles, a better indicator of energy efficiency is the unit consumption per equivalent car. This relates the total consumption of motor fuels to a fictive stock of vehicles, measured in terms of a number of equivalent cars. The conversion of the actual stock of vehicles to the stock of equivalent cars is based on coefficients reflecting the average yearly consumption of each type of vehicle relative to that of cars. If a motorcycle consumes on average 0.2 toe/year and a car 1 toe/year, one motorcycle is considered equal to 0.2 equivalent cars. These coefficients can be derived from surveys (or estimates) of distances travelled and specific consumption (litres/100 km). For developing countries: a similar pattern to that observed in industrialised countries. In the East Asian and Latin American countries under review, after a period of decrease following the second oil shock, average consumption per equivalent car has increased everywhere since the mid 1980s. The main factors behind this trend are the decrease in the price of gasoline in real terms in most of these countries, and the absence of energy efficiency programmes. Countries with high gasoline price have the most efficient vehicles. Figure 1.20 shows the distribution of unit consumption of gasoline per equivalent car according to the average price of gasoline. The influence of price is clear. The unit consumption tends to be lower in countries with the highest prices (the high value for the Philippines can be explained by the large share of public transport vehicles). However, the price levels do not explain all the differences – lifestyles (e.g. size of cars, driving habits) and the degree of use of cars (average distance travelled per year) also play a key role.
Figure 1.20. Unit consumption of gasoline, and average price of gasoline, 1998. Consommation unitaire d’essence et prix moyen de l’essence, 1998.
0
0,2
0,4
0,6
0,8
1
1,2
1,4
1,6
1,8
0 0,2 0,4 0,6 0,8 1 1,2 1,4$95p /l
toe/
car
can
nzl
jpn
dnk swefin
autfra
nld
uk
ph l
ita ury
Source: Data from ODYSSEE, APERC and OLADE.

Energy Efficiency Policies and Indicators: WEC Report 2001
32
Countries with high diesel prices have a lower unit consumption of diesel. Figure 1.21 displays for selected countries the relationship between the average amount of energy used per diesel vehicle and the price of diesel. The differences observed in average unit consumption are probably mostly non-technical. The factors behind these differences are multiple: fleet management, the average size of vehicles (a high share of diesel cars will decrease this), and in some cases the refuelling of vehicles in transit between other countries (which is included in domestic consumption). These factors can be influenced by different levels of diesel prices, as well as by different regulations and practices.
Figure 1.21. Unit consumption of diesel by vehicles, and average price of diesel, 1998.
Consommation unitaire de gasoil par véhicule et prix moyen du gasoil, 1998.
For trucks alone, data are only available for EU countries. The average consumption of diesel per year per vehicle has increased in all European countries except Italy since the mid 1980s. In some countries, such as Austria and France, there has been quite a significant increase (Figure 1.22).
0
1
2
3
4
5
6
7
8
0 0,1 0,2 0,3 0,4 0,5 0,6 0,7 0,8 0,9
$95p/l
toe/
veh
can
dnk
arg
irl
uk
ita
esp
fin
jpn
mex
aut belcor
fra
,

Energy Efficiency Policies and Indicators: WEC Report 2001
33
Figure 1.22. Unit consumption of diesel by trucks.
Consommation unitaire de gasoil par camion.
Source: ENERDATA. Prices alone cannot explain all the differences in unit consumption of road transport vehicles. Figure 1.23 displays the average unit consumption for road transport per equivalent car, combining gasoline and diesel consumption. In principle, the influence of the structure of the stock of vehicles is removed from these unit consumption figures, as all road vehicles are expressed in terms of equivalent cars (see Box 1.8). The differences observed could be due to many other factors, not directly linked to prices, e.g. different degrees of use of vehicles (behavioural/managerial factors), different mixes between gasoline and diesel, etc.
0
5
10
15
20
25
1980 1981 1982 1983 1984 1985 1986 1987 1988 1989 1990 1991 1992 1993 1994 1995 1996 1997 1998 1999
toe/
veh
autn ldrfadnkgbrfinsw eitafra

Energy Efficiency Policies and Indicators: WEC Report 2001
34
Figure 1.23. Energy consumption for road transport per equivalent car, and average price of fuels.
Consommation unitaire des transports routiers par équivalent voiture et prix moyen des carburants.
0,0
0,5
1,0
1,5
2,0
2,5
0,0 0,2 0,4 0,6 0,8 1,0 1,2 1,4 1,6
$95p/l
toe/
car
usa
can
ausaus
uk
rus
ita
argnld
fin
swe
fradnk
frgf
aut
mex
tha
phl
ury
jpn
esp
Source: ENERDATA. 1.6. Energy Efficiency in the Household and Service Sectors Due to the heterogeneity among world regions of energy consumption for thermal uses (cooking, space heating), any comparison between countries is meaningless. The evaluation here of energy trends in this sector will focus on electricity only. Diverging trends and consumption levels for electricity in the household sector. The average consumption of electricity per capita in the household sector is quite diverse in OECD countries, depending on the level of diffusion of electrical appliances and the importance of electric space heating (Figure 1.24). It varies from a value of around 1000 kWh/capita in Portugal, Italy and Korea, to around 2000 kWh in the UK, France and Japan, and reaches 4500 kWh in Canada and Sweden. In all countries, consumption per capita is increasing, even in most CEECs undergoing economic transition. The increase is especially rapid in developing countries with high economic growth (e.g. Brazil, Thailand).

Energy Efficiency Policies and Indicators: WEC Report 2001
35
Figure 1.24a. Unit consumption of electricity by households (OECD).
Consommation unitaire d’électricité des ménages (OCDE).
Source: ENERDATA.
Figure 1.24b. Unit consumption of electricity by households (non-OECD). Consommation unitaire d’électricité des ménages (non-OCDE).
Source: ENERDATA. The comparison of unit electricity consumption, both within OECD countries and between OECD and non-OECD countries, is more relevant if is made considering captive uses only (i.e. excluding space heating and other thermal uses, such as cooking or water heating). However, the poor availability of data on the consumption of electricity by end-use limits the possibilities to make such comparisons.
0
5 0 0
1 0 0 0
1 5 0 0
2 0 0 0
2 5 0 0
3 0 0 0
3 5 0 0
4 0 0 0
4 5 0 0
5 0 0 0
us a ca n m e x fra au t n ld rfa d n k g b r fin s w e ita pr t a u s n z l jp n c o r
kwh/
cap 1 9 8 0
1 9 9 01 9 9 8
0
200
400
600
800
1000
1200
1400
1600
1800
2000
rus arg chl bol bra mys col cri cub hnd nic pan pry ury vnz phl sgp chn hkg idn per tha twn
kWh/
cap 1980
19901998

Energy Efficiency Policies and Indicators: WEC Report 2001
36
In developing countries and the majority of CEECs, most electricity consumption is for captive uses, as electric heating and other thermal uses are usually marginal. Therefore the data presented in Figure 1.24b for these countries can be considered a good approximation of the consumption for captive uses. On the other hand, electric space heating is quite significant in some European and North American countries (e.g. the USA, Canada and France), and the overall data shown in Figure 1.24a may be misleading. Unit consumption by electrical appliances and lighting is decreasing in some OECD countries. For the countries for which data is available, Figure 1.25 shows the trend for consumption by electrical appliances and lighting only. After a period of regular increase, the unit consumption for captive uses of electricity seems to have taken a different trend in recent years, with a decrease in several OECD countries (e.g. Canada, Denmark and Sweden). This break in the historical trend can be related to measures taken to curb the growth of electricity consumption, such as labelling, efficiency standards or other demand-side management actions, and to saturation in the diffusion of major electrical appliances.
Figure 1.25. Unit household consumption for electrical appliances and lighting.
Consommation unitaire des ménages pour les équipements électroménagers et l’éclairage.
Source: ENERDATA.
0
500
1000
1500
2000
2500
3000
1980 1981 1982 1983 1984 1985 1986 1987 1988 1989 1990 1991 1992 1993 1994 1995 1996 1997 1998
kWh/
cap
usaauscannzlfradnkautitagbrrfasweesprus

Energy Efficiency Policies and Indicators: WEC Report 2001
37
Prices influence electricity consumption, but cannot explain all the differences between countries. Countries with low electricity prices have the highest unit consumption per unit of GDP (Figure 1.26). However, once again, for a given price level the values are spread over a wide range, varying by a factor of four.
Figure 1.26. Household consumption of electricity per unit of GDP, and electricity prices.
Consommation unitaire d’électricité des ménages par unité de PIB et prix de l’électricité.
Source: Data from IEA, APERC, OLADE and ENERDATA. The electricity intensity of the service sector is increasing. In developing countries, the main source of energy used in the service sector (i.e. public administration, commerce and other service activities) is electricity. Therefore, as with the household sector, the indicators considered here focus on electricity. The quantity of electricity required to generate one unit of value added (the electricity intensity) is increasing in most countries, especially in less industrialised countries in which the service sector is expanding rapidly, and in countries with air conditioning requirements (e.g. Thailand and Korea) (Figure 1.27). In OECD countries, with high energy intensity levels, the ratio is rather stable (the USA, Canada), or even decreasing (the UK, Sweden).
0,00
0,05
0,10
0,15
0,20
0,25
0 5 10 15 20 25 30
cents95p/kWh
kWh/
$95p
all usescaptive usesswe
rus
rus
can
nzl
vnz
usa
aus
pry
hndury
bel
bra
arg
chnita
thadnk
chlita
dnk
autbolrfg
bol
jpn
gtmrfg
idn
frauk
ecufrauk
canusaswe

Energy Efficiency Policies and Indicators: WEC Report 2001
38
Figure 1.27a. Electricity intensity in the service sector (OECD).
Intensité électrique des services (OCDE).
Source: Data from IEA, APERC, OLADE and ENERDATA.
Figure 1.27b. Electricity intensity in the service sector (non-OECD). Intensité électrique des services (non-OCDE).
Source: Data from IEA, APERC, OLADE and ENERDATA.
0
50
100
150
200
250
300
350
400
1980 1981 1982 1983 1984 1985 1986 1987 1988 1989 1990 1991 1992 1993 1994 1995 1996 1997 1998
kWh/
$95p
autnldrfadnkgbrfinsweprtfrabelitausacanausnzlcormexjpn
0
50
100
150
200
250
300
350
1980 1981 1982 1983 1984 1985 1986 1987 1988 1989 1990 1991 1992 1993 1994 1995 1996 1997 1998
kWh/
$95p
perthabolbracolcripanuryvnzphlsgpchlchnhkgidnmys

Energy Efficiency Policies and Indicators: WEC Report 2001
39
In this sector, unit consumption can be related to the number of employees. The average electricity consumption per employee in OECD countries varies quite markedly between countries. In some countries it is around 4000 kWh/employee (Austria, Italy and Belgium), while in France and the Netherlands it is around 6000 kWh. Sweden, Canada and the USA have the highest unit consumption, above 10 000 kWh/employee. Unit consumption of electricity is still increasing in this sector, unlike total unit consumption (Figure 1.28).
Figure 1.28a. Electricity consumption per employee in the service sector (OECD). Consommation unitaire d'électricité par employé dans les services (OCDE).
Source: Data from IEA, APERC, OLADE and ENERDATA.
Figure 1.28b. Consumption per employee in the service sector (non-OECD). Consommation unitaire par employé dans les services (non-OCDE).
Source: Data from IEA, APERC, OLADE and ENERDATA.
0
2000
4000
6000
8000
10000
12000
14000
1980 1981 1982 1983 1984 1985 1986 1987 1988 1989 1990 1991 1992 1993 1994 1995 1996 1997 1998
kWh/
emp
autnldrfadnkukueuritaprtfrausacanausnzljpncormex
0
1000
2000
3000
4000
5000
6000
7000
8000
1980 1981 1982 1983 1984 1985 1986 1987 1988 1989 1990 1991 1992 1993 1994 1995 1996 1997 1998
kWh/
emp
chnargbolbracolc ripanuryvnzphlsgpchlhkgidnm ysthatw n

Energy Efficiency Policies and Indicators: WEC Report 2001
40
1.7. Conclusions Since 1990, energy consumption per unit of GDP at the world level has decreased by about 2% per year. However, half of this reduction has come from more rapid growth in regions with the lowest energy intensity. The actual progress in energy productivity was only 1% per year, less than it was between 1980 and 1990. In general, the industrial sector has contributed most to the decrease in energy intensity. Since 1990, structural changes in the economy have had almost no influence on energy intensity trends, unlike the early 1980s. Since 1990, the overall performance of the transport sector has improved compared to the 1980s. The economic slow down in some non-OECD regions, as well as technical improvements to vehicles and saturation in transport demand in OECD countries, have contributed to this trend. However, some of the effect of technical improvements in new vehicles has been offset by non-technical factors (e.g. congestion, larger and more powerful cars). In the household sector, electricity use for electrical appliances and lighting has stopped increasing in several OECD countries. This is probably the result of policy measures implemented in that sector (e.g. labelling, efficiency standards), as well as of saturation in the diffusion of some electrical appliances.

Energy Efficiency Policies and Indicators: WEC Report 2001
41
2. Evaluation of energy efficiency policies and measures 2.1. Introduction The objective of this evaluation is to provide some assessment of the degree of implementation of selected energy efficiency policy measures all over the world: What is their importance? What are the priorities? What are the trends? What measures are being favoured? This evaluation is mainly based on a survey carried out on a sample of 51 countries and economies, representing all world regions: • 17 from Western Europe (EU countries minus Luxembourg; Norway; Switzerland;
Turkey). • 11 from Central and Eastern Europe (Bulgaria; Czech Republic; Estonia; Hungary; Latvia;
Lithuania; Poland; Romania; Russia; Slovenia; Slovakia). • 6 from America (Canada; Chile; Colombia; Peru; Mexico; the United States). • 9 from Asia (India; Hong Kong, China; Indonesia; Japan; Republic of Korea; Malaysia;
Philippines; Taiwan, China; Vietnam). • 3 from the Pacific (Australia; New Zealand; Papua New Guinea (PNG)). • 5 from Africa (Algeria; Cameroon; Egypt; Nigeria; South Africa). In addition, Thailand and China were included in the case studies. The countries and economies considered belong to various different economic or political associations and organisations (see Table 2.1). • 28 belong to the OECD (the remaining 23 are referred to as non-OECD); the sample is
well balanced between OECD and non-OECD. • 14 belong to the European Union (EU). • 17 belong to Asia Pacific Economic Cooperation (APEC). • 4 belong to the Latin American Energy Organisation (OLADE). • 10 are former centrally planned economies. • 4 belong to the Association of South East Asian Nations (ASEAN). The results of the survey are summarised in various tables, which show the degree of implementation of the measures in the different countries and economies. As all could not fit in one table, they are grouped into two main categories: OECD and non-OECD. Within the OECD, a further distinction is made between Europe and the Asia Pacific region. The survey covers institutional aspects in depth, and focuses on five selected energy efficiency policy measures: • Thermal efficiency standards for new dwellings and new service buildings. • Measures related to household electrical appliances: labelling, regulations, efficiency
standards and target values. • Fiscal measures related to cars: purchase tax, registration tax, subsidies for clean and
efficient cars (electric, CNG), subsidies for scrapping old cars, and taxes on motor fuels. • Energy audits. • Financial incentives. Fuel substitution policies and measures to promote renewable energies are not included. R&D actions, although important in the long term, are also excluded from the survey, as such actions are less important in developing countries.

Energy Efficiency Policies and Indicators: WEC Report 2001
42
The evaluation mainly concentrates on the years following the signature of the Kyoto Protocol, i.e. 1998-2000. The objective is to see which measures and policies have been implemented to meet the commitments of the Kyoto Protocol and what have been the different behaviours of countries and economies in such a context. However, the survey includes measures implemented earlier which are still valid (e.g. regulation). The survey includes a brief overview of other energy efficiency measures. They are organised into two main categories: regulations, and fiscal and economic incentives. This classification reflects the two main modes of intervention: the regulatory approach versus market mechanisms through different types of incentives. A further category, information and sectoral agreements, was added to include other measures which do not fall directly into either of the two main categories. The overall classification of measures, and the types of measures considered in the survey, are shown in Table 2.2. Regulation stands here for all kind of measures, from public and private initiatives, which aim at implementing actions that will result in energy savings and/or CO2 emission reductions for specific end-uses, equipment or processes. Regulations are usually implemented when it is recognised that market failures would not allow economic instruments alone to reach the objective of the energy or environmental policy. In general, regulations aim either to impose minimum efficiency standards by law and/or governmental decree, or to impose energy efficient practices (technical and behavioural/managerial), as well as to provide systematic information to consumers (e.g. energy audits, labels). Regulations can be set at the national level, at the level of a group of countries (e.g. the case of SAVE Directives in the EU), or at the level of a sub-national region inside a federal country (e.g. US states). There are also other regulations which are not specifically targeted at energy efficiency, but which can nonetheless influence energy efficiency (e.g. speed limits, maximum weight of trucks). Economic instruments include economic incentives to promote energy efficiency (e.g. energy audit or investment subsidies, soft loans), as well as fiscal measures. To be comprehensive, this evaluation of energy policies needs to be completed by an analysis of price changes since 1986. Of course, prices are not only dependent on energy policies (through taxation), but are also influenced by the level of oil prices in the international market. The higher the level of taxation, such as in Europe for motor fuels, the lower is the sensitivity to crude oil price variations. This part of the report is organised in chapters as follows: • Energy pricing. • Institutions and programmes. • Thermal efficiency standards for new buildings. • Labelling, efficiency standards and target values for household electrical appliances. • Fiscal measures on cars and motor fuels. • Energy audits. • Economic and fiscal incentives. • Other regulations.

Energy Efficiency Policies and Indicators: WEC Report 2001
43
Table 2.1. Classification of countries/economies covered by the WEC survey.
COUNTRY/ECONOMY OECD EU APEC OLADE ASEAN CEECs Algeria Australia X X Austria X X Belgium X X Bulgaria X Cameroon Canada X X Chile X X Colombia X Czech Republic X X Denmark X X Egypt Estonia X Finland X X Portugal X X Germany X X Greece X X Hong Kong, China X Hungary X X India Indonesia X X Ireland X X Italy X X Japan X X Korea X X Latvia X Lithuania X Malaysia X X Mexico X X X Netherlands X X New Zealand X X Nigeria Norway X Peru X X Philippines X X Papua New Guinea (PNG) X Poland X Portugal X X Romania X Russia X X Slovakia X X Slovenia X South Africa Spain X X Sweden X X Switzerland X Taiwan, China X Turkey X UK X X USA X X Vietnam X X TOTAL 28 14 17 4 4 10

Energy Efficiency Policies and Indicators: WEC Report 2001
44
Table 2.2. Classification of energy efficiency measures covered by the survey.
INSTITUTIONAL MEASURES EFFICIENCY STANDARDS FOR NEW DWELLINGS AND BUILDINGS LABELLING, EFFICIENCY STANDARDS FOR HOUSEHOLD ELECTRICAL APPLIANCES ENERGY AUDITS OTHER MEASURES Regulation on: Energy management Energy managers Energy consumption reporting Energy saving plan Maintenance Heat metering Economic incentives and fiscal measures Investments subsidies Soft loans Tax credit or tax deduction Accelerate depreciation Tax reduction on energy saving equipment Tax on car purchase and ownership Sectoral agreements Information

Energy Efficiency Policies and Indicators: WEC Report 2001
45
2.2. Energy Pricing Adequate pricing is a necessary condition for promoting energy efficiency. The first step in energy efficiency policy should be to adapt energy prices so as to give the correct signals to consumers. Many countries have started to implement energy efficiency programmes without first adjusting energy prices – the results have been disappointing because there was no incentive for consumers to change their behaviour or to acquire energy efficient equipment and technology. Low energy prices in the late 1990s were a major disincentive to energy efficiency improvements in many countries. Moreover, expenditures on energy are low relative to total costs. In the industrial sector, for example, energy accounts for only 3-8% of total costs. In energy intensive sub-sectors, such as chemicals and pulp and paper, the figure is higher, at 10-14%. As a result energy efficiency issues have had a minor impact on economic decision- making, leading to under-investment in energy efficiency. Pricing structures are distorted by subsidies and do not reflect external negative effects. Adequate pricing means establishing consumer prices for energy products that reflect the cost of energy supply, i.e. the long-term marginal cost for electricity, the long-term price of oil products on international markets for fossil fuels. Although most energy planners agree with such objectives, they often face reluctance and opposition from decision-makers outside the energy sector, who fear public opposition and the impact of energy prices corrections on the consumer price index. Also, energy is a basic good for which a low price is a condition of access for low-income households. This makes actual price adjustments very slow or non-existent in many developing countries. In some cases there have even been moves in the opposite direction, i.e. price decreases. However, China is an interesting example of country which has succeeded in improving radically its energy efficiency by, among other things, removing price subsidies (Box 2.1). To review the trends in energy prices, two main types of energy were selected as case studies: motor fuels and electricity.
Box 2.1. Energy pricing in China. In the 1990s, particularly after 1994, China implemented policies to promote energy conservation. One aspect of this strategy was to force energy users to pay the full costs of energy resources by removing energy subsidies. Another method of encouraging resource conservation was through fiscal incentives, such as tax rebates for energy efficient investments. Price reform in China has increased economic incentives for conservation. In 1994, all price subsidies for coal were cancelled, except for coal used for power generation. In 1998, for the first time, domestic crude oil prices were allowed to float with international oil prices. Controls on the prices of oil products were removed in 2000. Prices rose substantially once these subsidies were lifted and, as economists would expect, energy-intensive industries reduced their consumption. In the iron and steel industry, for example, energy prices increased by a factor of three between 1986 and 1995. Being forced to pay the full cost of their energy inputs, firms responded by finding ways to conserve energy and reduce energy expenditures. During the decade, the iron and steel industry realised energy savings of 15 mtoe and avoided an estimated 3.87 billion Yuan in energy expenditures.

Energy Efficiency Policies and Indicators: WEC Report 2001
46
Motor Gasoline In EU countries and Japan, which are oil importers, the price of motor gasoline has always been high compared to the rest of the world due to heavy taxes (Figure 2.1a). The tax revenue represents an important source of funds for public budgets. In the EU, the gasoline price in 2000 varied between US$0.80-1.20 per litre at purchasing power parity (PPP) (1995 US dollars). In non-European OECD countries, the price is in the range of US$0.40-0.80 per litre. The USA stands out with a price which is much lower (around US$0.40 per litre). Trends differ significantly from one country to another, reflecting different tax policies. In some countries, the price of gasoline has kept on increasing in real terms since 1986, following the price of crude oil (Brent spot price taken as a reference). This is the case for France, the Netherlands, Germany, Poland and the UK. However, because of the importance of taxes in European countries and Japan, this is not always the case – in Italy, Portugal, Spain and Japan the average gasoline price was lower in 2000.
Figure 2.1a. Average gasoline prices: OECD.
Prix de l’essence: OCDE.
Source ENERDATA, based on data from IEA and APERC
0,0
0,2
0,4
0,6
0,8
1,0
1,2
1,4
1,6
brent EU jpn aus nzl usa can mex nld frg dnk uk fra swe ita prt esp hun pol rcz
$95p
/l 19862000

Energy Efficiency Policies and Indicators: WEC Report 2001
47
In non-OECD countries, gasoline prices look much higher as they are expressed in PPP terms: they were in the range US$0.50-1.50 in 1999 (1995 US dollars) (Figure 2.1b). In most countries the price has decreased in real terms. The gasoline price remains low in oil exporting countries (e.g. Venezuela, Trinidad and Tobago, Colombia and Bolivia).
Figure 2.1b. Average gasoline price: non-OECD.
Prix de l’essence: non-OCDE.
Source ENERDATA, based on data from APERC and OLADE In 1999, the percentage of taxes in the average retail price was around 75% in the EU (range of 70-80%) (Figure 2.2). Although the price of gasoline is no longer regulated by governments in OECD countries, there is a strong indirect state influence through taxation. In all countries, taxes include an excise tax and a value added tax (VAT). VAT is not uniform inside the EU. In all EU countries, except the Netherlands, the trend has been to increase VAT in recent years. The ultimate goal is towards a convergence at EU level. Several countries have planned a regular progression of the excise tax (e.g. in Germany, an increase of €0.15 in five steps; in the UK, the fuel duty escalator of 5-6% above inflation since 1994). In May 1992 Denmark set up a CO2 or environment tax; a similar tax was introduced in January 1991 in Norway and Sweden. These taxes represent the equivalent of 9% of the price in Sweden and 5% in Norway (2000), but less than 1% in Denmark. The impact of taxes on gasoline use is discussed below in the section devoted to fiscal and economic measures related to cars.
0
0,2
0,4
0,6
0,8
1
1,2
1,4
1,6
brent rus ch
n phl
sgp tha idn mys bra vn
z chl
per
arg bol
col
ecu pry tto ury cri do
m gtm hnd
jam pan slv
$95p
/l 19861999

Energy Efficiency Policies and Indicators: WEC Report 2001
48
Figure 2.2. Share of tax in the price of gasoline.
Part des taxes dans le prix de l’essence.
Source ENERDATA, based on data from IEA and APERC Automotive Diesel In the EU, Australia, Korea and Mexico, the diesel price is in a range of US$0.60-1.00 per litre (PPP, 1995 US dollars), with an average around US$0.70 per litre for the EU (Figure 2.3a). Since 1986, the price of diesel has increased in most EU countries, at a more rapid pace than the crude oil price. In most other OECD countries this price stands below US$0.40 per litre.
Figure 2.3a. Average diesel prices: OECD.
Prix moyen du gazole: OCDE.
Source ENERDATA, based on data from IEA and APERC
0
10
20
30
40
50
60
70
80
90
jpn EU nld frg dnk fra sw e ita prt grc esp tw n
%
19861999
0
0 ,1
0 ,2
0 ,3
0 ,4
0 ,5
0 ,6
0 ,7
0 ,8
0 ,9
1
bre nt E U jp n a u s c o r n z l ca n m e x u sa n ld frg d n k uk fra sw e ita p rt e sp p o l rcz
$95p
/l 1 9 8 62 0 0 0

Energy Efficiency Policies and Indicators: WEC Report 2001
49
In non-OECD countries (Figure 2.3b), the price of diesel varies from US$0.20-0.30 per litre in Venezuela, Trinidad and Singapore, to US$0.80 in China and Jamaica (PPP, 1995 US dollars). In the majority of countries it stands at around US$0.60 per litre. In most countries, prices have sharply decreased in real terms since 1986, with a reduction by sometimes a factor two or more (e.g. Indonesia, Paraguay, Trinidad, Uruguay, Costa Rica, Dominican Republic, Guatemala and El Salvador). In some countries, however, a reverse trend can be observed (Argentina, Brazil, Colombia and Ecuador).
Figure 2.3b. Average diesel prices: non-OECD.
Prix moyen du gazole: non-OCDE.
Source ENERDATA, based on data from APERC and OLADE The share of taxes in the diesel price is increasing, with a convergence among European countries at around 55-60% (Figure 2.4). The share of tax shown does not include VAT since it is refundable for commercial consumers. Denmark has recently set up an environmental tax (CO2 tax) on diesel that is not refundable. Sweden and Norway have a mileage tax, depending on the vehicle type and vehicle. In Japan, the share of taxes is increasing but is lower than in Europe (about 40%). In non-OECD countries, data on the share of taxes in the diesel price are mainly available for Latin American countries. They vary in a wide range, from less than 10% in Cuba to 60% in Jamaica and Haiti. In most countries, diesel taxes have increased since 1996. In Costa Rica and Colombia, these taxes have increased significantly.
0
0,2
0,4
0,6
0,8
1
1,2
1,4
1,6
brent rus ch
n phl
sgp idn mys tha ch
lpe
rarg bo
lbra co
lec
u pry tto ury vnz cri do
m gtm hti hnd
jam pan slv
$95p
/l 19861999

Energy Efficiency Policies and Indicators: WEC Report 2001
50
Figure 2.4. Share of taxes in the price of diesel.
Part des taxes dans le prix du gazole.
Source ENERDATA, based on data from IEA, APERC and OLADE Electricity For electricity, the average price to household and industrial customers is calculated for most countries as the average revenue per kilowatt-hour sold. The price level to household customers varies in a wide range in OECD countries (Figure 2.5a). Japan, Germany, Spain and Denmark are at the top (around 15-20 US cents/kWh) (at 1995 PPP); North American countries (Canada, Mexico and the USA) and Norway stand at the bottom (5-10 US cents/kWh). In real terms, the average electricity price for households is regularly decreasing, except in countries that have implemented aggressive demand-side management (DSM) programmes (e.g. Denmark or Sweden). Many experts have criticised traditional electricity pricing systems, based on a fixed charge and a consumption charge, for not providing incentives for energy efficiency. Indeed, where the fixed charge is a high proportion of the price, this limits the incentive to use for energy efficient equipment and techniques. To promote energy efficiency, in 1992 the German government included in new regulations for electricity tariffs the possibility for utilities to propose linear tariffs. Other countries are also working on electricity tariffs, to introduce greater incentives for conservation.
0
10
20
30
40
50
60
70
80
jpn EU nld frg dnk fra swe ita prt esp twn arg bra col cri cub hti jam
%
19861999

Energy Efficiency Policies and Indicators: WEC Report 2001
51
Figure 2.5a. Average electricity price (households): OECD.
Prix moyen de l’électricité (ménages): OCDE.
Source ENERDATA, based on data from IEA and APERC In non-OECD countries, the electricity price (measured at PPP) is in most cases in the range of 15-20 US cents, a level quite high compared to OECD countries. Some countries still have a very low price level (e.g. Russia, Trinidad, Venezuela). In real terms, household electricity prices have tended to decrease.
Figure 2.5b. Average electricity price (households): non-OECD.
Prix moyen de l’électricité (ménages): non-OCDE.
Source ENERDATA, based on data from APERC and OLADE
0
5
10
15
20
25
EU jpn aus cor nzl can mex usa nld frg dnk fra swe ita prt grc esp
c95p
/kW
h
19862000
0
5
10
15
20
25
30
35
40
chn rus chl a rg bo l b ra co l ecu pry tto u ry vnz idn m ys tha cri dom gtm hnd jam pan s lv
c$95
p/K
Wh
19861999

Energy Efficiency Policies and Indicators: WEC Report 2001
52
With respect to the electricity price for industry (Figure 2.6), three groups of countries can be highlighted: Japan with the highest prices; Mexico, Canada and the USA with the lowest prices (around 4 US cents/kWh at PPP); and European countries and Korea in between. The average price has decreased in almost all countries. The reduction was sharpest in countries with the highest price, resulting in a narrower range in 1999 than in 1986. In general, the declining trend in the electricity price for industry in most countries is probably a result of deregulation of the electricity sector. Including data for 2000 and 2001 would show an even more significant fall, especially in EU countries (e.g. Germany, around 30-50%). There is a convergence in the industrial electricity price in the range of 3 to 9 US cents/kWh, compared to a range of 4 to 14 US cents/kWh in the mid 1980s (and as high as 18 US cents/kWh in the case of Portugal).
Figure 2.6a. Average electricity price (industry): OECD.
Prix moyen de l’électricité (industrie): OCDE.
Source ENERDATA, based on data from IEA and APERC
0
2
4
6
8
10
12
14
16
18
20
EU jpn cor aus nzl can usa mex nld frg dnk fra swe ita prt grc esp
c95p
/kW
h
19861999

Energy Efficiency Policies and Indicators: WEC Report 2001
53
Electricity prices for industry in non-OECD countries are much higher than in the OECD, generally between 10 and 20 US cents/kWh (at PPP), with some exception (Trinidad, Venezuela). In several countries, the average price for industry is equal to or above that for the household sector (e.g. Bolivia, China, Colombia, Costa Rica, Russia, El Salvador and Venezuela).
Figure 2.6b. Average electricity price (industry): non-OECD.
Prix moyen de l’électricité (industrie): non-OCDE.
Source ENERDATA, based on data from IEA, APERC and OLADE Figure 2.7 shows the share of taxes in the average electricity price for households in OECD countries. The tax shown includes VAT (which is reduced to 5.5% for France on the fixed charge, i.e. about 30% of the bill). It also includes local taxes (about 7.5% for France). In Denmark, there is an environmental tax representing about 20% of the overall tax (or 9% of the price). Taxes are more important in Denmark (56% of the price) because of the environmental tax and a higher rate of VAT. Taxes are between 15% and 20% of the price in other OECD countries, except the UK (only 7.5%). For industry, most countries do not apply tax (apart from VAT). Only a few countries have an excise tax: Denmark (environmental tax), Japan and Italy.
0
5
10
15
20
25
30
chn rus chl arg bol bra col ecu pry tto ury vnz idn mys tha cri jam pan slv
c95p
/kW
h
19861999

Energy Efficiency Policies and Indicators: WEC Report 2001
54
Figure 2.7. Share of taxes in the price of electricity (households): OECD.
Part des taxes dans le prix de l’électricité (ménages): OCDE.
Source ENERDATA, based on data from IEA
0
10
20
30
40
50
60
70
aut nld frg dnk fra fin swe ita prt grc irl esp bel uk
%
19861999

Energy Efficiency Policies and Indicators: WEC Report 2001
55
2.3. Institutions and Programmes Two main questions related to institutional aspects can be addressed. Firstly, are public energy efficiency agencies necessary to sustain national efforts to improve energy efficiency? Secondly, is it necessary to have strong institutionalisation of energy efficiency measures, through an energy efficiency law or a national programme approved by parliament? Energy efficiency agency Most countries/economies have set up an energy efficiency agency (32 out of the sample of 51). An energy efficiency agency is defined here as a body separate from government ministries, dedicated to implementing energy efficiency policy (see Annex 2). In the EU, 12 countries (out of 15) have a national energy efficiency agency. Germany set up a new agency in 2000. In addition, the scope and role of such agencies was recently reinforced in three EU countries (Greece, Ireland and Portugal). In some countries, these agencies also cover environmental issues (e.g. France, the Netherlands). Far from being obsolete institutions, energy efficiency agencies are increasingly recognised in the EU as necessary instruments to foster energy efficiency policies. The European Climate Change Programme, presented in July 2001, is proposing to set up an agency at the EU level dealing with energy efficiency programmes launched by the European Commission. Most Central and Eastern European countries also have energy efficiency agencies: the Czech Republic, Hungary, Poland, Slovakia, Bulgaria, Lithuania and Romania. Many countries have also set up regional agencies, and even local agencies (city level). The regional agencies are of two kinds: agencies depending on regional administrations, and regional branches of national agencies. In the EU, almost all countries have set up regional and local agencies. This recent development is encouraged by the European Commission through the SAVE programme that provides funding to the agencies; about 150 local or regional agencies have been created with the support of SAVE. Most Central and European countries have also set up regional and local agencies. In countries with a federal or decentralised structure, such as Spain, Germany, Belgium, the USA and Canada, energy agencies have been set up by regional administrations. In some countries with a national energy agency, regional offices have been set up: ADEME in France has 28 offices, NOVEM in the Netherlands has four offices, ARCE in Romania has 16 offices, and SEA in Slovakia has nine offices. These regional and local agencies aim at providing more targeted measures, as they are closer to consumers and better able to take into account regional specificities (climate, energy resources, etc.). The primary justification for all these institutions is to provide technical expertise to governments and consumers, which cannot always be found in existing institutions. Government ministries do not, in general, have the required expertise to carry out all the activities of energy agencies.

Energy Efficiency Policies and Indicators: WEC Report 2001
56
Another important function of energy efficiency agencies is to act as a kind of lobby, or at least as a promoter of energy efficiency, as against energy companies which are selling energy. Electricity utilities, although very active in some countries, only deal with one source of energy. In addition, they remain above all sellers of energy, and thus may not have a strong enough long-term interest in energy efficiency, especially in the context of growing competition through the deregulation process. There is, therefore, a need for agencies that can deal with all energies and sectors on a long-term basis. The last function of energy efficiency agencies is to act as a coordinator of all governmental interventions in the field of energy efficiency, so as to avoid scattered and uncoordinated actions by different ministries. In particular, the existence of such agencies has proved very useful in negotiating sectoral agreements with groups of consumers or equipment producers to reach specific targets for efficiency improvements. In countries that receive international assistance programmes, such agencies can in addition be the national counterpart with whom donors negotiate the implementation of financial packages for energy efficiency. The fact that most countries have set up an energy efficiency agency is some kind of empirical justification of their usefulness. National energy efficiency programmes and laws Most countries have a national energy efficiency programme. For countries committed to reducing CO2 emissions by the Kyoto Protocol, these programmes are very often part of a national programme of CO2 reductions. This is in particular true for most EU countries. In some countries, such as India and Peru, there is an energy efficiency law. Such laws, as well as national energy efficiency programmes, may give a certain durability to public efforts in the field of energy efficiency, and ensure better coordination of the various actions and measures which are taken.

Energy Efficiency Policies and Indicators: WEC Report 2001
57
2.4. Efficiency Standards for New Dwellings and Buildings5 Efficiency standards for the buildings sector concern both residential (single and multi-family) dwellings and non-residential buildings (public and private service sector, and to a certain degree industrial buildings). Buildings make a large contribution to the energy consumption of a country. This is true in cold regions and, perhaps even more so, in hot regions (where electricity use for air conditioning is combined with relatively bad building performance). In the EU, for example, it is estimated that buildings account for 40% of overall energy consumption. Most OECD countries have set up energy efficiency standards for new dwellings and service sector buildings: this includes all European countries, Australia, Canada, the USA, Japan, Korea and New Zealand (see questionnaire synthesis in Annex 2). Some non-OECD countries outside Europe have recently established mandatory or voluntary standards for service buildings: Singapore and the Philippines were among the first. Several other countries planned to introduce efficiency standards in 2000 or 2001: Mexico, Turkey, Algeria, India, Malaysia, and Indonesia. This chapter evaluates trends and general features from a selection of countries and regions in order to draw conclusions on more general trends. These are: Australia; California (USA); the EU; Germany; Hong Kong, China; Japan; Poland; Slovakia; Thailand. A summary of the case studies is given in Annex 1.
2.4.1. Description of Measures and their Diffusion From component-based to overall performance-based thermal building codes Thermal building codes exist in many variants, relying on as many different approaches as there are countries. Nevertheless, it seems possible to attempt a classification into five different types (Table 2.3):
• Envelope component approach (Type 1). This approach considers the heat transfer (heat losses or gains) through individual components of the building shell, such as external walls, roof, windows, etc. Typically this standard specifies mandatory maximum k-values (U-values) in terms of W/m2K through the individual component, or a minimum heat resistance (r-value). Most early European building codes in the 1970s were of this type, and today it is still often used for single houses.
• Overall envelope approach (Type 2). This approach sets a limit on the overall heat transfer through the building envelope, but leaves flexibility as to whether more is done to limit the heat transfer through the walls or the roof or the windows, for example. In Australia, the state of Victoria allows two different sets of component values in order to trade off values for the ground floor against those for external walls. This is a simple
5. This section is adapted from a case study prepared for the project by W Eichhammer, F Gagelmann & B Schlomann from FhG-ISI. The full report is available on the WEC web site. This case study has benefited from a variety of inputs from the countries described in the case studies, in particular from the following persons: Joe Huang (Lawrence Berkeley Laboratory, USA), Lang Siwei (Institute of Air Conditioning, China Academy of Building Research, Beijing, China), Randall Bowie (European Commission, DG TREN, Brussels), Y F Kwok & L T Lee (Director of Electrical and Mechanical Services, Hong Kong, China), Fumihiro Sato (Energy Conservation Center, Japan), Jacek Markiewicz & Adam Gula (FEWE Krakow, Poland), Martin Bella (Slovak Energy Agency, Slovakia), K Sirintorn (Department of Energy Development and Promotion, Thailand), and Jim Watson (Science and Technology Policy Research Unit, UK).

Energy Efficiency Policies and Indicators: WEC Report 2001
58
way of setting some overall envelope limit. The limit value specified is typically the mean k-value (U-value or thermal resistance) of the building shell.
Table 2.3. Types of thermal building codes.
Type 1 Type 2 Type 3 Type 4 Type 5Envelope Component
ApproachOverall Envelope
ApproachHeating/Cooling Demand
StandardEnergy Performance
StandardLife Cycle Standard
Limitation of heat transfer(losses/gains) through in-dividual building compo-nents
Limitation of heat transfer(losses/gains) through thebuilding shell
Limitation of the annualheating/cooling demandof buildings
Limitation of the annual(final or primary) energyconsumption of thebuilding
Limitation of the lifecycleenergy / primary energyconsumption of thebuilding
k-value (U-value) or r-value of components:W/m2K (or inverse)
Mean k-value (U-value)or r-value of buildingshell: W/m2K (or inverse)
Mean annual heat-ing/cooling demand perm2 / m3
Mean annual (final orprimary) energy con-sumption per m2 / m3
Lifecycle (primary) en-ergy consumption per m2
/ m3
Includes:• Transmission through
the building envelope• Ventilation losses or
gains• (Passive ) solar gains• Internal heat sources
Includes:• All energy consump-
tion for heating orcooling, includingheating or coolingsystem
• Energy consumptionfor hot water includingdistribution, for venti-lation, lighting, mo-tors/pumps, elevator,...
• All energy gains fromactive solar energy(e.g. PV, solar collec-tors, etc)
Includes:• Energy use for pro-
duction of material andproducts, transport,construction of build-ing, maintenance anddecommissioning
Note: primary energycontents of buildingproducts in Germanycurrently 30% of cu-mulated energy con-sumption (50 years), inthe near future 50 %
• Limitation of heating/cooling demand (Type 3). This type of code also takes into
account the contributions from ventilation losses/gains, passive solar gains through building components (in particular through windows), and internal heat sources. The standard is specified in terms of heating/cooling demand per cubic metre of volume or per square metre of floor area. An example is the building code WSVO 95 currently used in Germany.
• Energy performance standard (Type 4). This standard is the first to consider the whole building as a system. It integrates not only the demand for heating and cooling, but in addition all (or most) of the building equipment such as heating and air conditioning systems, energy for ventilation, hot water preparation, pumps, elevators, etc. In particular, it also includes all active solar energy gains from solar collectors, photovoltaic units, etc. The standard is specified in terms of annual (primary or final) energy consumption per cubic or square metre. Examples of this type are the performance standards in California, the new standards in Germany and France, and the proposed EU building code.
• Life cycle standard (Type 5). This standard is not yet realised in any country, but is under research. In addition to items covered in Type 4, it would include the energy incorporated in the buildings. This recognises that, as energy consumption of buildings becomes lower and lower, so-called “grey energy” (e.g. energy used to produce the insulation materials) becomes more and more important compared to the direct consumption of the building.6 This is certainly a matter of further research, and must be made transparent in future building codes.
6. It has been calculated that in Germany, for example, new buildings already contain 30% of their lifetime energy consumption in the building materials, and that this will rise to 50% with the next generation of low energy houses. In the case of the so-called “zero energy house” (no fossil energy) this is 100%, and calculations have shown that such a house uses more cumulative energy than a low-energy house.

Energy Efficiency Policies and Indicators: WEC Report 2001
59
The most common types of prevailing building code by far are Type 3 and Type 4, i.e. thermal building codes that are performance based. There has been a clear trend away from the component approach prevailing in the 1970s to a performance-based approach. The performance-based approach can be implemented jointly with standards on specific equipment or materials (insulation, windows, boilers), in order to ensure the dissemination of the most efficient equipment in the retrofitting of existing buildings. France adopted such a mixed approach in its national climate change programme in 2000. Towards a regular reinforcement of building codes Over the past 20-25 years, in many cases standards have been reinforced two to four times, including some very recent revisions (Table 2.4). In Europe in particular, standards have been continuously tightened whatever the energy price situation. The effort is not yet finished, as eight EU countries were planning to again reinforce their standards after 2000 (see survey synthesis in Annex 2). The cumulative energy saving achieved for new dwellings, compared to dwellings built before the first oil shock, is about 60% on average in the EU. The additional savings that are targeted with future revisions in the standards is still impressive, at 20-30%.
Table 2.4. Number of revisions of thermal building codes.
Australia USA (California) China European Countries Germany 1 2 (+minor revisions) 2 3-4 (on average) 3 (4)
Hong Kong, China Japan Poland Slovakia Thailand 2 3 3 3 1 (2)
Number in brackets includes planned revisions. Mandatory versus voluntary standards All standards considered in the case studies were mandatory standards, although some countries remain with voluntary standards, e.g. Canada. There is no clear argument in favour of one or the other approach. In the case of mandatory standards, it takes in general 5-6 years to introduce revisions, due to consultative and legislative processes. This time period, however, appears short compared to the lifetimes of the buildings. In terms of effectiveness, there is no proof so far that voluntary approaches have been more effective than mandatory standards. Even economies like Hong Kong, China, which in principle put a strong emphasis on the independent functioning of the market, have opted for a mandatory approach. Types of buildings concerned Most countries cover the whole buildings sector, although there are cases where the residential sector only (Australia) or non-residential buildings only (e.g. Chile; Hong Kong, China; Philippines; Taiwan, China) are covered. In the latter case, this is motivated by the fact that commercial buildings make the largest contribution to energy consumption, and show the strongest increase. Regulations for commercial buildings are usually less severe than for residential, except in less developed countries and economies, where there are usually mandatory standards for large commercial buildings, but not for dwellings (e.g. Chile; Hong Kong, China; Philippines; Taiwan, China).
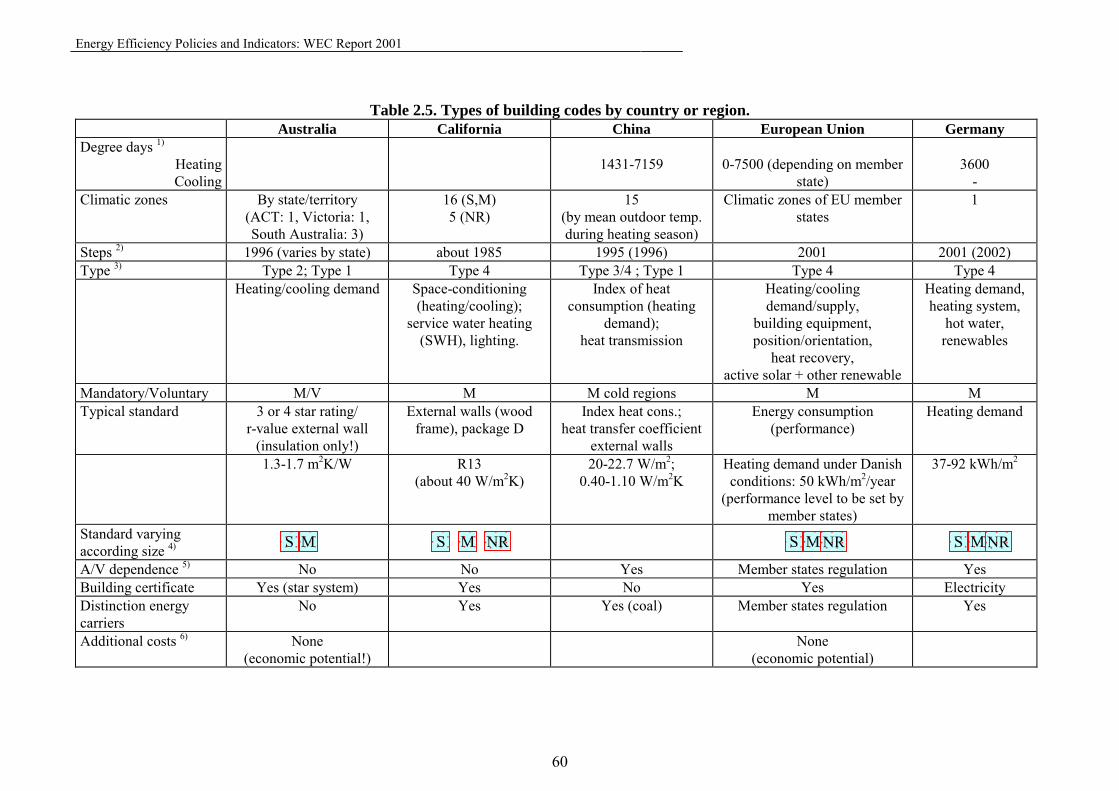
Energy Efficiency Policies and Indicators: WEC Report 2001
60
Table 2.5. Types of building codes by country or region. Australia California China European Union Germany Degree days 1)
Heating Cooling
1431-7159
0-7500 (depending on member
state)
3600
- Climatic zones By state/territory
(ACT: 1, Victoria: 1, South Australia: 3)
16 (S,M) 5 (NR)
15 (by mean outdoor temp. during heating season)
Climatic zones of EU member states
1
Steps 2) 1996 (varies by state) about 1985 1995 (1996) 2001 2001 (2002) Type 3) Type 2; Type 1 Type 4 Type 3/4 ; Type 1 Type 4 Type 4 Heating/cooling demand Space-conditioning
(heating/cooling); service water heating
(SWH), lighting.
Index of heat consumption (heating
demand); heat transmission
Heating/cooling demand/supply,
building equipment, position/orientation,
heat recovery, active solar + other renewable
Heating demand, heating system,
hot water, renewables
Mandatory/Voluntary M/V M M cold regions M M Typical standard 3 or 4 star rating/
r-value external wall (insulation only!)
External walls (wood frame), package D
Index heat cons.; heat transfer coefficient
external walls
Energy consumption (performance)
Heating demand
1.3-1.7 m2K/W R13 (about 40 W/m2K)
20-22.7 W/m2; 0.40-1.10 W/m2K
Heating demand under Danish conditions: 50 kWh/m2/year
(performance level to be set by member states)
37-92 kWh/m2
Standard varying according size 4)
A/V dependence 5) No No Yes Member states regulation Yes Building certificate Yes (star system) Yes No Yes Electricity Distinction energy carriers
No Yes Yes (coal) Member states regulation Yes
Additional costs 6) None (economic potential!)
None (economic potential)
S M NRS M S M NR S M NR

Energy Efficiency Policies and Indicators: WEC Report 2001
61
Table 2.5. Types of building codes by country or region (continued). Hong Kong, China Japan Poland Slovakia Thailand Degree days 1)
Heating Cooling
500-2500
Climatic zones 1 6 1 1 1 Steps 2) 2000 1999 1997 1997 1995 Type 3) Type 3 Type 3/4
Type 2 (S) Type 3 (M, S) Type 1 (S, NR)
Type 3 Type 3
Overall thermal transfer value (OTTV)
Heating/cooling demand
+ building equipment (NR)
Heat demand Heat demand Overall thermal transfer value (OTTV)
Mandatory/Voluntary M M M M M Typical standard OTTV Annual heating +
cooling load Heating demand Heat demand OTTV
30 W/m2 (tower) 70 W/m2 (podium)
81-128 kWh/m2 (S, M) 29-37.4 kWh/m2 (S, M) 85 kWh/m2 (S, M)
45 W/m2 (external walls), 25 W/m2 (roof)
Standard varying according size 4)
A/V dependence 5) No No Yes No No Building certificate Yes Yes No Yes Distinction energy carriers
No No No No No
Additional costs 6) 1) Mean long-term. 2) First year is when the regulation was published in the official journal, the second year is when it became active. 3) See Table 1. 4) Different standards according to single family (S), multi-family residential (M) and non-residential buildings (NR). 5) The surface to volume ratio A/V measures the compactness of the building. Single family houses have higher ratios than multi-family houses. 6) Compared to previous version of building code.
NR S M NR S M NR M NR

Energy Efficiency Policies and Indicators: WEC Report 2001
62
The picture is mixed with respect to a distinctive treatment of single-family, multi-family or non-residential buildings. While some countries require similar standards for all, some countries also use different standards. This takes into account that larger buildings have a much higher degree of complexity and need correspondingly more detailed standards, in particular when it comes to Type 4 standards where all or most of the building equipment is considered. The building as a system The trend towards performance-based standards and the fact that buildings are increasingly understood as a system is best illustrated by the development of standards for non-residential buildings in Japan (Table 2.6). While initially, at best, the building envelope, heating system and/or the air conditioning system were taken into account, over time ventilation, lighting, hot water supply, and elevators have been added. The necessity for such a trend is immediately evident. While in the 1970s the building envelope was the major component in determining energy consumption, with the improvement in the envelope over recent years other end-uses have become more important. In moderate climates in Europe, for example, with the reduction in demand for heating, it becomes interesting to link electricity generation with heat generation, or to link heating and cooling applications. In the future, even single family houses could become more complex with the introduction of renewables and other micro-power systems, such as fuel cells, micro-turbines, CHP based internal combustion engines, etc. This will put new requirements on thermal building codes and increase the trend towards the performance-based types of building codes.
Table 2.6. Development of energy saving standards for non-residential buildings in Japan.
Offices Commodity Stores
Hotels Hospitals/Clinics
Schools Restaurants
Year of notification Facilities
1980
1993
1999
1985
1993
1999
1991
1993
1999
1993
1999
1993
1999
1999
PALMcal/m2 * year
MJ/m2 * year
80
80
72
300
100
90
90
380
110
100
100 420
85
80
340
80
76 320
131 550
CEC/ACCEC for air conditioning
1.6 1.5 1.5 1.8 1.7 1.7 2.6 2.5 2.5 2.5 2.5 1.5 1.5 2.2
CEC/VCEC for ventilation
1.2 1.0 1.2 0.9 1.5 1.0 1.2 1.0 0.9 0.8 1.5
CEC/LCEC for lighting
1.0 1.0 1.2 1.0 1.2 1.0 1.0 1.0 1.0 1.0 1.0
CEC/HWCEC for hot water supply
1.7 1.6 1.5 1.8 1.7
CEC/EVCEC for elevator
1.0 1.0 1.0
Source: Energy Conservation Center, Japan.
Heat demand
Ventilation
Lighting
Hot water supply
Elevators
Air conditioning

Energy Efficiency Policies and Indicators: WEC Report 2001
63
Reduction of complexity In the trend towards performance-based thermal building codes, many countries have developed computer tools to allow professionals to evaluate the performance of a building. Verifying compliance with the codes has become a rather difficult mathematical exercise. For example, California has tried to reduce the complexity of the calculations by defining in its standards preset packages which can help professionals, and also home owners, to check whether buildings correspond to the latest norm.
2.4.2. Impact of Measures and Programmes Increased flexibility or lack of progress? It is not a simple matter to assess over time the impact of mandatory thermal standards, as in many countries these standards are continuously changing, moving from a component-based approach to a performance-based approach. For increased flexibility there is a price to pay, which is decreased transparency (and also greater difficulty in making comparisons between countries). This is illustrated in Figure 2.8 by looking at the latest revision of the German building codes (from Type 3 to Type 4). The new German code takes into account the shape of the building, i.e. the requirements allow for a not so favourable surface to volume ratio. To a certain degree this can be criticised, because it favours the trend towards less compact building shapes. In contrast, the Chinese approach explicitly specifies higher requirement levels for unfavourable building shapes, and even tries to prevent such forms being built at all. In Germany, the consequence is that while at compact building shapes the new building code is about 30% better than the old one with respect to heating demand (see red line in Figure 2.8),7 at higher surface to volume ratios the new building code is only 8% better than the old one. Therefore, certain groups have questioned whether energy efficiency progress with the new code is substantial enough, or whether the increased flexibility partially hides a lack in progress.
7. Due to the increased flexibility, comparison between the two sets of standards is not easy: here the comparison is made taking into account a standard heating system. By integrating into the building a high performance heating system, the requirements on the building shell would be even more relaxed, so that in certain cases the building shell could be less efficient with the new building code than with the old one.

Energy Efficiency Policies and Indicators: WEC Report 2001
64
Figure 2.8. Pending energy saving regulations in Germany compared to existing building code (WSVO 1995).
A/V-ratio (Surface/Volume) [1/m]
WSVO ‘95Yearly heating energydemand
WSVO ‘95Yearly heating energydemand
Low energy houseYearly heating energydemand
Low energy houseYearly heating energydemand
Draft EnEV 2000Yearly primary energyconsumption for heating
Draft EnEV 2000Yearly primary energyconsumption for heating
Draft EnEV 2000Yearly heating energydemand
Draft EnEV 2000Yearly heating energydemand
kWh/
m2*
a
Assessment of the impact of thermal building codes: lack of field evaluation The second reason why it is difficult to assess the impact of building codes is the absence of real field studies on their impact. Very few countries investigated here have really looked at the impact of their codes. In most cases, compliance with the codes is only verified ex-ante – if the building complies with the prescribed construction methods and materials then it is assumed that the thermal building code is fulfilled. However, in the future it will be increasingly difficult to verify this compliance, given the greater flexibility and complexity of new buildings, and also their low energy demand – improper construction (e.g. thermal bridges) will increasingly influence the result. In the future, ex-post evaluation of a certain number of buildings will become of first importance in order to understand the impact of the measure. In the context of energy audits, some countries have investigated the issue of compliance with the codes, in particular in the non-residential sector. Instructive is the example of Hong Kong, China. Checks on a number of buildings revealed that all buildings complied with the regulation: in fact, over half of the towers (high-rise buildings) checked were more than 40% better than the standard; in the case of podiums (the lower and larger parts of high-rise buildings), 90% were nearly 50% better than the standard. This indicates that the standard was not set at a proper performance level; actually, much more stringent values were initially proposed (see Hong Kong, China case study in Annex 1). Though this cannot be proven statistically, in some countries it is thought that 15-20% of buildings do not comply with the standards (if they are set strictly), and it can be guessed that this fraction is going to increase in the future. The questions now are, at what level should standards be set, and how often should they be revised? The question can also be raised of whether mandatory standards spur or hinder technical progress.

Energy Efficiency Policies and Indicators: WEC Report 2001
65
The case studies answer these questions to a certain degree. In countries where building codes have not been substantially revised or have been set at an undemanding level, such as California and Hong Kong, China, mandatory standards cannot spur progress. On the other hand, the new European building code is the first that explicitly takes into account the dynamics of standard setting, research and market penetration of new technologies, by requiring a regular revision of the codes in order to keep up with technical developments.8 However, with this second approach the issue of compliance becomes critical, and it also limits progress to steps at least 5-6 years apart, the time which is needed to introduce a new generation of codes. Impact of thermal building codes at the macro level Investigations in many countries have not yet conclusively demonstrated the impact of the introduction of thermal building codes, for example, in terms of reduced energy consumption for space heating by dwelling or per capita. In many cases, it can be observed that these indicators have been quite stable over the past 25 years, or have even increased. On the other hand, some countries have made three or four major revisions to their codes in this period, with each time an improvement of up to 30% compared to the previous code. These observations seem somehow in contradiction, but can essentially be explained by two factors. First of all, the penetration of more efficient buildings in the total stock is extremely slow, given the long lifetime of buildings. Figure 2.9 illustrates this, with the hypothetical example of three major thermal building code revisions in 1975, 1985 and 1995, improving each time the performance of new buildings by 30%. After 26 years, the stock would have improved its performance by only 12%. Secondly, there is an increasing demand for comfort. For example, if heated and cooled surfaces have increased by 10-20%, as has been the case in Europe over the past quarter of a century, it is not surprising that indicators in terms of energy consumption per dwelling do not show substantial progress. To these two factors can be added a certain degree of non-compliance with the code. These two factors illustrate the long-term nature of these measures, and the importance of considering measures for the existing building stock in the shorter term (for example, through standards on components). This also raises the question of increasing comfort levels and whether or not limits should be set on this trend, i.e. whether to increase prices for higher comfort levels or to push more strongly the technology component of the measure.
8. Case studies in Germany on environmental standards have shown that the way the standards are designed, introduced and perceived has a critical impact on their role in the innovation process for new environmentally friendly technologies. They are not per se hindering progress, but progress is not per se spurred by approaches relying on market mechanisms or voluntary approaches.

Energy Efficiency Policies and Indicators: WEC Report 2001
66
Figure 2.9. Theoretical impact of three building code revisions on the energy consumption of the building stock.
86
88
90
92
94
96
98
100
102
1965 1970 1975 1980 1985 1990 1995 2000 2005
inde
x
Source: Calculation with MURE database (www.mure2.com).
2.4.3. Conclusions and Recommendations A few common features The case studies considered present a variety of common features: ♦ Revisions in thermal building codes have become increasingly regular (about every 6-8
years compared to 12-13 previously; every 5 years is sometimes envisaged). There are notable exceptions, such as California, which had its last major revision in the 1980s, but the new proposed building directive of the EU has for the first time integrated provisions for revising the building codes every five years.
♦ Typically, two to four rounds of thermal building code revisions occurred in the last 25 years for the countries considered.
♦ Standards have become increasingly complex, and now mostly consider the whole building system.
♦ Type 4 codes (performance-based for energy consumption of the building system) is prevailing, but with different degrees of complexity depending on the equipment which is integrated: heating/cooling, hot water, lighting, energy for motors/pumps, elevators, etc.
♦ Simpler buildings (single family) are often still on Type 1 codes (component standards), or sometimes Type 3 (including heating/cooling demand but excluding building equipment).
♦ In a variety of cases, building codes start to put pressure on heating equipment if it is older than 15 years or its performance is low (for example in the EU, Germany).
♦ The complex calculations to show compliance with the code are often carried out with the aid of computer programmes. As an alternative, predefined packages are often also allowed for buildings.

Energy Efficiency Policies and Indicators: WEC Report 2001
67
♦ It might sound contradictory, but the introduction of sophisticated calculation procedures and the move towards performance-based indicators has made it easier to introduce building certificates, for example, in the form of “number certificates” (Germany) or a star system (Australia). Building certificates enable the buyer to know the energy consumption of the dwelling. These certificates have some similarities with the labelling of electrical appliances (see Chapter 4), but they are more complex.
♦ Relatively few countries have carried out field evaluations of their thermal building codes, for example, through energy audits.
♦ Only a few countries have estimated the additional costs which each round of new building codes has caused. Nevertheless, from the few results available it can be estimated that the additional costs of building were limited to a few percentage points, if any at all, as quite a few countries have taken the precaution of limiting the standards to the economic potential of energy efficiency in buildings. This potential needs to be further extended by R&D on the building system.
In the future ♦ There will be an increasing integration of renewable and micro-power systems into the
building codes, which will make it necessary also for single family houses to be subject to more complex performance-based building codes.
♦ The increasing complexity of non-residential buildings may require a more thorough classification of such buildings.
♦ Uncertain still is the impact of air conditioning in economies in transition and developing countries, which is particularly energy intensive and relies on electricity and thermal power. Mandatory standards for this specific type of equipment could be necessary.
♦ Increasingly, energy consumption on a life cycle basis will have to be taken into account in building codes, as the energy consumption of buildings continues to drop (today 30% of lifetime consumption is accounted for by energy used in materials and construction, and this will rise to 50% or more).
♦ There is an increasing need for field evaluations of the real performance of buildings. These would best be carried out in combination with energy audits, which serve additional purposes. The example of Thailand is instructive in this respect – energy audits have been introduced on a mandatory basis for so-called designated facilities (this includes larger buildings).
♦ Existing buildings present the largest short-term potential in the building sector. However, for various reasons, they can be tackled by mandatory standards only in the case of larger extensions to existing buildings. For this reason, alternatives have to be developed, e.g. incentive programmes, as in Germany.

Energy Efficiency Policies and Indicators: WEC Report 2001
68
2.5. Labelling and Efficiency Standards for Household Electrical Appliances9
Household electricity consumption is increasing dramatically in both industrialised and developing countries, with an increase in the use of lighting and rising ownership of household appliances and electronic equipment. In industrialised countries, saturation in the ownership of larger appliances is offset by the continual diffusion of new appliances, for example, personal computers. To slow down and even reverse this trend, many countries have introduced energy efficiency programmes. Among the different instruments available, labelling programmes and minimum energy performance standards (MEPS) have proved to be very effective. Most countries first focused on refrigerators, along with air conditioners in certain countries, since they account for a large part of household electricity consumption (in Europe, 20-30% depending on the country).
2.5.1. Description of Measures and their Diffusion
2.5.1.1.Labelling Providing information to consumers on the energy efficiency performance of new appliances is a well-known and widespread energy efficiency measure. It is usually referred to as labelling. Labelling programmes aim at drawing the attention of consumers to the energy consumption of their appliances. Indeed, lack of information is generally considered to be one of the main barriers to improving energy efficiency. Labelling programmes may differ from one country to the next, although two general approaches exist: “comparison labels” and “endorsement labels” (Figure 2.10). Comparison labels enable consumers to compare the energy efficiency of all the appliances on sale (e.g. European Label, or Energy Guide in the USA). Endorsement labels simply identify appliances which are particularly energy efficient (e.g. Energy Star in the USA). Comparison labels are usually mandatory, which implies regulation. Indeed, it is only meaningful if all manufacturers provide the information, and if the information is expressed in a similar way. Manufacturers usually implement endorsement labels on a voluntary basis. Mandatory labelling for several electrical appliances exists in all EU countries based on the same regulations (EU directives). The EU regulation is mandatory and replaces the existing national regulation. The EU labels give each appliance a grade between A and G (with A most efficient), a corresponding easy-to-read colour code (red for G, green for A), and the average specific consumption in kWh/year (Figure 2.10). For the first year, the regulation only concerned refrigerators and freezers; it was later extended to other appliances (washing machines, dish washers and lamps). These labels are also applied or under implementation in some non-EU countries in Europe (e.g. Norway, Hungary, Baltic countries, Czech Republic, Slovakia, Slovenia) and in other regions (e.g. Mexico, Brazil, Iran) (Table 2.7).
9. This section is based on a case study prepared for the project by P Menanteau from IEPE. This case study is available as a separate document on the WEC web site: “Labelling programs and efficiency standards for household electrical appliances”, ADEME and IEPE, September 2000.

Energy Efficiency Policies and Indicators: WEC Report 2001
69
Figure 2.10. Examples of endorsement and comparison labels.
Endorsement labels
Energy Star (USA) E 2000 (CH)
Comparison labels
USA Australia EU In the Asia Pacific region, about three-quarters of the economies studied have implemented a label, some very recently, such as Japan, Indonesia and the Philippines. Unlike Europe, they are not always mandatory – they are voluntary in Japan and Hong Kong, China. Another difference with Europe, due to climatic conditions, is that labelling programmes also concern air conditioners – these are often the first appliances to be labelled (e.g. Mexico; Taiwan, China; Hong Kong, China; Philippines) (Table 2.8).

Energy Efficiency Policies and Indicators: WEC Report 2001
70
Table 2.7. Labelling in OECD countries: implementation status.
Mandatory Voluntary Planned Refrigerators EU, Norway, Hungary,
Canada, Korea, Mexico, New Zealand, USA
Switzerland, Japan, USA
New Zealand, Turkey*, Czech Republic*, Slovakia*
Washing machines EU, Norway, Hungary, USA
USA New Zealand, Czech Republic*, Slovakia
Air conditioning Canada, Korea, Mexico, USA
Japan, USA New Zealand
Lamps EU, Norway USA Notes: EU - 15 countries; USA – mandatory or voluntary depends on states; * planned for 2001.
Table 2.8. Labelling in non-OECD countries: implementation status.
Mandatory Voluntary Planned Refrigerators Brazil; Taiwan, China;
Iran; Philippines; Thailand; Romania; Algeria; Slovenia
Hong Kong, China China; Colombia; India; Indonesia; Malaysia; Peru; Vietnam; Bulgaria; Estonia; Latvia; Lithuania
Washing machines Slovenia Hong Kong, China Brazil; China; Colombia; Vietnam; Peru; Bulgaria; Estonia; Latvia; Lithuania; Romania; Egypt
Air conditioning Brazil; Taiwan, China;Philippines; Thailand
Hong Kong, China China; Colombia; India; Indonesia; Malaysia; Peru; Vietnam; Egypt
Lamps Philippines; Slovenia Hong Kong, China Taiwan, China; Indonesia; Romania
Labels can be considered a first step towards efficiency standards.
2.5.1.2.Efficiency Standards Performance standards for electrical appliances, usually known as minimum energy performance standards (MEPS), impose a minimum energy efficiency rating or a maximum consumption for all the products on the market. In some countries, they aim at a sales-weighted average energy efficiency (“target values” in Switzerland, or the “Top Runner Program” in Japan). Some programmes rely on the voluntary participation of manufacturers (e.g. washing machines in Europe, Iran, Brazil). Efficiency standards levels may be set in a number of different ways. In Europe, a statistical approach is used – the energy efficiency of appliances already on the market is used as a basis and the standard is drawn up so as to obtain an improvement of 10-15% in the average energy efficiency of new appliances. In other countries, regulations are based on a cost-benefit evaluation (e.g. in the USA, to raise the energy efficiency of appliances to a level which corresponds to a return on the investment in 3 years). In Europe, several countries introduced voluntary agreements in the 1980s and 1990s (Germany in the 1980s, Nordic countries in the 1990s, Switzerland in 1995). Since 1999, an

Energy Efficiency Policies and Indicators: WEC Report 2001
71
EU directive has defined mandatory energy efficiency standards for refrigerators and freezers in EU countries. Japan chose a different approach, that consists of defining a voluntary target for energy efficiency improvement by a given year (2004). Apart from the USA, Canada and EU countries, efficiency standards exist for refrigerators, washing machines and air conditioners in: Australia; Mexico; Taiwan, China (except washing machines); Romania (refrigerators only); and the Philippines (since 1993 for air conditioners). Minimum efficiency standards are planned in the near future for refrigerators and air conditioners in several additional countries: for refrigerators in Korea, Indonesia, Slovakia, Turkey, Lithuania and India; and for air conditioners in Korea, Indonesia and India.
Table 2.9. Mandatory efficiency standards in OECD countries: implementation status.
Mandatory Voluntary Planned Refrigerators EU, Australia, Canada,
Japan, Mexico, USA Switzerland Turkey, Korea*
Washing machines Australia, Canada, Mexico, USA
EU, Switzerland Korea*, Japan
Air conditioning Australia, Canada, Japan, Mexico, USA
Korea*
Notes: Target values for 2004 for Japan; * 2001.
Table 2.10. Efficiency standards in non-OECD countries: implementation status.
Mandatory Planned Refrigerators Brazil; China; Iran;
Romania; Taiwan, China Colombia2; India2; Indonesia; Malaysia; Peru; Lithuania; Latvia1; Slovenia1; Egypt
Washing machines China Taiwan, China1; Peru; Lithuania; Slovenia1; Latvia1; Egypt
Air conditioning Taiwan, China; China; Philippines
Colombia2; India2; Indonesia; Malaysia; Peru; Slovenia1; Latvia1; Egypt
1 2001; 2 2002.
2.5.2. Impact of Measures and Programmes Generally speaking, experience has shown that labelling programmes and performance standards are effective instruments both for governments (low-cost energy savings) and consumers (lower expenditures). Labelling schemes have improved over time and are becoming easier to transpose The difficulties encountered with the first labelling schemes (e.g. Energy Guide in the USA and earlier labels in Europe) served as a lesson for recent programmes. Label formats and content are no longer determined by engineers alone but also by marketing experts, thereby ensuring that the label is appropriate for the target public. Consumers not only have to recognise the label but also have to be able to interpret it. The European label, for example, is easy to understand and was recently adopted in several developing countries (Brazil, Iran and Mexico). Thailand has adopted the Australian model.

Energy Efficiency Policies and Indicators: WEC Report 2001
72
Figure 2.11. Transfer of energy labels (Thailand, Mexico, Iran).
The same labelling programme may not produce comparable results in all countries, as consumers may react differently depending on the culture of the country and the diversity of the product ranges available, especially in developing countries. Comparison labels are more effective than endorsement labels By helping consumers identify the most energy efficient products and choose more efficient models, comparison and endorsement labels encourage manufacturers to focus on improving energy efficiency. Although these two types of labels can be complementary (e.g. in Brazil for refrigerators), comparison labels are considered to be the most effective since they enable comparison of all the appliances on the market rather than simply identifying the most efficient ones. That is why comparison labelling is generally mandatory. Nevertheless, voluntary comparison labelling programmes also exist, and some have proved their effectiveness (e.g. in Thailand). Impact of labelling programmes on the market In European countries, evaluations indicate increased sales of more energy efficient appliances over the period 1995-97 (Figure 2.12), though with differing results depending on the country (greater impact in northern countries). The introduction of labelling has thus resulted in a transformation of the market. This transformation has stemmed from both changes in consumer preferences and changes in the structure of sales – indeed, manufacturers have discontinued some inefficient models that had become difficult to sell and have gradually introduced new, more efficient products. This impact on innovation strategies is one of the main purposes of labelling. Introducing energy labelling encourages manufacturers to develop more energy efficient products so as to distinguish themselves from their direct competitors. Voluntary versus mandatory standards? Some countries have negotiated voluntary energy efficiency standards with manufacturers. The limits of such agreements have been demonstrated in Brazil, where some inefficient models have not been withdrawn from the market. In Switzerland and Japan, voluntary agreements have produced more convincing results – in the first case, the government threatened to introduce restrictive regulations in the event of failure, and in the second, the commercial consequences of not meeting the objectives would be considered too negative for manufacturers.

Energy Efficiency Policies and Indicators: WEC Report 2001
73
The European Commission has also set up agreements of this type for washing machines and consumer electronic equipment, with certain success. These agreements were implemented under very specific conditions, including quantified commitments and effective monitoring, after wide consultation with existing manufacturers. The strong negotiating power of the European Commission, which was ready to implement mandatory standards, was the main force responsible for this apparent success.
Figure 2.12. Sales of refrigerators and freezers of label class A and B in
the EU.
Source: 1994-1997 ADEME/SAVE Monitor, 1998-2001 estimates from GFK The efficiency level imposed by standards varies from one country to the next. In the case of China, standards have had very little impact, since most appliances on sale already complied with the proposed standards. In Europe, standards have had a greater impact (40% of the appliances on the market in 1996 did not comply with the standards which were introduced in 1999), while in the USA the effect has been considerable (no refrigerator in the US market at the end of the 1980s met the standards introduced in 1993). Energy savings from labelling and standards programmes It is difficult to measure the impacts of these programmes themselves in terms of energy savings, as other factors may intervene at the same time, as explained above. What can be observed is a reduction in the average consumption of the electrical appliances that are targeted in the programmes. Figure 2.13 shows the trends in the specific consumption of cold appliances in the EU, following the introduction of labelling. The savings brought about by standards for refrigerators and freezers have been very significant in Japan (63% between 1976 and 1983, until the removal of standards) (Figure 2.14), and in the USA (67% between 1973 and 1999) (Figure 2.15).
0
1 0
2 0
3 0
4 0
5 0
6 0
re fr ig e ra to rs re fr ig e ra to rs o n ly re fr ig e ra to r-fre e z e rs fre e z e rs c o ld a p p lia n c e s
%
1 9 9 41 9 9 51 9 9 61 9 9 71 9 9 81 9 9 92 0 0 0

Energy Efficiency Policies and Indicators: WEC Report 2001
74
Figure 2.13. Specific consumption of new refrigerators and freezers in the EU.
Figure 2.14. Impact of efficiency standards on refrigerators and freezers in Japan.
Note: removal of standards in 1983
200
250
300
350
400
450
500
550
refrigerators refrigerators only refrigerator-freezers
freezers cold appliances
kWh/
year 1994
199519961997
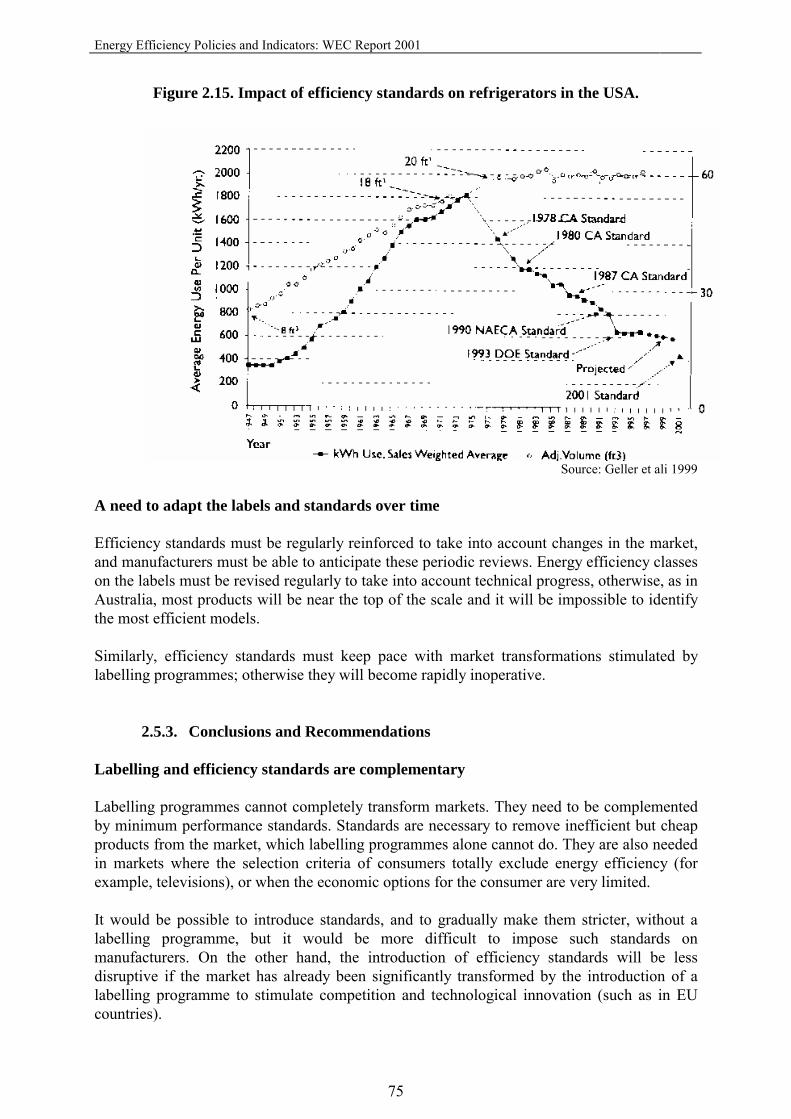
Energy Efficiency Policies and Indicators: WEC Report 2001
75
Figure 2.15. Impact of efficiency standards on refrigerators in the USA.
Source: Geller et ali 1999 A need to adapt the labels and standards over time Efficiency standards must be regularly reinforced to take into account changes in the market, and manufacturers must be able to anticipate these periodic reviews. Energy efficiency classes on the labels must be revised regularly to take into account technical progress, otherwise, as in Australia, most products will be near the top of the scale and it will be impossible to identify the most efficient models. Similarly, efficiency standards must keep pace with market transformations stimulated by labelling programmes; otherwise they will become rapidly inoperative.
2.5.3. Conclusions and Recommendations Labelling and efficiency standards are complementary Labelling programmes cannot completely transform markets. They need to be complemented by minimum performance standards. Standards are necessary to remove inefficient but cheap products from the market, which labelling programmes alone cannot do. They are also needed in markets where the selection criteria of consumers totally exclude energy efficiency (for example, televisions), or when the economic options for the consumer are very limited. It would be possible to introduce standards, and to gradually make them stricter, without a labelling programme, but it would be more difficult to impose such standards on manufacturers. On the other hand, the introduction of efficiency standards will be less disruptive if the market has already been significantly transformed by the introduction of a labelling programme to stimulate competition and technological innovation (such as in EU countries).

Energy Efficiency Policies and Indicators: WEC Report 2001
76
Basically, labelling stimulates technological innovation and the introduction of new, more efficient products, while standards complement this development by enforcing the gradual removal from the market of the least energy efficient appliances. Cooperation with manufacturers In general, appliance manufacturers tend to be opposed to the introduction of efficiency standards, which they claim impose costly adaptations and burden consumers with additional costs. In certain situations, however, manufacturers have cooperated: in Europe, where common labelling has meant identical standards for all member states; in the USA, where federal standards have avoided an increasing number of different standards at the state level; and in certain Asian countries, where standards have protected the domestic market from imports of low-cost competitive products. In such cases, the implementation of standards is facilitated. When public and private interests are conflicting, the process may be longer and be more costly. Accompanying measures Labelling programmes and performance standards are effective in promoting energy efficiency, but their effectiveness can be reinforced when they are accompanied by other instruments (e.g. information and training, financial incentives, or technology procurement). Accompanying measures involving appliance distributors and retailers can help reinforce the impact of a labelling programme. Experience has shown that the training of sales staff and support given to distributors reinforces the effectiveness of labelling programmes. Similarly, public awareness campaigns designed to improve recognition of the labels and facilitate their interpretation are essential for the success of these programmes (e.g. Thailand). In certain countries, financial incentive programmes, as a complement to labelling, have also proved successful in encouraging the diffusion of energy efficient appliances (e.g. Brazil). In Europe, a technology procurement programme was recently introduced to stimulate technical innovation in very energy efficient products – this will ultimately enable a revision of efficiency classes and standards. Such a programme of public technology procurement is identified in the recent European Climate Change Programme as a measure to be implemented at the EU level. A need to extend programmes in developing countries Most industrialised countries have now adopted labelling programmes and standards. In these countries they are gradually covering an increasing number of appliances. The situation is different in the developing world, where only a few countries have introduced such programmes, and where they are often applied to a limited number of appliances (essentially refrigerators and air conditioners). It would perhaps be advisable to plan a rapid expansion of programmes to promote energy efficiency in these countries, at least for appliances which are highly energy intensive, so as to ensure that inefficient appliances, which can no longer be retailed in countries protected by standards, do not appear in such markets.

Energy Efficiency Policies and Indicators: WEC Report 2001
77
2.6. Fiscal Measures on Cars and Motor Fuels10 This chapter focuses on fiscal policies towards car ownership and use. It includes also some comments on economic incentives. The share of car-related expenditure in household budgets (around 15%) suggests that these policies should have an influence on the key factors which affect energy use and CO2 emissions by cars: ownership levels, annual usage, and specific consumption/emissions. Fiscal policies include taxes on car purchases, ownership and fuel, as well as road user charges. Incentive measures include those for scrapping old cars and the introduction of clean and efficient cars.
2.6.1. Car Purchase Tax The first level of taxation is on car purchases (Figure 2.16). Some countries rely only on the value added tax (VAT) system, with cars taxed at the normal rate, and registration fees which are of minor importance. This is very often the case in car producing countries, such as France, Germany, the UK and Italy. It is now also the case in Sweden, where a specific tax on car purchases existed up to 1997. In other countries, there may be specific tax on car purchases. Some, such as the “gas-guzzler tax” in the United States, are only designed to restrain sales of high-consumption cars. Car manufacturers have the ability to adapt through technology, and the effect is relatively limited because only a few cars are affected. In other cases, such taxes result from long-term policies designed to deter people from buying a car – this is the case in Singapore, Denmark, Norway and Finland, and also in some developing countries where cars are an important component of imports. Even though these taxes may be based on technical characteristics, their level is mainly dependent on the vehicle’s price. The pre-tax price of the car reflects indirectly the level of consumption, since consumption is related to weight and power.
Figure 2.16. Average car purchase tax, excluding VAT (US$/vehicle).
Source: ADEME/WEC survey.
10. This section is based on a case study prepared for the project by J P Orfeuil of Paris University. This case study is available on the WEC web site: “Tax regimes and CO2 emissions.”
0
2 0 0 0
4 0 0 0
6 0 0 0
8 0 0 0
1 0 0 0 0
1 2 0 0 0
1 4 0 0 0
1 6 0 0 0
Belgium
Greece
Switzerl
and
Roman
ia UK
Hunga
ry
Malays
ia
France
Japa
nSpa
in
Slovak
ia
Austria
Portug
al
Irelan
d
Netherl
ands
Norway
Finlan
d
Denmark
US
$

Energy Efficiency Policies and Indicators: WEC Report 2001
78
There is now some concern about unintended effects from such taxes. First, high taxes can deter consumers from buying new cars, and thus the penetration of new technologies is slower. Second, a high level of tax on car purchases concentrates the new car market on the most affluent part of the population, whose tastes may be more oriented towards higher consumption cars. Third, with the introduction of new technologies, there are now new cars which are more expensive because they are more efficient; a US$600 additional cost at market price for improved fuel economy may translate into US$1500 when taxes are included in the Danish system. Fulton (IEA, 2000) considers that this may be an explanation for the difference between Germany and Denmark in the rate of introduction of improved technologies. Furthermore, Table 2.11 suggests that there is a wide variation in the specific consumption of similar cars, so that price-based taxation is a poor proxy for CO2 taxation. A more direct consideration of specific consumption should contribute more effectively to the limitation of CO2 emissions.
Table 2.11. Reference specific consumption of new cars sold in IEA countries (litres/100 km).
Best diesel Best gasoline Worst
Subcompact 4.4 5.8 9.6 Compact 5 7 11.1 Midsize 5.2 7.4 12.1 Large 6.6 8.8 13.6 SUV 7.8 8.6 16.6 Source: Lew Fulton, Fuel economy improvement, policies and measures to save oil and reduce CO2 emissions, International Energy Agency, UNFCCC COP 6, The Hague, 2000. Fuel economy cost curves presented by Fulton show the cost of introducing better technologies for a given type of vehicle. Fulton estimates that for Denmark, Germany and the USA, fuel economy for new cars as high as 2 litres/100 km is achievable for as little as US$600 (before tax) per car. Market studies show that consumers do not necessarily take this trade-off into account, because their own discount rate is quite high (a 20% figure is estimated).11 As a result, car manufacturers do not introduce these technologies at the optimal rate. Economic studies show that schemes which give tax reductions for vehicles which meet a given consumption target can provide significant improvements at low economic and political costs. Such schemes have been studied but not applied in the USA. In Europe, some countries (such as Austria) integrate fuel consumption or CO2 emissions as a component in the basis for taxation. Some others (such as France) offer subsidies for LPG or electric cars (see Annexes 1 and 2).
2.6.2. Car Ownership Tax The second level of taxation is on car ownership (Figure 2.17). Consumers will take an annual registration tax into account in their car-buying decisions (whether a new or a used car). The main advantage of such a tax is its visibility. Because it is not associated with any other payment, people are aware of the level of the tax, and car manufacturers take it into
11. For example, a car consuming 1 litre less per 100 km, driven for 15 000 km/year for 10 years will provide (at US$1 per litre), a US$1500 saving. This saving is US$1200 at a discount rate of 5%, US$750 at a discount rate of 20%.

Energy Efficiency Policies and Indicators: WEC Report 2001
79
account in their strategy.12 In most countries, this tax varies according to an index representative of the power of the car, which has a link with the fuel consumption. On the other hand, this link is not absolute and in few cases a more powerful engine may be more efficient. A move towards more explicit consideration of CO2 emissions can be observed in a few countries (see Annexes 1 and 2).
Figure 2.17. Annual tax on cars.
Source: ADEME /WEC survey 2.6.3. Taxation on Motor Fuels
The third level of taxation is related to motor fuels. There are large differences between countries in the taxation of motor fuels, both gasoline and diesel. In Europe, such taxes are definitely much higher than in the rest of the world, for three reasons: 1. Most European countries are oil importers. 2. Revenue from motor fuel tax is an important source of income for the government
budgets. 3. There is a strong commitment to meet Kyoto targets, and one way to do this is to regularly
increase the tax on motor fuels (by adding CO2/environmental taxes). The last phenomenon is clear in Denmark, Germany and the UK, and to a lesser extent in the Netherlands and Austria (Figures 2.18 and 2.19). There are two aspects to motor fuel taxes: the average level of taxes, and the difference between fuels (gasoline and diesel). The level of fuel taxes can be compared to an index of national wealth (for example, the per capita GDP) to appreciate their weight. This indicator shows a clear hierarchy: it is lowest for the USA, then come Australia and Canada, then Switzerland, and then the 15 EU countries.
12. In France, for example, a significant step in the ownership tax at the 8 fiscal horse power threshold has been an incentive for car manufacturers, and for consumers to choose cars under the threshold.
0
50
100
150
200
250
300
350
400
450
France
Roman
ia
Russia
Portug
al
Hunga
rySpa
in
Finlan
d
Greece
Hong K
ong UK
Austria
Switzerl
and
Chines
e Taip
ei
Norway
Denmark
Sweden
Irelan
dKore
aJa
pan
Netherl
ands
US
$
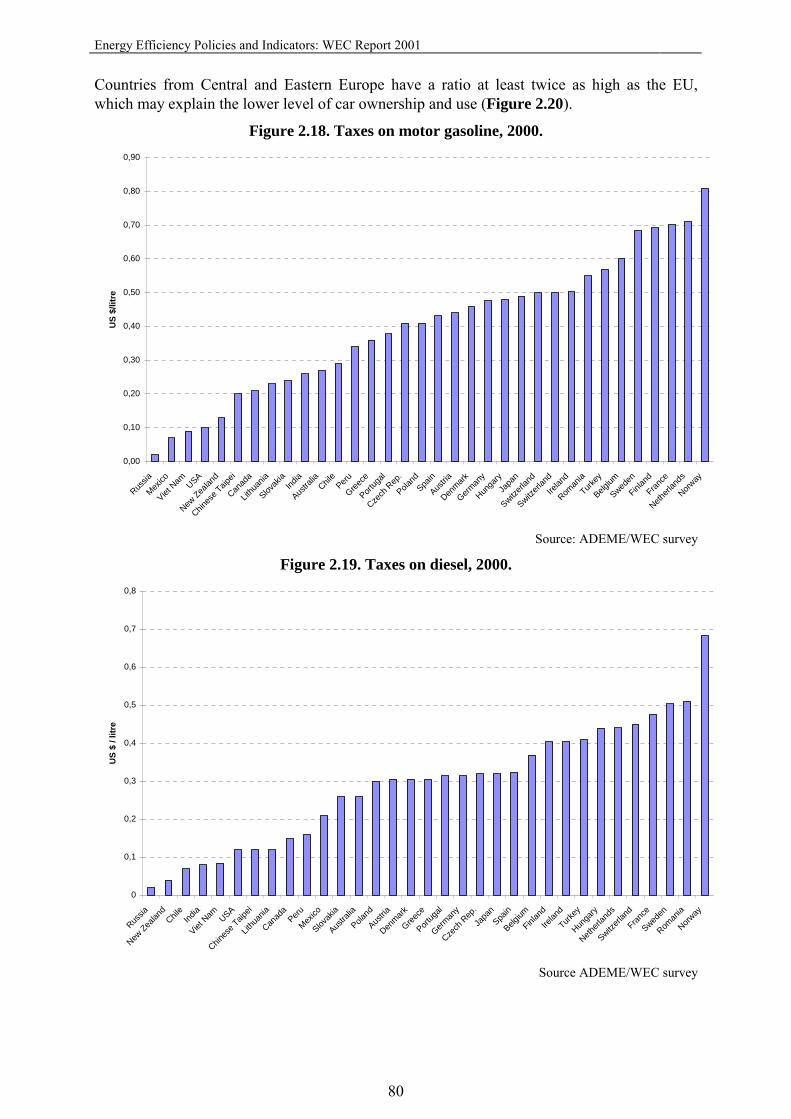
Energy Efficiency Policies and Indicators: WEC Report 2001
80
Countries from Central and Eastern Europe have a ratio at least twice as high as the EU, which may explain the lower level of car ownership and use (Figure 2.20).
Figure 2.18. Taxes on motor gasoline, 2000.
Figure 2.19. Taxes on diesel, 2000.
0,00
0,10
0,20
0,30
0,40
0,50
0,60
0,70
0,80
0,90
Russia
Mexico
Viet N
am USA
New Zea
land
Chines
e Taip
ei
Canad
a
Lithu
ania
Slovak
iaInd
ia
Austra
liaChil
ePeru
Greece
Portug
al
Czech
Rep
.
Poland
Spain
Austria
Denmark
German
y
Hunga
ryJa
pan
Switzerl
and
Switzerl
and
Irelan
d
Roman
ia
Turkey
Belgium
Sweden
Finlan
d
France
Netherl
ands
Norway
US
$/lit
re
Source: ADEME/WEC survey
0
0,1
0,2
0,3
0,4
0,5
0,6
0,7
0,8
Russia
New Zea
land
Chile
India
Viet N
am USA
Chines
e Taip
ei
Lithu
ania
Canad
aPeru
Mexico
Slovak
ia
Austra
lia
Poland
Austria
Denmark
Greece
Portug
al
German
y
Czech
Rep
.
Japa
nSpa
in
Belgium
Finlan
d
Irelan
d
Turkey
Hunga
ry
Netherl
ands
Switzerl
and
France
Sweden
Roman
ia
Norway
US
$ / l
itre
Source ADEME/WEC survey

Energy Efficiency Policies and Indicators: WEC Report 2001
81
Figure 2.20. Gasoline tax index (ratio of the tax for 1000 litres to the GDP per head).
Source: ADEME/WEC survey and OECD GDP index With regards to the average price level, many studies (Goodwin, 1988; Orfeuil, 1990; Johansson and Schipper, 1997) have demonstrated a link between the quantity of fuel used and the price over time. Their results are consistent, and converge towards a long-run elasticity of fuel consumption to fuel price of -0.7. While the short-term elasticity is not very high (between -0.2 to -0.3), the long-term elasticity is quite significant: in the long run, a 10% increase in the price of motor fuel leads to a 1% reduction in the car stock, a 2% reduction in the mileage per car, and a 4% increase in fuel efficiency (i.e. a total reduction in consumption of 7%) (Table 2.12.). The intervals of variation around the median of these estimates are relatively large, which means that other components of policy (other types of fiscal and non-fiscal measure) are of importance as well.
Table 2.12. Long term elasticity of car fuel demand with fuel price.
Effect of fuel tax on: Median estimate of the elasticity Vehicle fleet -0.1 Specific consumption -0.4 Annual distance driven per car -0.2 Fuel demand -0.7 Travel demand -0.3 Source: Johansson & Schipper, Measuring long run fuel demand of cars, Journal of Transport Economics and Policy, 1997.
0
50
100
150
200
250
US
Canad
a
Austra
lia
Switzerl
and
Denmark
Austria
German
y
Irelan
d
Norway
Belgium
Sweden
Finlan
dSpa
in
Netherl
ands
France UK
Greece
Portug
al
Slovak
ia
Czech
Rep
ublic
Hunga
ry
Poland
Turkey

Energy Efficiency Policies and Indicators: WEC Report 2001
82
The second aspect is tax differentiation between gasoline and diesel. This may be of no importance, for example in the USA, where there are very few diesel cars. In Europe, it was of little importance until the end of the 1970s, because diesel use was limited to large cars with specific uses (taxis). However, this aspect gained enormously in importance in the 1980s and 1990s, because consumers were offered diesel versions of cars, both at the top and the lower end of ranges. On the one hand, the specific emissions of diesel cars, compared to equivalent gasoline cars, are slightly lower (despite the carbon content of diesel being higher than gasoline). On the other hand, diesel cars are driven over much larger distances annually. In France, where the tax differentiation is high, the annual mileage of a diesel car is around 20 000 km, compared to around 11 000 km for gasoline cars. As a result, the annual emissions of a diesel car are higher than for a gasoline car. Is this difference directly linked to the price difference? There is a debate between experts on this point. Some experts consider that travel needs are constant, and that for those with high needs, diesel is more cost effective because the lower fuel cost more than balances the higher price of the car. Other experts consider that the difference in the energy price per kilometre explains at least part of the difference in the distance travelled (see Box 2.2).
Box 2.2. Gasoline versus diesel: the case of France. Compared to diesel, the energy price per kilometre with a gasoline car is higher in relation to both the price per litre (around 45% higher) and the specific consumption (25% higher), which results in a total cost 80% higher. With a -0.2 elasticity of distance travelled to car price, a 4000 km difference may be explained this way. This hypothesis is consistent with the results of a specific survey of people moving from gasoline to diesel – the gasoline car mileage was 16 000 km; the diesel mileage after the move was 20 000 km (Hivert, 1996). As a result, annual CO2 emissions increased by 13%. This growth could be more limited in the future, with the introduction of direct injection.
2.6.4. Other Economic and Fiscal Instruments Other economic and fiscal tools may influence car fuel demand: road pricing, the possibility of deducting travel costs from taxable incomes, the number of company cars, and incentives for car scrapping or for clean and efficient cars. Road pricing Road pricing and tolls for road use are never in place on the total territory of a country. Tolls are generally limited to certain freeways. Toll freeways are important in France, Italy and Spain, for example, but freeways are generally free of charge in countries such as the Netherlands, the UK and Germany. Moreover, there is generally a free of charge alternative road in countries with toll freeways. Road pricing occurs only in a few countries (Norway, Singapore) in some urban areas, such as Singapore, Oslo, Trondheim and Bergen. Road pricing may have some effect on CO2 emissions, because it leads to smoother traffic flow. On the other hand, people may divert

Energy Efficiency Policies and Indicators: WEC Report 2001
83
their journeys from these areas, which are generally high-density zones, and drive more elsewhere. There is no clear evidence to assess the effect, which is in any case limited. Other fiscal measures Two other fiscal measures must be considered, even though no international comparison is available. The first is income tax relief related to journeys to work. In France, wage earners have the option to deduct from their taxable income either a standard deduction of 10% or their real cost of commuting. Commuting distances up to 40 km are accepted without discussion, distances over this limit have to be justified. The majority of wage earners use the standard deduction. These rules differ from one country to another, and some governments, such as the Netherlands and the UK, have limited the relief either in terms of distance or by allowing it for public transport use only. The second is policy towards company cars. Companies are important players in new car markets, both for their own needs and to provide employees with cars as a part of their remuneration. In the UK, around 50% of new cars are bought by companies. Cars are kept by companies for 2-3 years, and are then sold to individual buyers. As the criteria of companies in choosing cars may be different from those of individuals, this may lead to an upsizing of the car fleet. Incentives for scrapping old cars Incentives for scrapping old cars often have a double objective: to accelerate the renewal of the car fleet to stimulate the car industry; and to remove old cars from the fleet, as they are usually inefficient and have a high level of emissions. It is usually a temporary measure implemented over 1-2 years, with an immediate effect. Such a measure has been implemented in about 10 countries, and in five of them the measure is no longer in effect as it was set up for a limited period (see Annex 2). Evaluations show that this measure accelerates the renewal of the fleet, but may have unintended side effects, including “free riders” and a shift to bigger cars. Subsidies for clean and efficient cars Subsidies for clean and efficient cars are not so common: only 10 countries in the sample provide subsidies to buyers of electric or CNG cars (Annex 2). The main objective is to reduce the price of these cars, which are more expensive to buy but have lower utilisation costs. A second objective is to create a market for such cars, so as to reduce the production cost through increased production levels.
2.6.5. Conclusions and Recommendations Even though there are limitations to empirical findings, the basic conclusion is quite simple: the consumer is responsive to price signals at every level. As regards car purchase taxes, countries with high taxes (Denmark, Finland, Norway, the Netherlands, Ireland and Portugal) have lower rates of car ownership (per inhabitant or per

Energy Efficiency Policies and Indicators: WEC Report 2001
84
unit of GDP) than the European average. Countries with no significant registration fees have higher car ownership rates. However, high levels of taxes on car purchases do not seem to orientate demand towards more efficient cars. Countries such as Italy and France share with Portugal lower levels of CO2 emissions per kilometre than Denmark and the Netherlands. The annual tax on car ownership may play an additional role. Provided it is significant, it may orientate demand towards less powerful cars. It may also discourage the use of diesel cars, where there is a significant difference between the tax on diesel and gasoline cars. The role of fuel tax is primarily to orientate demand towards more efficient vehicles. A secondary aim is to encourage people to drive less. The right criterion to assess the performance of a country is probably the unit consumption or the carbon emissions of passenger cars per unit of GDP. Fulton has estimated this for recent years for several countries (Table 2.13). Due to low levels of road taxation (both on vehicles and fuel) in relation to GDP, North America has the worst result, which is not a surprise. The worst performance in Europe is from the UK. This is probably linked to the fact that the “fuel escalator” approach is rather new, and better results should be observed in the future. More surprisingly, the Netherlands, France and Italy are in similar positions, despite quite different policies regarding taxes in the Netherlands compared with the other two. The Netherlands achieves its result through higher levels of tax on car purchases, while France and Italy concentrate on fuel tax. Denmark has clearly the best result, in relation to the quite high level of tax on purchases. From an economic viewpoint, however, it could be considered as more efficient to reduce tax levels for efficient cars and to compensate with higher fuel prices.
Table 2.13. Carbon emissions from passenger cars per unit of GDP.
Carbon emissions from passenger
cars per unit GDP USA 50-75 Canada 60-70 Australia 42-48 UK 25-30 Sweden 22-28 Germany 20-25 Netherlands 16-21 France 16-20 Italy 14-20 Denmark 7-10 Source: Derived from Fulton.
From a policy point of view, the European situation is far from optimal. While car manufacturers in the USA have a homogeneous market, car manufacturers in Europe face a range of quite different taxation regimes (see Table 2.14 for a comparison of the taxes paid over the lifetime of a car). Because purchase taxes are concentrated on small markets, and are not directly related to fuel consumption, they do not provide an incentive for manufacturers to promote better technologies.

Energy Efficiency Policies and Indicators: WEC Report 2001
85
According to the European Automobile Manufacturers Association (ACEA) agreement, specific emissions of new cars are planned to decrease from 185 gCO2/km in 1995 to 140 g/km in 2008. Comparison of 1995 and 1999 values suggests that European manufacturers are on track. However, this does not ensure a parallel decrease in total fuel consumption, since some type of rebound effect may occur. A combination of instruments would be useful. An acceptable approach towards convergence and efficiency could be as follows. Some kind of harmonisation of fuel tax is needed, both on gasoline and diesel. For diesel, minimum excise taxes are needed, because of international truck traffic. For gasoline, it would be better to use a tax/GDP ratio, in order to meet the needs of less affluent countries of Europe and ensure that the tax level followed economic growth. This level could be around 0.03 * per litre per unit of GDP. For countries where this rule imposed an additional burden on car drivers, a tax deduction of an equivalent amount could be proposed, either on the car purchase tax or the annual tax, concentrated on the most efficient vehicles. Taxes on car purchases and ownership should depend, at least partly, on specific consumption. This would help car manufacturers to comply with their commitment, and probably to go further (a target of 120 gCO2/km in 2012 is being considered). In cases where new technology would not prove sufficient and/or would be too expensive, restrictions on the introduction of new cars with high specific consumption could be considered (“gas guzzler” taxes, prohibition of vehicles with maximum speed above a threshold, etc.). Another direction could be explored at the level of usage, by cancelling income tax relief linked to commuting, at least in situations where public transport is an alternative.
Table 2.14. Estimation of specific taxes paid over the lifetime of a car.
Car purchase Annual tax Fuel tax Total AUSTRIA 1300 2000 5000 8200 DENMARK 15000 2300 5400 22700 FINLAND 12000 1000 7800 20800 FRANCE 0 0 7200 7200 IRELAND 4000 3000 5760 12760 NETHERLANDS 5000 4000 9750 18750 NORWAY 8000 2300 9600 19900 PORTUGAL 4000 300 4320 8620 UK 0 2000 9840 11840 Source: Author’s estimates from ADEME data, assuming 8 l/100 km, 15 000 km/year, 10 years lifetime, without depreciation index.

Energy Efficiency Policies and Indicators: WEC Report 2001
86
2.7. Energy Audits13 Energy audits consist of a detailed survey by a specialist of the energy used in an industrial firm, in a transport company, or in a building. The objective is to provide technical and financial information to consumers about what actions can be taken to reduce their energy bills and at what costs. These actions cover reduction of consumption (i.e. energy efficiency actions), shifts to other fuels (i.e. energy substitution), and changes of tariff (e.g. load management). Energy audits are used to identify cost-effective actions for energy efficiency improvements in existing buildings and facilities. Through normal failures and attrition, existing equipment is replaced with more advanced equipment. Energy audits are a way to accelerate this replacement process, and to consider the most advanced equipment available on the market.
2.7.1. Description and Scope Energy audits have been conducted on a range of commercial and industrial facilities, and even on residential homes. However, energy audits have mostly been applied to business entities which view potential energy efficiency improvements as a business or investment decision. This section is applicable to the full range of audits, but it is primarily focused on this business application. Some audits can be conducted on the entire business process, which may include additional functions such as procurement, inventory procedures, distributions systems and even transportation (including vehicle fleets). Energy audits are often funded by government agencies or by utility service companies, with the aim of reducing energy consumption and peak energy demand for a building or industrial facility. To encourage participation, the audit is either provided free of charge or the cost is shared. Subsidised audits are usually provided to firms based on their size, the amount of energy consumed, and/or the number of employees. The auditor will develop a suggested list of improvements that can be made. These measures may range from the addition of attic or pipe insulation, to the total replacement of existing fully functioning systems like a chiller, compressor or motor. Major improvements may affect production schedules, and may need to be implemented during a plant shutdown. In some countries, regulations mandate large energy consumers (industrial plants, commercial buildings, transport companies) to have regular audits. In Portugal, Thailand and Tunisia, for example, energy audits are mandatory for large buildings (using >1000 toe/year in Portugal and Tunisia) and large factories (>1000 toe/year in Portugal and 2000 toe/year in Tunisia). In Tunisia, mandatory energy audits also apply to large transport companies (with yearly consumption above 500 toe).
13. This section is based on a report prepared for the project by Marc LaFrance and Ivan Jaques from APERC. The country case studies can be found in Annex 1.

Energy Efficiency Policies and Indicators: WEC Report 2001
87
Conducting audits A common concern among public agencies which subsidise audits and audited firms alike is the quality of the audit. Audits that fail to reflect the complexities and the real-world conditions of the audited firms result in decreased consumer confidence and wasted resources. To overcome this problem, public agencies usually select auditing companies entitled to participate in the programme. Moreover, they can mandate standard methods and computer software to ensure consistency and efficient work. Transfer of know-how in this field between countries can prove very fruitful. The energy auditor inspects the condition, age, efficiency, performance, usage habits, and other parameters of the equipment used. The auditor also inspects the thermal envelope of the structure, including the types and amounts of insulation, the windows, doors and basic configurations. The audit may also assess the fuel sources being used and may propose alternatives. Some audits even address the possibility of installing renewable energy technologies, such as solar panels and wind turbines, or the use of biomass. Also, the installation of distributed generation technologies, where on-site electricity is generated using low polluting gas micro-turbines or fuel cells, can also be considered. The auditor may even suggest operational changes, such as not using certain non-essential equipment during periods of peak demand. Depending on the price structure, implementing these changes can result in significant economic savings for the firm. Many of these improvements may also have non-energy benefits, such as improved productivity, quieter operation, reduced waste and pollution, enhanced safety and improved comfort. It is important that the auditor fully understands the production and operational processes of the audited entity. Some very efficient and cost-effective measures may just not be practical for certain applications, or installation of such measures may be too disruptive to the production process. At the same time, the business entity needs to be open to fundamentally new ways of conducting its business, if major changes could produce significant benefits. This is especially the case with non-energy benefits, which are usually more important to the firm’s overall operation, unless energy consumption is disproportionately high. Business decision and installation of measures Energy audits conclude with suggested corrective actions or equipment replacements. The question is whether the recommendations will be effectively considered for installation. Actual installation of recommended measures will be based on many factors, including cost effectiveness, affordability, financing, longevity and wider business considerations. Often businesses are concerned about the risk of disruption to production or to the work environment. Therefore, the installation of new equipment or the introduction of new techniques needs to be carefully considered and the risk assessed. Often, the risk can be minimised by carrying out the installation in phases or during normal plant shutdowns. In addition, lessons learned from successful prior applications of a similar type (or demonstration projects) can help reduce the risk associated with new equipment and/or concepts. Objective analyses of such demonstrations by parties other than the equipment manufacturer, and dissemination of such analyses, can help alleviate the perceived risk associated with a new process.

Energy Efficiency Policies and Indicators: WEC Report 2001
88
Box 2.3. Evaluation of the cost effectiveness of measures. During a normal replacement of a failed item, a building owner will likely do a cost-benefit analysis to determine if a more efficient, but more expensive, product with lower operating costs is worth the additional investment. One common technique used is the simple payback method. By taking the cost premium of the energy efficient product compared to the standard product, and dividing it by the annual energy savings resulting from use of the energy efficient product, the consumer can determine how many years it will take to recoup the investment. The fundamental problem with using the simple payback method is that it does not take into account future energy savings. A better method of assessment is to consider the life cycle cost or net present value of the investment. In this approach, the initial purchase price of the product is added to the stream of energy costs that will be incurred from operating the unit. Since a dollar today is worth more than a dollar tomorrow, these energy bills are discounted using a discount rate.14 The product with the lowest life cycle cost or highest net present value is the best alternative. The use of more sophisticated economic tools should lead to longer term investments that will produce greater energy savings. Energy audits usually lead to the possibility of replacing existing equipment with new, highly efficient equipment. This activity has been coined “early replacement”. Before early replacement can be considered, it must be demonstrated that significant energy saving potential exists. The challenge with early replacement is that the entire cost of the more efficient product has to be justified, rather than just the cost premium associated with normal replacement. Salvage values and how they are assessed significantly complicate the analysis. Salvage value attempts to address the concern with residual value of the existing equipment, and the different expected life of the new equipment if it is installed immediately or if it is only installed upon failure. These issues and their analysis are subject to debate, and a uniform methodology may be difficult to agree on. However, a basic “time value of money” cash flow analysis with salvage life considerations is considered to be a reasonable approach. If the new, highly efficient product can be financed using the existing stream of funds normally used for energy expenses, then the normal future capital expense for equipment replacement can be avoided. No additional funds are required to finance the immediate purchase and installation of the more efficient product, or to replace the old equipment. Using such financing mechanisms for energy efficiency measures can reduce requirements for capital equipment replacement funds. Another concern associated with the implementation of recommended measures is the depth or extent to which measures are installed. Often, the firm may only be interested in installing a few improvements with very short payback periods. However, if a set of improvements with varying cost effectiveness and payback periods are packaged, then an overall upgrade of the building or factory can be installed with significantly greater impact. Sometimes, certain measures may require a longer period to recoup the investment, but the overall savings impact can greatly exceed that of measures with very short payback periods. Thus, the net present value of the investment is very large. If only a few improvements are completed initially, then the more in-depth measures may never get installed, and a significant investment opportunity is lost.
14. A discount rate can be seen as the rate of return on lost investment opportunity (for example, the rate of borrowing money plus transaction costs).

Energy Efficiency Policies and Indicators: WEC Report 2001
89
A major barrier to firms making such long-term investments in energy efficiency is the uncertainty of long-range business plans. In many instances, businesses operate on a timescale that may preclude them from considering such long-term investments, even if they are very cost effective. For example, a business may not know or be able to predict future parameters such as competitors, tax laws, technological advances, incentives, and market conditions. Future business considerations may require the company to move its operations, abandoning its current facility and any investments previously made. This business perspective works against the implementation of long-term measures. At the same time, some firms do know their plans many years in advance. The same discussion generally applies to residential homeowners and their plans for staying in the home. However, efficiency improvements to facilities and homes may increase the resale value of the property. Measures recommended in the audit may be implemented by the audit company, the firm’s own staff, or by independent contractors hired by the firm. To encourage the firm to implement the measures recommended in the audit, the government or the utility service company which funded the audit may offer attractive financing terms. Often, a follow-up evaluation is conducted to document and verify the savings realised. Most of the data from the audit and the follow-up evaluation are considered confidential and are usually not available to the public. However, a sound audit programme should have an objective evaluation mechanism that is part of the process. Results can be analysed and released without revealing sensitive business data. Audit financing Financing can be a major hurdle to the adoption of energy efficient measures and practices. Therefore, as part of public policy, governments that have audit programmes often offer low interest (i.e. subsidised) loans to encourage installation of the measures suggested in the audit (see Chapter 8 for financing mechanisms). Other incentives, such as accelerated depreciation, reduced sales or import taxes, or guarantee mechanisms, can lead to a reduced tax burden that also encourages the adoption of audit recommendations. Another creative option is the establishment of an energy service company (ESCO) industry. In such an industry, ESCOs can arrange the entire audit and installation process for the firm, including financing (see Chapter 8).
2.7.2. Impact of Audit Programme and Efficiency Measures Evaluation of audit programmes The audits reviewed in the case studies15 show that a broad range of measures was proposed as a result, including small and large equipment replacements, entire system replacements, and facility structure retrofits. Common efficiency suggestions involved air conditioning, water heating, industrial equipment, and lighting. Many of the suggested measures were actually installed: from around 50% in the USA to around 75% in France and 80% in New Zealand. These measures offered significant energy and money saving opportunities, and the investments were recovered in 1.3 to 3 years, depending on whether they applied to industrial or commercial buildings, and on the economy. Box 2.4 gives a summary of the findings of an evaluation of an industry audit programme in France.
15. The full country case study referred to here can be found in Annex 1.
Energy Efficiency Policies and Indicators: WEC Report 2001
90
However, what cannot be easily discerned is the impact on the business decision-making process of the firms, or on the energy efficiency industry. For example, will businesses that participated in the audits place greater emphasis on energy efficiency in all future business decisions (retrofits and normal replacements)? Will the employees of the firms give more consideration to energy efficiency when they move to other employers? Will audit companies more aggressively pursue opportunities independently of government or utility company financial support? As a result of such audit programmes, has the audit or ESCO industry grown? These long-term impacts need to be considered, in addition to the specific immediate savings. Long-term impacts The long-term impacts of audit programmes have not been fully analysed, or such analysis is not available. The USA has attempted to establish an independent ESCO industry by setting requirements for energy efficiency improvements and energy consumption reductions in government buildings and facilities. Additionally, the US Department of Energy has established large contracts with ESCOs to serve government customers nationally. Business with government customers has grown, but it is still too early to see results from the private sector. Some economies, such as Japan, have decided to approach the industrial sector through the setting of standards. These efforts have been extremely effective and have resulted in Japan’s industrial sector being the least energy intensive in the world. Thus, the audit process has become a normal business practice in Japan, with company energy managers addressing efficiency improvement investment decisions. The goal of the Japanese programme is to improve efficiency by 1% per year. While Japan’s industrial GDP has doubled in the past 25 years, the energy consumption has remained almost constant. Other approaches include requirements for energy managers and the submission of detailed energy plans. Korea has such a policy.
Box 2.4. Evaluation of the cost effectiveness of the industrial energy audit subsidy programme in France.
An evaluation of the French audit scheme in industry was conducted in 1997. The programme was implemented in 1990-91 through subsidies by ADEME to audits conducted on industrial sites (a subsidy of 50%). About 75% of the interviewed companies (beneficiaries of the audit subsidies) declared that they made an investment following the audit, but it was not possible to assess with precision the energy savings which resulted. However, the evaluation report allows an assessment of the cost effectiveness of the subsidy: 1. For 90% of the investments induced, the audit was necessary for the investment decision. 2. The public cost of the measure is estimated at FFr500 (€76) (1994 values) per toe saved
each year over the lifetime of the equipment (including the management costs of ADEME); this can be compared with energy costs of about FFr1250 (€190) per toe.
3. The investments induced by the audits had an average cost of FFr3750 (€570) per toe saved per year.
The measure appears to be very profitable from a collective point of view. The public cost was repaid on average by half a year’s energy savings, while investments were paid back after three years.

Energy Efficiency Policies and Indicators: WEC Report 2001
91
2.7.3. Conclusions and Recommendations From the sample data presented above, it is obvious that the investments in energy efficiency which are made in the industrial and private building sectors are extremely cost effective and lead to reduced operating costs and thus greater profits. At the same time, the data also show that only the best options are pursued in the private sector. Thus, with proper analysis and greater access to financing, the positive impacts from audits could be even greater. From the limited analysis in this study, it appears that energy audit programmes have great potential. While many believe that such programmes require initial subsidy or financial support to get started, it is clear that they have the ability to become economically self-sufficient. Implementing an audit programme is one way to reduce carbon emissions, while realising a profit. There has been much discussion about the cost of mitigating carbon, or the cost of carbon credits. Of course, this makes sense in a political climate where strict requirements are being imposed. However, audits are a way to actually avoid carbon emissions at a negative cost, or with a net positive benefit.

Energy Efficiency Policies and Indicators: WEC Report 2001
92
2.8. Economic and Fiscal Incentives16 Economic and fiscal incentives are aimed at encouraging investment in energy efficient equipment and processes by reducing the investment cost. Economic incentives are any financial instrument that can stimulate investments in energy efficiency. They fall into two broad categories: investment subsidies, and soft loans. Fiscal incentives include measures to reduce the tax paid by consumers who invest in energy efficiency. They comprise tax reductions on energy efficient equipment, accelerated depreciation, tax credits and tax deductions. These measures normally require specific provision in the relevant legislation.
2.8.1. Economic Incentives Investment subsidies The objective of investment subsidies is to provide funds to consumers to stimulate energy efficiency investments in existing buildings and equipment, or the adoption of energy efficient techniques. In principle, these incentives apply to actions that are cost effective from the collective point of view, but which would not otherwise be undertaken by consumers. Economic incentives may also be given to the producers of equipment, to encourage the development and marketing of energy efficient equipment. Economic incentives to consumers were among the first measures to be implemented in the 1970s and beginning of the 1980s. Most countries developed various ambitious schemes, mainly to retrofit existing buildings or dwellings, as well as industrial equipment. The objective was to reduce the cost of the investments for consumers. The most widespread incentive used is a grant or direct subsidy. This grant can be defined as a fixed amount, as a percentage of the investment (with a ceiling), or as a sum proportional to the amount of energy saved (see Box 2.5 for the example of Japan). Ex-post evaluation of grant schemes showed several drawbacks: 1. The schemes often attracted consumers who would have carried out the investments even
without the incentive, so-called “free riders” (e.g. high income households or energy intensive industries).
2. Many consumers who could use the subsidy and were targets of the scheme (small to medium industries, and low income households) did not take advantage of it because they were unaware of its existence. This was due to the difficulty of adequately publicising the existence of the incentives to the multitude of consumers concerned.
3. Procedures to get the grants were often found to be too bureaucratic, with complex forms to be completed and long delays in obtaining agreement; this dissuaded many consumers.
4. The grants were expensive in terms of operating costs (a large staff was necessary to process the forms).
These problems should not condemn subsidies, but should lead to their more careful utilisation, taking into account their drawbacks and real effectiveness. Subsidies should be
16. This section is adapted from a report prepared for the project by Oleg Sinyugin from APERC. The full country case studies referred to in this section can be found in Annex 1.

Energy Efficiency Policies and Indicators: WEC Report 2001
93
viewed as a temporary measure to mobilise consumers, to prepare for new regulations, or to promote energy efficient technologies by creating a larger market than would exist otherwise. One direct result may be a cost reduction for the subsidised energy efficient techniques. To correct these problems, grants are now better targeted to limit the consumer population that can benefit from them (e.g. low income households, tenants). They are also restricted to certain types of investment (from a selected list of equipment), with a long payback time but high efficiency gains (e.g. renewables, cogeneration). They may also be restricted to innovative technologies (demonstrative or exemplary investments). The approach in Thailand is innovative, as selection is not based on a list of equipment but on a criterion of cost-effectiveness; for example, grants apply to investments that have an internal rate of return above 9% (see Box 2.6).
Box 2.5. Example of incentive schemes: the case of Japan. The New Energy and Industrial Technology Development Organization (NEDO) grants subsidies to finance energy conservation technologies. Under the “High Performance Industrial Furnace Field Test Project”, NEDO paid up to one-third of the cost of each high-performance furnace. NEDO estimates that the project will result in energy savings equalling 5% of Japan’s final energy consumption by 2010. Japan also provides loan support for energy efficient investments by industry. The government offers a rate of 2.2% to industry on up to half of the cost of the project for a period of 1 to 30 years. This policy has been less effective, given the deflationary economic conditions in the 1990s.
Box 2.6. Financing energy efficiency: the case of Thailand. Funds for the Energy Conservation Promotion Program (ENCON) and its Energy Conservation Promotion Fund (ECF), created in 1995, come from a 0.07 Baht (about US$0.002) per litre tax on petrol. At the end of fiscal year 1999, the fund had accumulated capital of about 14 billion Baht (US$350 million). The ECF, administered by NEPO, provides financial assistance for energy conservation efforts by both the public and private sectors. The fund provides financial assistance to cover up to 50% of the cost of the comprehensive ENCON plan development, but not exceeding 500 000 Baht (US$12 000) per facility. Each energy conservation measure must yield a higher real economic internal rate of return (EIRR) than the level specified by the ENCON Fund Committee. At the initial stage, the minimum rate has been set at 9%. The main target of the soft loans and/or subsidies is to raise the financial return rates of energy conservation projects to commercially attractive levels. The Electricity Generating Authority of Thailand (EGAT) administers energy efficiency programmes through its Demand-Side Management Office (DSMO). Funds for these initiatives come from donations and a fuel adjustment levy. In 1998, EGAT estimated that DSM programmes, at a cost of US$20 million during 1993-98 (or US$0.01 per kWh), had saved 710 GWh and lowered peak demand by 182 MW.

Energy Efficiency Policies and Indicators: WEC Report 2001
94
Soft loans Soft loans are loans offered at subsidised interest rates, i.e. at rates lower than the market rate, to consumers who invest in energy efficient techniques and equipment (see Box 2.5 for the example of Japan). Soft loans have the advantage that they can be easily implemented by banking institutions. Nevertheless, due to the current low level of interest rates, such measures are often not attractive to industrial companies.
2.8.2. Fiscal Incentives Tax credits, tax reductions and accelerated depreciation are fiscal incentives that reduce the tax paid by consumers who invest in energy efficiency. Fiscal incentives are usually preferred to economic incentives, as they are less costly from the government point of view. They can work well if the tax collection rate is sufficiently high. Such measures usually have a poor performance in an economy in recession or in transition. See Box 2.7 for the example of Japan.
Box 2.7. Fiscal incentives: the case of Japan. The "Energy Conservation and Recycling Assistance Law" enacted in 1993 introduced several special tax measures for energy efficient equipment: tax rebate on corporate tax equal to 7% of the purchase price of energy efficient equipment; measure restricted to small and medium sized firms in 1999; special depreciation provisions of up to 30% of equipment costs for new equipment a 5% reduction in energy use. A reduction of 1% per year in energy consumption levels by all factories was one of the goals of the new law. These special taxation measures boosted investment in energy efficient products by ¥500 billion (US$4 billion). Investment rose from ¥300 billion in 1990 to ¥800 billion in 1993. Purchases fell back to the ¥300 billion level by 1999.
2.8.3. The Financing of Incentives Financial and economic incentives are funded in a variety of ways. Some countries have created special funds supplied from different sources, such as Thailand (see Box 2.6), or are offering guarantees for such investments, such as France with FOGIME and FIDEME (Box 2.8). Utilities, governments, non-governmental organisations (NGOs), banks and international organisations are all participating in the design and administration of these programmes. Utility-run programmes are financed by the utility’s customers (ratepayers), and are implemented by the utility or by sub-contractors such as energy service companies (ESCOs) or NGOs. A new method of financing is “wire charges”, where all electricity consumers pay a surcharge and the money is placed in a fund to finance energy efficiency programmes. The fund is then administered by the utilities, government agencies or NGOs (see Box 2.6 for the case of Thailand). Taxpayers finance government energy efficiency programmes. The programmes are created, organised, funded and administered by governments, with the general aim of increasing the rate at which new technologies enter the market. They are implemented by government agencies, contractors, NGOs and/or ESCOs. ESCOs provide energy efficiency improvements
Energy Efficiency Policies and Indicators: WEC Report 2001
95
and energy management services to companies and other customers, and get paid out of the savings realised from the improvements. Banks are becoming an important source of lending to ESCOs, using the expected energy savings from projects as collateral for loans. Charitable foundations also provide funding. For example, the US-based China Sustainable Energy Foundation funds projects in China. Government-to-government grants and multilateral funding agencies (e.g. World Bank, Asian Development Bank, Global Environment Facility (GEF)) also provide funding. For example, the US Agency for International Development funds programmes in the Philippines, and the GEF finances programmes administered by the Electricity Generating Authority of Thailand.
Box 2.8. Guarantee funds for energy efficiency investments: the case of France. FOGIME (Guarantee Fund for Long-term Investments) gives a guarantee of up to 70% of borrowings contracted by small businesses from any bank. Any investment identified by an audit supported by ADEME and requiring long-term borrowing can benefit from such a guarantee. FIDEME (Investment Fund for Energy Efficiency) is a new development fund created by ADEME. It is dedicated to helping manufacturers of energy efficient equipment, who are facing rapid market growth and need increased capital. The fund will acquire subordinated bonds from companies undergoing rapid development, providing quasi-capital. The fund will be managed by ADEME and finance companies. The loan rate will be much lower than the capital risk market value.
2.8.4. Conclusions and Recommendations A variety of financing and tax schemes, such as soft loans, subsidies, accelerated depreciation and tax credits, are used to improve the economic feasibility of energy efficiency projects. The following important issues should be highlighted. Eliminating price subsidies: energy pricing The price of energy is a key base factor determining the feasibility of energy saving measures. For example, in developing countries in Asia, the most fundamental government actions which benefit energy efficiency activities involve reducing price subsidies for electricity and other forms of energy. China’s efforts to reduce such subsidies, for example, have contributed to its substantial success in improving energy efficiency. While the move from subsidised prices towards market-based prices can be a difficult transition from social and political perspectives, it is crucial to the implementation of end-use efficiency measures. Financing Programme evaluation is necessary to ensure that financial incentives are having the desired effect at minimal cost. Investment and administrative costs have to be evaluated and compared to the benefits. Conventional cost-benefit analysis is useful tool for this purpose. The emphasis now is on routine bank lending in the special energy efficient equipment niches of industry.

Energy Efficiency Policies and Indicators: WEC Report 2001
96
Role of governments Results obtained from China’s efficient technologies replacement programmes in the 1980s and from Brazil’s PROCEL programme show that the role of governments in energy conservation is crucial in launching initiatives and establishing legal frameworks. Nationwide initiatives providing tax incentives for energy conservation are considered a basic element of the energy policy formulated by the Bush Administration in the USA to cope with current energy crises. The latest energy-related developments in California, the USA and Brazil (shortages in energy supply and/or non-affordable energy prices) suggest that benign conditions for investment in energy efficiency can arise spontaneously in specific market situations, given time. Nevertheless, government initiatives to create new incentives to invest in energy efficiency, including tax breaks and easier access to capital markets (bank loans and stock markets), are crucial. Energy Service Companies (ESCOs) The most dynamic factor in the creation of a special energy efficiency market niche is the emergence of ESCO activity in all the economies observed. ESCOs are companies that provide technical expertise and financing for energy efficiency investments, with a guarantee of reductions in energy costs. This mode of financing is an example of third party financing. The ESCO makes the investment and receives a portion of the savings (around 50%) as its compensation. A soundly-based ESCO industry can operate in the private sector with limited government support, resulting in significant energy savings. Economic and fiscal incentives can establish the environment necessary to ensure profitable business schemes by ESCOs. To be effective, ESCOs need to operate in a market economy with no subsidy on energy prices and with a sound legal framework. ESCOs invest primarily in CHP, in industry, in fuel substitution, and in small hydro. One concern with ESCOs is that, since the savings are being shared, only the most cost-effective measures will be pursued, and the overall extent of energy saving measures may not be as great as if the energy-consuming firms operated independently. ESCOs might also be reluctant to propose investments in advanced but risky technologies. At the same time, if the ESCO industry did not exist, many firms would not even consider energy efficiency investments. The allocation of benefits and/or risks between the ESCO and the beneficiary company is an important issue.

Energy Efficiency Policies and Indicators: WEC Report 2001
97
2.9. Other Regulations Energy consumption reporting Several countries have set up regulations requiring designated or large consumers to report their energy consumption, either directly to the government or in their annual report. This measure is seen as an incentive to companies to monitor closely their energy performance. Such measures exist in India, Japan, Portugal and Romania (among the sampled countries). In the case of India, companies in selected energy intensive sectors have to give in their annual report to shareholders data on their overall consumption, and on the specific energy consumption of manufactured products (e.g. cement, pulp, sugar). They also have to provide information on energy saving actions undertaken over the previous year. In Romania, companies have also to report to the energy efficiency agency ARCE indicators of specific energy consumption. Energy managers In some countries, there is a regulation requiring the nomination of an energy manager in companies of a certain size. For example, this has applied to most factories in Portugal since 1982, and for all consumers above 1000 toe/year since 1998; in Thailand, such a regulation has applied since 1997. In Japan, energy managers have to be nominated for designated factories. Energy saving plans Some countries have set up regulations on the preparation of plans for the rational energy use of energy (e.g. every five years in Portugal, and also in Japan and Thailand). Heat metering Regulations have also been introduced in some cases requiring the installation of heat meters for district heating, especially in Central and Eastern European countries, where heat was seldom metered in the past. Such regulation can also apply to building or block central heating (e.g. in Germany). Maintenance Maintenance of energy-consuming equipment is another important field of regulation. The concern is that without proper management of energy equipment (e.g. boilers, vehicles), significant amounts of energy could be wasted even if the technology has become more efficient. Some countries have put an emphasis on regulation of maintenance, in order to avoid a reduction over time of energy efficiency, i.e. to maintain the actual efficiency level. For example, Denmark has regulations on the maintenance of heating boilers. In a few countries (Austria, Luxembourg and the Netherlands) there are regulations controlling the specific consumption of cars.

Energy Efficiency Policies and Indicators: WEC Report 2001
98
3. Conclusions and Recommendations The purpose of this study is not an evaluation of energy efficiency policy measures for each individual country; however, the confrontation of the countries experiences enables us to make conclusions and recommendations from three main viewpoints :
1. The effectiveness of the policy measures implemented; 2. The use of energy efficiency indicators for monitoring; 3. The link between the various measures and the influence of the policy context.
3.1. Evaluation of energy efficiency policies and measures Although some convergences can be observed in the policy measures across countries, some discrepancies do exist. They reveal that there is not a single particular measure, or mix of measures, that can be considered as the most effective one in all circumstances. The energy price and taxation context, the degree of market development for energy efficient devices and services, and the degree of harmonisation and of integration between energy efficiency policy and other sectoral policies (transport, building, etc.) are the main causes of discrepancies. They explain that different sets of measures have to be adopted in different countries, and that, in the same country, new measures and new combination of measures have to be designed to accompany the change in the market context. The following conclusions come out from the review of the policy measures on which this report focused.
3.1.1. Institutional setting Almost all countries under review have set up energy efficiency Agencies, either at the national level, or at regional levels or both and more recently at local level. Although the legal status of these agencies is different from one country to another, their implementation almost everywhere, sometimes quite recently, clearly indicates that all countries concerned by energy efficiency perceive such agencies as useful and that there is no contradiction between such an institutional settlement and the market. Although private interests are involved in such agencies in some countries, most of them are either entirely or mainly funded by public funds. This indicates that they are considered by governments as reliable and effective institutional set up to implement energy efficiency policies.

Energy Efficiency Policies and Indicators: WEC Report 2001
99
3. Conclusion et Recommandations L’objet de cette étude n’est pas l’évaluation des politiques et des mesures d’efficacité énergétique de chacun des pays. Par contre, la confrontation des expériences menées dans les pays nous permet d’établir des conclusions et recommandations sur trois aspects :
1. L’efficacité des politiques et des mesures mises en place; 2. L’utilisation des indicateurs d’efficacité énergétique pour le suivi; 3. Le lien entre les diverses mesures et l’influence du contexte politique.
3.1. Evaluation des politiques et mesures d’efficacité énergétique Même si l’on peut observer des convergences de politiques et de mesures entre pays, des différences subsistent. Elles révèlent qu’il n’y a pas une mesure particulière, ou une combinaison de mesures, qui puisse être considérée comme la plus efficace en toutes circonstances. Les principales causes de différenciation sont : le contexte de prix de l’énergie et de taxation, le degré de développement du marché des équipements et services, et le degré d’harmonisation et d’intégration des politiques d’efficacité énergétique avec les autres politiques sectorielles (transport, bâtiment, etc.) Elles expliquent que différents jeux de mesures doivent être adoptés selon les pays et que, dans un même pays, de nouvelles mesures ou combinaisons de mesures doivent être élaborées afin d’accompagner les modifications du contexte de marché. Les conclusions suivantes découlent de la revue des politiques et mesures sur lesquelles le rapport s’est focalisé.
3.1.1. Le montage institutionnel La plupart des pays enquêtés ont mis en place des Agences d’efficacité énergétique, tant aux niveaux national que régional, ou les deux à la fois, et plus récemment au niveau local. Bien que le statut légal de ces agences diffère d’un pays à l’autre, leur mise en place pratiquement partout, parfois de façon récente, montre clairement que tous les pays concernés par l’efficacité énergétique perçoivent ces agences comme utiles et qu’il n’y a pas de contradiction entre un tel cadre institutionnel et le marché. Si certaines de ces agences fonctionnent sur la base d’intérêts privés, la plupart d’entre elles sont entièrement ou principalement financées par des fonds publics. Ceci indique que les gouvernements les considèrent comme étant des éléments fiables et institutionnellement utiles pour la mise en place des politiques d’efficacité énergétique.

Energy Efficiency Policies and Indicators: WEC Report 2001
100
3.1.2. Building codes Most countries under review, either in cold or in warm climate environment, have already adopted thermal efficiency standards for building, or are considering adapting such standards. This applies as well for residential and commercial buildings. Such a consensus among countries indicates that this measure is probably considered by policy makers as the most cost effective to tap one of the largest potential for energy savings in all countries. It also indicates that the market signals are not believed to be clear enough to faster spontaneously the right decisions by individuals, professionals or developers as regard the thermal quality of buildings. As shown earlier (see § 3.5), the adoption of such insulation standards has strongly contributed either to stabilise the energy consumption per dwelling or even to decrease it over time. Revisions in thermal building codes have become increasingly regular quite independently of the energy price changes (about every 6-8 years compared to 12-13 previously): typically, 2 to 4 rounds of thermal building code revisions occurred in the last 25 years for the countries considered. The new proposed building directive of the European Union has for the first time integrated the dynamics of revisions to the building codes to every five years. Standards have become increasingly complex and consider mostly now the whole building system, with different degrees of complexity depending on the equipment integrated: heating/cooling; warm water; lighting: energy for motors/pumps; elevators...). Relatively few countries have carried out field evaluations of their thermal building codes for example by energy audits, or have estimated the additional costs, which each round of new building codes has caused. Nevertheless, from the few results available it can be estimated that the additional costs to the building were limited to a few percentages. These measures applied for new buildings may also impact on the technologies, material and practices used for the retrofit of old building. This assessment is rather difficult to do but seems to contribute significantly in the achieved results in that sector. Increasingly the energy consumption on a life cycle bases has to be taken into account in the building codes when the energy consumption of the buildings continues to drop.
3.1.3. Labelling and standards for electrical appliances Labelling programs need to be complemented by minimum performance standards. Standards are necessary to remove inefficient but cheap products from the market, which labelling programs alone cannot do. Basically, labelling stimulates technological innovation and the introduction of new more efficient products, while standards complement this development by organizing the gradual removal from the market of the least energy efficient appliances. In general, appliances manufacturers tend to be opposed to the introduction of efficiency standards, which they claim, impose costly adaptation measures, and burden consumers with additional costs. In certain situations, however, they have cooperated: in Europe and in the USA to avoid an increasing number of different standards at the States level; in certain Asian countries, to protect the domestic market from imports of low-cost competitive products.

Energy Efficiency Policies and Indicators: WEC Report 2001
101
3.1.2. Les réglementations thermiques La plupart des pays enquêtés, aussi bien les pays froids ou plus chauds, ont déjà adopté des réglementations thermiques dans les bâtiments, ou sont en cours d’adaptation. Ceci s’applique aussi bien pour les logements que pour les bâtiments du tertiaire. Un tel consensus entre pays indique que cette mesure est probablement considérée par les décideurs politiques comme la plus efficace pour attaquer un des gisements d’économies d’énergie les plus importants dans tous les pays. Cela montre également que les signaux des marchés ne sont pas perçus comme suffisamment clairs pour permettre aux individus, professionnels et développeurs de prendre spontanément les bonnes décisions relatives à la qualité thermique des bâtiments. Comme nous l’avons montré (voir § 3.5), l’adoption de telles normes d’isolation a fortement contribué à stabiliser la consommation énergétique par logement ou parfois à la faire diminuer dans le temps. Les révisions des réglementations thermiques sont devenues de plus en plus régulières et ceci pratiquement indépendamment des changements du prix de l’énergie (environ tous les 6-8 ans contre 12-13 ans précédemment) : typiquement, les pays considérés ont effectué 2 à 4 séries de révisions de leurs réglementations thermiques durant ces 25 dernières années. La nouvelle directive proposée par l’Union Européenne sur le bâtiment a intégré, pour la première fois, une dynamique de révision des réglementations thermiques tous les cinq ans. Ces normes sont devenues de plus en plus complexes et considèrent maintenant l’ensemble du système du bâtiment, dont les niveaux de complexité dépendent des équipements intégrés : chauffage/climatisation, eau chaude, éclairage, moteurs/pompes, ascenseurs…) Peu de pays ont évalué l’impact de leurs réglementations thermiques par exemple par des audits, ou ont estimé les coûts additionnels des renforcements successifs de réglementation. Cependant, les résultats disponibles montrent que ces coûts additionnels sont limités à un faible pourcentage. Ces mesures appliquées dans le bâtiment neuf ont également un impact sur les technologies, les matériels et les pratiques utilisés lors de la réhabilitation thermique dans l’ancien. Ainsi, il semblerait que la réglementation dans le neuf ait indirectement mais significativement contribué aux résultats obtenus dans le secteur du bâtiment ancien. Plus la consommation d’énergie des bâtiments continue de baisser, plus la réglementation thermique doit intégrer des analyses du cycle de vie.
3.1.3. Etiquetage et normes pour les appareils électriques Les programmes d’étiquetage ont besoin d’être complétés par des normes de performance minimales. Les normes sont utiles pour éliminer du marché les produits peu chers mais inefficaces, ce que les programmes d’étiquetage ne peuvent pas réaliser tout seuls. L’effet principal de l’étiquetage est de stimuler l’innovation technologique et l’introduction de produits nouveaux plus efficaces, alors que les normes complètent ce développement en organisant le retrait graduel du marché des appareils les moins économes. En général, les producteurs d’appareils tendent à s’opposer à l’introduction de normes d’efficacité, parce qu’elles imposent des mesures coûteuses d’adaptation et surchargent le consommateur de coûts additionnels. Cependant, dans certaines situations, ils ont coopéré : en Europe et aux USA afin d’éviter la multiplication de normes au niveaux des Etats, dans certains pays asiatiques pour protéger le marché intérieur des produits importés à coût compétitif plus bas.

Energy Efficiency Policies and Indicators: WEC Report 2001
102
Accompanying measures involving appliance distributors can help reinforce the impact of a labelling program. Experience has shown that training of sales staff and supports given to distributors reinforces the effectiveness of labelling programs. Similarly, public awareness campaigns designed to improve recognition of the label and facilitate its interpretation are essential for the success of the programs. In certain countries, financial incentive programs, as a complement to labelling, have also proved successful in encouraging the diffusion of energy efficient appliances. Finally, technology procurement programs, such as in Europe recently, can stimulate technical innovation in very energy efficient products. Most industrialized countries have adopted labelling programs and standards. In these countries, they are gradually covering an increasing number of appliances. The situation is different in the developing world, where only a few countries have introduced such programs, and where they are often applied to a limited number of appliances (essentially refrigerators and air conditioners). It would perhaps be advisable to plan a rapid generalization of programs to promote energy efficiency in these countries, at least for appliances which are energy intensive, so as to ensure that inefficient appliances, which can no longer be retailed in countries protected by standards, do not end up on their market.
3.1.4. Car taxes and incentives Countries with high car purchase fees have lower motorisation rates than countries with no significant registration fees. High levels of taxes on car purchases do not seem to orientate the demand towards more efficient cars. The annual tax on cars may play an additional role, either to orientate the demand towards less powerful cars or to prevent from using diesel cars, when the tax is significant and when there is a significant difference between these two types of cars. The role of a fuel tax is primarily to orientate the demand towards more efficient vehicles, and secondary to drive less. Some kind of harmonisation of fuel tax is needed, either on gasoline or diesel. For diesel, minimum excise taxes are needed, because of international truck traffic. For gasoline, it would be better to use a tax/GDP ratio, in order to meet the needs of the less affluent countries of Europe. Taxes on car purchases and taxes on ownership should depend, at least partly, on the specific consumption of cars. As a result, it can help car manufacturers to comply with their commitment and probably to go further (a step at 120 g of CO2 / km in 2012 is considered). In the case where technology would not prove sufficient and/or would be too expensive, restrictions to the introduction of new cars with high specific consumption could be considered (gas guzzler taxes, prohibition of vehicles with maximum speed over a threshold, etc.). Another direction could be explored at the level of usage, by cancelling compensations on the income tax linked to the commuting trips, at least in the situations where public transport is an alternative.
Energy Efficiency Policies and Indicators: WEC Report 2001
103
Les mesures d’accompagnement qui impliquent les distributeurs peuvent aider à renforcer l’impact d’un programme d’étiquetage. L’expérience a montré que la formation des équipes de vente et des aides apportées aux distributeurs renforcent l’efficacité des programmes d’étiquetage. De même, les campagnes d’information grand public élaborées pour améliorer la reconnaissance de l’étiquetage et faciliter son interprétation sont essentielles au succès de ces programmes. Dans certains pays, des programmes d’incitation financière, en complément de l’étiquetage, se sont avérés fructueux pour encourager la diffusion des appareils efficaces. Enfin, les programmes d’appel d’offre technologique, tels ceux développés récemment en Europe, peuvent stimuler l’innovation technologique vers des appareils très performants. La plupart des pays industrialisés ont adopté des programmes d’étiquetage ou de normalisation. Dans ces pays, ils couvrent graduellement un nombre de plus en plus grand d’appareils. La situation est différente dans le monde en développement, ou un nombre restreint de pays ont introduit de tels programmes qui s’avèrent le plus souvent limités à un petit nombre d’appareils (essentiellement les réfrigérateurs et la climatisation). Il serait sans doute judicieux d’organiser une généralisation rapide de ces programmes pour promouvoir l’efficacité énergétique dans ces pays, au moins pour les appareils très consommateurs, afin de s’assurer que les appareils inefficaces, qui ne sont plus vendus dans les pays protégés par les normes, ne finissent pas sur leurs marchés.
3.1.4. Taxation et incitations pour les voitures Les pays dont les droits d’acquisition des voitures sont les plus élevés ont un taux de motorisation plus faible que les pays qui n’ont pas de droits significatifs. Un niveau élevé de taxation à l’achat des voitures ne semble pas orienter la demande vers des voitures plus efficaces. La taxe annuelle sur les voitures peut jouer un rôle complémentaire, soit en orientant la demande vers des véhicules moins puissants, soit en limitant l’utilisation de voitures diesel, ceci lorsque la taxe est significative ou suffisamment différenciée selon le type de voiture. Le rôle d’une taxe sur les carburants est, en tout premier lieu, d’orienter la demande vers des véhicules plus efficaces, puis d’inciter les automobilistes à conduire moins. Une sorte d’harmonisation de la taxation des carburants est nécessaire, tant sur l’essence que sur le diesel. Pour le diesel un seuil minimal de taxes est requis à cause du trafic international de poids lourds. Pour l’essence, il serait préférable d’utiliser un ratio taxe/PIB, afin de répondre aux besoins des pays les moins riches d’Europe. Les taxes à l’achat des voitures et les taxes à la possession devraient dépendre, au moins partiellement, de la consommation spécifique des voitures. Ce qui permettrait aux constructeurs de se conformer à leurs obligations et probablement d’aller encore plus loin (une étape à 120 g de CO2/km en 2012 est considérée). Si la technologie ne s’avère pas suffisante et/ou trop onéreuse, il faudrait alors sans doute considérer des restrictions à l’introduction des nouvelles voitures dont les consommations spécifiques seraient trop élevées (taxe à la surconsommation, interdiction des véhicules dépassant le seuil d’une certaine vitesse maximale etc.). On pourrait également explorer d’autres pistes en lien avec l’usage, en supprimant les compensations sur l’impôt sur le revenu liées au parcours domicile-travail, du moins lorsqu’il existe une alternative par les transports en commun.
Energy Efficiency Policies and Indicators: WEC Report 2001
104
3.1.5. Energy audits Energy audits can be a very effective tool in saving energy, improving profitability and protecting the environment. From the sample data presented above it is obvious that the investments chosen in the industrial and private building sectors are extremely cost effective and will lead to reduced operating cost and thus greater profit. At the same time, it also shows how only the best options are pursued in a private environment. Thus, with proper analysis and greater access to financing the obtainable positive impacts from audits can be even greater. From the limited analysis of this study, an audit policy has great potential. While many people believe this policy requires subsidy or financial support to get initiated, it is rather clear that such a system has the economic viability to become self-sufficient. Implementing an audit programme is one way to reduce carbon emissions, while realizing a profit. Many people today talk about the cost of mitigating carbon, or the cost of carbon credits. Of course this makes sense in a political climate where strict requirements are imposed. However, audits are a way to actually save carbon at a negative cost, or with a net positive benefit.
3.1.6. Economic incentives Fiscal and economic incentives from the State’s budget have been -and are still- used in many countries to overcome financial difficulties at the consumer level and to foster individual decisions as regard energy efficient devices. Situations are very different among countries as to the mechanism and level of the incentives. Program evaluation is necessary to ensure that financial incentives are having the desired effect at minimal cost. Such evaluation are difficult for two reasons : first of all, the overall energy price context is certainly as important in the individual decisions as the fiscal and economic incentives ; secondly, part of the decisions that benefit from fiscal and economic incentives would have been made in any case (free-riders). Investment and administrative costs have to be evaluated and compared to benefits. Results obtained in Chinese national efficient technologies replacement programs in 1980’s and Brazil’s PROCEL program show that the government’s role in energy conservation is crucial in launching initiatives and establishing legal frameworks. Nation wide initiatives focusing on tax stimuli for energy conservation are considered as a base element of new energy policy formulated by the new US administration trying to cope with current energy crunches. Latest energy developments in California, US and Brazil - shortages in energy supply and/or non-affordable energy prices – suggest that benign conditions for investments in energy efficiency could arise spontaneously in specific market situations and time. In the same time government lead initiatives in creation of new incentives to invest in energy efficiency, including tax breaks and easier access to capital markets (bank loans and stock markets) are crucial. The most dynamic factor in the creation of a special energy efficiency market niche is the emergence of ESCO activity in all the economies observed. Economic and fiscal incentives establish the necessary environment to ensure a profitable business schemes by ESCO. To be effective ESCO's need to operate in a market economy with no subsidy on energy prices and with a legal framework.

Energy Efficiency Policies and Indicators: WEC Report 2001
105
3.1.5. Audits énergétiques Les audits énergétiques peuvent être un outil efficace pour économiser l’énergie, tout en améliorant la profitabilité et la protection de l’environnement. Les données montrent que les investissements réalisés dans l’industrie ou dans le secteur du bâtiment privé sont extrêmement rentables et permettent de réduire les coûts de fonctionnement en augmentant le profit. On montre également que le secteur privé ne retient que les meilleures options. Dans ces conditions, avec une analyse correcte et un plus grand accès au financement, l’impact positif attendu des audits peut être encore plus grand. Bien que limitée, cette analyse montre qu’une politique d’audits a un grand potentiel. Même si on considère que cette politique requiert des incitations financières pour être initiée, un tel système a une viabilité économique qui pourrait se suffire à elle-même. La réalisation des programmes d’audits énergétiques est une voie qui permet à la fois de réduire les émissions de carbone et de réaliser un profit. Certains évoquent le coût de limitation du carbone, ou le coût des crédits de carbone. Bien sûr, ceci n’a de sens que dans un climat politique où des conditions strictes seraient imposées. Cependant, les audits sont actuellement un moyen d’économiser le carbone à un coût négatif, ou avec un bénéfice net positif.
3.1.6. Incitations économiques Les incitations fiscales et économiques de l’Etat ont été, et sont toujours, utilisées dans beaucoup de pays pour surmonter les difficultés financières au niveau du consommateur et pour favoriser les décisions individuelles en regard des équipements économes. Les situations entre les pays sont très variées selon le mécanisme et le niveau de ces incitations. L’évaluation des programmes est nécessaire pour s’assurer que les incitations financières ont bien l'effet désiré pour un coût minimum. De telles évaluations sont difficiles pour deux raisons : le contexte global des prix de l’énergie est aussi important dans les décisions individuelles que les incitations. Une partie des décisions qui ont bénéficié des incitations économiques et fiscales auraient peut être été quand même réalisées (effet d’aubaine). L’investissement et les coûts administratifs doivent être évalués et comparés aux bénéfices. Les résultats obtenus dans le programme chinois de remplacement des technologies performantes en 1980 et le programme PROCEL au Brésil montrent que le gouvernement a un rôle crucial dans l’efficacité énergétique en favorisant des initiatives individuelles et en établissant un cadre légal. Les initiatives nationales centrées sur un signal-taxe pour l’efficacité énergétique sont considérées comme un élément de base de la nouvelle politique énergétique de l’administration américaine pour sortir de la crise actuelle. Les développements récents en Californie ou au Brésil (coupures d’électricité ou coût de l’énergie inabordable) suggèrent que des conditions favorables aux investissements en efficacité énergétique peuvent apparaître spontanément dans des conditions de marché et de temps particulières. Les initiatives gouvernementales, en créant de nouvelles incitations pour l’efficacité énergétique, en incluant des ruptures de taxation et en facilitant un accès au marché des capitaux (prêt des banques et marché des actions) s’avèrent décisives. Le facteur le plus dynamique de création de niche pour l’efficacité énergétique est l’émergence d’ESCO dans l’ensemble des économies observées. Les incitations fiscales et économiques établissent un environnement favorable afin d’assurer un marché profitable pour les ESCO. L’efficacité des ESCO dépend de leur insertion dans une économie de marché où les prix de l’énergie ne sont plus subventionnés et dans un cadre institutionnel légal.

Energy Efficiency Policies and Indicators: WEC Report 2001
106
3.1.7. Impact of liberalization on energy efficiency: a preliminary assessment from Latin American countries 17
Numerous countries are currently engaged towards a energy market liberalization process. This trend sometimes relies on formal commitment (European directive on Electricity and Gas) or on a voluntary approach of the government. In this report, we did not formally carry out a study case on that matter, particularly because only few tentatives on assessing the impact of liberalization on energy efficiency have been achieved (AIE and Scandinavian countries). Nevertheless, such study has been done in the context of OLADE economies and related conclusions are reported here. The liberalization of electricity markets and the vertical separation that has been taking place in the sector have had various consequences on the development of energy efficiency in the member countries of OLADE. The first consequence observed by the region’s countries is the impact on energy prices. Generally speaking, it can be asserted that subsidies tend to disappear and, therefore, consumers receive the correct price signals. So that they can become interested in, and receive incentives for, the incorporation of energy efficiency. Nevertheless, it is clear that the signal that real prices represent, by making efficiency measures profitable, is not enough for the large majority of consumers who are not ready to conduct an economic analysis justifying these measures. The sector’s new structure is characterized by a rise in the number of players. As a result of which, in the current situation, the responsibilities for developing energy efficiency are too widely spread out among at least all of the following: power generation, transmission, and distribution utilities, in certain cases with the presence of another player, the marketer. The benefits for a vertically integrated utility do not seem to be evident for some of the new players. The assessment of efficiency programs for an integrated utility permitted the benefits for power generation to be quantified by the reduction in operating costs and the possible displacement of new investments. In the new structure, the improvement in energy efficiency of the stations as a whole, which constitute the entire supply, does not turn out to be the same for an individual player. The power distribution utility, which is remunerated depending on the energy carried to the users, only sees the decline of its income owing to a possible reduction in sales as a result of the implementation of an efficiency program. There are few executives from these utilities who are willing to admit that they would be able to enhance their marketing thanks to the value that is added by efficiency programs and, over the long term, their retention of more efficient clients, which means not only keeping them as clients, but also ensuring their permanence in the system because of greater competitiveness. In the Latin American region, the previous analysis has been confirmed, and the situation is all the more severe because utilities are just recently consolidating their position in the countries and have to tackle urgent programs for their shareholders, such as improved billing/collection, reduction of technical and no technical losses, outsourcing of various activities, integration of local staff to business strategies, among others. The situation that has been described gives energy efficiency a very low priority in a power utility’s plans, if the utility is at all interested in this topic.
17 This section was adapted from a contribution prepared by Mentor Poveda from OLADE

Energy Efficiency Policies and Indicators: WEC Report 2001
107
3.1.7. Impact de la libéralisation sur l’efficacité énergétique: une évaluation préliminaire sur l’Amérique Latine 18
De nombreux pays sont actuellement engagés dans un processus de libéralisation de leur marché énergétique. Cette tendance s’appuie parfois sur une obligation formelle (Directive européenne sur l’électricité et le gaz) ou sur des approches volontaires des gouvernements. Dans ce rapport, nous n’avons pas mené d’étude de cas sur ce sujet, parce qu’il y a eu peu d’évaluations de l’impact de la libéralisation sur l’efficacité énergétique (AIE et pays scandinaves). Cependant, une telle étude a été effectuée dans le contexte des pays de l’OLADE et les principales conclusions sont rapportées ici. La libéralisation des marchés de l’électricité et la séparation verticale ont eu des conséquences variées sur le développement de l’efficacité énergétique dans les pays de l’OLADE. La première conséquence observée dans cette région est l’impact sur les prix de l’énergie. De façon générale, on peut dire que les subventions tendent à disparaître et de fait, les consommateurs reçoivent les signaux prix corrects. Ainsi, s’ils perçoivent des incitations, ils peuvent devenir intéressés par l’efficacité énergétique. Cependant, le signal donné par les prix réels, en rendant les mesures d’efficacité rentables, n’est pas suffisant pour une large majorité de consommateurs qui ne sont pas prêts à conduire des analyses économiques justifiant ces mesures. La nouvelle structure du secteur est caractérisée par un nombre croissant d’acteurs. Le morcellement des responsabilités pénalise le développement de l’efficacité énergétique sachant que sont impliqués : le producteur d’électricité, le transporteur et le distributeur, avec dans certains cas la présence d’un autre acteur, le commercial. Les bénéfices d’une entreprise intégrée verticalement ne semblent pas évidents pour quelques-uns des nouveaux acteurs. Une compagnie intégrée verticalement pouvait évaluer les bénéfices pour la production d’électricité d’un programme d’efficacité énergétique, à l’aune des baisses de coûts de fonctionnement et du retardement des nouveaux investissements. Dans la nouvelle structure, l’amélioration de l’efficacité énergétique de l’ensemble des postes qui constituent l’offre entière, n’est pas la même pour chacun des acteurs. La compagnie de distribution, qui est rémunérée selon le niveau d’énergie distribuée aux utilisateurs, ne voit seulement que la baisse de ses revenus par une réduction possible des ventes résultant de la mise en place de programmes d’efficacité. Peu de responsables de ces compagnies sont prêts à admettre que les programmes d’efficacité énergétique puissent être une politique commerciale qui leur permettrait de retenir sur le long terme plus de clients efficaces, ce qui signifie non seulement de les garder comme clients, mais aussi de s’assurer de leur fidélité dans le système grâce à une plus grande compétitivité. En Amérique Latine, l’analyse précédente s’est confirmée, et la situation est d’autant plus sévère que les compagnies sont en train d’asseoir leur position dans les pays et ont à assumer bien d’autres demandes urgentes de leurs actionnaires comme l’amélioration du recouvrement des factures, la réduction des pertes, techniques ou non, la sous-traitance d’activités, l’intégration du personnel local dans la stratégie d’entreprise. La situation qui vient d’être décrite donne à l’efficacité énergétique une très petite priorité dans la stratégie des producteurs, si seulement cette entreprise est intéressée par ce sujet.
18 Cette section a été adaptée d’une contribution préparée par Mentor Poveda de l’OLADE

Energy Efficiency Policies and Indicators: WEC Report 2001
108
3.1.8. Other measures Although they are not covered explicitly in the survey, some other policy measures deserve also some comments. DSM and IRP programmes carried out by electric utilities are taking an increasing role in energy efficiency policy and measures.
Despite the observed situations, where mandatory standards are more widely adopted, a movement can be seen in favour of an increasing use of voluntary agreements of manufacturers about standards, in particular in Europe (mainly cars and industrial processes). Voluntary agreements are attractive because they sharply reduce the administrative costs of implementing and controlling mandatory standards, and because they are close to industrial experience and practice. Nevertheless, there is no empirical evidence, at this stage, that such voluntary agreements can really be effective in open market economies, where competition is very severe. Research and development on energy efficiency technologies and devices are also taking an increasing share of public budget devoted to energy efficiency in industrialised countries and some major developing countries, like Brazil, China or India. 3.2. Energy efficiency policy monitoring The study clearly shows that energy efficiency indicators are useful to assess the countries situations and developments with respect to energy efficiency . Macro-economic indicators actually sort out the respective influence of economic structures and of sectoral efficiencies in the overall energy efficiency progress of a country, and they actually permit to assess the respective positions of countries in that respect. Sectoral indicators actually allow assessing the influence of end-use efficiency performances on aggregate sectoral efficiency, and then to relate partly the sectoral energy efficiencies to the technological evolution and to the resulting energy savings. From this point of view, countries can be compared among themselves, both in levels and in trends. Nevertheless, the study shows that a lot of progress in data collection still needs to be done in many countries. As a matter of fact, energy statistics and economic statistics remain limited assessing energy demand performance characteristics. The experience of the EU and Norway with the ODYSSEE database should be extended to the other regions; A first attempt by APERC for the APEC economies with the industry sector needs to be consolidated and extended to other sectors. For Latin America, OLADE, with SIEE, has available a comprehensive energy database; the data coverage remain however limited to carry out an evaluation s in terms of energy efficiency indicators. The additional data on economic and technical determinants necessary for more in depth analysis of energy use by sub-sector and end-use need to be organised. Undoubtedly, this rather poor data situation limit drastically the applicability of the indicators and therefore the scope and relevance of country energy efficiency assessment.
Energy Efficiency Policies and Indicators: WEC Report 2001
109
3.1.8 Autres mesures Bien qu’elles ne soient pas couvertes explicitement dans l’enquête, certaines autres politiques méritent d’être commentées. Les programmes de MDE et PIR développés par les compagnies électriques prennent une place croissante dans les politiques d’efficacité énergétique. Malgré les situations observées, où les normes obligatoires sont plus largement adoptées, on peut percevoir un mouvement en faveur de l’utilisation croissante des accords volontaires des producteurs, en particulier en Europe (principalement voitures et procédés industriels). Les accords volontaires sont attractifs parce qu’ils réduisent fortement les coûts administratifs de mise en place et de contrôle des normes obligatoires et parce qu’ils sont proches de l’expérience et des pratiques industrielles. Cependant, à ce stade, il n’y a pas d’évidence empirique de l’efficacité réelle des accords volontaires dans des économies de marché ouvertes où la concurrence est sévère.
La recherche et le développement des technologies économes en énergie mobilisent une part de plus en plus importante du budget public alloué à l’efficacité énergétique et dans les principaux pays en développement comme le Brésil, la Chine ou l’Inde. 3.2. Le suivi des politiques d’efficacité énergétique L’étude montre clairement que les indicateurs d’efficacité énergétique sont utiles pour évaluer les situations des pays et le développement de l’efficacité énergétique. Les indicateurs macro-économiques permettent de dissocier l’influence respective des structures économiques et des efficacités sectorielles dans l’évolution globale de l’efficacité énergétique d’un pays, et ils permettent d’évaluer les positions respectives des pays de ce point de vue. Les indicateurs sectoriels permettent d’abord d’évaluer l’influence des performances énergétiques au niveau de l’utilisation à un niveau sectoriel agrégé, et puis de relier partiellement les efficacités énergétiques sectorielles aux évolutions technologiques et aux économies d’énergie résultantes. De ce point de vue, les pays peuvent être comparés entre eux en niveau et en tendance. L’étude montre cependant que de gros progrès dans la collecte des données restent à faire dans de nombreux pays. De fait, les statistiques énergétiques et économiques restent limitées pour évaluer les caractéristiques des performances de la demande d’énergie. L’expérience de l’UE et de la Norvège avec la base de données ODYSSEE devrait être étendue à d’autres régions. Une première tentative par l’APERC pour les économies de l’APEC dans le secteur industriel et plus récemment dans l’ensemble des secteurs, nécessite d’être consolidée. Pour l’Amérique Latine, l’OLADE, avec SIEE, détient une base de données énergétique détaillée. Cependant la couverture statistique reste limitée pour mener une évaluation en termes d’indicateurs d’efficacité énergétique. Les données additionnelles sur les déterminants économiques et techniques nécessaires pour une analyse en profondeur des usages de l’énergie par sous secteur et usages ont besoin d’être organisées. Indubitablement, cette situation relativement pauvre des données limite sévèrement l’applicabilité des indicateurs et de fait, l’intérêt et la pertinence d’une évaluation de l’efficacité énergétique du pays.

Energy Efficiency Policies and Indicators: WEC Report 2001
110
There is an urgent need to define, at the international level, the basic minimum data requirements that would allow relevant country evaluations and cross-country comparisons on energy efficiency, in particular in view of international discussions on CO2/green house gases effect. The recent effort of EUROSTAT and IEA could serve to define such a minimum requirement. For some countries, where the data situation is good enough, the energy efficiency indicators proposed in this study prove to be effective enough to evaluate energy efficiency policies, from both sides : effectiveness of policy measures, energy efficiency progress achieved. To be fully relevant, such an evaluation should nevertheless be submitted to some effectiveness criteria for the use of public money in the economy: how this money should come back in the economy, through which mechanism, at which speed? Unfortunately, one has to observe that such criteria -if any- are almost never available or public, which makes it very difficult, for example, to judge if the taxpayer money is better used in energy efficiency measures than, for instance, in subsidies for public transport or agriculture or in energy supply infrastructures (eviction effect)? Therefore, in most cases, the evaluation has to be done just in absolute terms, either in purely economic terms (how much is spent, how much is saved?) or in a purely normative way (how close we are to the objective), or a combination of both. In such a case, energy efficiency indicators, as those used in this study, are necessary. If the data situation is good, they are quite comprehensive and sufficient for the evaluation needed. 3.3. General conclusions and recommendations
3.3.1. The overall impact of a package of measures As illustrated on the example of automobile, the effectiveness of a price or taxation measure in curving down the energy consumption growth depends significantly on the technological context, as captured by the specific or unit consumption. The price elasticities of the motor fuel demand are different if the cars consume 5 l/100km or 10 l/100km. Symmetrically, the impact on the energy consumption of a regulatory measure (as thermal building codes or efficiency standards) highly depends on the level of the financial burden that energy puts on the households budget or on the value-added of the enterprises: for example, if somebody cannot afford to heat its badly insulated home above 19°C for financial reasons, he would probably rise his inside temperature level to 21° while moving to a better insulated house. These so called “rebound effect” explain why it is rather frequent that the actual evolution of the energy demand is faster than what the implementation of energy efficiency measures would have suggested at first glimpse. On the one hand, the overall impact of a package of measures could be higher than the addition of the individual impacts of all the measures measured separately. In the case of transports, for example, the short term impact of motor fuel taxation may be enhanced if technological alternatives exist.

Energy Efficiency Policies and Indicators: WEC Report 2001
111
Il y a un besoin urgent de définir, au niveau international, des obligations de délivrer les données de base qui permettraient une évaluation pertinente et des comparaisons internationales sur l’efficacité énergétique, en particulier dans le cadre des négociations internationales sur les gaz à effet de serre. L’effort récent d’EUROSTAT et de l’AIE peut participer à la définition d’une telle obligation minimale. Pour quelques pays, ceux dont les données sont suffisamment bonnes, les indicateurs d’efficacité énergétique proposés dans cette étude prouvent leur utilité pour évaluer les politiques d’efficacité énergétique, sous deux aspects : l’efficacité des mesures et les progrès d’efficacité énergétique réalisés. Pour être totalement pertinente, une telle évaluation devrait cependant être soumise à des critères d’efficacité de l’utilisation des fonds publics dans l’économie. Comment cet argent devrait être recyclé dans l’économie, au travers de quels mécanismes, à quelle vitesse ? Malheureusement, de tels critères, s’ils existent, ne sont pratiquement jamais disponibles ou publics. Cela rend difficile l’évaluation de l’arbitrage public : l’argent du contribuable est-il mieux utilisé dans les mesures d’efficacité énergétique ou, par exemple, dans les subventions aux infrastructures de transport public, de l’agriculture ou de la production d’électricité (effet d’éviction) ? Ainsi, dans la plupart des cas, l’évaluation ne peut être effectuée qu’en valeur absolue, aussi bien en termes purement économiques (combien a été dépensé, combien a été économisé ?) ou de façon purement normative (de combien sommes nous proche de l’objectif ?), ou une combinaison des deux. Dans de tels cas, les indicateurs d’efficacité énergétique, tels ceux utilisés dans cette étude, sont nécessaires. Si la situation statistique est bonne, ils sont relativement compréhensibles et suffisants pour l’évaluation requise. 3.3. Conclusion générale et recommandations
3.3.1. Impact global d’un jeu de mesures Comme l’illustre l’exemple de l’automobile, l’efficacité d’une mesure de prix ou de taxation pour ralentir la croissance de la consommation d’énergie dépend significativement du contexte technologique, tel qu’il est mesuré par les consommations unitaires ou spécifiques. L’élasticité du prix à la demande d’énergie est différente pour une voiture qui consomme 5 l/100 km ou 10 l/100km. Symétriquement, l’impact sur la consommation énergétique d’une mesure réglementaire (telles la réglementation thermique ou les normes d’efficacité), dépend fortement du niveau de la part financière que l’énergie représente dans le budget des ménages ou de la valeur ajoutée de l’entreprise: par exemple, si quelqu’un n’est pas en mesure de chauffer son logement mal isolé au dessus de 19 °C pour des raisons financières, il pourrait probablement augmenter sa température intérieure à 21°C en déménageant dans une maison mieux isolée. Ces effets appelés rebonds expliquent pourquoi il est relativement fréquent que l’évolution récente de la consommation d’énergie soit plus rapide que ce que la mise en oeuvre des mesures d’efficacité énergétique aurait du suggérer au premier abord. D’autre part, l’impact global d’une combinaison de mesures pourrait être plus élevé que la simple addition des impacts individuels de chacune des mesures évalués individuellement. Dans le cas des transports, par exemple, l’impact de court terme d’une taxation des carburants peut être accru si des alternatives technologiques existent.

Energy Efficiency Policies and Indicators: WEC Report 2001
112
Now the question remains whether the impacts of the various measures have the same nature and the same durability. In the case of buildings for example, an increase of energy price through a taxation measure may have a sharp short term impact, which would progressively vanished as time goes on and revenues increase, if no appropriate technical offer develop simultaneously. On the reverse, efficiency standards on new equipment have small impacts on the short term, but a growing influence over time, if people find attractive to purchase the most efficient new equipment. In conclusion, economic and regulatory measures are highly complementary: economic measures are likely to have long lasting impacts if backed by appropriate technical market conditions. Regulatory measures are as much efficient as accompanied by appropriate price market conditions. In order to capture the actual whole impact of a package of measures, and sometimes to adjust this package to limit the rebound effect, it is necessary to rely on mix of measures implemented coherently. Global energy efficiency indicators as those presented in this report allow to assess the impact of mix of measures.
3.3.2. Regulatory instruments: carrot and stick is the most efficient policy Regulatory instruments are as much efficient and cheap to implement as they do not create adverse reactions from economic agents. A first condition, as shown by the procedure adopted for thermal building standards in many countries: the regulation should not result with an increase of the overall cost of the energy service for the consumer. Thermal building standards are easily accepted and widely implemented if the people are convinced that the extra cost of the insulation materials is paid back by the energy savings. Otherwise, it is most likely that these standards would be poorly respected, or the cost for control would be huge. However standards reflect the present technological state of the art and it is necessary to implement regulatory instruments in a dynamic approach, strengthening the exigencies with the availability of new efficient available technologies. A second observation, as shown by the voluntary agreements or the labels, is that producers of goods often prefer to be associated “freely” to the process of creating new technical standards, rather than having to support mandatory regulations imposed to them. Negotiations to come out with voluntary agreements or labels are easier, could be more rapid and more effective than confrontations resulting of the imposition of mandatory regulations. However these normative regulations remain still a powerful incentive for producers to respect their commitments. Therefore, the question of monitoring the effectiveness of these regulatory measures remains crucial in this process of stick and carrot policy. The technical indicators developed in this study are the appropriate monitoring tools for such a policy.

Energy Efficiency Policies and Indicators: WEC Report 2001
113
Maintenant, la question est de savoir si les impacts des différentes mesures sont de même nature et de même durabilité. Dans le cas des bâtiments par exemple, une augmentation des prix de l’énergie par le biais d’une taxation peut avoir un impact de court terme élevé, qui pourrait progressivement se volatiliser au fur et à mesure que le revenu augmente, si une offre technologique appropriée ne se développe pas simultanément. A l’inverse, les normes d’efficacité sur les nouveaux équipements ont des impacts faibles sur le court terme, mais ont une influence grandissante au cours du temps, si les consommateurs estiment que l’achat de ces nouveaux équipement plus efficaces est attractif. En conclusion, les mesures économiques et réglementaires sont très fortement complémentaires : les mesures économiques sont susceptibles d’avoir un impact rémanant si elles sont épaulées par des conditions de marché techniques appropriées. Les mesures réglementaires seront d’autant plus efficaces qu’elles seront accompagnées par des conditions de prix du marché appropriées. Afin de capturer l’impact global récent d’un paquet de mesures, et parfois d’ajuster cette combinaison pour limiter l’effet rebond, il est nécessaire de se reposer sur une combinaison de mesures mises en œuvre implantées de façon cohérente. Les indicateurs globaux d’efficacité énergétique que nous avons proposés dans ce rapport permettent d’évaluer l’impact d’une telle combinaison de mesures.
3.3.2. Les instruments réglementaires : la carotte et le bâton restent la politique la plus efficace.
Les instruments réglementaires sont d’autant plus efficaces et moins coûteux à mettre en place qu’ils ne créent pas de réactions négatives des agents économiques. Une première condition, comme le montre la procédure adoptée pour les normes d’efficacité des bâtiments dans beaucoup de pays, est que la réglementation ne devrait pas entraîner d’augmentation du coût global du service énergétique pour le consommateur. Les normes d’efficacité thermique sont facilement acceptées et largement répandues si les utilisateurs sont convaincus que les coûts supplémentaires des matériaux d’isolation sont payés en retour par les économies d’énergie. Sinon, il est à peu près sûr que ces normes seront très peu respectées, et que le coût de contrôle sera énorme. Cependant, les normes reflètent l’état actuel de l’art de la technologie et il est nécessaire de mettre en place des instruments réglementaires dans une approche dynamique, renforçant les exigences selon la disponibilité des nouvelles technologies efficaces. Une seconde observation, tels que le montrent les accords volontaires ou l’étiquetage, est que les producteurs de biens préfèrent le plus souvent d’être associés “librement” au processus de création de nouvelles normes, plutôt que de se voir imposer une réglementation. Les négociations à venir sur les accords volontaires ou sur l’étiquetage seront plus faciles, peut-être plus rapides et plus efficaces qu’une confrontation résultant d’une imposition de réglementations obligatoires. Cependant, ces réglementations normatives restent toujours un instrument performant pour contraindre les producteurs à respecter leurs engagements aux producteurs. Ainsi, la question du suivi de l’efficacité des mesures réglementaires reste un point crucial dans le processus d’une politique de la carotte et du bâton. Les indicateurs techniques développés dans ce rapport sont un outil de suivi approprié de ce type de politique.
Energy Efficiency Policies and Indicators: WEC Report 2001
114
3.3.3. Market instruments and the necessary equilibrium between supply and demand measures
The example of the measures devoted to mitigate the use of cars in order to make mobility more energy efficient will help understanding this question. Market instruments as road pricing or motor fuel taxation are as much effective to decrease the use of cars as the people can use alternative modes of transport. People using their cars to go to work distantly are almost insensible to road pricing or taxation if no alternative is available; otherwise, their sensitivity might be significant. In general terms, market instruments are as much effective and long lasting as they are backed by supply instruments, either turned to the development of infrastructures or to the development of appropriate technical offer. The cost effectiveness of these developments should therefore be assessed taking into account all costs and benefits involved (depending in particular on market instruments), including in many cases the reduction of externalities resulting from the use of these infrastructures or new products and services. In order to monitor these “push-pull” policies, it is necessary to use indicators that allow to track the behaviours of the economic agents, as those used in this study: for example to track whether the people react to an increased taxation by limitating their mobility (short term reversible impact) or by moving to public transportation.
3.3.4. Energy efficiency policies in the new decade The main justification to implement energy efficiency policies related to long-term issues is: the global warming mitigation, but also the depletion of oil and gas resources around 2030-2050. In non-OECD countries, energy efficiency is also a way to alleviate the invest constraints on the supply side. Since 2000, with the sharp increase in the oil price, countries, especially the less developed ones, are again facing macro economic constraints, as in the0’s. The liberalisation of the energy sector and the globalisation of economies make the intervention of governments much more difficult as unilateral measures (such as taxes on energy) could weaken domestic industries facing international competition. However, the Climate Change issue will impose a constraint on energy consumption even if flexibility mechanisms were able to alleviate this for a while. The CO2 emission tradable permits may allow Annex 1 countries to avoid strong constraints on their industry in the short term but in the long term, the prices of permits should increase, making energy more and more costly. The co-ordination at international level on certain policies and measures would help to overcome the obstacles to the implementation of both standards and price signals (mainly obstacles due to international competition).

Energy Efficiency Policies and Indicators: WEC Report 2001
115
3.3.3. Les instruments de marché et le nécessaire équilibre entre les mesures d’offre et de demande.
L’exemple des mesures dévolues à la limitation de l’usage des voitures afin de rendre la mobilité plus efficace en énergie nous permettra de comprendre cette question. Les instruments de marché tels que le péage routier ou la fiscalité des carburants sont d’autant plus efficaces pour faire décroître l’usage de la voiture qu’il existe des modes de transports alternatifs. Les personnes qui utilisent leur voiture pour aller à leur lieu de travail éloigné sont pratiquement insensibles aux péages ou à la taxation s’il n’y a pas d’alternative, alors que sinon, leur sensibilité pourrait être significative. En termes généraux, les instruments de marché sont d’autant plus efficaces et d’effet durable qu’ils sont complétés par des instruments d’offre, orientés soit vers le développement d’infrastructures soit vers le développement approprié d’une offre technique. La rentabilité de ces développements doit être évaluée en tenant compte de tous les coûts et bénéfices mis en jeu (qui dépendent notamment des instruments de marché), en incluant, dans beaucoup de cas, la réduction des externalités résultant de l’utilisation de ces infrastructures ou des nouveaux biens et services. Afin de suivre ces politique « push-pull », il est nécessaire d’utiliser des indicateurs qui permettent de traquer les comportements des agents économiques, tels que ceux utilisés dans cette étude : par exemple, pour déceler si les personnes réagissent à une augmentation de la taxation plutôt en limitant leur mobilité (impact de court terme réversible) ou s’ils vont se transférer sur les transports publics.
3.3.4. Les politiques d’efficacité énergétique dans la nouvelle décade La principale justification pour mettre en place sur le long terme des politiques d’efficacité énergétique est la lutte contre le changement climatique, mais aussi l’épuisement des ressources en pétrole et gaz vers les années 2030-2050. Dans les pays hors OCDE, l’efficacité énergétique est aussi une voie pour alléger les contraintes d’investissement de l’offre. Depuis 2000, avec la forte croissance des prix du pétrole, les pays les moins développés doivent faire face à des contraintes macroéconomiques supplémentaires, comme dans les années quatre vingt. La libéralisation du secteur énergétique et la globalisation des marchés rendent l’intervention de l’Etat beaucoup plus difficile pour prendre des mesures unilatérales (comme une taxe sur l’énergie) qui peuvent affaiblir les industries locales face à la concurrence internationale. Cependant, les problèmes du changement climatique imposeront une contrainte sur la consommation d’énergie même si les mécanismes de flexibilité allégeront celle-ci pour un temps. Les permis d’émission négociables peuvent permettrent aux pays de l’Annexe 1 d’éviter de fortes contraintes sur l’industrie à court terme, mais sur le long terme, le prix des permis devrait augmenter, rendant l’énergie plus coûteuse. La coordination à un niveau international sur certaines politiques et mesures devrait aider à surmonter les obstacles à la mise en place à la fois des normes et des signaux prix (principalement les obstacles dus à la concurrence internationale).

Energy Efficiency Policies and Indicators: WEC Report 2001
116
At the domestic level, governments should incorporate energy efficiency into all main sectoral public policies (land planning, transport infrastructures, social housing policy, urban planning) ; a synergy could be found between those in charge of these policies and the long term issues of energy efficiency policies. The investment decisions taken in these fields of infrastructure should incorporate the perspective of growing energy prices and constraint on CO2 emissions. The mitigation of CO2 emissions of transport sector is undoubtedly submitted to this approach. This could be done through a value of carbon being adopted in public decisions to orientate the choices toward energy efficiency (a low initial value but growing regularly). This alliance between energy efficiency policies and other public policies will make the mix of market instruments more efficient. The energy efficiency « Service » of the World Energy Council aims at facilitating exchange of information and sharing experiences on energy efficiency measures among different countries and economies in the world. This forum should help governments to select appropriate and cost effective sets of measures among each sector, taking into account national circumstances. The energy efficiency indicators are a unique tool allowing to quantify the global impact of the mix of measures implemented in each sector. The enhancement of a more energy efficient economy is a challenge for all countries : the climate change issue, the lack of public resources for investment on the energy supply side for many countries and the perspective of limited fossil energy resources at long term are the strong motivations for pursuing the exchange of experience on policies dedicated to increase energy efficiency : the World Energy Council is a unique forum for this task.

Energy Efficiency Policies and Indicators: WEC Report 2001
117
Au niveau intérieur, les gouvernements devraient incorporer l’efficacité énergétique dans toutes les politiques publiques sectorielles (aménagement du territoire, infrastructures de transport, politique sociale de l’habitat, planification urbaine) ; une synergie pourrait être trouvée entre ceux en charge de ces politiques et les problèmes de long terme des politiques l’efficacité énergétique. Les décisions d’investissement prises dans le domaine des infrastructures, bâtiments de l’Etat ou planification urbaine par exemple, doivent incorporer la perspective de croissance des prix de l’énergie et des contraintes sur les émissions de CO2 grandissante. La limitation des émissions de CO2 dans le transport est indubitablement soumise à cette approche. Cela pourrait être établi par l’utilisation, dans les décisions publiques, d’une valeur du carbone, afin d’orienter les choix vers l’efficacité énergétique (une valeur initiale basse mais régulièrement croissant). Cette alliance entre les politiques d’efficacité énergétique et les autres politiques publiques vont rendre plus efficace la combinaison des instruments de marché. Le « service sur l’efficacité énergétique » du CME à pour but de faciliter les échanges d’information et le partage d’expériences sur les mesures d’efficacité énergétique entre les différents pays et économies du Monde. Ce forum devrait aider les gouvernements à sélectionner les jeux de mesures les plus appropriés et rentables dans chacun des secteurs, en tenant compte des caractéristiques nationales. Les indicateurs d’efficacité énergétique sont un instrument unique qui permet de quantifier l’impact global de la combinaison de mesures mise en place dans chacun des secteurs. Le renforcement d’une économie plus efficace en énergie est un défi pour tous les pays. Le problème du changement climatique, les lacunes de ressources financières pour investir sur l’offre d’énergie pour beaucoup de pays et la perspective de limitation des ressources d’énergie fossile sur le long terme sont des motivations très fortes pour la poursuite des échanges d’expérience sur les politiques dévolues à l’amélioration de l’efficacité énergétique. Le Conseil Mondial de l’Energie est un forum unique pour un tel objectif.
Energy Efficiency Policies and Indicators: WEC Report 2001
118
BIBLIOGRAPHY Energy efficiency indicators and policies evaluations ADEME-SAVE-EnR (2001) : « Cross countries comparison on energy efficiency indicators, phase 6 », 4 volumes, Paris ; ADEME-SAVE, Bosseboeuf D., Lapillonne B. (2000) : « Energy efficiency indicators in Central and Eastern Europe , pilot project in Hungary and Bulgarria », Final report, Paris ADEME-SAVE (2000) : « Monotoring tools for energy efficiency in Europe », proceedings of ADEME-SAVE conference in April 2000 Brusssels, Paris. ADEME, Bosseboeuf D., Lapillonne B., Eichhammer W.(1999) : « Energy efficiency indicators : the European experience, 167 p., Paris APERC (2001) : « Energy efficiency indicators : a study of energy efficiency indicators in APEC economies », p. 161, Tokyo APERC (2000) : « Energy efficiency indicators for industry in the APEC Region », p. 153, Tokyo Bosseboeuf D., Château B. (2000) : « The link between indicators and CO2 policies », UNFCCC workshop on policies and measures, Copenhagen, 2000 ECEEE : (2001) : « Further than ever from Kyoto ?, Rethinking energy efficiency can get us there », 2001 summer study (Mandelieu) », volumes 1and 2, Paris IEA (1997): « Energy efficiency initiative », energy policy analysis, vol 1 and 2, Paris IEA (1997) : « The link between energy and human activity), p 119, Paris WEC (1998), Moisan F, Bosseboeuf D. and al. : « Energy efficiency policies and indicators », 92 p., London ; Efficiency standart and labelling for electrical appliances APEC (1999) : “Energy Efficient Strategies, Review of Energy Efficiency Test Standards and Regulation in APEC Member Economies”, Main Report. Egan, K. (1999) : Energy efficiency standards for electrical appliances : regulatory and voluntary approaches in the Philippines and Thailand, Compendium on Energy Conservation Legislation in Countries of the Asia and Pacific Region, United Nations ESCAP; Egan, K., Du Pont, P. (1998) : “Asia's new standard for success : energy-efficiency standards and labelling programs in 12 Asian countries”, IIEC report; Geller, H., Goldstein D.,B., (1999) : “Equipment Efficiency Standards : Mitigating Global Climate Change at a Profit”, Physics and Society, vol 28, n°2; Geller H.(1997) : “ National appliance efficiency standards in the USA: cost-effective Federal regulation”, Energy and Buildings, vol 26, 1997. IEA (2000) : “Energy Efficiency labels and standards for appliances and equipment”, Energy efficiency policy profiles, draft report, Paris, 2000. Thorne, J. , Kubo, T. & Nadel, S. (2000) : “Opportunity Knocks : capturing pollution reduction and consumer savings from updated appliance efficiency standards”, ACEEE/ASAP, Washington. World Bank (1996), “Thailand - Promotion of electricity energy efficiency” – GEF grant mid term review, East Asia and Pacific Regional Office; Transport Fulton IEA (2000) : “ Fuel economy improvement, policies and measures to save oil and reduce CO2 emissions”, COP, The Hague Goodwin (1988) : “Evidence on car and public transport elasticities”. TSU paper 427, Oxford University Hivert (1996) : « Dieselisation et nouveaux dieselistes: les évolutions récentes », actes INRETSn° 59 Johansson and Schipper L.(1997) : “Long run fuel demand of cars”, journal of Transport economics and policy;

Energy Efficiency Policies and Indicators: WEC Report 2001
119
Orfeuil J.P. (1990) : « Prix et consommation de carburant dans les transports routiers de voyageurs », Revue de l’énergie Regulation for new buildings Australian Greenhouse Office (2000) : “International Survey of Building Energy Codes”, ISBN 1 876536 32 2, 2000 (www.greenhouse.gov.au/energyefficiency/buildings) California Energy Commission (1999) : “Energy Efficiency Standards for Residential and Non-
Residential Buildings”, P400-98-001;Australian Greenhouse Office Industrial standard of the People's Republic of China (1996) : “, JGJ 26-95 + Annexes, Energy
conservation design standard for new heating residential buildings (http://arch.hku.hk/research/BEER/jgj26-95/JGJ26-95.htm)
Hui, S. C. M., (2000). : « Building energy efficiency standards in Hong Kong and mainland China, In Proc. of the 2000 ACEEE Summer Study on Energy Efficiency in Buildings, 20-25 August 2000, Pacific Grove, California.
Joseph C. Lam and S. C. M. Hui (1996) : “A review of building energy standards and implications for Hong Kong. Building Research And Information Volume 24, Number 3;
Sinton et al. (1999) : “Status Report on energy efficiency Policy and Programs in China”, URL http://eetd.lbl.gov/EA/partnership/China/pubs/China.061299.PDF
CEC (2001) : “Proposal for a Directive of the European Parliament and of the Council on the energy performance of buildings”, COM(2001) 226 final, Brussels, 11.5.2001 (http://europa.eu.int/eur-lex/en/com/pdf/2001/en_501PC0226.pdf)
FhG-ISI (1999) : “A Comparison of Thermal Building Regulations in the European Union”, MURE Database Case Study N° 1, Study carried out in the framework of the MURE project, financed by the SAVE Programme of the EC, http://www.mure2.com/Mr-fr5.htm
BMU (2000): „Nationales Klimaschutzprogramm“. Beschluss der Bundesregierung vom 18. Berlin. http://www.bmu.de
BMWi (2000): Dr. Müller/Bodewig: Die neue Energieeinsparverordnung bietet große Chancen für den Bausektor und den Klimaschutz. Pressemitteilung vom 29.11.2000. Berlin. http://www.bmwi.de
BMWi/BMBau (1997): „Neue Energieeinsparverordnung – Eckpunktepapier“. Bonn; Eichhammer, W., Schlomann, B. (1998): A Comparion of Thermal Building Regulations in the
European Union. MURE Database Case Study. Karlsruhe Joseph C. Lam and S. C. M. Hui (1996) : “A review of building energy standards and implications
for Hong Kong”. Building Research And Information Volume 24, Number 3 Hui, S. C. M., (2000) : « Building energy efficiency standards in Hong Kong and mainland China”, In
Proc. of the 2000 ACEEE Summer Study on Energy Efficiency in Buildings, 20-25 August 2000, Pacific Grove, California.
Audits CEC-DGTREN-SAVE, (2001) : “The Guidebook for Energy Audits, Programme Schemes and Administration Procedures.” SAVE – Project Final Report. ECPF. “Thailand 2000-2004 Plan, Implemented from Energy Conservation Promotion Act, B.E. 2535. Energy Conservation Promotion Fund. http://www.nepo.go.th/encon/encon-fund00.html. Harris, J., Anderson, J. and Shafron, W. (1998). “Energy Efficiency Investment in Australia”. ABARE Research Report 98.2. Canberra. KEMCO (2000) : “Energy Audits Suggest Rational Energy Use in Building Industry”. Brochure and Personal Communication with Ms. Gyung-Ae Ha. Motiva, (2001) : “Energy Audits in Finland.” BMU, Berlin; US DOE (2001) : “US Department of Energy’s Weatherization Assistance Program”. Web page http://www.eren.doe.gov/buildings/weatherization_assistance/ US DOE (2001) : “US Department of Energy’s Industrial Assessment Center”. Web page http://www.oit.doe.gov/iac/