
VirtualTransits : a Platform for Network Virtualization across Data Centers

Energy Efficiency and Server Virtualizationin Data Centers: An Empirical Investigation
Yichao Jin and Yonggang WenDivison of Computer Communications
School of Computer EngineeringNanyang Technological UniversityEmail: {yjin3, ygwen}@ntu.edu.sg
Qinghua ChenDept. of Information Technology
Yangtze Delta Institute ofTsinghua University, ChinaEmail: [email protected]
Abstract—With a growing concern on the considerable energyconsumed by data centers, research efforts are targeting towardgreen data centers with higher energy efficiency. In particular,server virtualization is emerging as the prominent approachto consolidate applications from multiple applications to oneserver, with an objective to save energy usage. However, littleunderstanding has been obtained about the potential overhead inenergy consumption and the throughput reduction for virtualizedservers in data centers. In this research, we take the initiative tocharacterize the energy usage on virtualized servers. An empiricalapproach is adopted to investigate how server virtualizationaffects the energy usage in physical servers. Through intensivedata collection and analysis, we identify a fundamental trade-off between the energy saving from server consolidation andthe detrimental effects (e.g., energy overhead and throughputreduction) from server virtualization. This characterization laysa mathematical foundation for server consolidation in green datacenter architecture.
I. INTRODUCTION
With the accelerating adoption of cloud computing, datacenters, which serve a pivot role in cloud computing, areconsuming a significant amount of energy. It was estimateddata centers in the USA consumed 61 billion kWh electricityin 2006. This amount has doubled the consumption in 2000,and was expected to double again by the end of 2011 [1].Hence, how to tame the explosive power consumption has beenagreed as one of the key challenges for future data centers.
Recently, server consolidation is touted as an effective wayto improve the energy efficiency for data centers. In thisapproach, applications running on multiple servers can beconsolidated into one server via virtualization. As a result, idleservers in data centers could be turned off to reduce energyusage by server virtualization. It has been demonstrated that,by optimizing the data center operations via virtualization, upto 20% of energy consumption can be saved in data centers[2]. However, virtualization would also lead to potential hazardeffects, such as a possible energy overhead or a possiblereduction in maximum throughput. These detrimental effects,if not well understood, could offset the benefits of servervirtualization. Therefore, clear understanding and precise mod-eling of server energy usage in data centers will provide afundamental basis for data center operational optimizations.
In this paper, we investigate the impact of server virtual-ization on energy usage for data centers, with an objective to
provide insights to optimize data center operations. We adoptan empirical approach to measure the energy consumed byservers under different virtualization configurations, includinga benchmark case (i.e., physical machine) and two alternativehypervisors (i.e., Xen and KVM), in which a physical serveris virtualized into multiple virtual machines (VM). We obtainstatistics for CPU usage, task execution time, power andenergy consumption, under both local computing intensivetasks and networking intensive traffic, corresponding to twoimportant resources, computing and networking in cloud com-puting and data centers [3].
Our in-depth analysis on empirical characterization gener-ates fundamental insights of server energy usage in the contextof server virtualization, including:
• A significant amount of power is consumed even whenthe server is idle, thus opening an opportunity for serverconsolidation in data centers for reducing energy cost.
• Virtualized servers consume more energy than physicalones, for both computing and networking intensive traffic.The energy overhead from virtualized servers increases asthe utilization of physical resources increases.
• The energy overhead resulted from server virtualizationhighly depends on the hypervisor used, which in turn isdetermined by the software architecture of the hypervisor.
• For a given traffic load, the energy cost can be minimizedby launching an optimal number of virtual machines.
• Physical servers, if a multi-core optimization mechanismis absent, could consume more energy than virtualizedservers, when running multi-process applications.
These empirical insights further suggest a fundamentaltrade-off in data center virtualization. This trade-off lies be-tween the energy saving from shutting down idle serversand the detrimental effects (i.e., the energy overhead and thethroughput reduction from hypervisor) due to virtualization.
The rest of this paper is structured as follows. Section IIshows the related work. Section III describes the virtualizationmodels. Section IV illustrates our detailed experimental setup.Section V presents the empirical results and the engineeringinsights. Section VI explains the fundamental trade-off inserver virtualization and its application to server consolidation.Section VII concludes this work.

II. RELATED WORK
[4] presents a quantitative analysis of Xen and KVM,focusing on the overall performance, isolation and scalabilityof virtual machines running on them. An extensive empiricalmeasurement on such evaluation was conducted in [5].
The architectural principles for energy-efficient manage-ment of resource allocation policies, scheduling algorithmswere discussed in [6], demonstrating the immense potentialto offer significant cost savings under dynamic workloadscenarios. [7] reviewed the methods and technologies currentlyused for energy-efficient operation of computer hardware andnetwork infrastructure. It also concluded that cloud computingwith virtualization can greatly reduce the energy consumption.
Another area of study in green computing concentrates onthe energy cost style. [8] characterized the energy consumptionpattern of desktop PC. [17] created a power simulator for webserving workloads that is able to estimate CPU energy usage.
However, few researches are conducted for virtualized datacenters and the tradeoffs in terms of energy consumptionand service capability. So the novelty of this research is theempirical investigation from such perspective.
III. SERVER VIRTUALIZATION MODEL
This section compares two leading virtualization models,Xen and KVM, including their implementation mechanismsin I/O, CPU and networking resource management.
A. Virtualization Model OverviewHypervisor, also refers to virtual machine manager (VMM),
is one of the virtualization techniques that allows multipleoperation systems (OSs) to run concurrently on one server.Existing hypervisors, based on their relationship with thehardware platform, can be classified into two alternative types[9]. Specifically, Xen is a type-1 hypervisor, which directlyinterfaces with the underlying hardware and uses a privilegeddomain 0 to manage other kernel modified guests [10]. KVMis designed as a type-2 hypervisor, in which the virtualizationinterface acts the same as the actual physical hardware [11].
B. Virtualized I/O MechanismXen exposes a hypercall mechanism (also known as paravir-
tualization interface), that all guest OSs have to be modifiedto perform privileged operations (e.g., updating page table).Besides, event notification mechanism is proposed to delivervirtual interrupts derived from real device interrupts to VMs.
Oppositely, KVM typically uses full virtualization [11].Guest OSs above KVM don’t need to change, and they appearas normal Linux processes. When I/O instructions are issuedby guest OSs, a process context switch in the hypervisor isenabled to allow I/O signals passing through.
The difference in virtualized I/O mechanisms for Xen andKVM directly impacts the energy consumption for virtualizedservers. Xen allows guests to make system calls without in-voking the kernel of host OS, whereas KVM incurs additionalkernel operations to support I/O behaviors. The additionaloperations will probably translate to extra CPU cycles andmemory access, which further lead to extra energy usage.
C. Virtualized CPU Model
The default CPU scheduler in Xen is a Credit-Based sched-uler [13]. This scheduler, running on a separate accountingthread in the host, allocates certain credits to each virtualizedCPU (VCPU). When a VCPU runs, it consumes its credit.Once the VCPU runs out of the credit, it only runs whenother more thrifty VCPUs have finished their executing [14].
KVM uses the regular Linux CPU and memory scheduler[15]. It is known, by default, KVM makes use of a CompletelyFair Scheduler (CFS) to treat every guest as a normal thread.Each task running on KVM has a priority, which determinesthe amount of CPU cycles and memory allocation on it.
In spite of the different mechanisms, the objectives of thesetwo CPU schedulers are to balance global load on multi-coresto achieve better allocation, which will be verified by us.
D. Virtualized Networking Model
Xen, by default,uses bridging and virtual firewall router(VFR) within domain 0 to allow all domains to appear onthe network as individual hosts. In comparison, KVM usesnetwork TUNnel/network TAP based on networking virtual-ization in Linux kernel to create virtual network bridge androuting. The bridge essentially emulates a software switch.
This difference could lead to more energy consumed byKVM than that by Xen, when they are exposed to networking-intensive tasks, due to more software operations required byKVM. On the other hand, Xen takes advantage of its modifiedinterface that needs relatively less software participation.
IV. EXPERIMENTAL SETUP
This section describes the setup for our measurements onenergy usage in the context of server virtualization.
A. Physical Setup
Figure 1 illustrates the physical setup of our experiment,which consists of three identical servers. The machines undertest are Inspur 3060 servers, each of them contains a quad-coreIntel 2.13 GHz Xeon processor, 2 GB RAM, 500 GB hard diskand an 1 Gigabit Ethernet card. All of them are connected toa test intranet over a D-link GDS-1024T 1000 Base-T switch.Kill-A-Watt power meters, with a standard accuracy of 0.2%,measure the energy usage of each server. CentOS 5.6-final-x86 64 with Linux kernel 2.6.18 is used as our OS platformfor both host and guest systems. Xen 3.0.3 and KVM 83 areinstalled on server B and C respectively. The 3 guest virtualmachines are allocated with 4 VCPUs, 512 MB RAM and 50GB image. We leave all the software parameters intact.
Our experiment is controlled by another computer, whichis also connected to the intranet as a monitor to obtain thebenchmarking time, the energy and power consumption. Andeach server is responsible for gathering its average CPU usage.
B. Test Case Design
We begin with collecting the background energy consump-tion when all the servers are idle. Following that, a set of localand network traffics are launched to stress all three servers.Detailed test cases are explained as follows.

Fig. 1: Experimental Setup: 3 configured systems, a non-virtualized server, a Xen-virtualized server, a KVM-virtualized server
1) Local Computation Benchmark: bc command in Linuxis used to calculate the constant π into an accurate level(100,000 digits after the decimal point). We simultaneouslyrun multiple instances to generate computing-intensive loads.
Five cases with the number of concurrencies ranging from3 to 7, are tested for 2 or 3 active domains. On the physicalmachine, all the instances are executed over the same OS,while on the virtualized servers, the concurrent instances aredistributed evenly across all the active domains.
2) Http Request Benchmark: The network-intensive trafficbenchmark is simulated through HTTP requests, similar to theweb-server workload benchmark used in [16].
On the server side, three Apache servers are configured onall servers under test. On the physical one, the three HTTPservers are executed on 3 TCP ports for traffic segregation.For virtualized ones, the three instances are evenly distributedacross all active guest domains for 2 or 3 active domains. Thesame TCP ports are used for fair comparison. The contentsstored on the HTTP servers are 1000 unique files retrievedfrom a commercial web site, with mean file size of 10.8 KB.
On the client side, we use ab (Apache Bench) tool tosimulate real web traffic. Three clients are configured togenerate http GET requests at specific rates, each of whichdedicates to one Apache server instance. Every client sends5000 requests for each file. In this test profile, the overall sizeof data transferred can be as large as approximately 150 GB.
Our experiment generates various request rates to scope theenergy usage as a function of the workload. Specifically, 2500reqs/s, 5000 reqs/s, 10000 reqs/s and 15000 reqs/s are usedto simulate low, moderate, high and peak web traffic loads,suggested by the workload of real commercial web server [17].
V. EMPIRICAL RESULTS AND FUNDAMENTAL INSIGHTS
This section presents our empirical findings from the exper-iments, which further generalize a few fundamental insights.
A. Background Energy Consumption
In figure 2, we plot the background power consumption ofthe three configured servers, where the bar indicates the aver-age power consumption, and the line refers to the fluctuation.The following findings are obtained from figure 2.
Fig. 2: Background Power Consumption
Finding (a): All the servers consume the same power (about2.8W) when turned off, but plugged into the power supplies.
Finding (b): When servers are turned on but active VMsstay idle, the power consumption on different servers variesfrom each other. The power consumed by the Xen-based serverand the physical server are almost the same. In particular,63.1W (3 active VMs) and 63.0W (2 active VMs) of power isconsumed by the Xen-based server, which is 0.47% and 0.32%more than 62.8W consumed by the physical server. While theKVM-based server incurs a much higher overhead, consuming70.1W (11.6% overhead) for 3 active VMs and 68.8W (9.55%overhead) for 2 active VMs. Moreover, the power usage of theKVM-based server fluctuates within a wider range.
The Finding (b) can be explained by the different impacton CPU and RAM usage by Xen and KVM. The CPUutilization of the idle physical server is generally less than0.3 %, compared to 0.7-0.8 % for the Xen-based server, and0.8%-2.6% for the KVM-based server. The extra CPU usageof virtualized servers accounts for a portion of the energyoverhead. The rest energy overhead for the KVM-based servercan also be attributed to the large memory footprint in KVM,as indicated by the results of memory test in [5].
B. Local Calculation Benchmark
Results from local computation benchmark are depicted infigure 3 and 4. Observations on them are given as follows.
Finding (c): The virtualized server could consume lessenergy than the physical server does. Specifically, when 5instances are executed (the instance number is one more than

(a) CPU Usage Comparison (b) Power Consumption Comparison
(c) Completion Time Comparison (d) Energy Consumption Comparison
Fig. 3: Statistics for Local Task Benchmark
Fig. 4: Relative Energy Overhead of Local Task Benchmark
the number of CPU-cores), the energy overhead is negativefor Xen-based servers, as the valley point shown in figure 4.
Such an observation can be understood as the inter-playbetween the concurrent processes and the CPU cores in amulti-core server. For the physical server, we observe that 4instances are finished first and the last instance is completedmuch later. This is further verified by the observation that theCPU usage maintains nearly 100% until the first 4 instancesare completed, and afterwards it drops to around 25%. Incomparison, in the virtualized servers, all the instances arecompleted almost at the same time. The CPU usage on theXen-based server maintains at a high level of 99.8%, comparedto 87.7% for the physical server. In this case, the Xen-basedserver, either running 2 or 3 VMs, takes around 10% lesstime and consumes 11% less energy than that of the physicalserver. For the KVM-based server, the advantage of the CPUscheduler is reversed by the extra penalty of hypervisor in mostcases, except for the case when 2 active VMs are configured,resulting in a saving of 2% energy than the physical server.This finding suggests that, if there is no binding betweenrunning processes and CPU-cores, native operation system cannot truly take advantage of multi-core architecture; in contrast,virtualized systems, based on either Xen or KVM, is able to
(a) CPU Usage Comparison (b) Power Consumption Comparison
(c) Completion Time Comparison (d) Energy Consumption Comparison
Fig. 5: Statistics for HTTP Benchmark
partition computing resources into smaller pieces to achievebetter resource allocation across active VMs to save energy.
Finding (d): The KVM-based server consumes more energythan that of the Xen-base server. For example, when processing7 parallel tasks, 2 KVM VMs consumes 5.4% energy morethan that based on 2 Xen VMs, and the gap reaches 23%between 3 KVM VMs and 3 Xen VMs. It is because the KVMhypervisor consumes more CPU cyles and occupies highermemory footprint, compared to the Xen hypervisor. The addi-tional requirement translates into higher energy consumption.
Finding (e): The number of active VMs affects the energyusage for the KVM-based server. Particularly, when config-uring 3 active VMs, the KVM-based server consumes moreenergy than that consumed by 2 active VMs configured on thesame server. This can be attributed to the frequent Lock HolderPreemption (LHP) mechanism, investigated by [18]. A guestVCPU in the KVM-based server may be preempted when thehost de-schedules the VCPU threads. If the preempted VCPUis running in a critical section, the lock will be held a certaintime from the perspective of the guest VM. The probability ofLHP is higher with more active VMs. Once LHP occurs, CPUresources are simply wasted in the lock holding period, whichin turn increases the task completion time. So the averagepower consumption for the KVM-based server with 3 activeVMs is the lowest, but the task completion time is the longest.
C. HTTP Request Benchmark
Results from the HTTP benchmark are plotted in figure 5and 6. Some findings based on them are highlighted as follows.
Finding (f): The virtualization overhead for network-intensive traffic is much larger than that for computing-intensive traffic. For the Xen-based server, the energy overheadfor computing-intensive traffic is less than 5%, while theoverhead for network-intensive traffic could rise up to 70%.The same situation happens to the KVM-based server.
The cause of this finding is at least two-fold. First, fornetworking traffic, the CPU usage of virtualized server is much
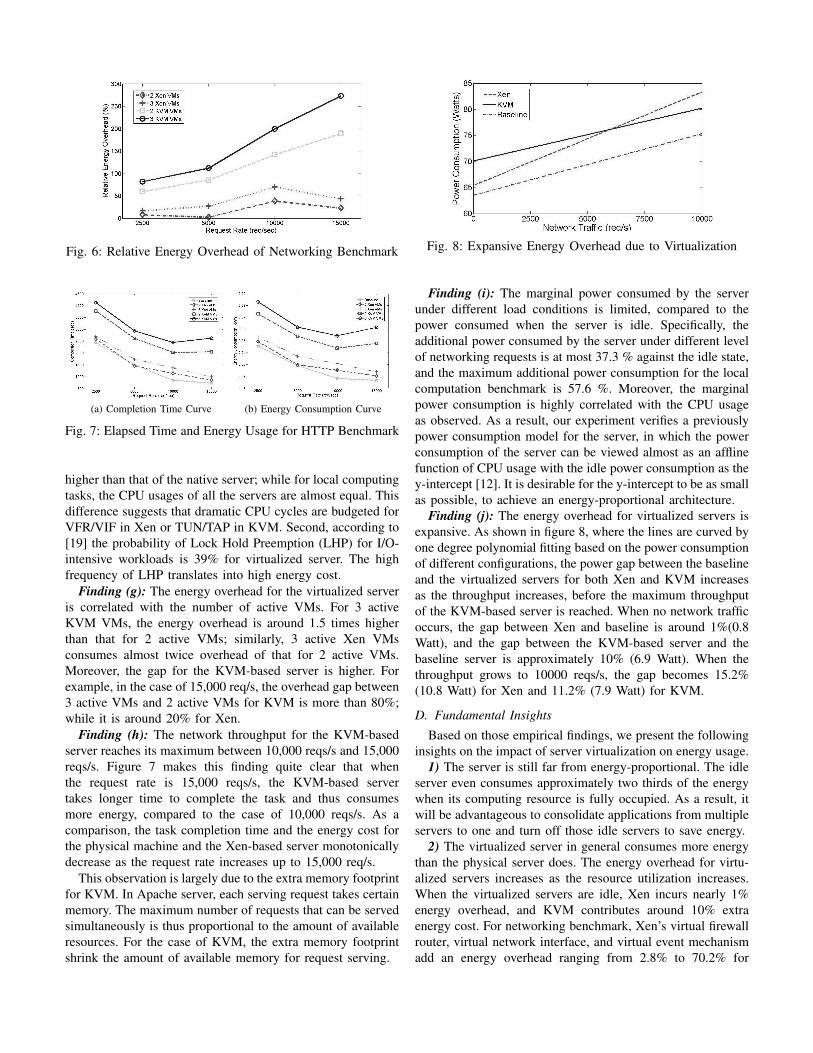
Fig. 6: Relative Energy Overhead of Networking Benchmark
(a) Completion Time Curve (b) Energy Consumption Curve
Fig. 7: Elapsed Time and Energy Usage for HTTP Benchmark
higher than that of the native server; while for local computingtasks, the CPU usages of all the servers are almost equal. Thisdifference suggests that dramatic CPU cycles are budgeted forVFR/VIF in Xen or TUN/TAP in KVM. Second, according to[19] the probability of Lock Hold Preemption (LHP) for I/O-intensive workloads is 39% for virtualized server. The highfrequency of LHP translates into high energy cost.
Finding (g): The energy overhead for the virtualized serveris correlated with the number of active VMs. For 3 activeKVM VMs, the energy overhead is around 1.5 times higherthan that for 2 active VMs; similarly, 3 active Xen VMsconsumes almost twice overhead of that for 2 active VMs.Moreover, the gap for the KVM-based server is higher. Forexample, in the case of 15,000 req/s, the overhead gap between3 active VMs and 2 active VMs for KVM is more than 80%;while it is around 20% for Xen.
Finding (h): The network throughput for the KVM-basedserver reaches its maximum between 10,000 reqs/s and 15,000reqs/s. Figure 7 makes this finding quite clear that whenthe request rate is 15,000 reqs/s, the KVM-based servertakes longer time to complete the task and thus consumesmore energy, compared to the case of 10,000 reqs/s. As acomparison, the task completion time and the energy cost forthe physical machine and the Xen-based server monotonicallydecrease as the request rate increases up to 15,000 req/s.
This observation is largely due to the extra memory footprintfor KVM. In Apache server, each serving request takes certainmemory. The maximum number of requests that can be servedsimultaneously is thus proportional to the amount of availableresources. For the case of KVM, the extra memory footprintshrink the amount of available memory for request serving.
Fig. 8: Expansive Energy Overhead due to Virtualization
Finding (i): The marginal power consumed by the serverunder different load conditions is limited, compared to thepower consumed when the server is idle. Specifically, theadditional power consumed by the server under different levelof networking requests is at most 37.3 % against the idle state,and the maximum additional power consumption for the localcomputation benchmark is 57.6 %. Moreover, the marginalpower consumption is highly correlated with the CPU usageas observed. As a result, our experiment verifies a previouslypower consumption model for the server, in which the powerconsumption of the server can be viewed almost as an afflinefunction of CPU usage with the idle power consumption as they-intercept [12]. It is desirable for the y-intercept to be as smallas possible, to achieve an energy-proportional architecture.
Finding (j): The energy overhead for virtualized servers isexpansive. As shown in figure 8, where the lines are curved byone degree polynomial fitting based on the power consumptionof different configurations, the power gap between the baselineand the virtualized servers for both Xen and KVM increasesas the throughput increases, before the maximum throughputof the KVM-based server is reached. When no network trafficoccurs, the gap between Xen and baseline is around 1%(0.8Watt), and the gap between the KVM-based server and thebaseline server is approximately 10% (6.9 Watt). When thethroughput grows to 10000 reqs/s, the gap becomes 15.2%(10.8 Watt) for Xen and 11.2% (7.9 Watt) for KVM.
D. Fundamental Insights
Based on those empirical findings, we present the followinginsights on the impact of server virtualization on energy usage.
1) The server is still far from energy-proportional. The idleserver even consumes approximately two thirds of the energywhen its computing resource is fully occupied. As a result, itwill be advantageous to consolidate applications from multipleservers to one and turn off those idle servers to save energy.
2) The virtualized server in general consumes more energythan the physical server does. The energy overhead for virtu-alized servers increases as the resource utilization increases.When the virtualized servers are idle, Xen incurs nearly 1%energy overhead, and KVM contributes around 10% extraenergy cost. For networking benchmark, Xen’s virtual firewallrouter, virtual network interface, and virtual event mechanismadd an energy overhead ranging from 2.8% to 70.2% for

Fig. 9: Fundamental Trade-Off In Server Virtualization
different workloads and VM configurations; and KVM’s Linuxkernel based virtual network bridge and x86 VTx invokingresults in an energy overhead between 59.6% and 273.1% forvarious combinations of configuration and workload.
3) The 2 types of hypervisors exhibit different charac-teristics in energy usage for various tasks. KVM consumesmore energy (on average 12%) than Xen under the same testcase. Specifically, KVM embeds the native Linux kernel withvirtualization capability, but requires more software operationsand accordingly consumes more energy. Moreover, KVM’snetworking model consumes more energy (on average nearlytwice) than that of Xen. On the other hand, the benefit of usingKVM is there is almost no modification required to the hostOS; while such modifications are necessary for Xen.
4) Energy saving can be achieved by launching an optimumnumber of virtual machines. In our measurement, the virtual-ized server with 2 active VMs consumes less energy than theone with 3 active VMs. Specifically, about 20% energy forKVM and 15% energy for Xen on average could be conservedfor all cases under networking benchmark, by migrating tasksfrom one VM to another and turning off the idle VM.
5) When a multi-core server is running multi-process ap-plications, the physical machine could consume more energythan virtualized servers. It is due to a lack of the multi-coreoptimization in the physical machine. While both Xen andKVM are able to distribute physical CPU cores into virtualCPU cores, avoiding starvation. This demonstrates an essentialadvantage of virtualization in improving resource utilization.
VI. FUNDAMENTAL TRADE-OFF
Figure 9 presents a fundamental trade-off, which dictateshow server consolidation should be designed to reduce en-ergy usage for green data centers. Specifically, there are twocompeting forces that server consolidation should balance.
On one hand, the energy usage in data centers can bereduced by consolidating applications from multiple serversto one server and shutting down the rest. This is based on ourobservation of the power consumption model for native server.
On the other hand, for the virtualized servers, there aretwo detrimental effects would hamper the energy efficiency.First, the hypervisor introduces a potential energy overheadover the physical machine, by occupying system resources
for its execution. This overhead is expansive as a functionof the ‘goodput’, which denotes the portion of computationcapabilities used for support applications. Second, the maxi-mum supportable goodput for virtualized server is reduced,compared to its native server. The combination of thesetwo detrimental effects would offset the energy benefit ofserver consolidation. Moreover, the impact of these detrimentaleffects also depends on the type of hypervisor chosen.
This fundamental trade-off dictates how server consolidationshould be designed for green data centers. Specifically, thedecision of server consolidation should balance those twocompeting forces, to reduce the energy usage by data centers.
VII. CONCLUSION
This paper reported an empirical study on the impact ofserver virtualization on energy efficiency. Through intensivemeasurements, we obtained statistics for energy usage fromnative server and virtualized servers with Xen and KVM, aswell as a few findings based on our motivations. Finally, wereveal the fundamental trade-off in virtualized servers, whichwould dictate how server consolidation should be designed anddeployed to tame the explosive energy usage in data centers.
REFERENCES
[1] R. Brown, et al., Report to congress on server and data center energyefficiency: Public law 109-431. Lawrence Berkeley National Lab, 2008.
[2] Silicon Valley Leadership Group, Accenture, Data Centre Energy Fore-cast Report-Final Report. July, 2008.
[3] P. Mell and T. Grance. NIST definition of cloud computing. NIST SpecialPublication 800-145 (Draft), 2011.
[4] T. Deshane, et al., Quantitative comparison of Xen and KVM. XenSummit, Boston, MA, USA, pp. 1-2, Jun, 2008.
[5] J. Che, et al., A synthetical performance evaluation of OpenVZ, Xen andKVM. IEEE Services Computing Conf., China, Dec, 2010.
[6] A. Beloglazov, et al., Energy-aware resource allocation heuristics forefficient management of data centers for cloud computing. FutureGeneration Computer Systems, Elsevier, May, 2011.
[7] A. Berl, et al., Energy-efficient cloud computing. The computer Journal,vol 53, pp. 1045-1051, Aug, 2009.
[8] Y. Agarwal, et al., Somniloquy: augmenting network interfaces to reducePC energy usage. In Proc. of the 6th symposium on networked systemsdesign and implementation, Apr, 2009.
[9] IBM Corp., IBM System Virtualization. http://publib.boulder.ibm.com-/infocenter/eserver/v1r2/topic/eicay/eicay.pdf, Dec, 2005.
[10] P. Barham, et al., Xen and the Art of Virtualization. In Proc. of the 19thACM symposium on operating systems principles, Dec, 2003.
[11] A. Kivity, et al., kvm: the Linux Virtual Machine Monitor. In Proc. ofthe Linux Symposium, Ottawa, 2007.
[12] X. Fan, et al., Power Provisioning for a Warehouse-sized Computer. InProc. of the ACM Int’l Symposium on Computer Architecture, 2007.
[13] L. Cherkasova et al., Comparison of the three CPU schedulers in Xen.Sigmetrics Performance Evaluation Review 35(2): pp. 42-51, 2007.
[14] Xen Credit-Based CPU Scheduler, http://wiki.xensource.com/xenwiki/C-reditScheduler
[15] W. Jiang, et al., CFS Optimizations to KVM Threads on Multi-CoreEnvironment. 15th Int’l Conf. on Parallel and Distributed Systems, 2009.
[16] A. Menon, et al., Diagnosing Performance Overheads in the Xen VirtualMachine Environment. 1st ACM/USENIX Conf. on Virtual ExecutionEnvironments (VEE’05), Jun, 2005.
[17] P. Bohrer, et al., The case for power management in web servers. PowerAware Computing, 2002.
[18] W. Jiang, et al., CFS Optimizations to KVM Threads on Multi-CoreEnvironment. 15th Int’l conf. on Parallel and Distributed Systems, 2009.
[19] V. Uhlig, et al., Towards Scalable Multiprocessor Virtual Machines. InProc. of Virtual Machine Research And Technology Symposium, 2004.


![Towards Making Network Function Virtualization a Cloud ... · Network Function Virtualization (NFV) [1] is bringing closer the possibility to truly migrate enterprise data centers](https://static.fdocuments.net/doc/165x107/5f1747c1b9693e35481490c6/towards-making-network-function-virtualization-a-cloud-network-function-virtualization.jpg)


