4 User State Virtualization Application Virtualization OS Virtualization.
Master of Science in Telecommunication Systems February 2018
Virtualization of Data Centers
study on Server Energy Consumption Performance
Praneel Reddy Padala
Department of computingBlekinge Institute of TechnologySE–371 79 Karlskrona, Sweden

This thesis is submitted to the Faculty of Computing at Blekinge Institute of Technology inpartial fulfillment of the requirements for the degree of Master of Science in TelecommunicationSystems. The thesis is equivalent to 20 weeks of full time studies.
Contact Information:Author(s):Praneel Reddy PadalaE-mail: [email protected]
University advisor:Prof. Adrian PopescuDepartment of TeleCommunications
Faculty of computing Internet : www.bth.seBlekinge Institute of Technology Phone : +46 455 38 50 00SE–371 79 Karlskrona, Sweden Fax : +46 455 38 50 57

Abstract
Due to various reasons data centers have become ubiquitous in our so-ciety. Energy [19] costs are significant portion of data centers total lifetimecosts which also makes financial sense to operators. This increases hugeconcern towards the energy costs and environmental impacts of data cen-ter. Power costs and energy efficiency are the major challenges front of us.From overall cyber [14] energy used, 15% is used by networking portion ofa data center. Its estimated that the energy used by network infrastructurein a data center world wide is 15.6 billion kWh and is expected to increaseto around 50%.
Power costs and Energy Consumption plays a major role throughoutthe life time of a data center, which also leads to the increase in financialcosts for data center operators and increased usage of power resources. So,resource utilization has become a major issue in the data centers.
The main aim of this thesis study is to find the efficient way for utilizationof resources and decrease the energy costs to the operators in the datacenters using virtualization. Virtualization technology is used to deployvirtual servers on physical servers which uses the same resources and helpsto decrease the energy consumption of a data center.
Keywords: Energy consumption, Data Centers, Virtualization, Servers.
i
Acknowledgements
Firstly, I would like to thank supremacy, God for blessing me with knowl-edge, strength and vision in my life. I would also thank my parents andother family members for unconditional love and support in my life.
I express my deepest gratitude to my supervisor Dr. Adrian Popescufor help, encouragement and support offered throughout the thesis with hisvaluable suggestions. I feel grateful working under his guidance. From thediscussions and conversations with my professor I have increased my think-ing capabilities and problem solving in different ways.
I would like to thank my examiner Prof. Kurt Tutschku for his valuablefeedback and suggestions, which helped me a lot in improving this thesiswork.
I also thank my friends for their help throughout my studies. I wouldalso like to thank all my professors from JNTUK and BTH institutions forguiding and shaping my career.
ii

Contents
Abstract i
Acknowledgements ii
1 Introduction 11.1 Data Center . . . . . . . . . . . . . . . . . . . . . . . . . . . . . . 11.2 Need for Data Center . . . . . . . . . . . . . . . . . . . . . . . . . 11.3 Major Components of a Data Center . . . . . . . . . . . . . . . . 1
1.3.1 Electrical Infrastructure . . . . . . . . . . . . . . . . . . . 11.3.2 IT Infrastructure . . . . . . . . . . . . . . . . . . . . . . . 21.3.3 Building Shells . . . . . . . . . . . . . . . . . . . . . . . . 3
1.4 Energy Consumption . . . . . . . . . . . . . . . . . . . . . . . . . 31.5 Virtualization . . . . . . . . . . . . . . . . . . . . . . . . . . . . . 31.6 Server Consolidation Technique . . . . . . . . . . . . . . . . . . . 41.7 Types of Virtualization . . . . . . . . . . . . . . . . . . . . . . . . 4
1.7.1 Server Virtualization . . . . . . . . . . . . . . . . . . . . . 41.7.2 Operating System Virtualization . . . . . . . . . . . . . . 51.7.3 Network Function Virtualization . . . . . . . . . . . . . . . 61.7.4 Desktop Virtualization . . . . . . . . . . . . . . . . . . . . 6
1.8 Virtualization Vs Cloud Computing . . . . . . . . . . . . . . . . . 71.9 Hypervisors . . . . . . . . . . . . . . . . . . . . . . . . . . . . . . 81.10 Types of Hypervisors . . . . . . . . . . . . . . . . . . . . . . . . . 8
1.10.1 Type1 Hypervisor . . . . . . . . . . . . . . . . . . . . . . . 81.10.2 Type2 Hypervisor . . . . . . . . . . . . . . . . . . . . . . . 9
1.11 Problem Statement . . . . . . . . . . . . . . . . . . . . . . . . . . 91.12 Motivation . . . . . . . . . . . . . . . . . . . . . . . . . . . . . . . 91.13 Outline . . . . . . . . . . . . . . . . . . . . . . . . . . . . . . . . . 101.14 Research Questions . . . . . . . . . . . . . . . . . . . . . . . . . . 10
2 Conceptual Background 112.1 Data Center Efficiency Metrics . . . . . . . . . . . . . . . . . . . . 11
2.1.1 Power Usage Efficiency (PUE) . . . . . . . . . . . . . . . . 122.1.2 Data Center Infrastructure Efficiency (DCiE) . . . . . . . 122.1.3 Carbon Footprint (C) . . . . . . . . . . . . . . . . . . . . . 13
iii

2.2 Functioning of a Data Center . . . . . . . . . . . . . . . . . . . . 132.2.1 Power Supply Unit . . . . . . . . . . . . . . . . . . . . . . 132.2.2 Cooling Unit . . . . . . . . . . . . . . . . . . . . . . . . . 142.2.3 Controlled Access . . . . . . . . . . . . . . . . . . . . . . . 152.2.4 Control Center . . . . . . . . . . . . . . . . . . . . . . . . 152.2.5 Safety Measurements . . . . . . . . . . . . . . . . . . . . . 16
2.3 Simulation Tools . . . . . . . . . . . . . . . . . . . . . . . . . . . 162.3.1 Cloud Sim . . . . . . . . . . . . . . . . . . . . . . . . . . . 162.3.2 Green Cloud . . . . . . . . . . . . . . . . . . . . . . . . . . 16
3 Related Work 18
4 Method 204.1 CloudSim . . . . . . . . . . . . . . . . . . . . . . . . . . . . . . . 204.2 Implementation . . . . . . . . . . . . . . . . . . . . . . . . . . . . 21
5 Results 24
6 Analysis and Discussion 296.1 What is the impact on energy consumption of virtual data centers
when compared with physical data centers? . . . . . . . . . . . . . 296.2 Will KVM perform better than Xen hypervisor in server virtual-
ization in terms of energy consumption while varying number ofvirtual machines? . . . . . . . . . . . . . . . . . . . . . . . . . . . 30
7 Conclusions and Future Work 31
References 32
iv

List of Figures
1.1 Electrical Infrastructure . . . . . . . . . . . . . . . . . . . . . . . 11.2 Virtualization . . . . . . . . . . . . . . . . . . . . . . . . . . . . . 31.3 Server Consolidation . . . . . . . . . . . . . . . . . . . . . . . . . 41.4 Server Virtualization . . . . . . . . . . . . . . . . . . . . . . . . . 51.5 Operating System Virtualization . . . . . . . . . . . . . . . . . . . 51.6 Network Function Virtualization . . . . . . . . . . . . . . . . . . . 61.7 Desktop Virtualization . . . . . . . . . . . . . . . . . . . . . . . . 71.8 Type1 and Type2 Hypervisors . . . . . . . . . . . . . . . . . . . . 8
2.1 Demands and Constraints . . . . . . . . . . . . . . . . . . . . . . 112.2 For calculating Energy Metrics . . . . . . . . . . . . . . . . . . . . 122.3 Power Supply Unit . . . . . . . . . . . . . . . . . . . . . . . . . . 132.4 Cooling Unit . . . . . . . . . . . . . . . . . . . . . . . . . . . . . 142.5 Controlled Access . . . . . . . . . . . . . . . . . . . . . . . . . . . 152.6 Cloud Sim Architecture . . . . . . . . . . . . . . . . . . . . . . . . 162.7 Green Cloud Architecture . . . . . . . . . . . . . . . . . . . . . . 17
4.1 layered architecture of cloudsim . . . . . . . . . . . . . . . . . . . 214.2 Simulating with one vm . . . . . . . . . . . . . . . . . . . . . . . 224.3 Simulating with three vms . . . . . . . . . . . . . . . . . . . . . . 224.4 Simulating with five vms . . . . . . . . . . . . . . . . . . . . . . . 234.5 Simulating with ten vms . . . . . . . . . . . . . . . . . . . . . . . 234.6 Simulating with fifteen vms . . . . . . . . . . . . . . . . . . . . . 23
5.1 KVM with varying number of virtual machines . . . . . . . . . . . 245.2 Xen with varying number of virtual machines . . . . . . . . . . . 255.3 Comparing KVM and Xen when 3 virtual machines are deployed . 265.4 Comparing KVM and Xen when 5 virtual machines are deployed . 275.5 Comparing KVM and Xen when 10 virtual machines are deployed 275.6 Comparing KVM and Xen when 15 virtual machines are deployed 28
v
Chapter 1Introduction
1.1 Data Center[6] A Data Center is a facility used to house computer systems and associatedcomponents, such as telecommunications and storage systems and uses redundantbackup power supplies and redundant data communication connections.
1.2 Need for Data CenterEvery organization,whether big or small, has a large amount of data that areneeded to be stored somewhere. A Data Center is essential to store, manage,process, and distribute large amounts of data of an organization. In today’s mod-ern era, every organization needs to have a Data Center for its smooth running.In the fast growing world where everything is going online, You need to makeyour presence over the internet for more connectivity and convenience. So, weare growing with huge requirement for data centers.
1.3 Major Components of a Data Center
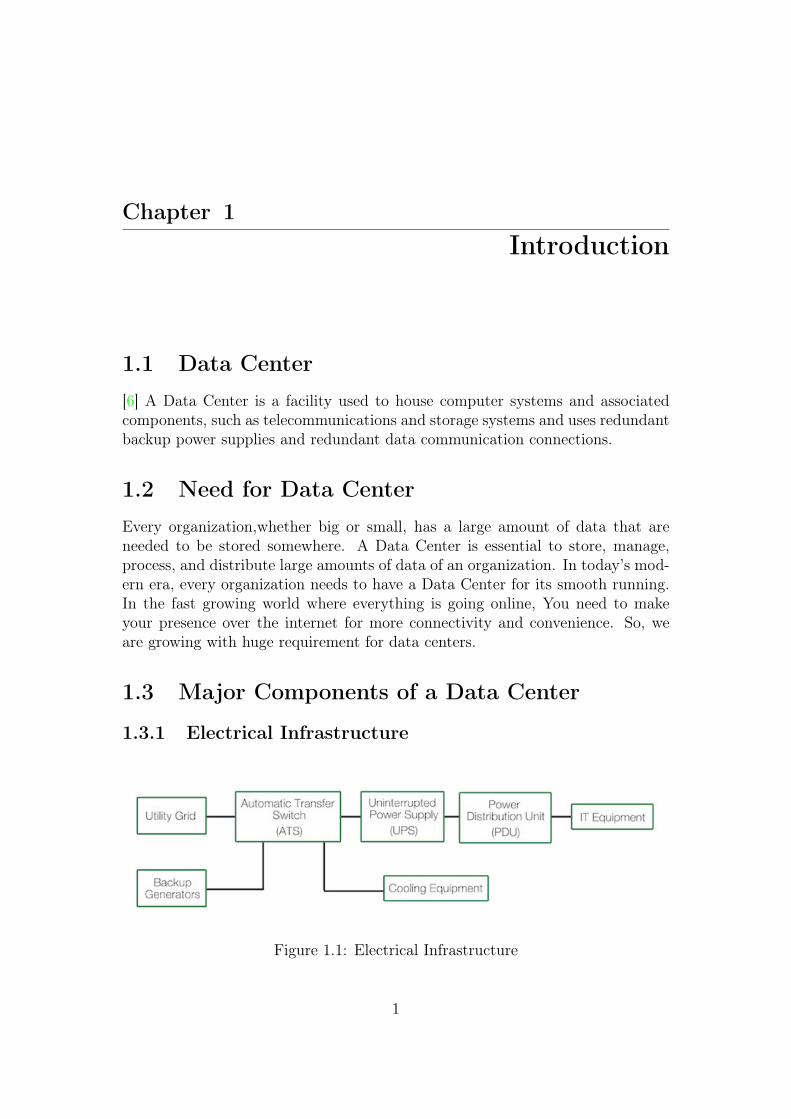
1.3.1 Electrical Infrastructure
Figure 1.1: Electrical Infrastructure
1

Chapter 1. Introduction 2
Utility Grid
[18] utility grid is usually a commercial electric power distribution system thattakes electricity from a generator and transmits it over a certain distance andthen takes the electricity down to the consumer through a distribution system.The entire system is referred as Grid.
Automatic Transfer Switch (ATS)
ATS is an electrical switch that switches load between two sources. This ATSis installed where a backup generator is located. When there was a failure withelectrical power, it switches the load and electrical input is taken from the gen-erator.
Uninterrupted Power Supply (UPS)
[17] Power is very essential for a data center and our IT infrastructure is designedto be supplied with uniform flow. But, we can’t expect a steady flow from theutility. They are used as backup during brief power outages. Although backupgenerators helps during extended power outages, they can’t help you with powerfluctuations. UPS helps us during power fluctuations and brief power outagesproviding clean and high quality power.
Power Distribution Unit (PDU)
Demand for more computing power in less space means rack cabinets are moredensely packed than ever. A network PDU unit distributes power supplied to therack via multiple outlets to the rack cabinet’s servers and networking equipment.
Backup Generators
Backup Generators are used to supply power for many hours or many days duringextended power outages.
Cooling Equipment
Cooling equipment is used to reduce the heat generated by the servers and net-working unit.
1.3.2 IT Infrastructure
IT equipment is the stuff that fills up the data center and is the reason thefacility exists in the first place. The IT equipment is where all the magic happensthat makes the internet, mobile communication, and apps what they are today.
Chapter 1. Introduction 3
At a high level, IT equipment can be categorized into three buckets: servers,communication gear, and storage equipment.
1.3.3 Building Shells
The architectural and structural components of a data center are pretty basic,consisting of four walls and a roof. A data centers is very similar to a warehousewhere the middle of the building is empty (but will be filled up with IT equipmentinstead of boxes). Data centers are built using the same techniques and materialsas typical office buildings, however the two structures differ in robustness. Theirstructural components will be bigger and stronger in order to sustain natural dis-asters or explosives. The most critical data centers, such as those used by defensedepartments for national security, might even be located within a mountain ordeep underground for protection.
1.4 Energy ConsumptionEnergy consumption is the amount of energy or power used. Energy Consumptionof a data center is defined as energy consumed by the IT infrastructure like servers,switches, computer components and cooling infrastructure like air conditioners,cooling turbines and electrical infrastructure.
1.5 Virtualization[7] Virtualization is a technology that helps us to use the available hardwareresources efficiently. This technology allows us to use the full capacity of physicalmachines by distributing its capabilities among many users or environments.
Figure 1.2: Virtualization

Chapter 1. Introduction 4
The physical machine holding the hypervisors is called host, while the virtualmachines sharing the resources of the cost are called guests. Guests generally treatcomputing resources like CPU, memory and storage as hanger of resources. Op-erators treat these guests by controlling virtual instances of computing resourcesand providing them the required resources when they need them.
1.6 Server Consolidation TechniqueServer consolidation stands for the efficient way to use the computer resourcesin order to reduce the total number of servers or server locations which an or-ganization require. Here we can observe that each server performs its own tasksrelating to that particular operating system. To the maximum extent each servercan use 30% of its total computer resources allocated to it. The remaining 70%of the resources are left without use. Virtualization is a technique which helpsus to consolidate more number of servers on the same underlying physical hard-ware. This helps in resource utilization and decrease the number of servers in anorganization and there by reduces the operation and maintenance costs.
Figure 1.3: Server Consolidation
1.7 Types of Virtualization
1.7.1 Server Virtualization
[2] Servers are computers designed to process a high volume of specific tasksreally well so other computers—like laptops and desktops—can do a variety ofother tasks. Virtualizing a server lets it to do more of those specific functionsand involves partitioning it so that the components can be used to serve multiplefunctions.

Chapter 1. Introduction 5
Figure 1.4: Server Virtualization
1.7.2 Operating System Virtualization
Operating system virtualization happens at the kernel and the central task man-agers of operating systems. It’s a useful way to run Linux, Windows or any otheroperating system environments side-by-side. Enterprises can also push virtualoperating systems to computers, which
• Reduces bulk hardware costs, since the computers don’t require such highout-of-the-box capabilities.
• Increases security, since all virtual instances can be monitored and isolated.
• Limits time spent on IT services like software updates.
Figure 1.5: Operating System Virtualization
Chapter 1. Introduction 6
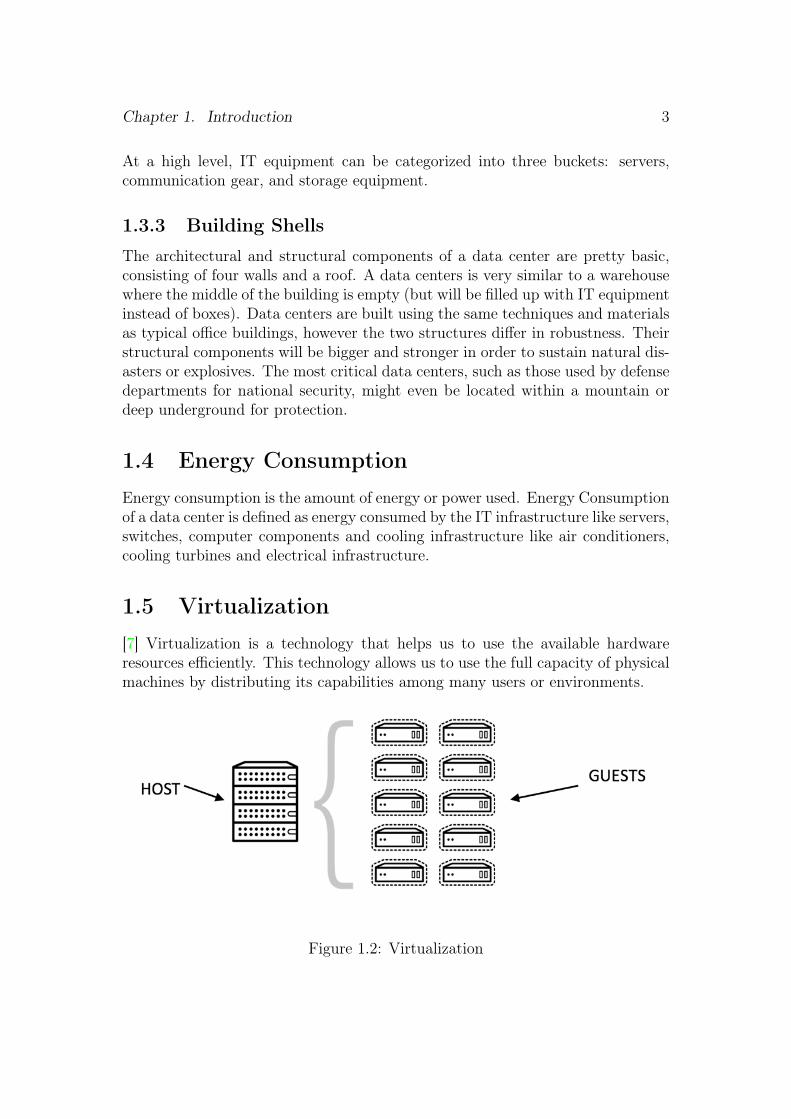
1.7.3 Network Function Virtualization
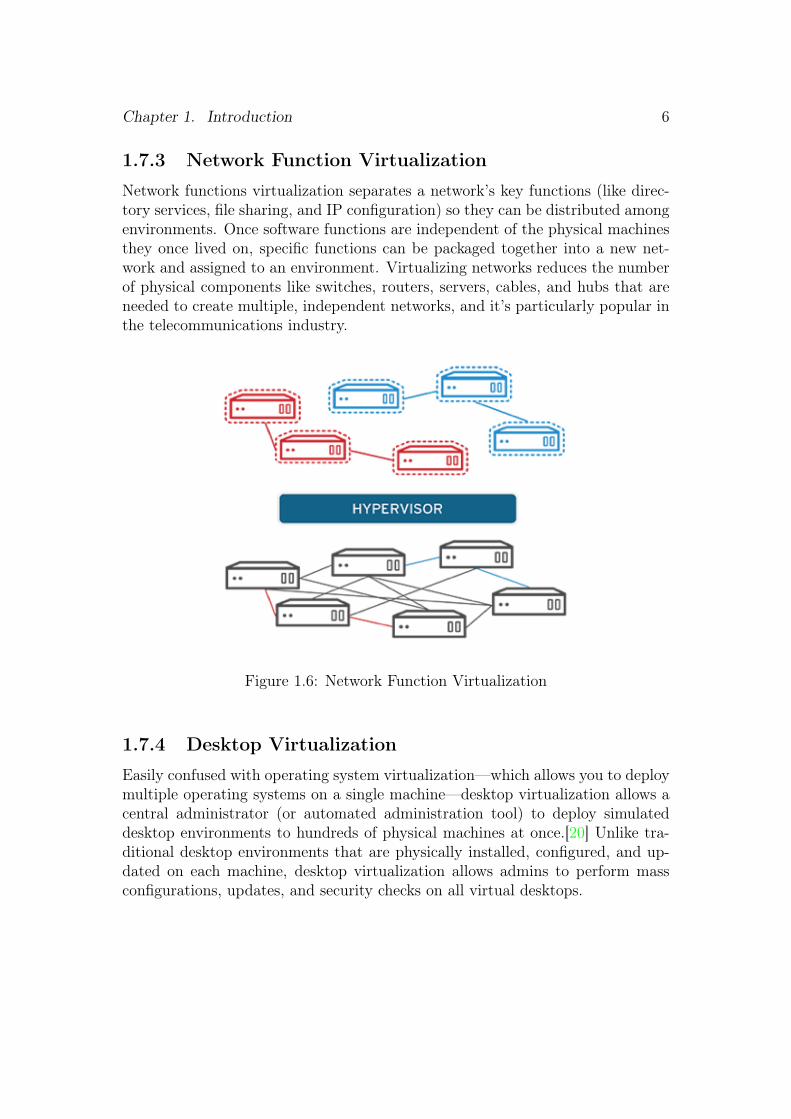
Network functions virtualization separates a network’s key functions (like direc-tory services, file sharing, and IP configuration) so they can be distributed amongenvironments. Once software functions are independent of the physical machinesthey once lived on, specific functions can be packaged together into a new net-work and assigned to an environment. Virtualizing networks reduces the numberof physical components like switches, routers, servers, cables, and hubs that areneeded to create multiple, independent networks, and it’s particularly popular inthe telecommunications industry.
Figure 1.6: Network Function Virtualization
1.7.4 Desktop Virtualization
Easily confused with operating system virtualization—which allows you to deploymultiple operating systems on a single machine—desktop virtualization allows acentral administrator (or automated administration tool) to deploy simulateddesktop environments to hundreds of physical machines at once.[20] Unlike tra-ditional desktop environments that are physically installed, configured, and up-dated on each machine, desktop virtualization allows admins to perform massconfigurations, updates, and security checks on all virtual desktops.

Chapter 1. Introduction 7
Figure 1.7: Desktop Virtualization
1.8 Virtualization Vs Cloud ComputingSince both virtualization and cloud computing revolve around separating re-sources from hardware, it creates us a confused state. Virtualization is a technol-ogy that separates functions from hardware.
• Cloud computing is more of a solution that relies on that split
• Virtualization helps create clouds, but that doesn’t make it cloud com-puting.
The National Institute of Standards and Technology cites 5 features of Cloudcomputing:
• A network
• Pooled resources
• A user interface
• Provisioning capabilities and
• Automatic resource control (or allocation).
While virtualization creates the network and pooled resources. Further tocreate a user interface, provision VMs, and control/allocate resources, additionalmanagement and operating system software are needed.
Chapter 1. Introduction 8
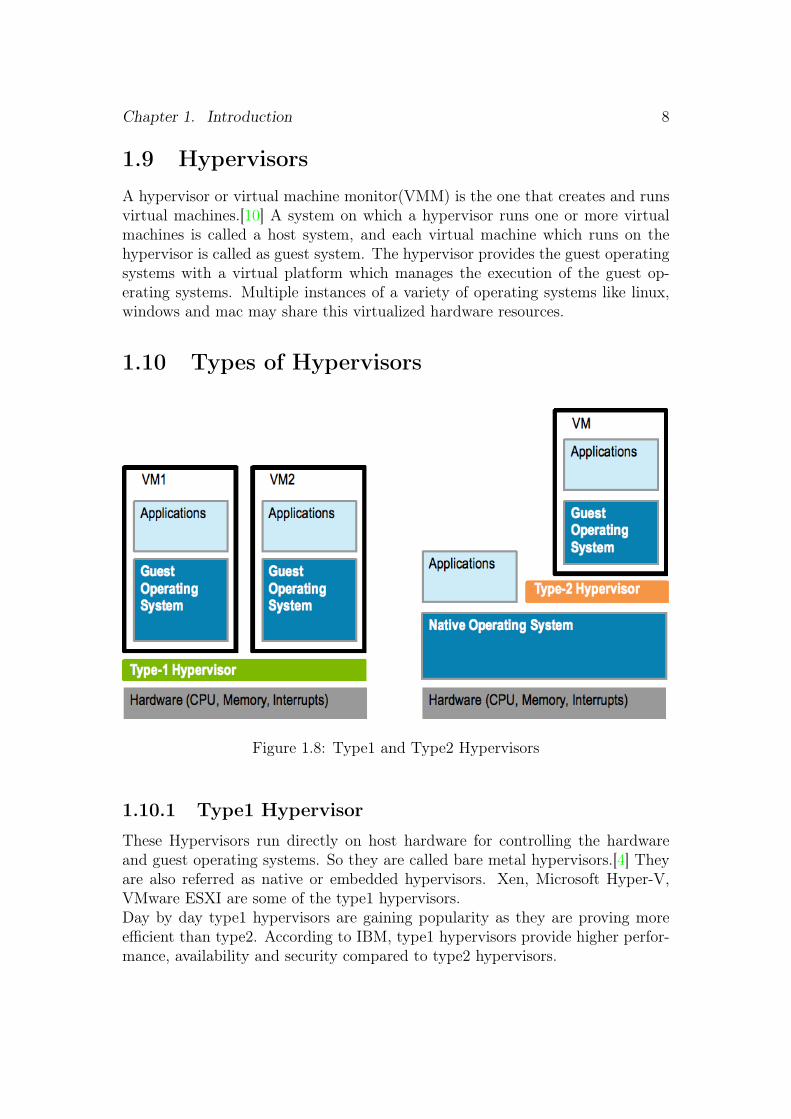
1.9 HypervisorsA hypervisor or virtual machine monitor(VMM) is the one that creates and runsvirtual machines.[10] A system on which a hypervisor runs one or more virtualmachines is called a host system, and each virtual machine which runs on thehypervisor is called as guest system. The hypervisor provides the guest operatingsystems with a virtual platform which manages the execution of the guest op-erating systems. Multiple instances of a variety of operating systems like linux,windows and mac may share this virtualized hardware resources.
1.10 Types of Hypervisors
Figure 1.8: Type1 and Type2 Hypervisors
1.10.1 Type1 Hypervisor
These Hypervisors run directly on host hardware for controlling the hardwareand guest operating systems. So they are called bare metal hypervisors.[4] Theyare also referred as native or embedded hypervisors. Xen, Microsoft Hyper-V,VMware ESXI are some of the type1 hypervisors.Day by day type1 hypervisors are gaining popularity as they are proving moreefficient than type2. According to IBM, type1 hypervisors provide higher perfor-mance, availability and security compared to type2 hypervisors.
Chapter 1. Introduction 9
1.10.2 Type2 Hypervisor
These hypervisors run on the host operating system. Guest operating systemsruns on the host as a process. VMware workstation, Virtual Box, VMware Playerare some of the type2 hypervisors. IBM recommends that type2 hypervisors canmainly be used on client systems where efficiency is less critical.
1.11 Problem StatementAs discussed above, need for data centers is increasing exponentially. With
increase in data centers there will be proportional increase in energy consumptionof the data centers. In 2014, [9] [23] energy consumption of data centers in the U.Sis estimated 70 billion kWh, which represents about 1.8% of total U.S. electricityconsumption. By 2020, its expected that energy use is increased by 4% whichis approximately 73 billion KWh. So, energy consumption has become a seriousconcern in data centres. This also leads to huge environmental impacts and hugeoperational costs to the data center operators.
1.12 MotivationUsing server consolidation technique, we can reduce the energy consumption
of servers as servers constitute more than 40% of the total data center energy.We can deploy either type1 or type 2 hypervisors on the servers and add virtualmachines which are equivalent to the servers. These virtual machines help in bestuse of physical resources.
In this paper we consider two type 1 hypervisors, Xen and KVM on a physicalserver and gradually increased the number of virtual machines on the server andcalculated the power consumption of the server and compared the performanceagainst the physical server.

Chapter 1. Introduction 10
1.13 OutlineThis thesis paper is structured as follows.
Chapter 1: This chapter contains the introduction for data centers and itscomponents. We also discuss the problem statement, motivation to solve theproblem along with research questions.Chapter 2: In this chapter, we discuss about the conceptual aspects related toour thesis and the study work done regarding this thesis work.Chapter 3: Study of various related work helpful for our thesis are joined in thischapter.Chapter 4: The method and implementation of the thesis are discussed.Chapter 5: The calculated results and graphs are added in this chapter and thegraphs are analyzed.Chapter 6: The analysis of results and the answers relating the research ques-tions are discussed in this chapter.Chapter 7: The conclusions and future work are discussed here.
1.14 Research Questions1. What is the impact on energy consumption of virtual data centers when
compared with physical data centers?
2. Will KVM perform better than Xen hypervisor in server virtualization interms of energy consumption while varying number of virtual machines?

Chapter 2Conceptual Background
2.1 Data Center Efficiency MetricsAs this report is a study on the energy consumption performance of the datacenters, here we will discuss about some of the efficiency measurements of a datacenter. fig: 2.1 shows us the demands and constraints upon a data center operator.
Figure 2.1: Demands and Constraints
11
Chapter 2. Conceptual Background 12
2.1.1 Power Usage Efficiency (PUE)
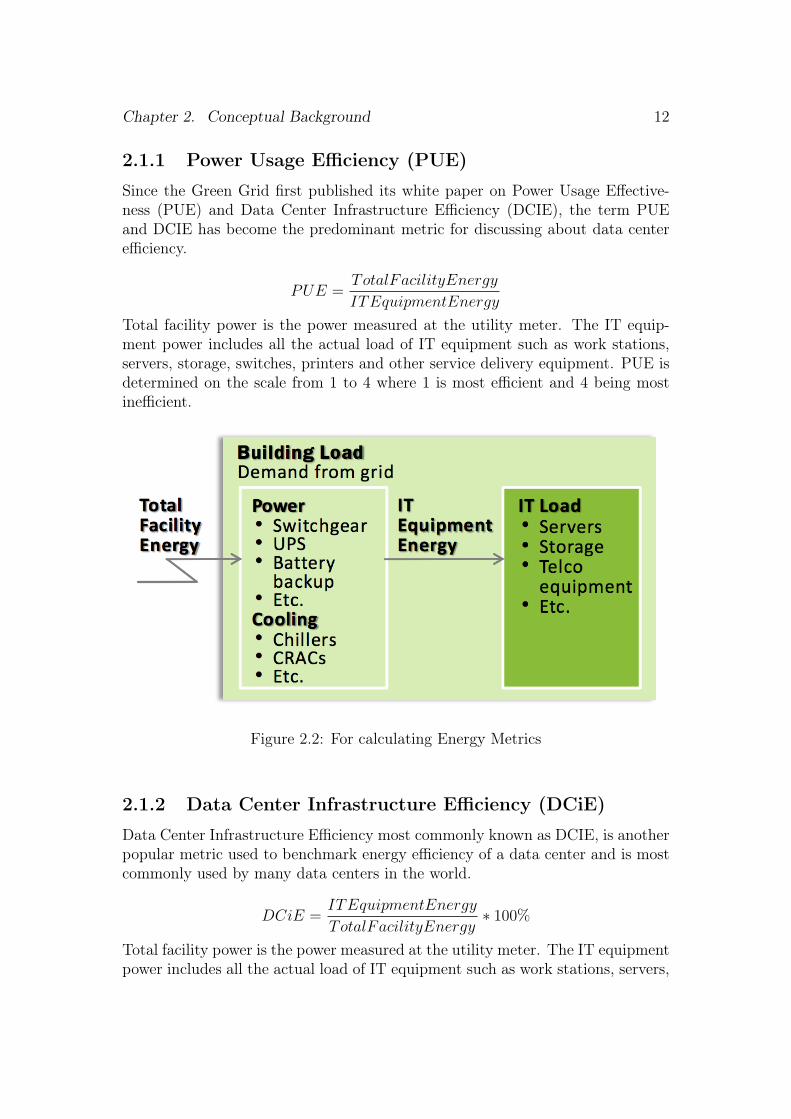
Since the Green Grid first published its white paper on Power Usage Effective-ness (PUE) and Data Center Infrastructure Efficiency (DCIE), the term PUEand DCIE has become the predominant metric for discussing about data centerefficiency.
PUE =TotalFacilityEnergy
ITEquipmentEnergy
Total facility power is the power measured at the utility meter. The IT equip-ment power includes all the actual load of IT equipment such as work stations,servers, storage, switches, printers and other service delivery equipment. PUE isdetermined on the scale from 1 to 4 where 1 is most efficient and 4 being mostinefficient.
Figure 2.2: For calculating Energy Metrics
2.1.2 Data Center Infrastructure Efficiency (DCiE)
Data Center Infrastructure Efficiency most commonly known as DCIE, is anotherpopular metric used to benchmark energy efficiency of a data center and is mostcommonly used by many data centers in the world.
DCiE =ITEquipmentEnergy
TotalFacilityEnergy∗ 100%
Total facility power is the power measured at the utility meter. The IT equipmentpower includes all the actual load of IT equipment such as work stations, servers,

Chapter 2. Conceptual Background 13
storage, switches, printers and other service delivery equipment.
2.1.3 Carbon Footprint (C)
The total amount of co2 emitted from a data center is known as the carbon foot-print of that data center.
C =E(N)
T
In this equation C stands for carbon footprint, E is the electrical usage in kWhper year, N is the annual co 2 emissions and T stands for metric tons. From thisequation, the amount of co2 emitted annually can be calculated and necessarymeasures to control these emissions can be implemented.
2.2 Functioning of a Data Center
2.2.1 Power Supply Unit
[3] The data center is connected to two separate grid sectors operated by the localutility company. If one sector were to fail, then the second one will ensure thatpower is still supplied.
Figure 2.3: Power Supply Unit

Chapter 2. Conceptual Background 14
In addition to this, Data Centers are equipped with diesel generators to sup-port electricity demand in an emergency. These generators take an outage in justone of the external grid to automatically actuate the generators. Both local util-ity company and the diesel generators deliver electricity with a voltage of 20kV,which is then step downed to 220 or 380Volts in the data center.Within the data center, block batteries ensure that all operating applications canrun for15 minutes. This backup system makes it possible to provide power fromthe time a utility company experiences a total blackout to the time that the dieselgenerators start up.The uninterruptible power supply (UPS) also ensures that the quality remainsconstant. It compensates for voltage and frequency fluctuations and thereby ef-fectively protects sensitive computer electronic components and systems.A redundantly designed power supply system is another feature of the data cen-ter. This enables one to perform repairs on one network, for example, withouthaving to turn off servers, databases, or electrical equipment.
2.2.2 Cooling Unit
Figure 2.4: Cooling Unit
All electronic components especially the processors generate heat when theyare in operation. There is a chance that the efficiency of the component may
Chapter 2. Conceptual Background 15
decrease or component may fail if this heat is not dissipated. So, cooling a datacenter is very much essential, and because of the concentrated computing powerthe costs to do so are also considerable.For this reason, servers are installed in racks, which basically resemble speciallystandardized shelves. They are laid out so that two rows of racks face each other,thereby creating an aisle from which the front side of the server is accessible. Theaisles are covered above and closed off at the ends by doors. Cool air set to atemperature of 24 to 26°C is blown in through holes in the floor, flows throughthe racks, and dissipates the heat emitted by the servers.Generally, a server room will contain several such “enclosed” server rows. Thewarm air from the server room is removed by the air-conditioning system. Yet,even the air-conditioning system has to dissipate the heat. When the outsidetemperature is below 12 to 13°C, outside air can be used to effectively cool theheat absorbed by the air-conditioning systems.If outside temperatures are above 26°C, the heat exchangers are sprinkled withwater in order to make heat dissipation more effective through evaporative cool-ing. The municipal water supply system provides a reserve supply of water inthis case and acts as a failsafe.
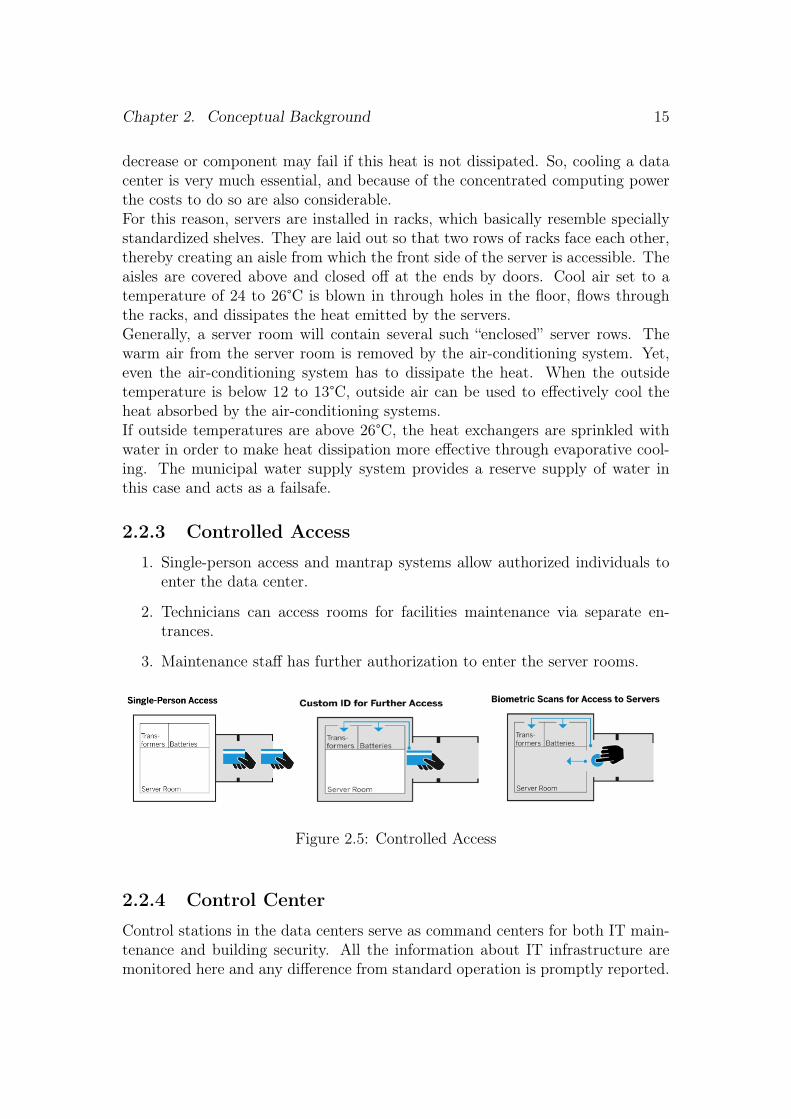
2.2.3 Controlled Access
1. Single-person access and mantrap systems allow authorized individuals toenter the data center.
2. Technicians can access rooms for facilities maintenance via separate en-trances.
3. Maintenance staff has further authorization to enter the server rooms.
Figure 2.5: Controlled Access
2.2.4 Control Center
Control stations in the data centers serve as command centers for both IT main-tenance and building security. All the information about IT infrastructure aremonitored here and any difference from standard operation is promptly reported.

Chapter 2. Conceptual Background 16
2.2.5 Safety Measurements
During fire mishaps water, extinguishing foam or powder fire suppression systemscan cause more damage in a data center than a charred cable. So, special ex-tinguishing gas called INERGEN which displaces oxygen in the air and smothersfire is used. This gas is harmless to people and the equipment.Closed Circuit Cameras are installed around the building and can be monitoredfrom the control center.
2.3 Simulation Tools
2.3.1 Cloud Sim
CloudSim is a library for the simulation of cloudscenarios. It provides essentialclasses for describing data centres, computational resources, virtual machines,applications, users, and policies for the management of various parts of the systemsuch as scheduling and provisioning.
Figure 2.6: Cloud Sim Architecture
2.3.2 Green Cloud
Green cloud is a buzzword that refers to the potential environmental benefitsthat information technology services delivered over the Internet can offer society.

Chapter 2. Conceptual Background 17
The term combines the words green – meaning environmentally friendly – andcloud, the traditional symbol for the Internet and the shortened name for a typeof service delivery model known as Cloud Computing.
Figure 2.7: Green Cloud Architecture

Chapter 3Related Work
Boccaletti et al. [15] discussed about how Greenhouse gas emissions are as-sociated with making and powering the world’s computers and telecom networkswhich are growing fast creating big carbon footprint especially in developing na-tions. They also suggest in their research that there are opportunities to usecertain technologies to make the world economy more energy and carbon efficient.
Koomey at al. [21] have estimated total electricity used by servers in the U.S.and world wide by combining measured data and estimates of power used by themost popular servers with data on the server installed base. These estimates arebased on more detailed data than are previous assessments, and they will be ofuse to policy makers and businesses attempting to make sense of recent trends inthis industry. It does not attempt to estimate the effect of structural changes inthe economy enabled by increased use of IT.
Rao et al. [22] discussed about the challenges and opportunities for researchersto explore the issues to quantify the electricity savings and methods for improv-ing the energy efficiency. In this paper, they systematically explored about theopportunities and adoptable methods for achieving the energy efficiency in datacenters. They explained about the study on data center virtualization and scaledit to realize significant savings for an enterprise.
Brown et al. [16] The United States Environmental Protection Agency(EPA)developed this report, which assesses current trends in energy use and energycosts of data centers and servers in the U.S. and emerging opportunities for im-proved energy efficiency. It provides the opportunities for reducing those coststhrough improved efficiency. It also makes recommendations for pursuing theseenergy-efficiency opportunities broadly across the country through the use of in-formation and incentive-based programs.
Umeno et al. [26] evaluated the virtualization overhead by measuring theperformance of the transaction systems running database servers on VMs. Theobjectives are to evaluate the VM overhead and the virtualization overhead for
18
Chapter 3. Related Work 19
heavy database servers running in VMs. They have found that the total CPUutilization in the two VMs running database servers increases to 2.5 times thanthat in the native system with the same hardware resources.
Uddin et al. [25] suggests about implementing server virtualization to achieveenergy efficient data centers. The proposed technique increases the utilizationratio of underutilized servers up to 50%, saving a huge amount of power and atthe same time reducing the emission of greenhouse gases.
Avelar et al. [12] Green Grid proposed the use of Power Usage Effectiveness(PUE) and its reciprocal, Data Center Infrastructure Efficiency (DCiE) metrics,which enable data center operators to quickly estimate the energy efficiency oftheir data centers, compare the results against other data centers, and determineif any energy efficiency improvements need to be made.
Avgerinou et al. [13] The aim of this paper is to evaluate, analyse and presentthe current trends in energy consumption and efficiency in data centres in theEuropean Union based on the data submitted by companies participating in theEuropean Code of Conduct for Data Centre Energy Efficiency programme, a vol-untary initiative created in 2008. The analysis shows that the average PUE ofthe facilities participating in the programme is declining year after year. Thisconfirms that voluntary approaches could be effective in addressing climate andenergy issue.
Meeun et al. [24] an average server environment, 30% of the servers areonly consuming energy, without being properly utilized. This paper proposesa five step model using an emerging technology called virtualization to achieveenergy efficient data centers. The proposed model helps Data Center managers toproperly implement virtualization technology in their data centers to make themgreen and energy efficient so as to ensure that IT infrastructure contributes aslittle as possible to the emission of greenhouse gases.
Chapter 4Method
4.1 CloudSimNow-a-days it is important to measure the cost of large-scale cloud infrastructureas it is hard to manage large-scale experiments on a real infrastructure, especiallywhen it is essential to repeat the experiments with the same conditions. So, sim-ulations (which is the imitation of the real model) have been selected as a way toevaluate the proposed model.
CloudSim [11] [1], a platform in which cloud strategies can be tested in acontrolled and reproducible manner. Therefore, simulation frameworks such asCloudSim are important, as they allow for the evaluation of the performance ofresource provisioning and application scheduling techniques under different in-frastructure configurations.
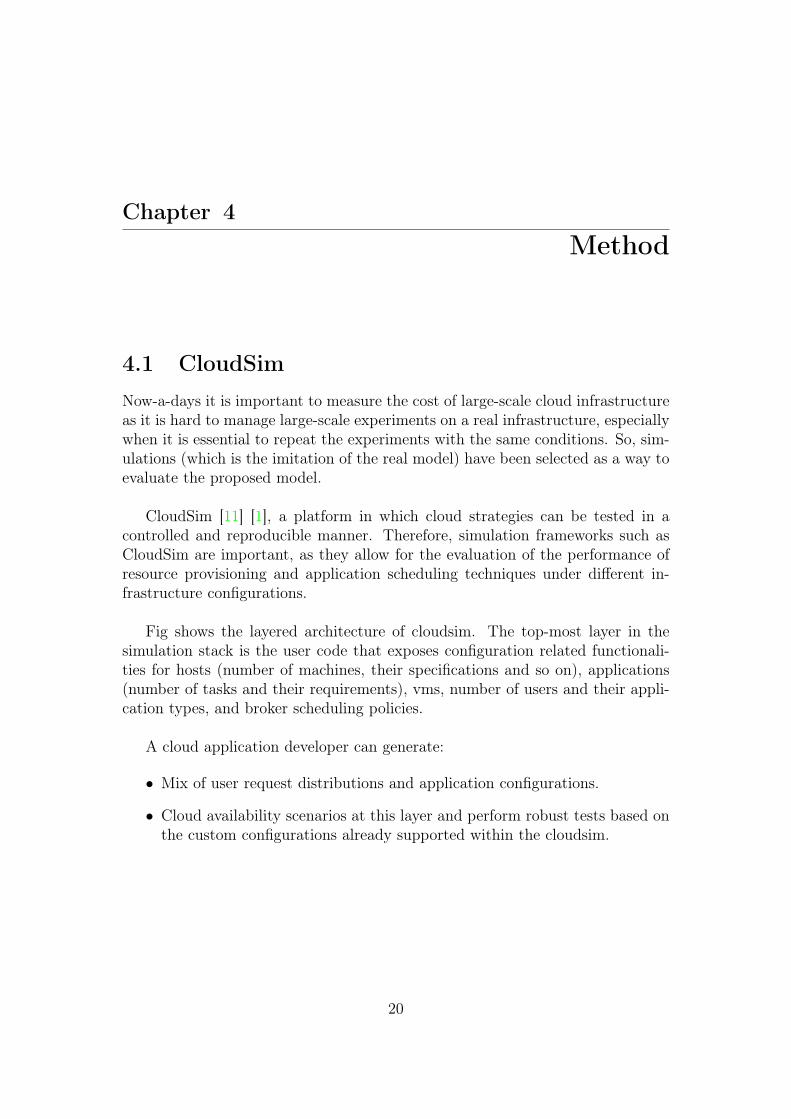
Fig shows the layered architecture of cloudsim. The top-most layer in thesimulation stack is the user code that exposes configuration related functionali-ties for hosts (number of machines, their specifications and so on), applications(number of tasks and their requirements), vms, number of users and their appli-cation types, and broker scheduling policies.
A cloud application developer can generate:
• Mix of user request distributions and application configurations.
• Cloud availability scenarios at this layer and perform robust tests based onthe custom configurations already supported within the cloudsim.
20

Chapter 4. Method 21
Figure 4.1: layered architecture of cloudsim
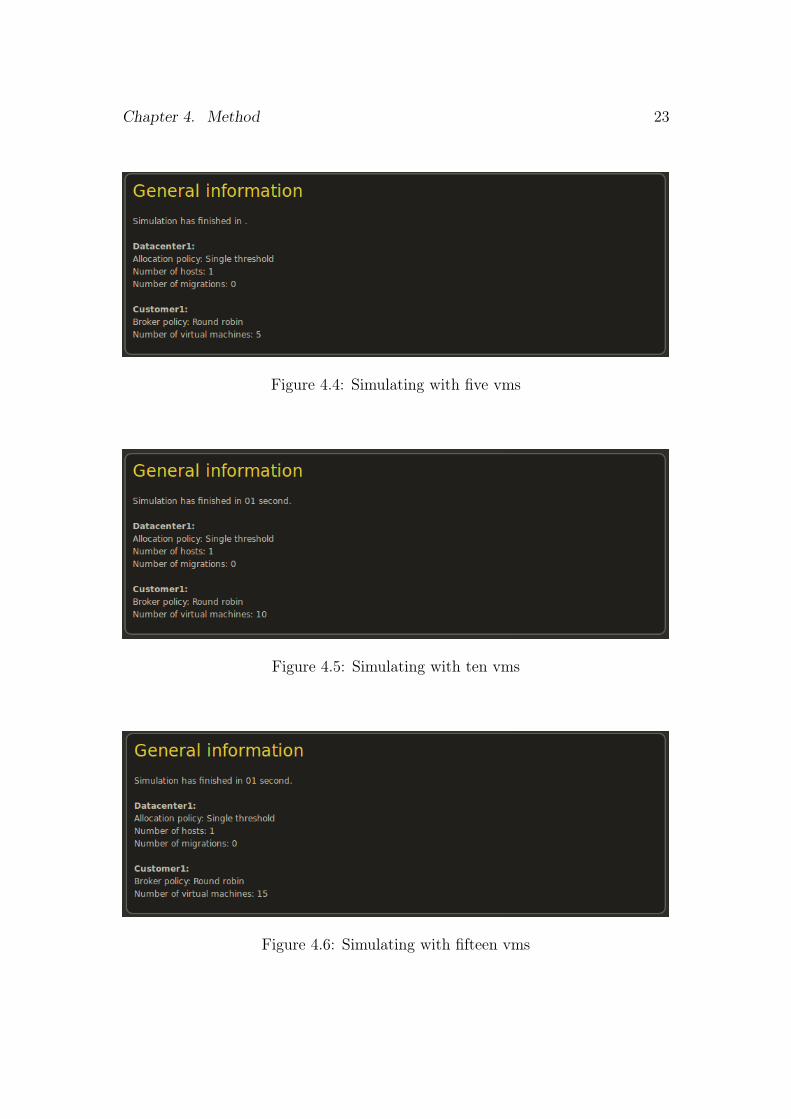
4.2 ImplementationWe first installed the cloudsim for the purpose of collecting the energy consump-tion of server in a data center. We consider a host in a data center and a customerwith one virtual machine. From fig we can see that one vm with round robin policyis considered. We first calculate the power consumption for this physical server.Then we start increasing the number of virtual machines and power consumptionis calculated for both KVM [5] installed vms and Xen [8] installed vms.
CloudSim configuration:
Server Architecture: x86; Operating System: Linux
Hypervisors: Xen, KVM; Broker Policy: Round Robin

Chapter 4. Method 22
Motivation for Round Robin Policy:
We have many broker policies like round robin policy, service proximity policy,performance optimization policy, dynamic configuration policy and more. Wechose round robin policy because from various studies it shows better performancewhen compared with other policies in terms of overall server response time anddata center processing time.
Figure 4.2: Simulating with one vm
Figure 4.3: Simulating with three vms
Chapter 4. Method 23
Figure 4.4: Simulating with five vms
Figure 4.5: Simulating with ten vms
Figure 4.6: Simulating with fifteen vms
Chapter 5Results
Figure 5.1: KVM with varying number of virtual machines
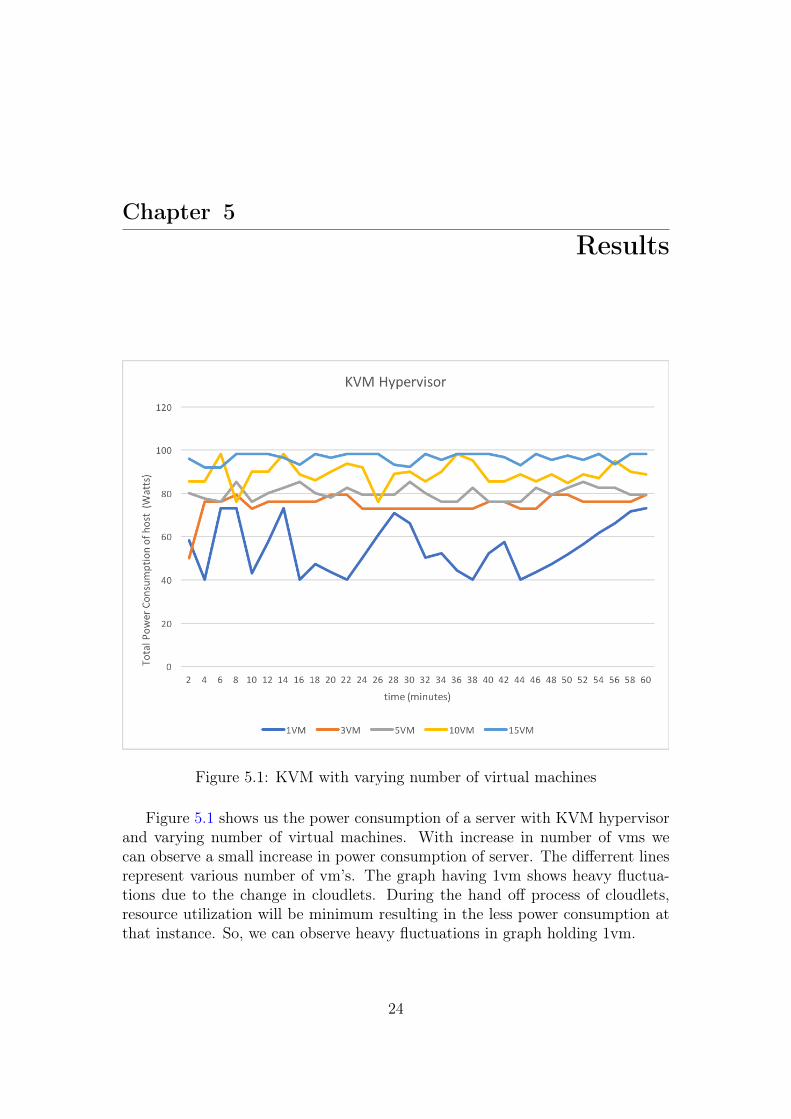
Figure 5.1 shows us the power consumption of a server with KVM hypervisorand varying number of virtual machines. With increase in number of vms wecan observe a small increase in power consumption of server. The differrent linesrepresent various number of vm’s. The graph having 1vm shows heavy fluctua-tions due to the change in cloudlets. During the hand off process of cloudlets,resource utilization will be minimum resulting in the less power consumption atthat instance. So, we can observe heavy fluctuations in graph holding 1vm.
24

Chapter 5. Results 25
X axis represents the time in minutes and Y axis represents the total powerconsumption of the host with Xen hypervisors. The average readings for 60min oftime interval are calculated and the values are tabulated and graphs are plotted.
Figure 5.2: Xen with varying number of virtual machines
Figure 5.2 shows us the power consumption of a server with Xen hypervisorand varying number of virtual machines. With increase in number of vms wecan observe a small increase in power consumption of server. The graph having1vm shows heavy fluctuations due to the change in cloudlets. During the handoff process of cloudlets, resource utilization will be minimum resulting in the lesspower consumption at that instance. So, we can observe heavy fluctuations ingraph holding 1vm.
X axis represents the time in minutes and Y axis represents the total powerconsumption of the host with Xen hypervisors. The average readings for 60minof time interval interval are calculated and the values are tabulated and graphsare plotted.
The tabulated values for total power consumption of host for Xen and KVMhypervisors with varying number of vms are shown here "Results table".

Chapter 5. Results 26
Figure 5.3: Comparing KVM and Xen when 3 virtual machines are deployed
Figure 5.3 shows the comparison in total power consumption of the host be-tween KVM and Xen when 3 virtual machines are deployed on a server. Theaverage power consumption of host with KVM is 75.5, compared to 76.1 when weconsider Xen hypervisor. The average power consumption value is also consideredand the graph is plotted for both KVM and Xen for better comparision.
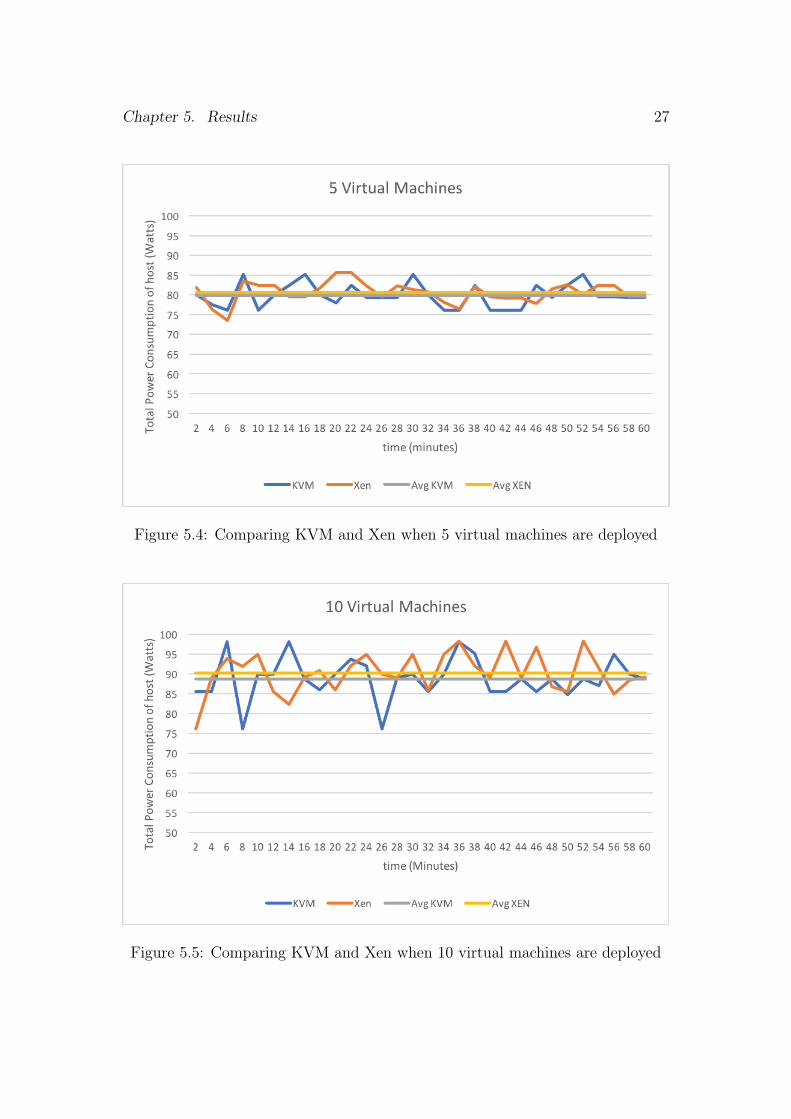
Figure 5.4 shows the comparison in total power consumption of the host be-tween KVM and Xen when 5 virtual machines are deployed on a server. Theaverage power consumption of host with KVM is 79.8, compared to 80.8 when weconsider Xen hypervisor. The average power consumption value is also consideredand the graph is plotted for both KVM and Xen for better comparision.
Figure 5.5 shows the comparison in total power consumption of the host be-tween KVM and Xen when 10 virtual machines are deployed on a server. Theaverage power consumption of host with KVM is 88.8, compared to 90.3 when weconsider Xen hypervisor. The average power consumption value is also consideredand the graph is plotted for both KVM and Xen for better comparision.
Figure 5.6 shows the comparison in total power consumption of the host be-tween KVM and Xen when 10 virtual machines are deployed on a server. Theaverage power consumption of host with KVM is 88.8, compared to 90.3 when weconsider Xen hypervisor. The average power consumption value is also consideredand the graph is plotted for both KVM and Xen for better comparision.
Chapter 5. Results 27
Figure 5.4: Comparing KVM and Xen when 5 virtual machines are deployed
Figure 5.5: Comparing KVM and Xen when 10 virtual machines are deployed

Chapter 5. Results 28
Figure 5.6: Comparing KVM and Xen when 15 virtual machines are deployed
Chapter 6Analysis and Discussion
6.1 What is the impact on energy consumptionof virtual data centers when compared withphysical data centers?
As discussed earlier, energy consumption plays a key role in a data center. So ouraim is to efficient use of resources by deploying more number of virtual machineson the same hardware with a minor changes in energy consumption.From the above graphs 5.1 and 5.2 we can observe the power consumption of aserver when KVM and Xen hypervisors are installed and varying the number ofvirtual machines.First we considered single virtual machine in a server and calculated the powerconsumption using cloudsim. From graph we can observe uneven increase anddecrease in power consumption which is due to drop in cloudlets. There on weincreased the number of vms and corresponding power consumption values areplotted. We can observe that there is small increase in power consumption withincrease in number of vms.If a server is being used instead of the 15 virtual machines more power is consumedwhich is equivalent to power consumed by 15 servers. Here we can see thatdeploying 15vms on a single server has consumed power which not even greaterthan the power consumed by two servers. Hence server consolidation method isvery much useful to reduce the energy consumption of a server.
29
Chapter 6. Analysis and Discussion 30
6.2 Will KVM perform better than Xen hypervi-sor in server virtualization in terms of energyconsumption while varying number of virtualmachines?
Here we considered comparison between KVM and Xen hypervisors. First wedeployed 3 virtual machines on both KVM and Xen and their correspondingpower consumption is calculate using cloudsim. There after we repeat the sameexperiment with increasing the number of vms from 5 to 10 and to 15 and theirvalues are plotted.From graphs 5.3 5.4 5.5 5.6 we observed that KVM has less power consumptionwhen compared with Xen hypervisors. From 5.6 we can observe that the powerconsumption of a server with KVM hypervisor is more stable than the server withXen hypervisor.
Chapter 7Conclusions and Future Work
From the above results we can conclude that power consumption of the serverdoes not vary much even after deploying VMs. So, we can decrease the use ofadditional physical servers which decreases the overall power consumption.
From graph we can observe that the average power consumed by the serverwhen Xen is deployed is greater than when KVM is deployed. Both of them beingbare metal hypervisors KVM consumes less power than Xen. So, we can concludethat KVM shows better performance than Xen in terms of power consumption.
We have done in this paper on server virtualization. It can further be ex-tended to storage virtualization, network function virtualization which helps indata center virtualization. With this we can furthermore decrease the energyconsumption of a data center.
We can also calculate the energy metrics of data center before and after vir-tualization and find energy efficiency of data centers. We can also find the excessenergy before virtualization and suggest ways to effective use of this excess energy.
31
References
[1] The CLOUDS Lab: Flagship Projects - Gridbus and Cloudbus.http://cloudbus.org/cloudsim/.
[2] Electric Grid.https://en.wikipedia.org/wiki/Electrical_grid.
[3] How a Data Center Works.http://www.sapdatacenter.com/article/data_center_functionality/.
[4] Hypervisor types.https://www.vgyan.in/type-1-and-type-2-hypervisor/.
[5] KVM.https://www.linux-kvm.org/page/Main_Page.
[6] Virtual Data Center.http://study.com/academy/lesson/what-is-a-virtual-data-center.html.
[7] Virtualization.https://www.redhat.com/en/topics/virtualization/what-is-virtualization.
[8] VS16: Video Spotlight with Xen Project’s Lars Kurth.https://www.xenproject.org/.
[9] Here’s How Much Energy All US Data Centers Consume, June 2016.
[10] Hypervisor, November 2017.https://en.wikipedia.org/w/index.php?title=Hypervisor.
[11] cloudsim: CloudSim: A Framework For Modeling And Simulation Of CloudComputing Infrastructures And Services, January 2018.https://github.com/Cloudslab/cloudsim.
[12] Victor Avelar, Dan Azevedo, Alan French, and Emerson Network Power.PUE: a comprehensive examination of the metric. White paper, 49, 2012.
32

References 33
[13] Maria Avgerinou, Paolo Bertoldi, and Luca Castellazzi. Trends in DataCentre Energy Consumption under the European Code of Conduct for DataCentre Energy Efficiency. Energies, 10(10):1470, September 2017.
[14] Kashif Bilal. Green Data Center Networks: Challenges and Opportunities.December 2013.
[15] Giulio Boccaletti, Markus Löffler, and Jeremy M. Oppenheim. How IT cancut carbon emissions. McKinsey Quarterly, 37:37–41, 2008.
[16] Richard E. Brown, Richard Brown, Eric Masanet, Bruce Nordman, BillTschudi, Arman Shehabi, John Stanley, Jonathan Koomey, Dale Sartor, andPeter Chan. Report to congress on server and data center energy efficiency:Public law 109-431. Technical report, Ernest Orlando Lawrence BerkeleyNational Laboratory, Berkeley, CA (US), 2007.
[17] Jeff Clark. Basics of a UPS System.
[18] DatacenterDynamics. Utility data center architectures part of smart gridproject.
[19] Juho Kaivosoja. Green Data Centers: Evaluating Efficiency. October 2016.
[20] Kelser. Types of Virtualization.https://inbound.kelsercorp.com/blog/the-7-types-of-virtualization.
[21] Jonathan G. Koomey. Estimating total power consumption by servers in theUS and the world. February, 2007.
[22] K. Thirupathi Rao, P. Sai Kiran, and L. Siva Shanker Reddy. Energy effi-ciency in datacenters through virtualization: A case study. Global Journalof Computer Science and Technology, 2010.
[23] Arman Shehabi, Sarah Smith, Dale Sartor, Richard Brown, Magnus Her-rlin, Jonathan Koomey, Eric Masanet, Nathaniel Horner, Inês Azevedo, andWilliam Lintner. United States Data Center Energy Usage Report, 2016.
[24] Mueen Uddin and Azizah Abdul Rahman. Virtualization implementa-tion model for cost effective & efficient data centers. arXiv preprintarXiv:1206.0988, 2012.
[25] Mueen Uddin, Asadullah Shah, Adamu Abubakar, and Imran Adeleke. Im-plementation of Server virtualization to Build Energy Efficient Data Centers.Journal of Power Technologies, 94(2):85, 2014.
References 34
[26] Hidenori Umeno, Maria LC Parayno, Koudai Teramoto, Masato Kawano, Hi-raku Inamasu, Shuuhei Enoki, Masato Kiyama, Tomoo Aoyama, and Taka-fumi Fukunaga. Performance evaluation on server consolidation using vir-tual machines. In SICE-ICASE, 2006. International Joint Conference, pages2730–2734. IEEE, 2006.


![Towards Making Network Function Virtualization a Cloud ... · Network Function Virtualization (NFV) [1] is bringing closer the possibility to truly migrate enterprise data centers](https://static.fdocuments.net/doc/165x107/5f1747c1b9693e35481490c6/towards-making-network-function-virtualization-a-cloud-network-function-virtualization.jpg)