Energy analysis of pelletising in a straight grate …990335/...Energy Analysis of Pelletising in a...
60
LICENTIATE THESIS Energy Analysis of Pelletising in a Straight Grate Induration Furnace Samuel Nordgren
Transcript of Energy analysis of pelletising in a straight grate …990335/...Energy Analysis of Pelletising in a...

LICENTIATE T H E S I S
Department of Applied Physics and Mechanical EngineeringDivision of Energy Engineering
Energy Analysis of Pelletising in a Straight Grate Induration Furnace
Samuel Nordgren
ISSN: 1402-1757 ISBN 978-91-7439-185-5
Luleå University of Technology 2010
ISSN: 1402-1757 ISBN 978-91-7439-XXX-X Se i listan och fyll i siffror där kryssen är


LICENTIATE THESIS
Energy analysis of pelletising in a straight grate induration furnace
Samuel Nordgren
Division of Energy Engineering Department of Applied Physics and Mechanical Engineering
Luleå University of Technology SE-971 87 Luleå, Sweden
December 2010

Printed by Universitetstryckeriet, Luleå 2010
ISSN: 1402-1757 ISBN 978-91-7439-185-5
Luleå 2010
www.ltu.se

PREFACE
I would like to thank my supervisors, Associated Professor Jan Dahl at the Division of Energy Engineering at Luleå University of Technology and Associated Professor Bo Lindblom at LKAB for their guidance and support throughout my work. Furthermore I would like to thank my colleagues, both at the Institute Excellence Centre PRISMA and at the Division of Energy Engineering at Luleå University of Technology for introducing me into the field of process integration, and also for creating a friendly atmosphere. A special thank to Dr. Chuan Wang for the help with the work in paper B.
I am very grateful to LKAB for giving me the opportunity to carry out this work. There are many people working at LKAB that deserves my appreciation, but a special thank to Håkan Emlén for fruitful discussions and excellent help with process description and data collection. I would also like to thank Stefan Lahti and Stefan Savonen for many useful comments on my report.
Furthermore would I like to thank Ulf Sjöström and Magnus Lundqvist at Swerea Mefos for their work with CFD-modelling of the induration furnace. This has been very helpful in my work with the energy related issues in paper B.
Finally, I would like to send my love to my girlfriend Mona and my daughter Milly. There is noting like the feeling when you come home after a hard day’s work and you are greeted with a big smile from your daughter.


Introduction ................................................................................................................................ 1 Background ............................................................................................................................ 1 LKAB ..................................................................................................................................... 1 Description of the LKAB upgrading process chain in Malmberget....................................... 2
Energy situation in the mining industry ..................................................................................... 3 Energy use in the LKAB mining facilities ............................................................................. 4
Energy efficiency at LKAB........................................................................................................ 6 PFE – The programme for improving energy efficiency in energy intense industries .......... 6 Surplus heat recovery ............................................................................................................. 6 LKAB heating system ............................................................................................................ 7 Increased green pellet temperature......................................................................................... 7
Summary of papers..................................................................................................................... 7 Results .................................................................................................................................... 8 Discussion and conclusion ................................................................................................... 12
Future work .............................................................................................................................. 13 Acknowledgements .................................................................................................................. 13 References ................................................................................................................................ 13
APPENDED PAPERS
A. Nordgren S, Dahl J, Larsson M, Lindblom B, Savonen S, Tano K. Development of a process integration tool for an iron ore upgrading process system. Proceeding of the Symposium on Environmental Issues and Waste Management, Bangkok, Thailand, 11-13 Dec 2007
B. Nordgren S, Dahl J, Lindblom B, Wang J. Process integration in an iron ore upgrading process system - analysis of mass and energy flows within a straight grate induration furnace. Proceeding of 18th International Congress of Chemical and Process Engineering, Prague, Czech Republic, 24-28 Aug 2008.
C. Nordgren S, Dahl J, Lindblom B. Green pellet temperature influence of production rate and fuel consumption within a straight grate induration furnace. Submitted for publication in Steel research international


Introduction
Background Being an energy-intensive industry, the work with energy-related issues is important for LKAB. If looking at the different process units, one by one, the processes are mature and operated with a relatively high efficiency. However, since the upgrading chain is quite complex, regarding both energy and material flows, it may be difficult to get a good overview of the whole system and to avoid sub-optimization with traditional methods. On the part of LKAB, there has been increasing interest in the issue of finding methods to make a systematic analysis of the whole production system. Process integration is the common name for a number of different methods to analyse industrial production systems systematically. The most common methodologies when working with process integration is pinch analysis, exergy analysis and mathematical programming. Process integration can for example be used to optimize the use of raw material or energy consumption, to minimize emissions or optimize the quality of a final product. The advantage of using process integration is that a whole industrial production system is included in the model. By doing that one can avoid the negative effect that sub-optimization may result in, i.e. optimization of a single process unit does not necessarily lead to an improvement of the whole production system.
Several studies, using the methodology of process integration, were carried out in the north of Sweden during the last decade [1-3]. A number of studies has been carried out at Luleå University of Technology, mainly focusing on the steel industry, and during recent years, many of the projects are carried out within, or in close cooperation, with PRISMA (Centre for Process Integration in Steel Making) [4]. PRISMA is an institute excellence centre which started up in 2006. PRISMA is supported by the Swedish Agency for Innovation Systems, the Knowledge Foundation, the Foundation for Strategic Research, and by the industrial participants Aga Gas AB, LKAB, Merox, Ovako Wire Oy Ab, Rautaruukki Oyj, Höganäs AB and SSAB Tunnplåt AB. The centre is located at Swerea MEFOS in Luleå, Sweden, and its organisation involves researchers from the institute, from industry, and from Luleå University of Technology.
To be able to develop a thorough process integration model, it is important to increase the knowledge of the different process units. This licentiate thesis has therefore focused on the most complex unit within the facility, namely the pelletising plants. The work that has been carried out in the licentiate thesis will constitute as a basis for a total system analysis, where the task is to develop a process integration model for LKAB’s production system in Malmberget, using the methodology of mathematical programming. The model will then be used primarily to optimize energy consumption and environmental impact.
LKAB believes that the process integration methodology can be a powerful tool in their work of making their processes more efficient; it can also be used to study different production scenarios or investigate how new equipment influences the production and therefore acts as a reference for future investments.
LKABThe iron ore company LKAB is a high-tech minerals group and one of the world’s leading producers of upgraded iron ore products for the steel industry and a growing supplier of industrial mineral products to other sectors. The majority of the products are sold to European
1

steel mills. LKAB has three production sites in the north of Sweden, i.e. Malmberget, Kiruna and Svappavaara. Table 1 shows the three sites with their corresponding production units.
Table 1. LKAB production sites in Malmberget, Kiruna and Svappavaara *Ten are currently being mined, **Straight grate process, ***Grate kiln process Process unit Malmberget Kiruna SvappavaaraOre bodie(s) ~20 (10)* 1 1Sorting plant 1 1 -Concentrating plant 1 3 1Pelletising plant 2** 3*** 1***
Description of the LKAB upgrading process chain in Malmberget The LKAB facility in Malmberget consists of different process units. Figure 1 shows the main process units.
Mine
Concentrating Plant
Sorting Plant
Pelletizing Plant MK3
Pelletizing Plant BUV
Electricity
Fuel
Additives Crude ore
Sorted ore
Iron ore pellet
Slurry
Iron ore pellet
Water
Bi-products
Figure 1. Schematic picture of the different process units within the LKAB facility in Malmberget
There are about 20 ore bodies located in the vicinity of the town of Malmberget of which ten are currently being mined. Most of the deposit consists of magnetite ore (Fe3O4), but non-magnetic hematite ore (Fe2O3) also occurs. Annually, about 12Mt of crude ore is extracted from the ore bodies. There are today three main haulage levels located at 600, 815 and 1000 metres depth. The extracted ore is fed into a crusher and crushed into lumps of about 100 mm in diameter. From the main level at 1000 metres, the crushed ore is hauled by a 1.7 km long conveyer to a skip shaft at the 815 level where the ore is lifted up to surface level.
2

The crude ore that has been extracted and hauled up to surface level then enters a sorting plant where the main task is to separate the iron ore from gangue and grind the ore down to smaller particles. In the sorting plant, both magnetite ore and hematite ore are processed, but in different sections. Four sections process the magnetite based ore and one section processes the hematite based ore. There is a small amount of magnetite in the hematite stream, so before the processing of the hematite stream can progress; the magnetite needs to be separated. This can be achieved by magnetic separators since the magnetite ore is strongly magnetic. When the magnetite has been separated from the hematite stream and the ore has been ground and separated from the gangue, the upgrading process continues in the concentrating plant.
There are six different sections in the concentrating plant. Three similarly constructed sections process the magnetite based ore and one section the hematite. The main purpose in the concentrating plant is basically to grind the ore down to a fine powder and to remove undesirable components; this is done by different separation methods such as, magnetic separators, gravitation and electromagnets. The ground ore is also mixed with water and different additives; this creates a slurry that is then fed into one of the two pelletising plants for further processing.
There are two pelletising plants at LKAB in Malmberget which are constructed similarly. The plants can be divided into a cold and a hot section. In the cold section, the ore is mixed with water and a number of different additives, the slurry is then rolled into centimetre sized spheres, or green balls. The green balls are then fed to one of the two pelletising plants, MK3 or BUV, where the pellets are upgraded to the final product of iron ore pellet. The pelletising plants are divided into different zones, i.e. drying zone, pre-heat zone, firing zone, after firing zone and finally a cooling zone.
Energy situation in the mining industry The mining industry is a very energy intensive industry. There are however quite large variations between different plants around the world regarding specific energy consumption [5-6]. One reason is the kind of mineral that is used in the upgrading process. The two most common mineral types are magnetite ore and hematite ore. Magnetite ore has the advantage that energy is released during the upgrading process, which therefore reduces the need for external fuels. Table 2 compares a number of different plants, regarding their fuel consumption. [6]
Table 2. Comparison of specific fuel consumption and additional exothermal energy from magnetite oxidation of different mining plants. (* Access to magnetite ore) Plant Location Oil or gas
[MJ/t] Admixed
coal[MJ/t]
Injected coal
[MJ/t]
Total[MJ/t]
Magnetite[MJ/t]
CVRD (Vale) Brazil 500 220 230 950 -Samarco Brazil 500 325 175 1000 -Fabrica Brazil 330 480 290 1100 -IOCC* Canada 440 240 - 680 140Pointe Noire Canada 590 250 - 840 -Hoogovens* Netherlands 338 296 - 634 145Sidbec Canada 346 270 - 616 -LKAB – Malmberget*
Sweden 225 - - 225 425
3

One matter to be considered is that the article that this table was presented in is from 1985 and many of the companies have most certainly improved their energy consumption since then. However, one important fact that the table shows is that the magnetite based plants in general use less external fuels than the hematite based plants. The benefits of magnetite ore are also shown in table 3, where the LKAB facilities in Malmberget, Kiruna and Svappavaara [7] and a CORUS Plant in IJmuiden [8] are compared. The magnetite amount in the ore blend is different in these cases. For the LKAB case, the proportion of magnetite is varying between 80 to 100 %, whilst in the Corus case, the magnetite amount is around 30 %. The need for external fuels is significantly higher when less magnetite is used in the process. The exothermal energy that is released from the magnetite oxidation is calculated, for the three LKAB cases, using the fact that around 60 % of the thermal energy needed for production comes from the magnetite oxidation [7]
Table 3. Comparison between LKAB and Corus regarding specific energy consumption. *Oil, **Coal (mainly) and oil, *** COG and coke breeze
Plant Location Magnetite External fuel [MJ/t]
Magnetite[MJ/t]
LKAB – Malmberget
Sweden ~90 % 210* 315
LKAB – Kiruna Sweden ~100 % 312** 468LKAB – Svappavaara
Sweden ~100 % 317** 476
CORUS – IJmuiden Netherlands ~30 % 607*** 144
Energy use in the LKAB mining facilities Being an energy intensive industry, effective energy use is one of LKAB’s most crucial issues in planning for the future. Energy accounts for a significant proportion of the company’s production cost and as a major energy user, LKAB has a great responsibility for reducing its environmental impact. LKAB is one of Sweden’s largest energy consumers. In 2008, a total of about 3.7 TWh of energy in the form of electricity, fossil fuels and recovered surplus heat was used in the production plants. About half of the energy used consisted of electricity (1.9 TWh). Out of Sweden’s total electricity consumption, LKAB accounts for almost 1.5% [7]. Figure 2 shows how the annual production and energy consumption have varied in recent years. For several years, the energy consumption has been more or less been directly proportional to the pellet production. The energy consumption in 2009 was about 18 % lower compared to the previous year and the production decreased by 26 %. This was due to the financial crisis, which reduced the production significantly.
4

0
500
1000
1500
2000
2500
3000
3500
4000
2004 2005 2006 2007 2008 2009
[GWh]
0
3
6
9
12
15
18
21
24
[Mt]
Oil Coal Electricity Production
Figure 2. Energy consumption and total production of the LKAB facilities [7]
In the mine fields in the north or Sweden, the predominant iron mineral is magnetite (Fe3O4), which has the advantage that energy is liberated during the iron ore pellet production, which reduces the need for external fuels significantly. Since the energy consumption in 2009 decreased by 18 % compared to 2008 and the production decreased by 26 %, this result in increased specific energy consumption in the year 2009 compared to the year 2008. Figure 3 shows the annual specific energy consumption of LKAB, including the production facilities in Kiruna, Malmberget and Svappavaara and the harbours in Luleå and Narvik.
0,00
0,05
0,10
0,15
0,20
2004 2005 2006 2007 2008 2009
[MWh/ton pellets]
Figure 3. Specific energy consumption of the LKAB facilities in Kiruna, Malmberget, Svappavaara, Luleå and Narvik. [7]
5

Energy efficiency at LKAB As for any energy intensive industry, the work with energy-related questions is an important issue for LKAB. LKAB has set the target to reduce the specific energy consumption by five percent, as compared to the base year 2006, up to and including 2012. Several different project are being carried out to meat these targets.
PFE – The programme for improving energy efficiency in energy intense industriesSince the year 2004, LKAB participating in a program called “The programme for improving energy efficiency in energy intensive industries, (PFE)”. The program was started up by the Swedish Energy Agency. The programme is intended to increase energy efficiency and create opportunities for tax exemption for the member companies. During the first period, 2004-2009, LKAB managed to achieve savings totalling around 58 GWh. LKAB has applied for participation in the program during the coming five-year period.
Surplus heat recovery By recovering surplus heat from the production, LKAB can reduce its need for external fuels and meet some of its energy requirements. In 2009, LKAB utilized 267 GWh and sold 9 GWh to the district heating system in the city of Kiruna. Figure 4 shows the annual amount of surplus heat which is recovered within LKAB, including the three production facilities in Malmberget, Kiruna and Svappavaara.
0
50
100
150
200
250
300
2004 2005 2006 2007 2008 2009
[GWh]
Figure 4. Surplus heat recovered internally at LKAB [7]
The surplus heat recovered internally by LKAB increased significantly from the year 2008. The reason for this is that a new pelletising plant, KK4, started up in 2008. This resulted in an increased access to heat generated from the waste heat boiler installed at KK4 and also an increased heat demand from the new facility and other buildings.
6

LKAB heating system The LKAB heating system in Malmberget has been studied using the methodology of mathematical programming [9]. The purpose of the work was to design and optimize the heating system by introducing an integrated concept to minimize the heat production cost. The results indicate that a lower cost could be achieved when a waste heat recovery boiler is installed in the older pelletising plant, BUV, to recover sensible heat from flue gas. This technical option is the best solution or at least contributes to the best solution in all optimization results. Including the externality cost is useful for making a fair evaluation of the social-environmental impacts of the alternatives.
Increased green pellet temperature The green pellet temperature tends to be an important parameter regarding the efficiency of the straight grate induration furnace. It is believed that an increased green pellet temperature will increase the productivity and the durability of the pellet and also decrease the specific energy consumption [10]. Within the straight grate induration furnace, many parameters will be affected by a higher green pellet temperature, which in turn will lead to the above-mentioned improvements. Initial results from an experimental study are indicating that the durability of the pellet may be improved by a higher green pellet temperature, with less deformed pellets and a higher proportion of solid pellets as a result. Since the temperature tends to increase the durability of the pellet, this will also affect other parameters inside the induration furnace. An increased temperature will result in a lower pressure drop over the pellet bed, which means that the process fans will not need to work as hard to force the gas streams through the bed, which is due to the fact that the pellets will have a more uniform shape which makes it easier for the gas streams to pass the bed. The primary positive effects of a lower pressure drop will be:
Higher gas flow through the pellet bed Higher productivity Lower energy use
Since a lower pressure drop will result in a higher gas flow through the bed, the drying process will be affected. The productivity can also be affected by a lower pressure drop. If there is a good heat exchange in the pellet bed, the travelling grate speed or the bed height can be increased, which will result in higher productivity. The specific oil consumption should therefore also decrease by a higher green pellet temperature. A lower pressure drop in the pellet bed may also decrease the power input into the process fans.
Summary of papers In paper A, the LKAB production facility in Malmberget and the most common process integration techniques, i.e. mathematical programming, pinch analysis and exergy analysis are described, with focus on mathematical programming. The principles of the model development, together with a description of the software that will be used are also a part of paper A. The purpose of this paper was to analyse the LKAB production facility in Malmberget and also to describe the methodology of process integration.
In paper B, the material and energy flows within the straight grate induration furnace, MK3 are analysed. The MK3 induration furnace was divided into four different zones, where a mass and energy balance was calculated in each zone. There are huge internal energy streams inside the MK3 induration furnace. As the induration furnace was divided into four zones, the
7

amounts of internally circulated air and different gas streams was quantified in the mass and energy calculations.
In paper C, an analysis was carried out, investigating how the green pellet temperature influences the behaviour of the MK3 furnace, more specifically how the green pellet temperature influences the production rate and fuel consumption. The outcome is based on production data during a specific time period. Most of the work in paper C was focused on different filtering methods, where the main task was to exclude production data that is not relevant for the study. A total of 34 cases were calculated, where each case was filtered differently, 17 cases calculated with one hour average data and 17 cases with four hour average data. The different cases are corresponding to different production rates, where production below a specific production rate has been excluded in each filtering case, and summed up in a graph, showing how the production rate and specific fuel consumption change depending on the green pellet temperature. Table 4 shows the number of data points corresponding to each filtering level. The table is divided into both one-hour average data and four-hour average data. Filtering case number 1 shows for example data where production below 350 t/h was excluded in the analysis. This specific case includes 1827 data points based on one-hour average data and 456 data points based on four-hour average data. Each data point consists of production rate, oil consumption and green pellet temperature.
Table 4. Number of data points of each filtering level, data divided into one-hour average and four-hour average.
Number of resulting data points Filtering case Production filtering level[t/h]
Based on one-hour data
Based on four-hour data
1 <350 1827 4562 <355 1824 4553 <360 1823 4544 <365 1819 4545 <370 1812 4536 <375 1802 4457 <380 1783 4418 <385 1739 4329 <390 1672 41610 <395 1566 38611 <400 1447 35712 <405 1328 32413 <410 1163 28714 <415 963 23415 <420 830 20516 <425 722 17117 <430 553 126
ResultsPaper A was an initial step towards increasing knowledge of the LKAB production facility in Malmberget. The different production units were studied i.e. mine, sorting plant, concentrating plant and the two pelletising plants. The concept of process integration was also presented in paper A, with focus on the mathematical programming technique.
8
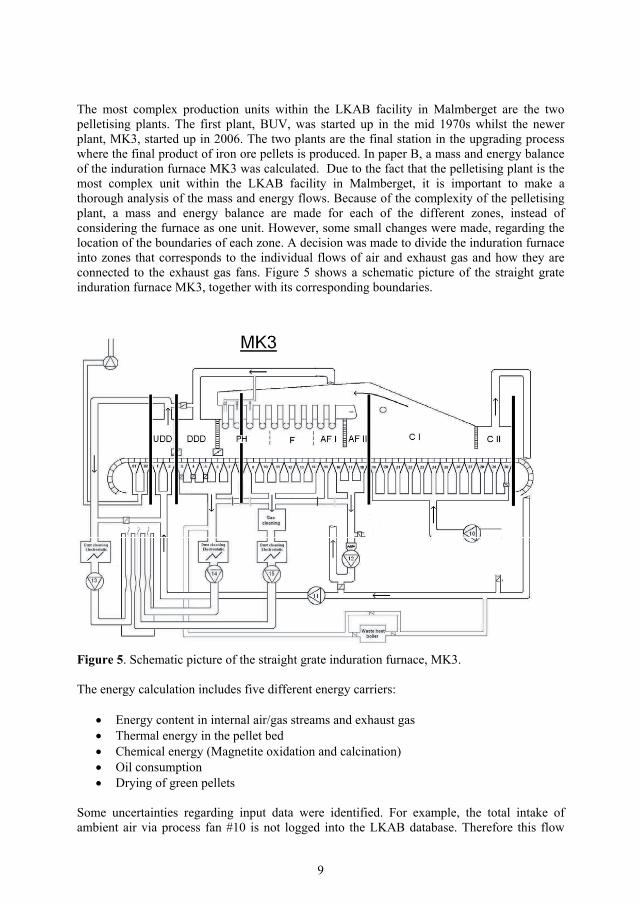
The most complex production units within the LKAB facility in Malmberget are the two pelletising plants. The first plant, BUV, was started up in the mid 1970s whilst the newer plant, MK3, started up in 2006. The two plants are the final station in the upgrading process where the final product of iron ore pellets is produced. In paper B, a mass and energy balance of the induration furnace MK3 was calculated. Due to the fact that the pelletising plant is the most complex unit within the LKAB facility in Malmberget, it is important to make a thorough analysis of the mass and energy flows. Because of the complexity of the pelletising plant, a mass and energy balance are made for each of the different zones, instead of considering the furnace as one unit. However, some small changes were made, regarding the location of the boundaries of each zone. A decision was made to divide the induration furnace into zones that corresponds to the individual flows of air and exhaust gas and how they are connected to the exhaust gas fans. Figure 5 shows a schematic picture of the straight grate induration furnace MK3, together with its corresponding boundaries.
Figure 5. Schematic picture of the straight grate induration furnace, MK3.
The energy calculation includes five different energy carriers:
Energy content in internal air/gas streams and exhaust gas Thermal energy in the pellet bed Chemical energy (Magnetite oxidation and calcination) Oil consumption Drying of green pellets
Some uncertainties regarding input data were identified. For example, the total intake of ambient air via process fan #10 is not logged into the LKAB database. Therefore this flow
9

was theoretically calculated using the total outgoing flow thorough the three exhaust gas fans (13, 14 and 15), the amount of oxygen consumed during oxidation and the amount of vaporized water. However, the uncertainty of making this kind of backward calculation is that air leakages into the furnace are not included, which may influence the result of the energy balance in the different zones.
In the energy related calculations, the program HSC Chemistry [11] was used. HSC Chemistry is a PC-based system that solves chemical reaction and equilibrium problems by using data from various thermodynamic databases. HSC provides an add-in function which makes it possible to use the HSC database directly under MS Excel and in that way carry out several thermochemical calculations. Figure 6 shows the partial heat balance of the MK3 induration furnace, divided into different zones. The four columns are normalised, meaning that the quantified total energy input/output of each zone can differ.
-100
-80
-60
-40
-20
0
20
40
60
80
100
UDD DDD - PH PH - AFII CI - CII
%
Oil
Magnetite oxidation
Thermal energy in pellet
Exhaust gas/recuperated gas
Drying
Calcination
Thermal energy in pellet
Exhaust gas/recuperated gas
Figure 6. Partial heat balance of the MK3 induration furnace. The boundaries of each zone are illustrated in figure 5.
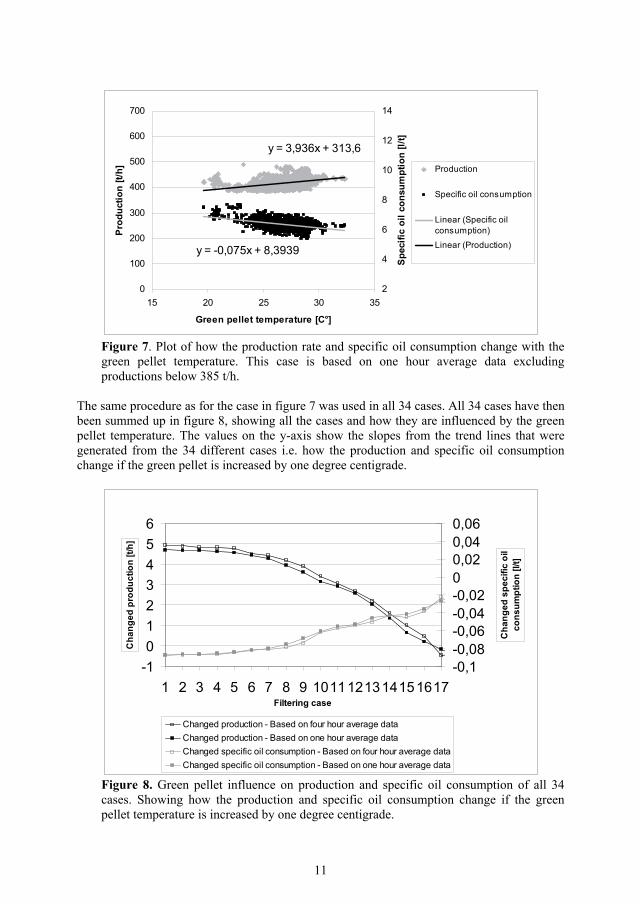
In paper C, the outcome of the analysis of how the green pellet temperature influences the production rate and specific fuel consumption is based on 34 different cases. 17 cases are calculated with one hour average data and 17 cases with four hour average data. Each case is based on production data from the chosen time period. Figure 7 shows the basic principle of how one of the 34 cases was analysed. Two plots are included in each filtering case; the production rate and the specific oil consumption are plotted against the green pellet temperature. The case in figure 7 is based on one-hour data excluding productions below 385 t/h. A trend line has been added to the two plots, where the slope of the trend line showing how the production and specific oil consumption change, if the green pellet temperature is increased by one degree centigrade. In this specific case, the production rate is increased by almost 4 tons per hour and the specific oil consumption is decreased by 0.075 litres per ton.
10
y = -0,075x + 8,3939
y = 3,936x + 313,6
0
100
200
300
400
500
600
700
15 20 25 30 35
Green pellet temperature [C°]
Prod
uctio
n [t/
h]
2
4
6
8
10
12
14
Spec
ific
oil c
onsu
mpt
ion
[l/t]
Production
Specific oil consumption
Linear (Specific oilconsumption)
Linear (Production)
Figure 7. Plot of how the production rate and specific oil consumption change with the green pellet temperature. This case is based on one hour average data excluding productions below 385 t/h.
The same procedure as for the case in figure 7 was used in all 34 cases. All 34 cases have then been summed up in figure 8, showing all the cases and how they are influenced by the green pellet temperature. The values on the y-axis show the slopes from the trend lines that were generated from the 34 different cases i.e. how the production and specific oil consumption change if the green pellet is increased by one degree centigrade.
-10123456
1 2 3 4 5 6 7 8 9 1011121314151617Filtering case
Cha
nged
pro
duct
ion
[t/h]
-0,1-0,08-0,06-0,04-0,0200,020,040,06
Cha
nged
spe
cific
oil
cons
umpt
ion
[l/t]
Changed production - Based on four hour average dataChanged production - Based on one hour average dataChanged specific oil consumption - Based on four hour average dataChanged specific oil consumption - Based on one hour average data
Figure 8. Green pellet influence on production and specific oil consumption of all 34 cases. Showing how the production and specific oil consumption change if the green pellet temperature is increased by one degree centigrade.
11

Figure 8 is illustrating how the green pellet temperature affecting the production and oil consumption from all the 34 cases. Filtering case number 1, where the production was filtered at 350 t/h, meaning that all production below 350 t/h were excluded, shows that the production will increase by around 5 t/h if the green pellet temperature increased one degree centigrade. The corresponding value for the specific oil consumption results in a changed oil consumption by around -0.08 l/t. When the production filtering level increases, the green pellet temperature effect on the production and specific oil consumption reduces. The final filtering case (#17), were production below 430 t/h has been excluded, shows that the effect from an increased green pellet temperature on production and specific oil consumption more or less are negligible. It should be mentioned that at this filtering level, the number of data points are relatively small, which makes the evaluation more uncertain. The difference between the results based on one-hour average data and the four-hour average data are small.
Discussion and conclusion Since this licentiate thesis is the basis of a total system analysis of the LKAB facility in Malmberget, where the aim for the future is to develop a process integration model, it is of great importance to understand the different process units from an operational point of view. In paper A, the aim was to study the different process units within the facility in Malmberget, and also to describe process integration and the most common methodologies i.e. pinch analysis, exergy analysis and mathematical programming, with focus on mathematical programming. Within the facility in Malmberget, the most complex units are the two pelletising plants, where the final product of iron ore pellets is produced. It was therefore decided to focus on the pelletising plants in paper B and paper C. The importance of dividing the furnace into different zones, and calculate a mass and energy balance in each zone, was shown in paper B. There are huge internally circulating gas streams that not would have been quantified if the induration furnace would have been considered as one zone. Although the work in the future will focus on the total production system, the induration furnaces will play an important role since they are the most energy intensive processes within the facility.
The aim of paper C was to analyse how the green pellet temperature influences the productivity and fuel consumption. Why the productivity and fuel consumption are influenced by the green pellet temperature is due to several factors. The durability of the green pellet is believed to be dependent on its temperature, a higher temperature results in a more uniformly shaped pellet and also in a smaller proportion of deformed pellets. This will improve the heat exchange in the pellet bed since it’s easier for the gas stream to pass the pellet bed if the pellet has a more uniform shape. Since the heat exchange in the bed will be improved with a lower pressure drop, this makes it possible to increase the travelling grate speed, or increase the bed height, which will lead to higher productivity. The power input to the process fans is also related to the pressure drop over the bed. A lower pressure drop results in a lower power input to the process fans, since the fans don’t need to work as hard to force the gas streams through the pellet bed.
The oil consumption is also influenced by an increased green pellet temperature. During normal production, if the green pellet was increased by one degree centigrade, this result in an additional thermal energy input corresponding to around 400 MJ/h. Theoretically, if the external fuel energy input into the furnace was decreased by the same amount, this would result in decreased oil consumption by around 10 l/h or 0.025 l/t. The corresponding values from paper C, where the calculations were based on production data, showed that the changed specific oil consumption varied from -0,02 l/t to -0.08 l/t, depending on which case its referring to.
12

The main conclusions from paper C is that a higher green pellet temperature increases the productivity and decreases the specific oil consumption. The effect is depending on the filtering level. If the green pellet temperature is increased by one degree centigrade, the productivity increases by around 4-5 t/h when the cases where productions below 350 to 385 t/h are excluded. (Filtering case 1 to 8), the corresponding number for the specific oil consumption results in a decreased specific oil consumption by around 0.08 l/t. The effect then reduces when increasing the filtering level. Close to maximum production, the effect of an increased green pellet temperature is more or less negligible, both regarding the productivity and the specific oil consumption. According to the results, the difference between one-hour average data and four –hour average data are very small.
Future work This project aims to increase the knowledge of the LKAB mining facility in Malmberget, with focus on the straight grate induration furnace and is an initial step towards a total system analysis, including all the process units within the LKAB facility in Malmberget. The aim for the future is to develop and validate a process integration model for the LKAB production facility in Malmberget. The model will be developed by using the methodology of mathematical programming where the objective is to optimise the production facility with respect to:
Energy consumption Environmental impact Surplus heat recovery CostProductivity
Other more specific tasks are for example:
Possibilities to increase the green pellet temperature using surplus heat from the processes. How will the whole production system be optimised? How much heat can be extracted from the heat exchanger without affecting the efficiency of the MK3 induration furnace? How much heat can be extracted from the heat exchanger without affecting the efficiency of the BUV induration furnace if a heat exchanger will be installed? How will the production system be optimised with respect to variations in the raw materials?
AcknowledgementsI would like to thank LKAB and the institute excellence centre PRISMA (Centre for Process Integration in Steelmaking) for the financial support during this work.
References[1] J Sandberg, J Dahl. Adaptation and development of process integration tools for an existing iron ore pelletising production system. International congress of chemical and process engineering. Prague, Czech Republic. 24-28 august, 2008 [2] C Wang, M Larsson, C Ryman, C-E Grip, J-O Wikström, A Johansson, J Engdahl. A model on CO2 emissions reduction in integrated steelmaking by optimization methods. International journal of energy research. 2008, Vol 32, pp 1092-1106
13

[3] C Ryman, M Larsson. Reduction of CO2 emissions from integrated steel-making by optimised scrap strategies: Application of process integration models on the BF-BOF system. ISIJ International, 2006, Vol 46, pp 1752-1758 [4] Centre for process integration in steelmaking, PRISMA. Institute excellence centre. www.prisma.mefos.se [5] V M. Abzalov, V N. Nevolin, V V. Bragin, Yu N. Kalinenko, A V. Kononykhin, B I. Borisenko. Modernization of roasting machines. Steel in translation. Vol 38, No 12, pp 990-991 [6] J E. Appleby, G Shaw. Carbonaceous additives in the pelletizing process. 4th International symposium on agglomeration. Toronto, Canada 1985. pp 49-74 [7] Sustainability report, LKAB 2009 – Available at www.lkab.com [8] R C. Schimmel. Energy and flow balance of the induration machine – at Corus IJmuiden. 2nd COREM Symposium on Iron Ore Pelletizing. Quebec, Canada. 2-4 June, 2008 [9] C Wang, S Nordgren, B Lindblom, S Savonen, T Hedpalm, M Larsson, R Hansson. Conceptual design of an integrated heating system at LKAB Malmberget with consideration of social-environmental damage costs. Journal of Cleaner Production. 2010, Vol 18, pp 944-951[10] Internal report, LKAB [11] HSC Chemistry. Simulation and modelling software, version 6.0. Outotec oyj, Espoo Finland.
14

Paper A


1
Development of a Process Integration Tool for an Iron Ore Upgrading Process System
Samuel Nordgren1, 2 *, Jan Dahl1, Mikael Larsson2, Bo Lindblom3, Stefan Savonen3,
Kent Tano3
1 Department of Energy Engineering, Luleå University of Technology, 971 87 Luleå, Sweden
2 PRISMA – Centre for process integration in steelmaking MEFOS – Metallurgical Research Institute AB 971 25 Luleå, Sweden
3 LKAB 971 28 Luleå, Sweden
Abstract An industrial energy system is subject to different regulations and restrictions. Good integration between units within the production chain as well as integration with the community can lead to both environmental and energy savings. Process integration is a system oriented methodology to
analyze whole production systems to find optimal system changes. A mathematical programming technique is being developed for the Swedish iron ore producing facility of
LKAB in Malmberget. The mathematical model will be based on a mass and energy balance for the facility specified for the different unit operations. The development of a good mathematical
model requires a systematic mapping of the energy and material flows within an iron ore producing facility. In this paper a conceptual model for the process integration tool is described.
Keywords: Process integration, Optimization, Mathematical programming, Modeling
1. Introduction LKAB is an international high-tech minerals group, one of the world’s leading producers
of upgraded iron ore products for the steel industry and a growing supplier of industrial minerals products to other sectors. Most of the iron ore products are sold to European steel mills. Other important markets are North Africa, the Middle East and Southeast Asia. Industrial minerals are sold mainly in Europe, but businesses are growing in Asia and the USA. LKAB has more than 3,700 employees, of which more than 600 outside Sweden. There are iron ore mines, processing plants and ore harbors in northern Sweden and Norway, sales office in Belgium, Germany and Singapore.
LKAB is one of Sweden’s largest electricity consumers and accounts for more than 1 % of the country’s total electricity consumption. When the planned investments in increased production have been realized, by about 2009, LKAB’s electricity consumption will have risen to nearly 1.5% of total national consumption. With regard to costs, process technology and climate impact, the energy issue is strategically important for LKAB. In the iron ore operation, vast amounts of electricity are used, mainly in mine operation and mineral processing. In the next year, annual consumption of electricity will have increased from about
* Corresponding author, Email: [email protected]

2
1.7 to more than 2 terawatt hours (TWh). At the same time, market prices on the Nordic power exchange have risen dramatically since deregulation.
In recent years, increased attention has been given by the iron ore industry to use energy more efficient. The iron ore industry is one of energy-intense industries, with high CO2 emissions. Improvement of the energy efficiency, to reduce the energy consumption, will increase the economic profitability as well as reducing the environmental impacts. With increasing concerns of climate change issues, more efforts are made by the iron ore industry to reduce its CO2 emissions.
2. Process Integration A major goal for LKAB, as for the whole process industry, is to minimize the
environmental impact and the energy consumption. LKAB in Malmberget consists of a number of different operation units and a way to achieve these goals is to improve the behavior of these individual units. However, a change in one unit will not automatically lead to an energy saving for the whole system. Therefore methods are needed to improve the energy consumption for the total system. These techniques are here defined as Process integration. Basically when working with process integration there are often three different methodologies that are being used: Pinch Analysis, Exergy Analysis and Mathematical Programming.
2.1. Pinch Analysis: Pinch analysis is a methodology for minimizing energy consumption of chemical
processes by calculating thermodynamically feasible energy targets and achieving them by optimizing heat recovery systems, energy supply methods and process operating conditions. The process data is represented as a set of energy flows, or streams, as a function of heat load against temperature. This data is combined for all the streams in the plant to give so called composite curves, one for all ‘hot streams’ (releasing heat) and one for all ‘cold streams’ (requiring heat). The point of closest approach between the hot and cold composite curves is the pinch temperature (or just pinch), and is where design is most constrained. Hence, by finding this point and starting design there, the energy targets can be achieved using heat exchangers to recover heat between hot and cold streams. In practice, during the pinch analysis, often cross-pinch exchanges of heat are found between a stream with its temperature above the pinch and one below the pinch. Removals of those exchanges by alternative matching make the process reach its energy target. The techniques were first developed in the late 1970’s by teams led by Bodo Linnhoff at ICI and UMIST (now Manchester University). Many refinements have been developed since and used in a wide range of industries, including non-process situations. Both detailed and simplified (spreadsheet) programs are now available to calculate the energy targets
2.2. Exergy Analysis: Exergy is the part of the energy that according to the first and second law of
thermodynamics can be converted into work. The processes can be analyzed with respect to the exergy losses and from this, different practices can be compared. Costa et al [1] presented an exergy study applied to analyze the effect of diverse technologies options for the different process routes. For instance, the use of excess energies or material flows was analyzed.

3
2.3. Mathematical Programming: The origin of this method comes from Economic Optimization, which are constructed in
such way that process modules can be added as modules. There are a number of different mathematical programming types: Linear programming (LP), mixed integer linear programming (MILP), non-linear programming (NLP), and mixed integer non-linear programming (MINLP). How the problem is formulated decides which type to use. Mathematical programming, also called optimization, has an important role in decision science and in the analysis of physical systems. In general terms, optimization theory is a body of mathematical results and numerical methods for finding and identifying the best candidate from a collection of alternative without having to explicitly enumerate and evaluate all possible alternatives. An optimization problem often consists of a set of independent variables or parameters, and also restrictions/constraints that define acceptable values of the variables. The essential component of an optimization problem is the objective function, which depends in some way on the variables. The solution to an optimization problem is a set of allowed values of the variables for which the objective function assumes an optimal value. Basically there are two different techniques used when dealing with optimization problems, single-objective optimization and multi-objective optimization.
2.4. Single-objective optimization This is a technique where one objective at a time can be optimized. In mathematical
terms, the objective function can be written as follows: Objective:
),( yxfZ (1) Subject to:
0),( yxh
0),( yxg (2) 1.0,0 yx Or integer
Where Z is the objective function which is to be minimized, h(x, y) and g(x, y) are different constraints in a system, x can be any continuous or integer variable and y is any binary variable.
2.5. Multi-objective optimization In contrast to the single objective optimization where only one objective at a time can be
optimized, a multi-objective optimization can optimize several objectives at the same time. For instance, it is useful to find out an optimum solution with a lower production cost and at the same time a lower CO2 emission. To be able to do that, multi-objective optimization is needed. A study by Greening and Bernow [3] contains a comprehensive review of multi decision-making methods. They conclude that the conventional analysis methods based on one criterion have limitations in analysis of more complex nature such as energy or environmental policies.
Generally, a multi-objective optimization problem can be approached in four different
ways depending on when the decision-maker articulates his or her preferences regarding the

4
different objectives: never, before, during or after the actual optimization procedure [4]. There are several different optimization methods under each preferred approach. Some examples of methods are weighted sum, ε-constraint and goal programming. In the weighted sum method, the objectives have different weights depending on the chosen importance of each objective. For the ε-constraint method, only one objective is optimized, the other objectives being instead bounded through global constraints. Goal programming means that each objective is formulated as a certain goal that the decision-maker wants to achieve.
2.6. Pareto front analysis In connection with the multi-objective optimization, it is possible to find Pareto-optimal
solutions. This is a solution where no objective can be improved without another deteriorating. The plot of the objective functions is called Pareto front, an example of a Pareto front is shown in Figure 1. As for bi-objective optimization problem, Pareto front curve represents all the solutions from minimizing one objective with upper lever constraints bounded by the other objective, and vice versa. This allows the decision maker to choose an acceptable trade-mark between the two goals by considering the different solutions along the Pareto front.
Figure 1. Example of a Pareto front for a minimization problem.
3. Equation editor The equation editor that will be used in the model design is called reMIND, providing an
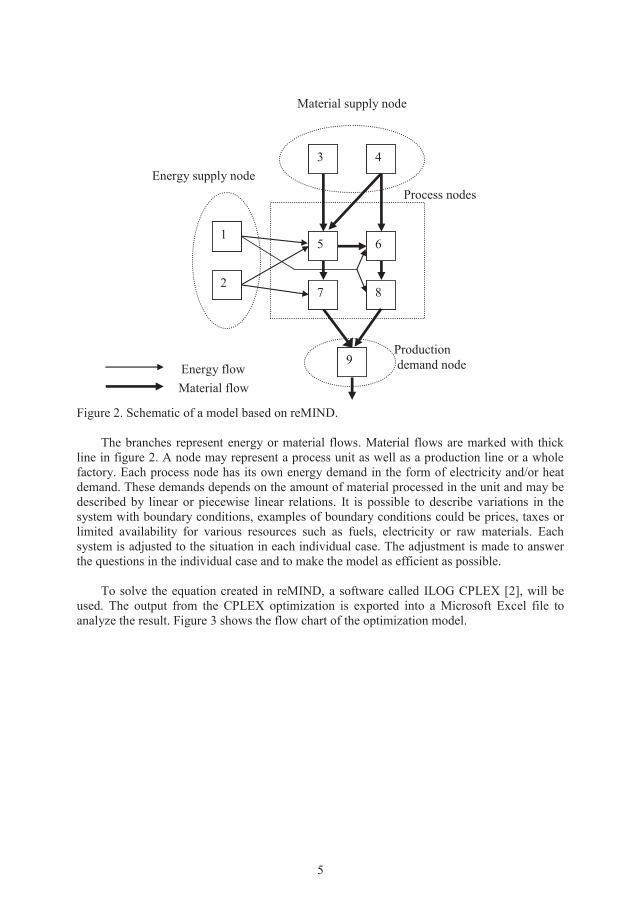
intuitive graphical interface by describing the relations between sub-processes units and the entire process being studied. This software was initially developed by Linköping University (LiU). Further development was carried out in cooperation between LiU and Luleå University of Technology (LTU). The structure of an energy system is represented as a network of nodes and branches, a basic example is schematically shown in figure 2.
5
Figure 2. Schematic of a model based on reMIND.
The branches represent energy or material flows. Material flows are marked with thick line in figure 2. A node may represent a process unit as well as a production line or a whole factory. Each process node has its own energy demand in the form of electricity and/or heat demand. These demands depends on the amount of material processed in the unit and may be described by linear or piecewise linear relations. It is possible to describe variations in the system with boundary conditions, examples of boundary conditions could be prices, taxes or limited availability for various resources such as fuels, electricity or raw materials. Each system is adjusted to the situation in each individual case. The adjustment is made to answer the questions in the individual case and to make the model as efficient as possible.
To solve the equation created in reMIND, a software called ILOG CPLEX [2], will be used. The output from the CPLEX optimization is exported into a Microsoft Excel file to analyze the result. Figure 3 shows the flow chart of the optimization model.
Production demand node
Process nodes Energy supply node
Energy flow Material flow
Material supply node
1
2
3 4
5 6
7 8
9

6
Figure 3. Flow chart of the optimization model.
4. Development of a process integration tool for the iron ore industry
The idea of developing a process integration tool for the iron ore industry is based on a previous model designed for the steel plant SSAB Tunnplåt AB in Luleå, Larsson et al [5]. Several studies have been made at SSAB during the last years in the area of process integration, mainly using the methodology of mathematical programming [6], [7], [8]. The models that have been developed using process integration have proven to be a useful tool for SSAB; therefore there has been an interest from LKAB to develop similar models for their facilities. The mathematical model that will be used is based on a mass and energy balance for the facility specified for the different unit operations. LKAB believe that such models would be helpful in their work of making their processes more efficient and also a tool where different scenarios can be modeled and used as a reference for future investments.
The main processes in the iron ore production chain at LKAB, i.e. mine, sorting plant, concentrating plant and pelletizing plants will be modeled separately and are connected with primary product interaction (crude ore, “sorted ore”, “slurry” and iron ore pellet). The iron ore pellet demand from the pelletizing plant will determine the “slurry” demand from the concentrating plant, which in turn will determine the “sorted ore” demand from the sorting plant and so forth. The different processes and the main process flows are shown in figure 4. Internal material and energy flows are not included in the figure.
reMIND
CPLEX
Spreadsheet
Result
Equation editor
Equation solver
Analyzing tool

7
Figure 4. Schematic description of PI model LKAB.
4.1. Mining
The Malmberget mine consists of about 20 ore bodies, of which ten are currently mined. Most of the deposit consists of magnetite ore, but non-magnetic hematite also occurs. About 12 Mt of crude ore is extracted from the ore bodies each year. Mining in Malmberget takes place at several different levels, since there are many ore bodies. The main haulage levels are at 600, 815 and 1000 meters. There are crushers at each level. 12 huge mine trucks, with payload capacities of 70 to 120 tonnes, are operated at these levels. The trucks are driven to vertical shafts. Drivers control loading from inside the cab of the truck. The fully-loaded truck is then driven to a discharge station and the ore is emptied into a crusher bin. The ore is fed into the crusher and crushed into lumps of about 100 mm in diameter. From main level 1000, the crushed ore is hauled by a 1.7-km-long conveyor to a skip shaft at the 815-meter level. From there, the ore is lifted to the surface by two skips. Final transport to the processing plants is via belt conveyor. There is also a crusher and hoisting station at level 600, for ore mined in the Western field, where there is also hematite ore.
4.2. Processing The processing plant at surface level consists of a sorting plant, a concentrating plant and
two pelletizing plants.
Sorting plant The crude ore that has been extracted from the mine enters the sorting plant where the
main task is to separate the ore from the rock and to grind the ore down to smaller fractions. In the sorting plant, both magnetite ore and hematite ore are processed, yet in different sections, four sections handling the magnetite flow and one section handle the hematite flow.
Mine
Concentrating Plant
Sorting Plant
Pelletizing Plant MK3
Pelletizing Plant BUV
Electricity
Fuel
Additives Crude ore
Sorted ore
Iron ore pellet
Slurry
Iron ore pellet
Water
Bi-products

8
Together with the hematite flow, a small amount of magnetite is included, so before further processing, the magnetite needs to be separated from the hematite. This is possible since hematite ore is weakly magnetic and magnetite ore is strongly magnetic, and therefore by magnetic separation it is possible to achieve this. When the hematite and magnetite has been separated from the rock and grounded into smaller fractions the processing continuing in the concentrating plant. The energy use in the sorting plant comes exclusively from electricity.
Concentrating plant The task in the concentrating plant is basically to grind the ore to a fine powder in several
stages and to remove undesirable components by separators. This is done with different kind of separating methods depending on the iron ore type. The magnetite separation is done magnetically and the hematite separation is done by gravitation and electro magnets with a high magnetic flow density. There are several different sections in the concentrating plant, all producing different ore-concentrate depending on the final product. The concentrate created is then mixed with water to form a slurry before pumped to the pelletizing plant. The slurry is dewatered with large filters, and mixed with binders and additives, depending on the type of pellet to be produced. Olivine, quartzite, limestone and dolomite are examples of additives. As for the sorting plant, the energy use in the concentrating plant is exclusively electricity, where the grinders consume approximately 70 % of the total electricity that is used in the concentrating plant. Important reactions to include in the model from the concentrating plant are mass and energy balance.
Pelletizing plant The slurry that comes from the concentrating plant is fed into gigantic drums and rolled
into centimeter sized spheres called green balls. These are then fed into a large so called straight grate furnace. This furnace consists of different zones where the pellets are dried, burned and cooled. The process starts with up-draught drying (UDD), followed by down-draught drying (DDD), a preheating zone (PH), a burning/firing zone (F) and a cooling zone (C). After the cooling zone the pellets has reached a temperature of about 100°C and are then tipped into an underground storage facility.
In the burning zone, magnetite is transformed to hematite through oxidation. This reaction is very energy efficient since the oxidation is exothermic which means that energy is released in the form of heat. The chemical energy produced in the oxidation corresponds to approximately 70 % of the total energy consumption in the pelletizing plants. Besides the energy produced from the oxidation, energy in form of oil and electricity are also used in the pelletizing plant. Oil is used to drift the burners in the firing zone and electricity is used for the fans that handle the huge amount of air that is needed in the process. Since the pelletizing plant is the most complex process regarding energy use it is important to do a thorough analysis of the mass and energy balance before using this in the model.
5. Discussion Since the European Union in January 2005 started their work with Emission Allowance
Unit the prices on coal and oil has increased compared to the world market price. To decrease the emissions from the processes at LKAB an investigation is of interest to study the possibilities of alternative fuels, which will lead to decreased emissions.

9
LKAB believes that the use of a process integration tool will be helpful in their work of making their processes more efficient and also a tool where different scenarios can be modelled and used as a reference for future investments. With the process integration method it is possible to define different objective fore the same model, the objectives that mainly will be analyzed are minimization of the specific energy use and CO2 emissions.
The model core is an overall mass and energy balance for the production chain and separate sub-balances for the main processes which make it possible to perform a total analysis for the iron ore plant and to asses the effect of a change in the operation practice for the different processes. The standard way of operation in the iron ore plant is possible to change integrating new process equipment or materials and defining the interplay with the total system. The driving force for the model is the production of the final product of the system, i.e. iron ore pellet.
This work will concentrate on the development of a mathematical programming tool, which can be used by industry in investigations regarding energy and environmental aspects in the iron ore process system. The mathematical model will be based on a mass and energy balance for the facility specified for the different unit operations, therefore is it important to do a thorough mass and energy balance in each unit, i.e. mine, sorting plant, concentrating plant and pelletizing plant. These studies are at this time in progress, and in the near future this data will be implemented into the model.
6. Acknowledgments We are grateful to Centre for Process Integration in Steelmaking (PRISMA). Centre for
Process Integration in Steelmaking is an Institute Excellence Centre (IEC) supported by the Swedish Agency for Innovation Systems, the Knowledge Foundation, the Foundation for Strategic Research, industrial participants Luossavaara-Kiirunavaara AB, SSAB Tunnplåt AB and Rautaruukki Oyj, and academic partner Luleå University of Technology.
7. Contributors Samuel Nordgren works as a Ph.D. student at the division of energy engineering at Luleå University of Technology located in the north of Sweden. He obtained his M.Sc. degree in Engineering Physics from the same university in 2007. 80 % of his working time is located at the newly started Institute Excellence Centre PRISMA, Centre for Process Integration in Steelmaking, this centre is located at MEFOS, Metallurgical Research Institute AB in Luleå, Sweden. His research interest is in the area of process integration. Jan Dahl works as a professor at the division of Energy Engineering at Luleå University of Technology. Mikael Larsson works as a senior researcher at MEFOS, Metallurgical Research Institute AB. Bo Lindblom works as a senior metallurgist at the division of Research and Development at LKAB. Stefan Savonen. Manager at the division of Energy and Environment at LKAB Kent Tano. Manager at the division of Process Technology at LKAB.

10
8. References [1] M.M. Costa, R. Schaeffer, E. Worrell. Exergy accounting of energy and materials flows in steel production systems. Energy, the international journal 4 26 PP. 363-384. (2001) [2] ILOG CPLEX Linear programming software, version 8.0. ILOG CPLEX. Incline Village, NV, USA. (2002) [3] L.A Greening, S Bernow. Design of coordinated energy and environmental policies – use of multi-criterion decision-making. Energy policy, 32, 721-735. (2004) [4] J. Andersson, A survey of multi-objective optimization in engineering design, Technical report LiTH-IKP-R-1097. Linköping Institute of Technology, Linköping, Sweden. (2000) [5] M. Larsson, Reduction of the specific energy use in an integrated steel plant – The effect of an optimization model, ISIJ International. Vol. 43:10, 1664-1673. (2003) [6] C. Ryman, M. Larsson, T. Niemi, C-E. Grip. Modeling of the blast furnace process with a view to optimize the steel plant energy system, proc. 2nd International Conference on New Development in Metallurgical Process Technology, 19-21 September, Riva del Garda, Italy (2004) [7] M. Larsson, P. Sandberg, J. Dahl, M. Söderström, H. Vourinen. System gains from widening the system boundaries: analysis of the material and energy balance during renovation of a coke oven battery. Int.J.Energy Res. Vol 28: 1051-1064. (2004) [8] M. Larsson, C-E. Grip, H. Ohlsson, S. Ruthqvist, J-O. Wikström, S. Ångström. Comprehensive study regarding greenhouse gas emission from iron ore based production at the integrated steel plant SSAB Tunnplåt AB. Proc, SCANMET II, 2nd International conference on process development in iron and steel making. Luleå, Sweden. (2004)

Paper B


Process integration in an iron ore upgrading process system – Analysis of mass and energy flows within a straight grate
induration furnace
S Nordgren1, 2*, J Dahl1, C Wang2, B Lindblom3
1 Division of Energy Engineering, Luleå University of Technology,
971 87 Luleå, Sweden 2 PRISMA – Centre for Process Integration in Steelmaking
MEFOS – Metallurgical Research Institute AB, 971 25 Luleå, Sweden 3 LKAB, 971 28 Luleå, Sweden
AbstractThis paper is a part of a project which aim is to develop a process integration model for
the Swedish iron ore company LKAB’s production system in Malmberget. Within the facility, there are two pelletising plants which were started up 1973 and 2006, respectively. Both pelletising plants are using the straight grate induration furnace, and they are the most energy intense process units within the facility. Basically a straight grate induration furnace consists of three different zones, i.e. a drying zone, a firing zone and a cooling zone, and their purpose is to upgrade crude iron ore to the final product of iron ore pellet. As an initial step of the project, the mass and energy flows within a straight grate induration furnace have been analysed. The outcome of the analysis will in the future constitute as a basis towards a total mass and energy balance for the whole production chain within the facility in Malmberget. Later on the model will be used to optimize, primarily, energy consumption and environmental impact.
1 Introduction LKAB is an international high-tech minerals group, one of the world’s leading producers
of upgraded iron ore products for the steel industry and a growing supplier of industrial minerals products to other sectors. Most of the iron ore products are sold to European steel mills. Other important markets are North Africa, the Middle East and Southeast Asia. Industrial minerals are sold mainly in Europe. LKAB has more than 3,700 employees, of which more than 600 outside Sweden. There are iron ore mines, processing plants and ore harbours in northern Sweden and Norway, sales office in Belgium, Germany and Singapore.
LKAB is one of Sweden’s largest electricity consumers and accounts for more than 1% of the country’s total electricity consumption. When the planned investments in increased production have been realized, by about 2009, LKAB’s electricity consumption will have risen to nearly 1.5% of total national consumption [1]. With regard to costs, process technology and climate impact, the energy issue is strategically important for LKAB. In the iron ore operation, vast amounts of electricity are used, mainly in mine operation and mineral processing. In the next year, annual consumption of electricity will have increased from about 1.7 to more than 2 terawatt hours [1]. In recent years, increased attention has been given by the iron ore industry to use energy more efficient. The iron ore industry is one of energy-
* Corresponding author, Tel: +46 920 492020; FAX: +46 920 491047, E-mail address: [email protected]
1

intense industries, with high CO2 emissions. Improvement of the energy efficiency, to reduce the energy consumption, will increase the economic profitability as well as reducing the environmental impacts. With increasing concerns of climate change issues, more efforts are made by the iron ore industry to reduce its CO2 emissions.
An important goal for the Swedish iron ore company LKAB, as for the whole process industry, is to minimize the environmental impact and the energy consumption. LKAB in Malmberget consists of a number of different operation units. Process integration is the name for a number of different methods to systematically analyse industrial production systems. For example, process integration can be used to optimize the use of raw material or energy consumption, to minimize emissions or optimize the quality of the final product. Among the methods there are experience based methods, as well as mathematical programming and analysis with the help of physical relations and properties. The advantage by using process integration is that the whole industrial production system could be included into your model, by doing that you can avoid the negative effects that sub optimization can result in i.e. optimization of a single process unit does not necessary lead to an improvement of the whole production system. Analysing the material and energy flows within the straight grate induration furnace can increase the knowledge to better understand the potential of how to operate the induration furnace in a more energy efficient way. It is also an important step towards the future, where the main task of the project is to develop a process integration model which aims to optimize energy consumption and environmental impact of the whole production system. To be able to do that, a thorough analysis of the material and energy flows within the induration furnace is essential, since this, together with the older induration furnace, is the most complex process which transforms huge amounts of energy within the production facility in Malmberget.
The produced iron ore pellet from the facility in Malmberget is mainly used for steel production at the SSAB steel plant in Luleå. During the last years, several studies have been carried out at the SSAB steel plant in the area of process integration, mainly using the methodology of mathematical programming [2-4]. The idea of developing a process integration tool for the iron ore industry is based on these models. As an initial step towards a total system analysis, this paper aims to analyse the mass and energy flows within the straight grate induration furnace, MK3. The main processes in LKAB’s production facility are shown in Figure 1.
Figure 1: Main processes at the production facility in Malmberget [LKAB.com]
2

2 Method The data that has been collected and used in this paper comes mainly from LKAB’s
internal database. From the database, important parameters such as, temperatures of different gas flows, oil consumption, production rate and flow rates of different gas streams have been collected. This has been a valuable help in the work of analysing the material and energy flows within the induration furnace. Additional information, regarding parameters that haven’t been able to obtain from the internal data base, has been given by process engineers working at the plant.
The straight grate induration furnace has been divided into four different zones, where a
mass and energy balance has been calculated for each zone. If the whole induration furnace would be considered as one zone, the huge amount of internal air and gas streams would not be included in the mass and energy calculations. The energy balance for each of the different zones within the induration furnace includes five different kinds of energy carriers which have been calculated separately.
Energy content in internal air/gas streams and exhaust gas Thermal energy in pellet Chemical energy (Oxidation of magnetite and calcination) Oil Drying of green pellet
In the energy related calculations, a program called HSC Chemistry [5] has been used.
HSC Chemistry is a PC-based system that solves chemical reaction and equilibrium problems by using data from various thermodynamic and electrochemical databases. HSC provides an add-in function which makes it possible to use the HSC database directly under MS Excel and in that way carry out several thermochemical calculations. For example, by knowing the temperature, composition and flow rate of an air/gas or exhaust gas stream makes it possible to use the add-in function to calculate the enthalpy of a specific stream. This program has been a helpful tool when calculating the thermal energy in the pellet as they entering/leaving the different zones. As mentioned earlier, this program has also been used to calculate the energy content in the internal air and gas streams as well as the energy content in the exhaust gas leaving the system. The calculations regarding the material flow are basically considering three different material transformations.
Water vaporization Magnetite oxidation Decomposition of limestone
In the two drying zones, the water content in the green pellet is vaporized and follows the
excess air out through a chimney. In the firing zone, magnetite is transformed into hematite in an exothermal reaction and the limestone is transformed into carbon dioxide and calcium oxide. These are the reactions of which the material balance is based on.
Later on in this project, a mathematical programming technique called the MIND-method will be used. This is a method where the system is mathematically described and represented by a matrix of equations. The equation editor that will be used in the model design is called reMIND which provides a graphical interface by describing the relations between the sub-process units. The model is represented by nodes and branches where the branches represent energy or material flows and a node may represent a process unit as well as a production line
3

or a whole factory. Figure 2 shows a schematic description of a simplified model based on reMIND.
Production demand node
Process nodes Energy supply nodes
Energy flow
Material flow
Material supply nodes
1
2
3 4
5 6
7 8
9
Figure 2: Schematic description of a model based on reMIND
Each process node has its own energy demand in the form of electricity and/or heat demand. These demands depends on the amount of material processed in the unit and may be described by linear or piecewise linear relations. To describe variations in the system, boundary conditions are used. Boundary conditions could for example be a limitation of the capacity in a specific process unit, limited availability of different resources such as, fuels or raw material.
3 Malmberget Pelletising Plants The pelletising plant is the final step in LKAB’s production chain where the aim is to
produce iron ore pellet. At the facility in Malmberget there are today two pelletising plants. The first plant (BUV) was started up in the early 70’s. The request for iron ore pellet has increased in recent years, so in November 2004, LKAB took the decision to build a second pelletising plant (MK3) in Malmberget. This pelletising plant was ready for action in October 2006. The pelletising plant consists of a number of different operation units, where the main unit is the straight grate induration furnace. Both plants are constructed more or less in the same way. The main difference between the two pelletising induration furnaces is that the newest induration furnace has an additional exhaust gas fan connected to the hot part of the furnace, and there are also a waste heat boiler installed in the newer induration furnace. Figure 3 shows a schematic description of the newest pelletising induration furnace, MK3.
4

Figure 3. Schematic figure of the Malmberget Pelletising Plant, MK3 As the picture shows, the pelletising plant is divided into different zones where the main
task is to dry, fire and cool the iron ore pellets. The direction of the flow of ambient air, gas streams and exhaust gas is marked with arrows in Figure 3. The name and purpose of the different zones are described in Table 1.
Table 1. Description of the different zones within the induration furnace UDD – Up-draught-drying DDD – Down-draught-drying PH – Pre-heating F – Firing AFI – After-firing I AFII – After-firing II CI – Cooling I CII – Cooling II
3.1 Material considerations Before the iron ore, in the form of green pellet is entering the straight grate induration
furnace, it has been processed in different stages. In the sorting-plant, the crude ore that has been extracted from the mine is separated from gangue and crushed down to smaller fractions. Further on the crushed iron ore is entering the concentrating plant. The purpose here is to crush the iron ore down to even smaller fractions. Additives, such as olivine, limestone, quartzite, bentonite and water is added to form a slurry that later on will be rolled into centimetre sized spheres, these spheres, or green pellet, is then loaded onto a 90 meter long travelling grate and form a packed bed. The temperature of the green pellet entering the
5

moving grate is approximately 30°C. Hot gas is blown through the bed to dry and fire the pellet up to about 1300°C, and then ambient air cools the pellet down to about 100°C. Table 2 shows the approximate recipe for the ingoing green pellet entering the pelletising induration furnace.
Table 2. Recipe of the ingoing green pellet Component Wt % Magnetite 81.3 Hematite 8.1 Water 7.4 Limestone 0.5 Others 2.7 Total: 100
During the pelletising process a number of chemical reactions take place. The most important reaction is the oxidation where magnetite is transformed to hematite in an exothermal reaction i.e. energy is released in the form of heat. The other reaction is the calcination where limestone is transformed into calcium oxide (CaO) and carbon dioxide (CO2). This is an endothermal reaction which means that energy is needed to push the reaction forward. Equation 1 shows the exothermal reaction when magnetite oxidizes to hematite. Equation 2 shows the endothermal reaction when limestone is transformed into calcium oxide and carbon dioxide
32243 64 OFeOOFe H < 0 (Eq. 1)
23 COCaOCaCO H > 0 (Eq. 2)
These chemical reactions, together with the vaporized water during the drying process, are the only material changes considered in this work.
3.2 Energy considerations With regards to mass and energy flow, the MK3 pelletising induration furnace is a highly
complex process unit. This is mainly because of the huge amount of internal gas and air flows which are used in the process. A primary up-draught stream of ambient air passes the pellet bed in the first phase of the cooling zone (CI). This stream is then distributed and pulled down-draught through the bed in the AFI, F and PH-zones; some of this gas is recuperated and used either in the up-draught drying zone (UDD) or in the down-draught drying zone (DDD). The secondary gas stream that passes up-draught through the second phase of the cooling (CII) is used either in the first or in the second phase of drying (UDD/DDD). When the primary gas stream leaves the first cooling zone it has a temperature of approximately 900°C. This stream, together with the heat from the oil-burners inside the pre-heating and firing-zone, is firing the pellets to a temperature of about 1300°C. The temperature of the gas leaving the PH, F and AF-zones is normally lower than 400°C. A part of this gas stream is then used, together with the off-gas stream from the second cooling phase, to dry the pellet in the drying zone. If the temperature of the gas stream that is used to dry the pellet is too high, the pellet can disintegrate by the pressure generated by the steam as the pellet dry at too fast [6]. There are three exhaust gas fans that are handling the huge amount of off gases that has been generated from the process. To each of these exhaust gas fans there are connected a dust cleaning unit, there is also a sulphur-cleaning unit connected to the exhaust gas fan that is
6

handling the off-gas stream from the firing-zone. The hot process gases from the second cooling zone are not used entirely for the up-draught drying process, a heat exchanger is installed to use a part of the off gases for heating of boiler water.
The predominant iron mineral in LKAB’s mines is magnetite ( ), which has the
advantage that energy is liberated during the upgrading process. In comparison with hematite ore ( ), approximately 60% of the thermal energy needed during pellet manufacture comes from oxidation, which reduces the need for external fuel. Most of the pellet producers around the world use hematite ore, which leads to a significantly higher input of energy in the upgrading process, approximately 15 litres of oil per tonne of final product. By comparison, LKAB’s pellet plant in Malmberget uses only 5 litres of oil per tonne pellets [1].
43OFe
32OFe
4 Zone classification – Energy and mass balance The two pelletising plants are, by far, the most complex units within the facility in
Malmberget. Therefore it is important to make a thorough analysis of the mass and energy flows before adding these data into the process integration model. Because of the complexity of the pelletising plant, a mass and energy balance are made for each of the different zones, instead of an overall mass and energy balance for the whole plant. However, some small changes are made, regarding how to divide the zones when calculating the mass and energy balance. In this case, it was decided to divide the pelletising induration furnace into zones which corresponds to the individual flows of the air and exhaust gas. The pelletising induration furnace is therefore divided into four different zones where a mass and energy balance has been carried out for each zone. These zones are showed in Figure 3, where the boundary of each zone is marked with a vertical line. In the following chapter, a description of the material and energy flows, as well as the result of the analysis of the energy flows in each of the different zones is described. The figures of the different energy carriers in the following tables are shown as percentage of the total energy use in each zone instead of the actual magnitude of the energy content.
4.1 UDD – Zone The material, in the form of green pellet, which are entering the UDD-zone holds a
temperature of approximately 30°C, this means that the thermal energy in the iron ore pellet more or less can be neglected. The main energy contribution in the UDD-zone comes from the hot gas flow which is blown through the pellet bed in an up-draught direction. This flow comes from the second part of the cooling zone and holds a temperature of approximately 300°C. The gas flow is blown to the UDD-zone via a process fan. The reason why the first drying zone is of up-draught type, is because the lower part of the hearth layer must be strong enough to hold the weight of the pellet bed, also the force exerted by the pressure drop generated to pull the gas through the bed and the recondensation of moisture from the gas stream as it goes further into the bed contributes to the reason why the first drying zone is of up-draught type [7]. If the temperature of the hot gas which is blown through the pellet bed is too high, the pellet may disintegrate because of the pressure generated by steam as they dry to fast. A part of the water in the green pellet is vaporized in the UDD-zone. The vaporized water, together with excess air, is blown via an exhaust gas fan and out through a chimney. The temperature of the exhaust gas is approximately 90°C. Most of the added energy in the UDD-zone is consumed during the drying of the green pellet. The sources which contribute to the energy balance in the UDD-zone are shown in Table 3
7
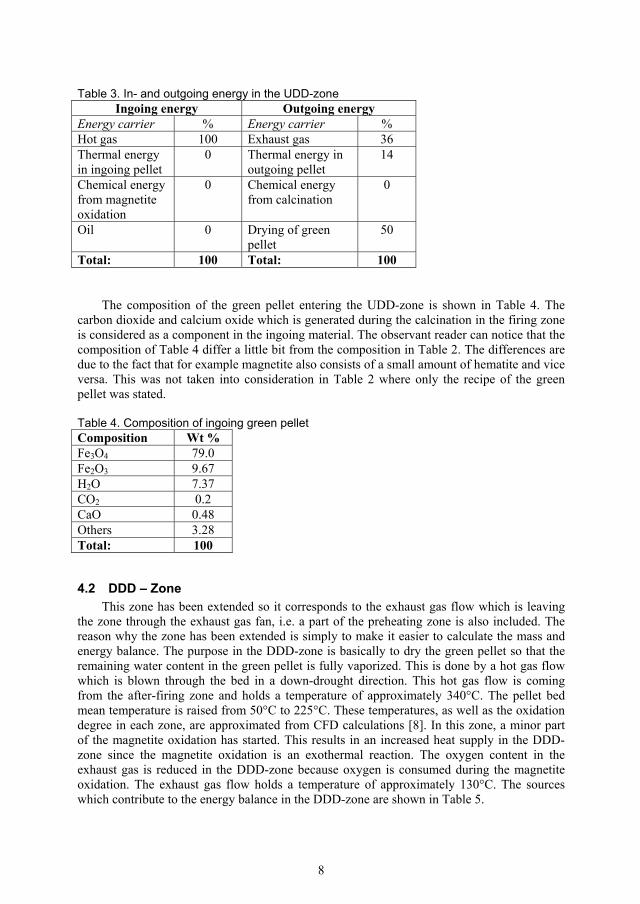
Table 3. In- and outgoing energy in the UDD-zone Ingoing energy Outgoing energy
Energy carrier % Energy carrier % Hot gas 100 Exhaust gas 36 Thermal energy in ingoing pellet
0 Thermal energy in outgoing pellet
14
Chemical energy from magnetite oxidation
0 Chemical energy from calcination
0
Oil 0 Drying of green pellet
50
Total: 100 Total: 100
The composition of the green pellet entering the UDD-zone is shown in Table 4. The
carbon dioxide and calcium oxide which is generated during the calcination in the firing zone is considered as a component in the ingoing material. The observant reader can notice that the composition of Table 4 differ a little bit from the composition in Table 2. The differences are due to the fact that for example magnetite also consists of a small amount of hematite and vice versa. This was not taken into consideration in Table 2 where only the recipe of the green pellet was stated.
Table 4. Composition of ingoing green pellet Composition Wt % Fe3O4 79.0 Fe2O3 9.67 H2O 7.37 CO2 0.2 CaO 0.48 Others 3.28 Total: 100
4.2 DDD – Zone This zone has been extended so it corresponds to the exhaust gas flow which is leaving
the zone through the exhaust gas fan, i.e. a part of the preheating zone is also included. The reason why the zone has been extended is simply to make it easier to calculate the mass and energy balance. The purpose in the DDD-zone is basically to dry the green pellet so that the remaining water content in the green pellet is fully vaporized. This is done by a hot gas flow which is blown through the bed in a down-drought direction. This hot gas flow is coming from the after-firing zone and holds a temperature of approximately 340°C. The pellet bed mean temperature is raised from 50°C to 225°C. These temperatures, as well as the oxidation degree in each zone, are approximated from CFD calculations [8]. In this zone, a minor part of the magnetite oxidation has started. This results in an increased heat supply in the DDD-zone since the magnetite oxidation is an exothermal reaction. The oxygen content in the exhaust gas is reduced in the DDD-zone because oxygen is consumed during the magnetite oxidation. The exhaust gas flow holds a temperature of approximately 130°C. The sources which contribute to the energy balance in the DDD-zone are shown in Table 5.
8
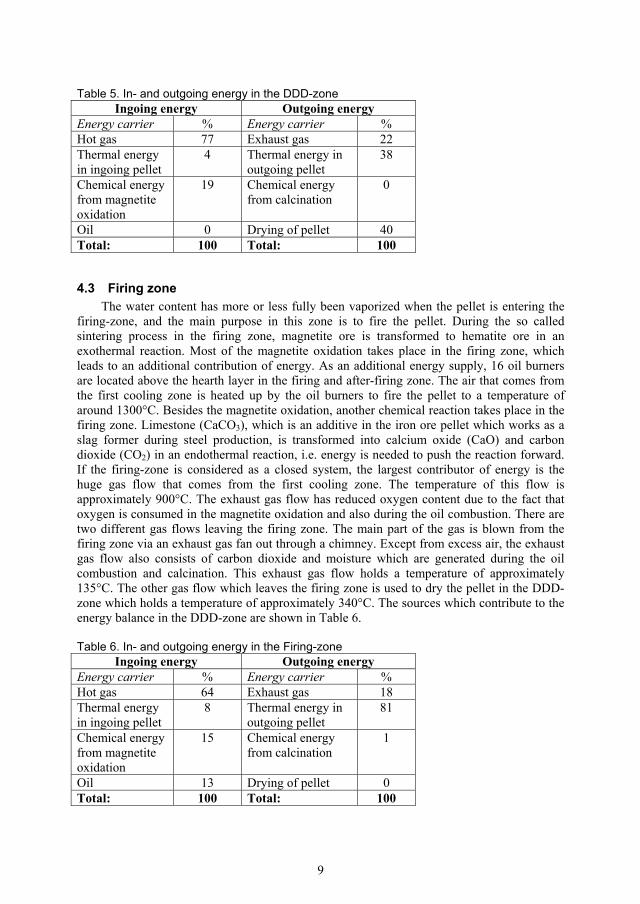
Table 5. In- and outgoing energy in the DDD-zone Ingoing energy Outgoing energy
Energy carrier % Energy carrier % Hot gas 77 Exhaust gas 22 Thermal energy in ingoing pellet
4 Thermal energy in outgoing pellet
38
Chemical energy from magnetite oxidation
19 Chemical energy from calcination
0
Oil 0 Drying of pellet 40 Total: 100 Total: 100
4.3 Firing zone The water content has more or less fully been vaporized when the pellet is entering the
firing-zone, and the main purpose in this zone is to fire the pellet. During the so called sintering process in the firing zone, magnetite ore is transformed to hematite ore in an exothermal reaction. Most of the magnetite oxidation takes place in the firing zone, which leads to an additional contribution of energy. As an additional energy supply, 16 oil burners are located above the hearth layer in the firing and after-firing zone. The air that comes from the first cooling zone is heated up by the oil burners to fire the pellet to a temperature of around 1300°C. Besides the magnetite oxidation, another chemical reaction takes place in the firing zone. Limestone (CaCO3), which is an additive in the iron ore pellet which works as a slag former during steel production, is transformed into calcium oxide (CaO) and carbon dioxide (CO2) in an endothermal reaction, i.e. energy is needed to push the reaction forward. If the firing-zone is considered as a closed system, the largest contributor of energy is the huge gas flow that comes from the first cooling zone. The temperature of this flow is approximately 900°C. The exhaust gas flow has reduced oxygen content due to the fact that oxygen is consumed in the magnetite oxidation and also during the oil combustion. There are two different gas flows leaving the firing zone. The main part of the gas is blown from the firing zone via an exhaust gas fan out through a chimney. Except from excess air, the exhaust gas flow also consists of carbon dioxide and moisture which are generated during the oil combustion and calcination. This exhaust gas flow holds a temperature of approximately 135°C. The other gas flow which leaves the firing zone is used to dry the pellet in the DDD-zone which holds a temperature of approximately 340°C. The sources which contribute to the energy balance in the DDD-zone are shown in Table 6.
Table 6. In- and outgoing energy in the Firing-zone
Ingoing energy Outgoing energy Energy carrier % Energy carrier % Hot gas 64 Exhaust gas 18 Thermal energy in ingoing pellet
8 Thermal energy in outgoing pellet
81
Chemical energy from magnetite oxidation
15 Chemical energy from calcination
1
Oil 13 Drying of pellet 0 Total: 100 Total: 100
9

4.4 Cooling zone The hot pellet coming from the firing-zone is in this zone cooled down to approximately
100°C. This is done by ambient air which is blown through the bed in an up-draught direction. The cooling process requires a huge amount of ambient air which later on will be distributed and used as a heat carrier in different parts of the pelletising process. The energy supply from the ambient air is neglected due to the low temperature. The main part of the air is forced, by process fans, into the firing zone to fire the pellet together with additional energy from the oil burners. A secondary gas flow is used in the UDD-zone. A part of the secondary gas flow is also used in a heat boiler to heat up water. This so called economiser consists of two circuits, the hot air circuit and the boiler water circuit. When hot process gases of approximately 315°C are passing through the economiser, the incoming (recirculated) boiler water having a temperature of about 90°C gets heated to approximately 110°C. The off gas flow after the economizer has a temperature of approximately 160°C, and this flow is directed to the exhaust fan that is connected to the down-draught drying zone. The magnetite is not fully oxidized to hematite in the firing-zone, meaning that the pellet entering the cooling zone consists of a small amount of magnetite. This leads to an additional energy supply from magnetite oxidation in the cooling-zone. The sources which contribute to the energy balance in the cooling-zone are shown in Table 7.
Table 7. In- and outgoing energy in the Cooling-zone
Ingoing energy Outgoing energy Energy carrier % Energy carrier % Hot gas 0 Exhaust gas 97 Thermal energy in ingoing pellet
95 Thermal energy in outgoing pellet
3
Chemical energy from magnetite oxidation
5 Chemical energy from calcination
0
Oil 0 Drying of pellet 0 Total: 100 Total: 100
The composition of the outgoing iron ore pellet, only considering materials which has been transformed during oxidation or decomposition, is shown in Table 8.
Table 8. Composition of outgoing iron ore pellet Composition Wt % Fe3O4 1.6 Fe2O3 94.45 CaO 0.51 Others 3.44 Total: 100
5 Concluding remarks LKAB’s use of fossil fuels and carbon-based additives results in emissions of the
greenhouse gas carbon dioxide (CO2). In the pelletising plant, most of the CO2-emission is generated from the oil combustion and from the decomposition of limestone. However, it is important to emphasize the great environmental advantages implicit in LKAB’s production processes, both with respect to energy consumption and environmental impact.
10

The aim of this paper was to analyse the different material and energy flows within a straight grate induration furnace. In this work, one of the straight grate induration furnaces at LKAB’s production facilities in Malmberget has been studied. This is an initial step towards a complete analysis, regarding material and energy flows, of LKAB’s whole production system. This analysis will in the future constitute as a basis towards the development of a process integration model that will be used to optimize, primarily, energy consumption and environmental impact. The reason why it is important to divide the furnace into different zones, where a mass and energy balance has been carried out for each zone, is because of the huge amount of internal air and gas streams that are circulating inside the furnace. If the furnace would have been considered as one zone, these huge air and gas streams would have been excluded from the energy balance. It is also provide an increased knowledge of the behaviour of the furnace, which is important for further studies.
From the energy balance calculations some uncertainties in input data has been
identified. For example, the total intake of ambient air is not logged. Therefore this flow was theoretically calculated considering the outgoing flows through the three exhaust fans, the reactions that take place, mainly in the firing zone and the amount of vaporized water. However, the uncertainty by doing this kind of calculation is that air leakages into the furnace not are included in the calculation, which may influence the result of the energy balance in the different zones.
The analysis of the mass and energy flows within one of the straight grate induration
furnaces at LKAB in Malmberget is an initial step towards a total analysis of the production system. Most of the work will be concentrated at the straight grate furnaces since those are the most complex process units within the facility. When the whole system has been analysed, regarding material and energy flows, it will be implemented into the process integration model. The model core is an overall mass and energy balance for the production chain and separate sub-balances for the main processes, which make it possible to perform a total analysis for the plant and to asses the effect of a change in the operation practice for the different processes. It’s possible to change the standard way of operating the plant by integrating new process equipment or materials and defining the interplay with the total system. The driving force for the model is the production of the final product of the system, i.e. iron ore pellet. Additional measurements regarding the intake of ambient air, has a high priority to be able to make the mass and energy balance in the straight grate furnace as thorough as possible. Further on, the magnitude of the air which leaks in the furnace should be investigated.
Another methodology in the area of process integration, namely pinch analysis, can be
applied for future work. Pinch analysis is a methodology for minimizing energy consumption of chemical processes by calculating thermodynamically feasible energy targets and achieving them by optimizing heat recovery systems, energy supply methods and process operating conditions. The process data is represented as a set of energy flows, or streams, as a function of heat load against temperature. This data is combined for all the streams in the plant to give so called composite curves, one for all ‘hot streams’ (releasing heat) and one for all ‘cold streams’ (requiring heat). The point of closest approach between the hot and cold composite curves is the pinch temperature (or just pinch), and is where design is most constrained. The straight grate induration furnace can be considered as a huge heat exchanger, with a number of different ´hot streams´ and ´cold streams´, therefore pinch analysis can be a suitable choice for future optimization work.
11

6 Acknowledgements We are grateful to Centre for Process Integration in Steelmaking (PRISMA). Centre for
Process Integration in Steelmaking is an Institute Excellence Centre (IEC) supported by the Swedish Agency for Innovation Systems, the Knowledge Foundation, the Foundation for Strategic Research, industrial participants LKAB, SSAB Tunnplåt AB and Rautaruukki Oyj, and academic partner Luleå University of Technology. The authors would also like to thank Kent Tano and Stefan Savonen, LKAB, for valuable discussions, and Håkan Emlén and Kristina Andersson, LKAB, for excellent help with process description and data collection. References [1] http://www.lkab.com (April, 2008) [2] Ryman C, Larsson M, Niemi T,Grip C-E. Modelling of the blast furnace process with a view to optimize the steel plant energy system, proc. 2nd International Conference on New Development in Metallurgical Process Technology, 19-21 September, Riva del Garda, Italy (2004) [3] Larsson M, Sandberg P, Dahl J, Söderström M, Vourinen H. System gains from widening the system boundaries: analysis of the material and energy balance during renovation of a coke oven battery. Int.J.Energy Res. Vol 28: 1051-1064. (2004) [4] Larsson M, Grip C-E, Ohlsson H, Ruthqvist S, Wikström J-O, Ångström S. Comprehensive study regarding greenhouse gas emission from iron ore based production at the integrated steel plant SSAB Tunnplåt AB. Proc, SCANMET II, 2nd International conference on process development in iron and steel making. Luleå, Sweden. (2004) [5] HSC Chemistry. Simulation and modelling software, version 6.0. Outotec oyj, Espoo Finland. [6] Fine A, Geiger G. Handbook on energy and material balance calculations in metallurgical processes. ISBN: 0-89520-360-X. (1979) [7] Cross M, Blot P. Optimizing the operation of straight grate iron-ore pellet induration system using process models. Metallurgical and Material Transactions, vol B. 803-813 (1999) [8] Lundqvist M, Sjöström U. Personal communication. MEFOS - Metallurgical Research Institute. (April, 2008)
12

Paper C


Green pellet temperature influence of production rate and fuel consumption within a straight grate induration furnace
Samuel Nordgren1), Bo Lindblom2), Jan Dahl1)
1) Div. of Energy Engineering, Luleå university of Technology, Luleå [email protected], [email protected]
2) Technology and Business Development, LKAB, Luleå, [email protected]
The two straight grate induration furnaces at the LKAB production site in Malmberget are the two most energy intensive production units within the facility. Among other things, the green pellet temperature plays an important role for the efficiency of the induration furnaces. A study has been carried out analysing how the green pellet temperature influences the behaviour of the induration furnace, more specifically the production rate and specific oil consumption within the MK3 induration furnace. Analysing the data from the MK3 induration furnace shows that a higher temperature of the green pellet results in a higher production rate and also a reduction of the specific oil consumption.
Keywords: Green pellet temperature, production rate, specific oil consumption, induration, straight grate process
IntroductionLKAB is one of Sweden’s largest electricity consumers and accounts for almost 1.5 % of
the country’s total electricity consumption [1]. In the iron ore operation, vast amounts of electricity are used, mainly in mine operation and mineral processing. With increasing concerns for climate change issues, more efforts are being made by the iron ore industry to reduce its CO2 emissions. The aim of this study is to better understand how the green pellet temperature influences the behaviour of the straight grate induration furnace, MK3, more specifically how the green pellet temperature influences the production rate and oil consumption.
The green pellet temperature tends to be an important parameter regarding the efficiency of the straight grate induration furnace. It is believed that an increased green pellet temperature will increase the productivity and the durability of the pellet and also decrease the specific energy consumption [2]. Within the straight grate induration furnace, many parameters will be affected by a higher green pellet temperature, which in turn will lead to the above-mentioned improvements. Initial results from an experimental study are indicating that the durability of the pellet may be improved by a higher green pellet temperature, with less deformed pellets and a higher proportion of solid pellets as a result
In the late 1990s, a project was carried out with the aim to investigate how the green pellet temperature influenced the behaviour in the straight grate induration furnace BUV [3], with regard to production rate and specific oil consumption. The outcome of the study showed that if the temperature was increased by one degree centigrade, the production rate increased by approximately 5 t/h and the specific oil consumption decreased by around 0.14 l/t. The data collected for the analysis was from 1999. The main difference between the study from 1999 and this study, besides that the analysis were carried out on different induration furnaces, is the number of analysed cases. In 1999, a one case study was performed based on production data over a whole year, whilst this work is studying 34 different cases based on a 3-month period.
1

LKAB - Malmberget The LKAB facility in Malmberget consists of several upgrading units. The Malmberget
mine consists of about 20 ore bodies, of which around ten are currently being mined. The extracted iron ore is transported to the sorting plant where the main task is to separate the iron ore from the gangue and crush the iron ore down to smaller particles. The next step in the process chain is the concentrating plant where the ore is ground to a fine powder, undesirable components are removed by separators, water, different kinds of additives and binders are added to the concentrate before pumping it to the pelletizing plants. Figure 2 shows the main processes at the production facility in Malmberget.
Figure 2. Main processes at the production facility in Malmberget [lkab.com]
There are two straight grate induration furnaces located at the LKAB facility in Malmberget. The first plant (BUV) started up in the early 1970s, while the newer plant (MK3) started up in 2006. The two plants are more or less constructed in the same way, the main differences being that an additional exhaust gas fan is connected to the MK3 induration furnace. A waste heat boiler was also installed in the MK3 furnace in order to recover some of the excess heat generated from the induration furnace. The pelletizing process upgrades the so called green pellet to the final product of iron ore pellet. Figure 3 shows a schematic picture of the MK3 induration furnace.
2

Figure 3. Schematic picture of the MK3 induration furnace
The MK3 furnace is divided into different zones where the main purpose is to dry, fire and finally cool the pellet. The name and purpose of each zone is described in table 1
Table 1. Description of the different zones within the MK3 induration furnace Process zone Number of
wind boxes Temperature
hood (°C) Temperature
wind box (°C) Purpose
Up Draught Drying [UDD]
1-2 ~50 ~300 Drying
Down Draught Drying [DDD]
3-5 ~320 200 – 130 Drying
Pre-heating [PH] 6-9 520 – 1220 110 – 90 HeatingFiring [F] 10-15 ~1300 100 – 460 Sintering/
Calcination After-firing [AF] 16-18 ~1300 450 – 520 HeatingCooling I [CI] 19-27 ~900 Ambient air CoolingCooling II [CII] 28-30 ~300 Ambient air Cooling
The green pellet first enters the UDD zone, where hot gas, originating from the second cooling zone, dries the pellet bed and is blown through the bed in an up-draught direction. Furthermore, in the DDD zone, the drying medium, also in the form of hot gas but this time originating from the after firing zone, is blown through the bed in a down-draft direction. The water content in the pellet has more or less fully been vaporised in the two drying zones when the pellets enter the firing zone. Hot gas from the first cooling zone is heated up by 16 oil burners located above the pellet bed. During the so called sintering process, the magnetite ( ) is transformed into hematite ( ), this exothermal reaction leads to a huge 43OFe 32OFe
3
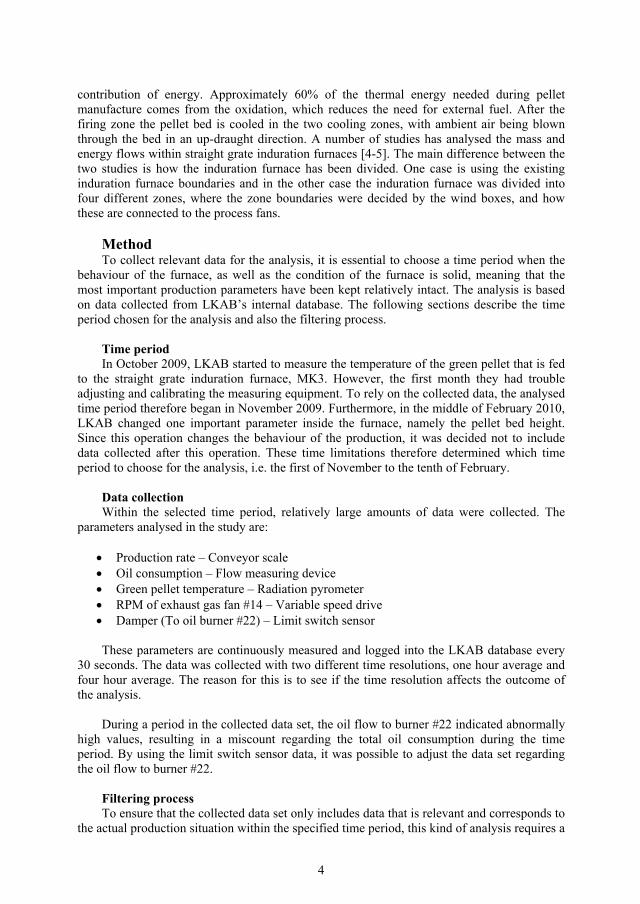
contribution of energy. Approximately 60% of the thermal energy needed during pellet manufacture comes from the oxidation, which reduces the need for external fuel. After the firing zone the pellet bed is cooled in the two cooling zones, with ambient air being blown through the bed in an up-draught direction. A number of studies has analysed the mass and energy flows within straight grate induration furnaces [4-5]. The main difference between the two studies is how the induration furnace has been divided. One case is using the existing induration furnace boundaries and in the other case the induration furnace was divided into four different zones, where the zone boundaries were decided by the wind boxes, and how these are connected to the process fans.
MethodTo collect relevant data for the analysis, it is essential to choose a time period when the
behaviour of the furnace, as well as the condition of the furnace is solid, meaning that the most important production parameters have been kept relatively intact. The analysis is based on data collected from LKAB’s internal database. The following sections describe the time period chosen for the analysis and also the filtering process.
Time period In October 2009, LKAB started to measure the temperature of the green pellet that is fed
to the straight grate induration furnace, MK3. However, the first month they had trouble adjusting and calibrating the measuring equipment. To rely on the collected data, the analysed time period therefore began in November 2009. Furthermore, in the middle of February 2010, LKAB changed one important parameter inside the furnace, namely the pellet bed height. Since this operation changes the behaviour of the production, it was decided not to include data collected after this operation. These time limitations therefore determined which time period to choose for the analysis, i.e. the first of November to the tenth of February.
Data collection Within the selected time period, relatively large amounts of data were collected. The
parameters analysed in the study are:
Production rate – Conveyor scale Oil consumption – Flow measuring device Green pellet temperature – Radiation pyrometer RPM of exhaust gas fan #14 – Variable speed drive Damper (To oil burner #22) – Limit switch sensor
These parameters are continuously measured and logged into the LKAB database every 30 seconds. The data was collected with two different time resolutions, one hour average and four hour average. The reason for this is to see if the time resolution affects the outcome of the analysis.
During a period in the collected data set, the oil flow to burner #22 indicated abnormally high values, resulting in a miscount regarding the total oil consumption during the time period. By using the limit switch sensor data, it was possible to adjust the data set regarding the oil flow to burner #22.
Filtering process To ensure that the collected data set only includes data that is relevant and corresponds to
the actual production situation within the specified time period, this kind of analysis requires a
4

thorough filtering process of the data set. For instance, situations where the production was down are not of interest to include in the analysis. The filtering process therefore focused on three filtering parameters. Production rate, RPM of exhaust gas fan #14 and the Damper connected to oil burner #22.
Production rate The production was considered to be the most important parameter regarding the filtering process. Initially, the idea was to exclude data below one, or a few different production rates. The green pellet temperature influence on the production rate and fuel consumption showed to be strongly dependent on which production level was chosen to filter. Therefore, calculations were carried out with 34 different production filtering levels, i.e. <350 t/h, <355 t/h,…, <430 t/h, generating a total of 17 cases with one hour average data and 17 cases with four hour average data. Table 2 shows the number of data corresponding to each filtering level, divided into both one-hour average and four-hour average. Filtering case number 1 shows for example data where production below 350 t/h has been excluded in the analysis. This specific case includes 1827 data points based on one-hour average data and 456 data points based on four-hour average data. Each data point consists of production rate, oil consumption and green pellet temperature.
Table 2. Number of data points of each filtering level, data divided into 1-hour average and 4-hour average
Number of resulting data points Filtering case Production filtering [t/h] 1-hour data 4-hour data
1 <350 1827 4562 <355 1824 4553 <360 1823 4544 <365 1819 4545 <370 1812 4536 <375 1802 4457 <380 1783 4418 <385 1739 4329 <390 1672 41610 <395 1566 38611 <400 1447 35712 <405 1328 32413 <410 1163 28714 <415 963 23415 <420 830 20516 <425 722 17117 <430 553 126
RPM of exhaust gas fan #14 There are three exhaust gas fans installed in the MK3 induration furnace. There are one
hood exhaust gas fan and two wind box exhaust gas fans. The hood fan is located above the pellet bed in the UDD-zone whilst the two wind box fans are located below the pellet bed in the DDD- and Firing-zone. The wind box exhaust gas fan number 14, which is connected to the DDD-zone, is the one of the three with the highest capacity, and also, according to process engineers working at MK3, the most suitable fan to study from an operational point of view, meaning that if the exhaust gas fan number 14 has been operated with a high and stabile capacity, the induration furnace has a high and stable production level. The capacity of
5

exhaust gas fan number 15 is limited by the gas cleaning device which is installed before the process fan, meaning that fan number 15 reaches its maximum capacity before fan number 14. The third exhaust gas fan, number 13, also reaches its maximum capacity before fan number 14. Therefore process fan number 14 is the most suitable fan to study regarding the efficiency of the furnace. Fan number 14 has a maximum capacity of around 1100 RPM. Process engineers working at LKAB suggested that the analysed data set could include data where the RPM of exhaust gas fan number 14 is above 1000 RPM. Data where the RPM of fan number 14 is below 1000 was therefore excluded from the analysis, together with the corresponding data regarding production, green pellet temperature and fuel consumption.
Variations in green pellet temperature The LKAB facility in Malmberget is located north of the Artic Circle, where the seasonal
variation of the outdoor temperature is large. The variation of the outdoor temperature can easily range from -30 C° and below during winter to +20 C° and above during summer. As mentioned in the introduction, reliable measurements of the MK3 green pellet temperature started in November 2009. At this moment, it has therefore not been possible to analyse the MK3 green pellet temperature annually. However, at the other induration furnace, BUV, measuring the pellet temperature has been going on for a longer period of time. To get an indication of how seasonal variations affect the green pellet temperature, the BUV measurement of the green pellet temperature was analysed. Figure 4 shows the annual variation of the green pellet temperature used in The BUV induration furnace.
15
17
19
21
23
25
27
29
31
33
35
Apr-08May-08
Jun-08Jul-08
Aug-08Sep-08
Oct-08Nov-08
Dec-08Jan-09
Feb-09Mar-09
Gre
en p
elle
t tem
pera
ture
[C°]
Figure 4. Seasonal variation of the green pellet temperature
The figure 4 shows that that the outdoor temperature influences the temperature of the green pellet. Besides the effect from out-door temperature, the green pellet temperature is also affected by how the concentrating plant has been operated. If the concentrating plant is operated with a high capacity, this may also result in an increased green pellet temperature.
ResultsThe outcome of the analysis of how the green pellet temperature influences the
production rate and specific fuel consumption is based on 34 different cases. 17 cases are
6

calculated with one hour average data and 17 cases with four hour average data. Each case is based on production data from the chosen time period. Figure 5 shows the basic principle of how one of the 34 cases was analysed. This specific case is based on one hour average data excluding production rates below 385 t/h. Two plots are included in each filtering case; the production rate and the specific oil consumption which are plotted against the green pellet temperature. A trend line has been added to the two plots, where the slope of the trend line gives the production and specific oil consumption change if the green pellet temperature is increased by one degree centigrade. In this specific case, the production rate is increased by almost 4 tons per hour and the specific oil consumption is decreased by 0.075 litres per ton
y = -0,075x + 8,3939
y = 3,936x + 313,6
0
100
200
300
400
500
600
700
15 20 25 30 35
Green pellet temperature [C°]
Pro
duct
ion
[t/h]
2
4
6
8
10
12
14
Spec
ific
oil c
onsu
mpt
ion
[l/t]
Production
Specific oil consumption
Linear (Specific oilconsumption)
Linear (Production)
Figure 5. Plot of how the production rate and specific oil consumption change with the green pellet temperature. This case is based on one hour average data and excluding productions below 385 t/h.
The same procedure as for the case in figure 5 was used in all 34 filtering cases. All 34 cases have then been summed up in figure 6. Showing all the cases and how they are influenced by the green pellet temperature. The values on the y-axis show the slopes from the trend lines which were generated from the 34 different cases i.e. how the production and specific oil consumption change if the green pellet is increased by one degree centigrade.
7

-10123456
1 2 3 4 5 6 7 8 9 1011121314151617Filtering case
Cha
nged
pro
duct
ion
[t/h]
-0,1-0,08-0,06-0,04-0,0200,020,040,06
Cha
nged
spe
cific
oil
cons
umpt
ion
[l/t]
Changed production - Based on four hour average dataChanged production - Based on one hour average dataChanged specific oil consumption - Based on four hour average dataChanged specific oil consumption - Based on one hour average data
Figure 6. Green pellet influence on production and specific oil consumption of all 34 cases. Showing how the production and specific oil consumption change if the green pellet temperature is increased by one degree centigrade.
Figure 6 is illustrating how the green pellet temperature affecting the production and oil consumption from all the 34 cases. Filtering case number 1, where the production was filtered at 350 t/h, meaning that all production below 350 t/h were excluded, shows that the production will increase by around 5 t/h if the green pellet temperature increased one degree centigrade. The corresponding value for the specific oil consumption results in a changed oil consumption by around -0.08 l/t. When the production filtering level increases, the green pellet temperature effect on the production and specific oil consumption reduces. The final filtering case (#17), were production below 430 t/h has been excluded, shows that the effect from an increased green pellet temperature on production and specific oil consumption more or less are negligible. It should be mentioned that at this filtering level, the number of data points are relatively small, which makes the evaluation more uncertain. The difference between the results based on one-hour average data and the four-hour average data are small.
DiscussionThe aim of the study was to analyse how the green pellet temperature influences the
productivity and fuel consumption. Why the productivity and fuel consumption are influenced by the green pellet temperature is due to several factors. The durability of the green pellet is believed to be dependent on its temperature, a higher temperature results in a more uniformly shaped pellet and also in a smaller proportion of deformed pellets. This will improve the heat exchange in the pellet bed since it’s easier for the gas stream to pass the pellet bed. Since the heat exchange in the bed will be improved with a lower pressure drop, this makes it possible to increase the travelling grate speed, or increase the bed height, which will lead to higher productivity. The power input to the process fans is also related to the pressure drop over the bed. A lower pressure drop results in a lower power input to the process fans, since the fans don’t need to work as hard to force the gas streams through the pellet bed.
8

The oil consumption is also influenced by an increased green pellet temperature. During normal production, if the green pellet was increased by one degree centigrade, this result in an additional thermal energy input corresponding to around 400 MJ/h. Theoretically, if the external fuel energy input into the furnace was decreased by the same amount, this would result in a changed oil consumption by around -10 l/h or -0.025 l/t. The corresponding values from paper C, where the calculations were based on production data, showed that the changed specific oil consumption varied from -0,02 l/t to -0.08 l/t, depending on which case it’s referring to.
ConclusionThe main conclusions from this research are:
Higher green pellet temperature increases the productivity. Depending on the filtering level, the productivity increases by around 4-5 t/h when cases where productions below 350 to 385 t/h are excluded (Filtering case 1 to 8). The effect then reduces when increasing the filtering level. Close to maximum production, the effect of an increased green pellet temperature is more or less negligible.
Higher green pellet temperature decrease the specific oil consumption. Depending on the filtering level, the specific oil consumption decreases by around 0,08 l/t when cases where productions below 350 to 385 t/h are excluded (Filtering case 1 to 8). The effect then reduces when increasing the filtering level. Close to maximum production, the effect from an increased green pellet temperature is more or less negligible.
The time resolution of the collected data, in this case based on one-hour average data and four-hour average data, does not affect the result.
Acknowledgements The authors would like to thank LKAB and the institute excellent centre PRISMA
(Process Integration in Steelmaking) for financial support of this work. A special thank to Håkan Emlén at LKAB for the help with process description and data collection. I would also like to thank Mikael Larsson at Swerea Mefos for help with the data analysis and Joakim Bengtsson for the help with “green pellet temperature”- questions.
References [1] Sustainability report, LKAB 2009 [2] Personal communication, LKAB [3] Internal report, LKAB [4] S. Nordgren, J. Dahl, J. Wang, B. Lindblom: Process integration in an iron ore upgradingprocess system – Analysis of mass and energy flows within a straight grate induration furnace 18th International Congress of Chemical and Process Engineering : 24th - 28th August - Prague - Czech Republic [5] R C. Schimmel. Energy and flow balance of the induration machine – at Corus IJmuiden. 2nd COREM Symposium on Iron Ore Pelletizing. Quebec, Canada. 2-4 June, 2008
9