Energy Absorption Ability of Thin-Walled ... - Akademia Baru · stress-strain curve does not give a...
14
Journal of Advanced Research in Applied Mechanics ISSN (online): 2289-7895 | Vol. 18, No. 1. Pages 1-14, 2016 1 Penerbit Akademia Baru Energy Absorption Ability of Thin-Walled Square Hollow Section of Low Carbon Sheet Metals under Quasi-Static Axial Compression H. M. Ismail 1,a , M. A. Khattak *,1 , M. N. Tamin 1,b , M. S. Khan 1,c , N. Iqbal 2,d , S. Kazi 3,e , S. Badshah 4,f and R. U. Khan 4,g 1 Department of Applied Mechanics and Design, Faculty of Mechanical Engineering, Univeristi Teknologi Malaysia, (UTM), Johor, Malaysia. 2 Medical Devices & Technology Group (MEDITEG), Faculty of Biosciences and Medical Engineering, Universiti Teknologi Malaysia, 81310 Johor Bahru, Johor, Malaysia. 3 Department of Mechanical Engineering, The Islamic University Madinah, P.O. Box 170 Madinah, 41411, Saudi Arabia 4 Faculty of Engineering, International Islamic University, 44000, Islamabad, Pakistan. *[email protected], a [email protected], b [email protected], c [email protected], d [email protected], e [email protected], f [email protected], g [email protected] Abstract – Countless everyday objects are constructed with sheet metal steel like car bodies, airplane wings, medical tables, roof for buildings and many other applications. In this research, loading rate effects have been studied on the low carbon steel sheet metals under Quasi-Static axial compression condition. Metallurgical study was carried out to identify microstructural behavior along with tension, chemical composition and hardness test of the same material. Johnson cook (JC) model has been used to develop a finite element model for the thin walled steel tube. Parameters of JC model have been extracted and validated with the experimental results. Strain gauge rosette is used to determine strain at required locations on the tube structure. Rectangular piece of wood (10mm) was placed inside the tube structure to avoid possible buckling. Finally, axial compression test under quasi-static condition was conducted experimentally to validate the finite element results. Properties obtained from true stress-strain curve was modulus of elasticity E = 189 GPa, yield stress and ultimate tensile strength of 220 MPa and 375 MPa, respectively. It transpired from the comparison that the predicted buckling and force levels in FE model were in good agreement with the observed buckling and force levels in the experiments. Copyright © 2016 Penerbit Akademia Baru - All rights reserved Keywords: Low carbon steel, Energy absorption, Johnson-Cook model, Axial Compression, Finite element. 1.0 INTRODUCTION Thin-walled metal tubes with different cross-sections are widely used as energy absorbing structural components in high-volume industrial products such as cars, trains, etc. [1]. Nowadays, large numbers of accidents occur and hence, for the safety of passengers, energy absorber is a necessity [2]. In designing front longitudinal parts of a vehicle, various researches have been carried out with the purpose of obtaining optimum deformation and energy
Transcript of Energy Absorption Ability of Thin-Walled ... - Akademia Baru · stress-strain curve does not give a...

Journal of Advanced Research in Applied Mechanics
ISSN (online): 2289-7895 | Vol. 18, No. 1. Pages 1-14, 2016
1
Penerbit
Akademia Baru
Energy Absorption Ability of Thin-Walled Square
Hollow Section of Low Carbon Sheet Metals under
Quasi-Static Axial Compression
H. M. Ismail1,a, M. A. Khattak*,1, M. N. Tamin1,b, M. S. Khan1,c, N. Iqbal2,d, S. Kazi3,e, S.
Badshah4,f and R. U. Khan4,g
1Department of Applied Mechanics and Design, Faculty of Mechanical Engineering,
Univeristi Teknologi Malaysia, (UTM), Johor, Malaysia. 2Medical Devices & Technology Group (MEDITEG), Faculty of Biosciences and Medical
Engineering, Universiti Teknologi Malaysia, 81310 Johor Bahru, Johor, Malaysia. 3Department of Mechanical Engineering, The Islamic University Madinah, P.O. Box 170
Madinah, 41411, Saudi Arabia 4Faculty of Engineering, International Islamic University, 44000, Islamabad, Pakistan.
*[email protected], [email protected], [email protected], [email protected], [email protected], [email protected], [email protected], [email protected]
Abstract – Countless everyday objects are constructed with sheet metal steel like car bodies, airplane
wings, medical tables, roof for buildings and many other applications. In this research, loading rate
effects have been studied on the low carbon steel sheet metals under Quasi-Static axial compression
condition. Metallurgical study was carried out to identify microstructural behavior along with tension,
chemical composition and hardness test of the same material. Johnson cook (JC) model has been used
to develop a finite element model for the thin walled steel tube. Parameters of JC model have been
extracted and validated with the experimental results. Strain gauge rosette is used to determine strain
at required locations on the tube structure. Rectangular piece of wood (10mm) was placed inside the
tube structure to avoid possible buckling. Finally, axial compression test under quasi-static condition
was conducted experimentally to validate the finite element results. Properties obtained from true
stress-strain curve was modulus of elasticity E = 189 GPa, yield stress and ultimate tensile strength of
220 MPa and 375 MPa, respectively. It transpired from the comparison that the predicted buckling and
force levels in FE model were in good agreement with the observed buckling and force levels in the
experiments. Copyright © 2016 Penerbit Akademia Baru - All rights reserved
Keywords: Low carbon steel, Energy absorption, Johnson-Cook model, Axial Compression, Finite element.
1.0 INTRODUCTION
Thin-walled metal tubes with different cross-sections are widely used as energy absorbing
structural components in high-volume industrial products such as cars, trains, etc. [1].
Nowadays, large numbers of accidents occur and hence, for the safety of passengers, energy
absorber is a necessity [2]. In designing front longitudinal parts of a vehicle, various researches
have been carried out with the purpose of obtaining optimum deformation and energy

Journal of Advanced Research in Applied Mechanics
ISSN (online): 2289-7895 | Vol. 18, No. 1. Pages 1-14, 2016
2
Penerbit
Akademia Baru
absorption. These parts are widely adopted as main energy absorbers for crashing protection
attributable to their deformation pattern and energy absorption capacity. The energy absorption
capabilities of such structures play an important role due to their high efficiency and cost-
effectiveness [3].
There has been a lot of research accomplished on the subject of axial compression test of thin-
walled tubular to analyze the behavior of the material subjected to a certain loading rate, for
instance tapered thin-walled [4] and multi-corner thin-walled [5]. For energy absorption,
Seitzberger et al [6] performed experimental analysis on different tubular and filler
arrangements to study the crushing behavior of axially compressed tubular elements. The
analysis concluded that considerable mass efficiency improvements can be obtained by
application of aluminum foam materials in the tubes with different cross sectional shapes of
the elements. If improvement by filling is concerned in terms of cross sectional areas then
square profiles are preferable to hexagonal and octahedral tubes.
Ahmad and Thambiratnam [7] investigated the same scenario of filling material application in
the conical tubes. This study uses the non-linear finite element models to observe the axial
crushing and energy absorption response of the foam filled conical tubes under quasi-static
axial loading. Important parameters such as wall thickness, semi apical angle and density of
filler material were investigated to reveal the benefits of foam filled tubes by enhancing the
energy absorption and crush strengths [8]. Beside square tubes, several other cross-section thin-
walled structures have been researched as well [9, 10], namely hexagonal tubes [11],
pentagonal tubes and triangular tubes [12-14].
In this paper, chemical composition, microstructure, hardness test across the welded region of
sheet metal and properties of material were obtained from tensile test, which were then
validated using Johnson Cook (JC) material model. Quasi-static axial compression test was
conducted using universal testing machine at displacement rate of 5mm/min. With the aid of
finite element (FE) simulation and employing accurate constitutive model, deformation of
sheet metal structures can be characterized after considering carefully designed aspects, while
performing the simulation. The global variables measured during axial compression of thin-
walled structures are the axial force and displacement.
2.0 MATERIAL PROPERTIES
Material of thin-walled tubular structure that has been used in this research is low carbon steel
(LCS). The chemical compositions of low carbon steel in atomic weight % are shown in table
1.
The high content of Mn, which acts in a three-fold manner, assists in de-oxidation of the steel,
preventing the formation of iron sulfide inclusions, and hence, promoting greater strength by
increasing the hardenability of the steel [15]. The elements Cu, Cr and Ni contribute to
corrosion resistance of the steel, particularly at high temperature.
Microstructure study was performed to identify any preferred alignment of the grains in the
steel sheets. Proper specimen processing included sectioning and cutting, mounting, grinding,
polishing, etching, microscopic analysis and hardness testing. Three (3) samples were
sectioned and cut properly having size 15 mm x 15 mm per length to ensure the specimen is
less than the size of mounting which has typical dimension of 30 mm diameter. Microstructure

Journal of Advanced Research in Applied Mechanics
ISSN (online): 2289-7895 | Vol. 18, No. 1. Pages 1-14, 2016
3
Penerbit
Akademia Baru
analysis through the microscope resulted on the plane surface, including welded region of low
carbon steel which contains ferrite and small amount of pearlite [16] as shown in Figure 1.
Table 1: Chemical Composition of Selected Low Carbon Steel (LCS) material [15]
Element Composition (wt%)
Manganese (Mn) 0.181
Aluminum (Al) 0.023
Chromium (Cr) 0.036
Carbon (C) 0.075
Nickel (Ni) 0.032
Sulphur (S) 0.007
Copper (Cu) 0.082
Silicon (Si) 0.014
Phosphorus (P) 0.009
Titanium (Ti) 0.002
Iron (Fe) 99.539
Figure 1 Microstructure of low carbon steel [17].
Figure 2 (a) Welded region of specimen.
Figure 2 (b) Size of specimen for hardness test.
Journal of Advanced Research in Applied Mechanics
ISSN (online): 2289-7895 | Vol. 18, No. 1. Pages 1-14, 2016
4
Penerbit
Akademia Baru
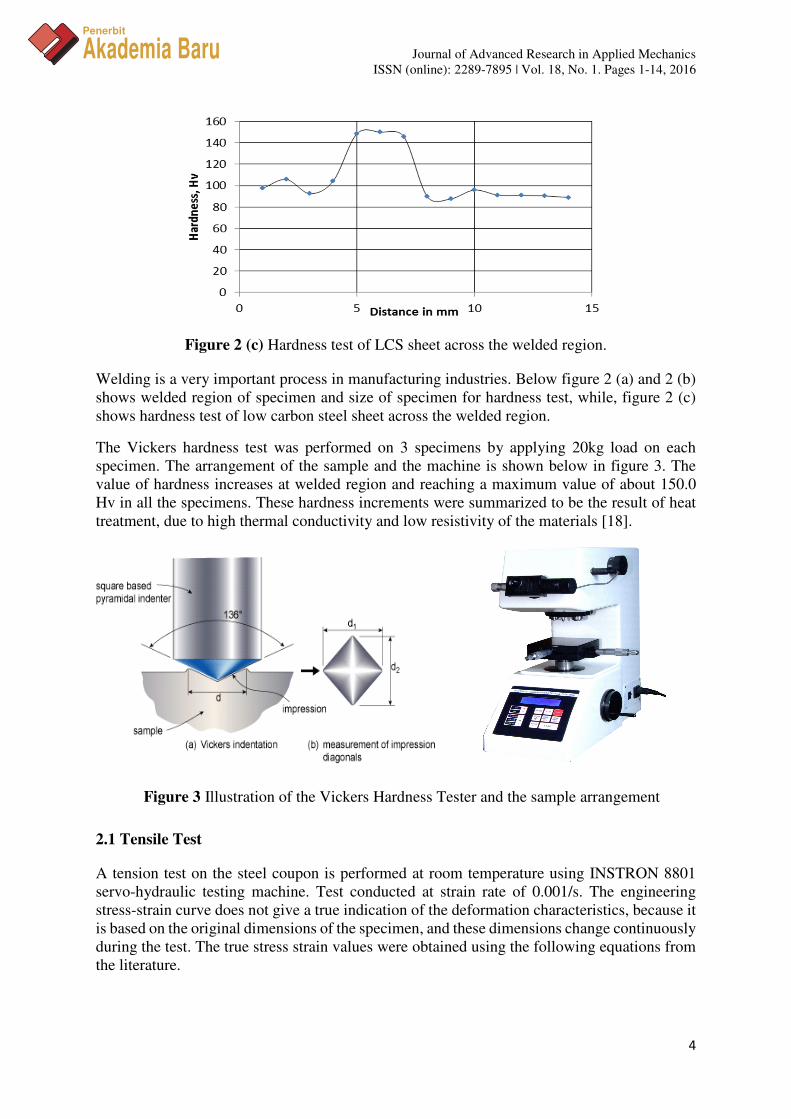
Figure 2 (c) Hardness test of LCS sheet across the welded region.
Welding is a very important process in manufacturing industries. Below figure 2 (a) and 2 (b)
shows welded region of specimen and size of specimen for hardness test, while, figure 2 (c)
shows hardness test of low carbon steel sheet across the welded region.
The Vickers hardness test was performed on 3 specimens by applying 20kg load on each
specimen. The arrangement of the sample and the machine is shown below in figure 3. The
value of hardness increases at welded region and reaching a maximum value of about 150.0
Hv in all the specimens. These hardness increments were summarized to be the result of heat
treatment, due to high thermal conductivity and low resistivity of the materials [18].
Figure 3 Illustration of the Vickers Hardness Tester and the sample arrangement
2.1 Tensile Test
A tension test on the steel coupon is performed at room temperature using INSTRON 8801
servo-hydraulic testing machine. Test conducted at strain rate of 0.001/s. The engineering
stress-strain curve does not give a true indication of the deformation characteristics, because it
is based on the original dimensions of the specimen, and these dimensions change continuously
during the test. The true stress strain values were obtained using the following equations from
the literature.

Journal of Advanced Research in Applied Mechanics
ISSN (online): 2289-7895 | Vol. 18, No. 1. Pages 1-14, 2016
5
Penerbit
Akademia Baru
σ = s (1 + e) (1)
and ɛ = ln(1 + e) (2)
where
σ is true stress
ɛ is true strain
s is engineering stress
e is engineering strain
Figure 4 compares the true stress-strain curve with its corresponding engineering stress-strain
curve.
Figure 4 Stress vs. Strain of low carbon steel.
Note that, because of relatively large plastic strain, the elastic region has been compressed into
the stress region in y-axis. The true stress-strain curve is always to the left of the engineering
curve until the maximum load is reached. However, beyond maximum load, the high localized
strains in the necked region far exceed the engineering strain and the flow curve is linear.
Properties obtained from true stress-strain curve, such as, modulus of elasticity E = 189 GPa,
yield stress (��) and ultimate tensile strength (��� are 220 and 375 MPa, respectively.
2.2 Johnson-Cook Model Parameters
Extraction of the Johnson-Cook (JC) parameters has been performed, values of these
parameters shown in Table 2.
Parameter A is the yield stress from the true stress-strain curve. Parameter B and n are obtained
from the curve fit by using the equation 3 below. The value of parameter C was obtained from
the slope of the linear fitting as shown from equation 4. The constant m is represented as the
coefficient of thermal softening exponent. However, parameter m is obtained from the previous
research due to limited data of stress-strain curves at different temperature [19-23].
Extraction of JC model parameters
a) Determination of A, B, and n :
ln (σ - A) = ln(B) + n ln (ɛ) (3)

Journal of Advanced Research in Applied Mechanics
ISSN (online): 2289-7895 | Vol. 18, No. 1. Pages 1-14, 2016
6
Penerbit
Akademia Baru
b) Determination of C:
(4)
c) Determination of m
ln� ���� �������� ∗�
� � � ln�1 � �∗� (5)
Table 2 Parameter values for JC model.
Description Parameters
Yield stress, �� (MPa) A 220
Coefficient of strain hardening (MPa) B 309.3
Coefficient of strain rate hardening C 0.022
Strain hardening exponent n 0.4795
Thermal softening exponent m 0.3
Strain rate (/s) ��� 0.001
Melting point (K) �� 1600
Density (kg/m3) ρ 7800
2.3 Validation Test Data
In Figure 5 performance of the JC model is illustrated and compared with measured data, in
terms of true stress-plastic strain curves at selected strain rate of 0.001/s. The close comparison
of the curves proves the validation of the produced JC constitutive model, for low carbon steel.
Figure 5 Comparison of experiment and model fitting.

Journal of Advanced Research in Applied Mechanics
ISSN (online): 2289-7895 | Vol. 18, No. 1. Pages 1-14, 2016
7
Penerbit
Akademia Baru
3.0 AXIAL COMPRESSION TEST SETUP
The experimental study based on quasi-static axial compression test on thin-walled tube was
conducted on a single specimen using universal testing machine at displacement rate of 5
mm/min. The geometry of the square hollow section (SHS) is measured 50 x 50 x 150 mm3
with a thickness of 1.2 mm, as illustrated in Figure 6.
Figure 6 Axial compression test setup of thin-walled tube
It is important to ensure that the edges of the thin-walled are precisely square and perpendicular
to the compression plate. At the top and bottom ends of the thin-walled tube, wooden boxes
with 10 mm height are attached inside. Strain gage rosettes, shown in Figure 7, are used often
in engineering practice to determine strain states at specific points on a structure.
Figure 7 Strain gage rosette and thin-walled tube with 10mm wooden boxes at edges.
Three strain values will be determined from strain gauge and from that strain values, in-plane
principal strain will be calculated by the following equation (6).
�� � ��
. ��! + �#� + �
√�. %��! � �&�� + ��& � �#�� (1) (6)
Journal of Advanced Research in Applied Mechanics
ISSN (online): 2289-7895 | Vol. 18, No. 1. Pages 1-14, 2016
8
Penerbit
Akademia Baru
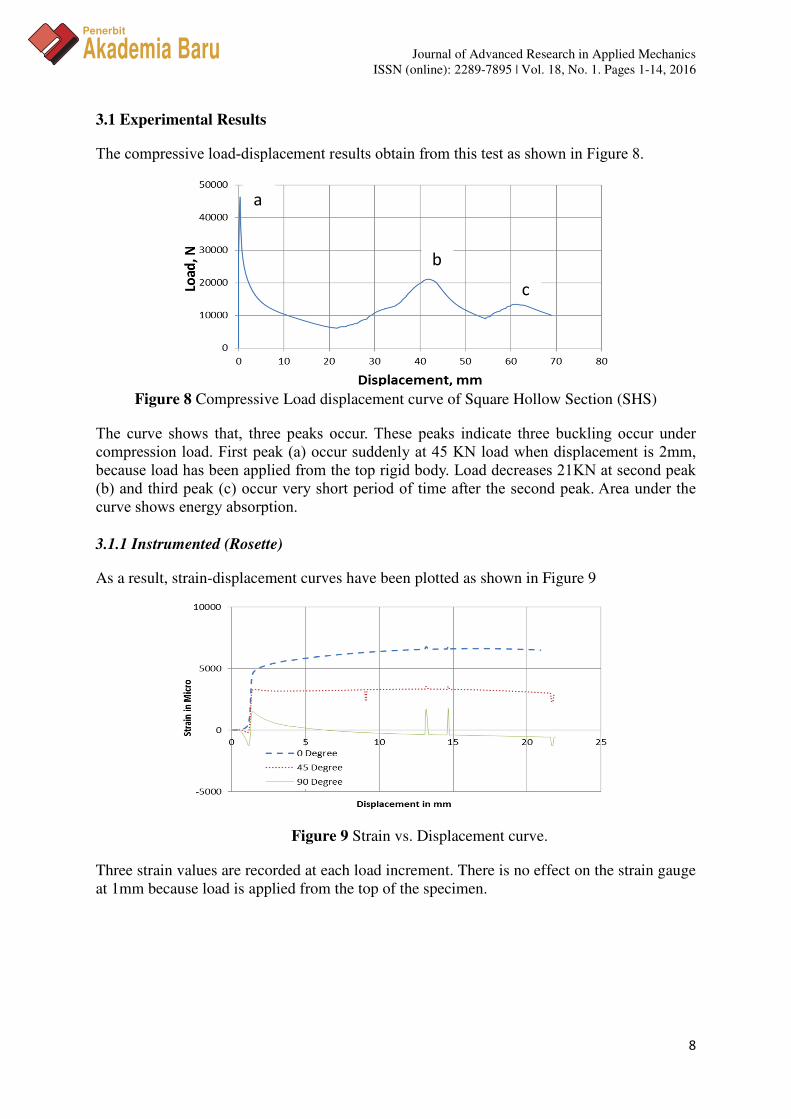
3.1 Experimental Results
The compressive load-displacement results obtain from this test as shown in Figure 8.
Figure 8 Compressive Load displacement curve of Square Hollow Section (SHS)
The curve shows that, three peaks occur. These peaks indicate three buckling occur under
compression load. First peak (a) occur suddenly at 45 KN load when displacement is 2mm,
because load has been applied from the top rigid body. Load decreases 21KN at second peak
(b) and third peak (c) occur very short period of time after the second peak. Area under the
curve shows energy absorption.
3.1.1 Instrumented (Rosette)
As a result, strain-displacement curves have been plotted as shown in Figure 9
Figure 9 Strain vs. Displacement curve.
Three strain values are recorded at each load increment. There is no effect on the strain gauge
at 1mm because load is applied from the top of the specimen.
a
b
c

Journal of Advanced Research in Applied Mechanics
ISSN (online): 2289-7895 | Vol. 18, No. 1. Pages 1-14, 2016
9
Penerbit
Akademia Baru
4.0 FINITE ELEMENT SIMULATION
4.1 Geometry
An axial compression test of the steel tube is simulated using FE method. The geometry of the
square hollow section, measuring 50 x 50 x 130 mm with thickness 1.2mm, is illustrated in
Figure 10.
Figure 10 Geometry of the thin-walled tube
4.2 Mesh, Boundary Condition and Loading
Figure 11 shows that, the bottom end of thin-walled tube is fixed; do not move in any direction.
At the fixed end, the displacement of x-axis, y-axis, z-axis and rotation in all three axis are
restrained to be zero resulting in values as shown below:
U1=U2=U3=UR1=UR2=UR3=0 (7)
While the second boundary condition applied on the top rigid body in which the displacement
across x-axis, z-axis and rotation in all three axis are zero as well
U1=U3=UR1=UR2=UR3=0. (8)
Constant displacement rate at 5mm/min i.e. equivalent to the quasi-static rate is assigned at the
top of rigid body in negative y-axis, so that the thin-walled tube will move only in negative y
direction.
4.3 Mesh Convergence Study
In finite element modeling, a finer mesh typically results in a more accurate solution. However,
as a mesh is made finer, the computation time increases. The model assembly was discretized
uniformly throughout the tube using 89900 8-node hexahedral continuum elements. As shown
in Figure 13, each figure has different mesh size and different no. of element and different no.
of nodes.

Journal of Advanced Research in Applied Mechanics
ISSN (online): 2289-7895 | Vol. 18, No. 1. Pages 1-14, 2016
10
Penerbit
Akademia Baru
Figure 11 Mesh, boundary condition and loading.
Figure 13 Variation of Von Mises stress field with mesh size.
4.4 Validation of Results
The compressive load-displacement results obtained from this test has been validated with the
FE results as shown in Figure 14.
Figure 14 Comparison of results.

Journal of Advanced Research in Applied Mechanics
ISSN (online): 2289-7895 | Vol. 18, No. 1. Pages 1-14, 2016
11
Penerbit
Akademia Baru
The same three buckling occur in FE simulation. First buckle occurs suddenly as same as
experimental result. However, the predicted value after the first peak of the response of
compressive load is 10 percent higher than the measured value. The unsymmetrical behavior
occurred due to the thin-walled tube is not a perfect 90°, twisted with 2°.
Figure 15 shows, validation of experimental and simulation principle strain.
Figure 15 Principle Strain vs. Displacement curve.
Experimental principle strain was calculated from equation (f). Strain gauge rosette was
inserted at the center of the specimen; similarly, in simulation principle strain was taken at
node 41270 which is approximately center of the model.
Energy absorption calculated from experiment data by using trapezoidal method is 409.6 KJ
and energy absorption calculated from finite element simulation is 458 KJ as shown in Figure
16.
Figure 17 shows, thin-walled tube under compression loading where three buckling occur till
70 mm distance at displacement rate of 5mm/min.
Figure 18 shows the von mises stress and equivalent plastic strain of thin-walled tube.
Equivalent plastic strain gives a measure of the amount of permanent strain. The maximum
von mises stress and maximum equivalent plastic strain is shown at the third peak.
Figure 16 Energy absorption from finite element simulation.

Journal of Advanced Research in Applied Mechanics
ISSN (online): 2289-7895 | Vol. 18, No. 1. Pages 1-14, 2016
12
Penerbit
Akademia Baru
Figure 17 Thin-walled tube under compression loading.
Figure 18 Maximum stress and PEEQ
5.0 CONCLUSION
Johnson cook model has been used and parameters of JC model has been extracted and
validated with the experimental results. In the axial compression test on thin-walled tube,
experimental results and FEM modeling has been compared and validated successfully. In
compressive load-displacement experiment, the unsymmetrical behavior occurred due to the
thin-walled tube is not a perfect 90°, twisted with 2°. Energy absorption calculated from
experiment data by using trapezoidal method is 409.6 KJ and energy absorption from FEM is
458 KJ.

Journal of Advanced Research in Applied Mechanics
ISSN (online): 2289-7895 | Vol. 18, No. 1. Pages 1-14, 2016
13
Penerbit
Akademia Baru
References
[1] X. Zhang, G. Cheng, Z. You, H. Zhang, Energy absorption of axially compressed thin-
walled square tubes with patterns, Thin-Walled Structures 45 (2007) 737-746.
[2] A.A. Nia, H.H. Jamal, Comparative analysis of energy absorption and deformations of
thin walled tubes with various section geometries, Thin-Walled Structures 48 (2010)
946-954.
[3] X. Zhang, H. Zhang, Experimental and numerical investigation on crush resistance of
polygonal columns and angle elements, Thin-Walled Structures 57 (2012) 25-36.
[4] G.M. Nagel, D. P. Thambiratnam, A numerical study on the impact response and energy
absorption of tapered thin-walled tubes, International Journal of Mechanical Sciences 46
(2004) 201-216.
[5] Y. Liu, Crashworthiness design of multi-corner thin-walled columns, Thin-Walled
Structures 46 (2008) 1329-1337.
[6] M. Seitzberger, F.G. Rammerstorfer, R. Gradinger, H.P. Degischer, M. Blaimschein, C.
Walch, Experimental studies on the quasi-static axial crushing of steel columns filled
with aluminium foam, International Journal of Solids and Structures 37 (2000) 4125-
4147.
[7] A. Zaini, D. P. Thambiratnam, Crushing response of foam-filled conical tubes under
quasi-static axial loading, Materials & design 30 (2009) 2393-2403.
[8] Y. Zhang, G. Sun, G. Li, Z. Luo, Q. Li, Optimization of foam-filled bitubal structures for
crashworthiness criteria, Materials & Design 38 (2012) 99-109.
[9] W. Hong, F. Jin, J. Zhou, Z, Xia, Y. Xu, L. Yang, Q. Zheng, H. Fan, Quasi-static axial
compression of triangular steel tubes, Thin-Walled Structures 62 (2013) 10-17.
[10] T. Murmu, S.C. Pradhan, Buckling analysis of a single-walled carbon nanotube
embedded in an elastic medium based on nonlocal elasticity and Timoshenko beam
theory and using DQM, Physica E: Low-dimensional Systems and Nanostructures 41
(2009) 1232-1239.
[11] D.H. Chen, K. Masuda, Crushing behavior of thin-walled hexagonal tubes with partition
plates, ISRN Mechanical Engineering 2011 (2011) 503973.
[12] J.H. Ye, X.L. Xiao, R. Al-Mahaidi, Plastic mechanism analysis of fabricated square and
triangular sections under axial compression, Thin-walled structures 45 (2007) 135-148.
[13] M. Krolak, K. Kowal-Michalska, R. Mania, J. Swiniarski, Experimental tests of stability
and load carrying capacity of compressed thin-walled multi-cell columns of triangular
cross-section, Thin-Walled Structures 45 (2007) 883-887.
[14] Y. Liu, Collapse behaviour and simplified modeling of triangular cross-section columns,
Indian Journal of Engineering & Materials Sciences16 (2009) 71-78.
[15] S.S. Arsad, Unified Constitutive Models for Deformation of Thin Walled Structures,
Master’s Thesis, (2012) Universiti Teknologi Malaysia.
[16] F. Xu, Y.-W. Wand, B. Bai, H.S. Fang, CCT curves of low-carbon Mn-Si steels and
development of water-cooled bainitic steels, Journal of Iron and Steel Research 17 (2010)
46-50.

Journal of Advanced Research in Applied Mechanics
ISSN (online): 2289-7895 | Vol. 18, No. 1. Pages 1-14, 2016
14
Penerbit
Akademia Baru
[17] F.V.V. George, Microstructures of Hot and Cold Worked Metals and Alloys, Buehler
Ltd., USA, (2009).
[18] M. Jafarzadegan, A. Abdollah-zadeh, A.H. Feng, T. Saeid, J. Shen, H. Assadi,
Microstructure and mechanical properties of a dissimilar friction stir weld between
austenitic stainless steel and low carbon steel, Journal of Materials Science &
Technology 29 (2013) 367-372.
[19] M. Ghosh, K. Kumar, R.S. Mishra, Friction stir lap welded advanced high strength steels:
Microstructure and mechanical properties, Materials Science and Engineering: A 528
(2011) 8111-8119.
[20] D. Roylance, Stress-strain curves, Massachusetts Institute of Technology study,
Cambridge (2001).
[21] V. Tarigopula, M. Langseth, O.S. Hopperstad, A.H. Clausen, Axial crushing of thin-
walled high-strength steel sections, International Journal of Impact Engineering 32
(2006) 847-882.
[22] S. Len, Optional Strain-rate forms for the Johnson Cook Constitutive Model and the Role
of the parameter Epsilon_0, Proceedings of the 6th European LS-DYNA Users’
Conference, Anwenderforum, Frankenthal, Germany (2007).
[23] Sheet, Prime-Painted Steel, Cold-rolled steel sheet, ASTM A 366 (2004).