End-Use Quality of Wheat and Functional Properties of ... · End-Use Quality of Wheat and...
40
End-Use Quality of Wheat and Functional Properties of Whole Grain Wheat Byung-Kee Baik Soft Wheat Quality Laboratory USDA-ARS
Transcript of End-Use Quality of Wheat and Functional Properties of ... · End-Use Quality of Wheat and...
End-Use Quality of Wheat and
Functional Properties of Whole
Grain Wheat
Byung-Kee Baik
Soft Wheat Quality Laboratory
USDA-ARS
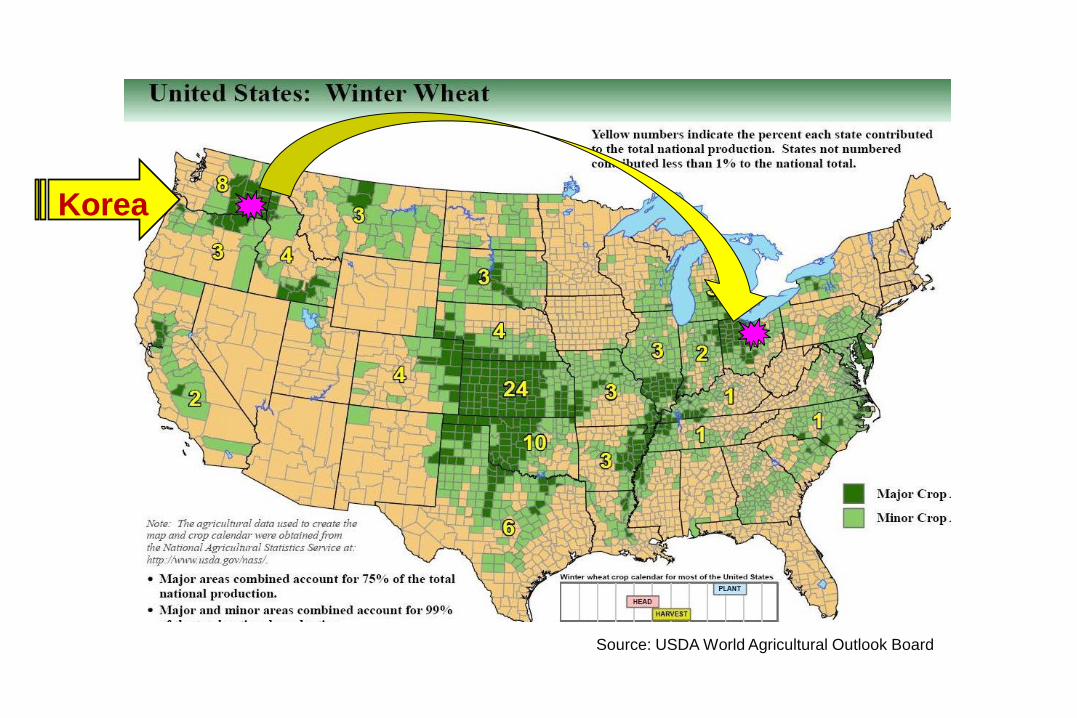
Source: USDA World Agricultural Outlook Board
Korea
End-Use Quality of Wheat
for Asian Markets
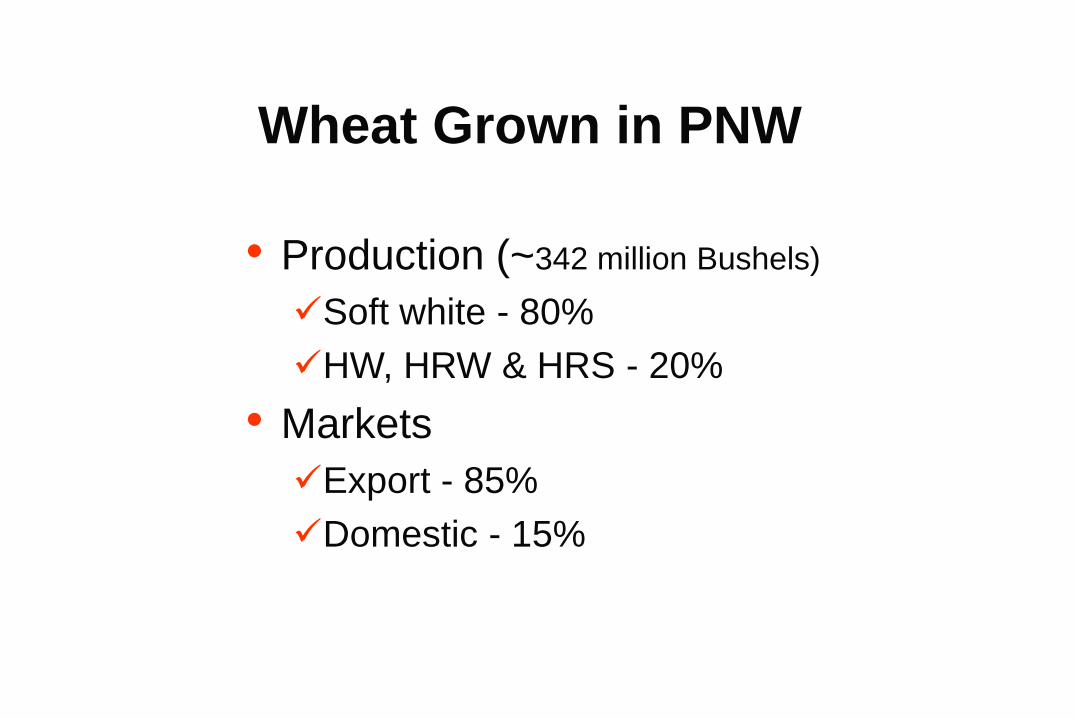
Wheat Grown in PNW
• Production (~342 million Bushels)
Soft white - 80%
HW, HRW & HRS - 20%
• Markets
Export - 85%
Domestic - 15%
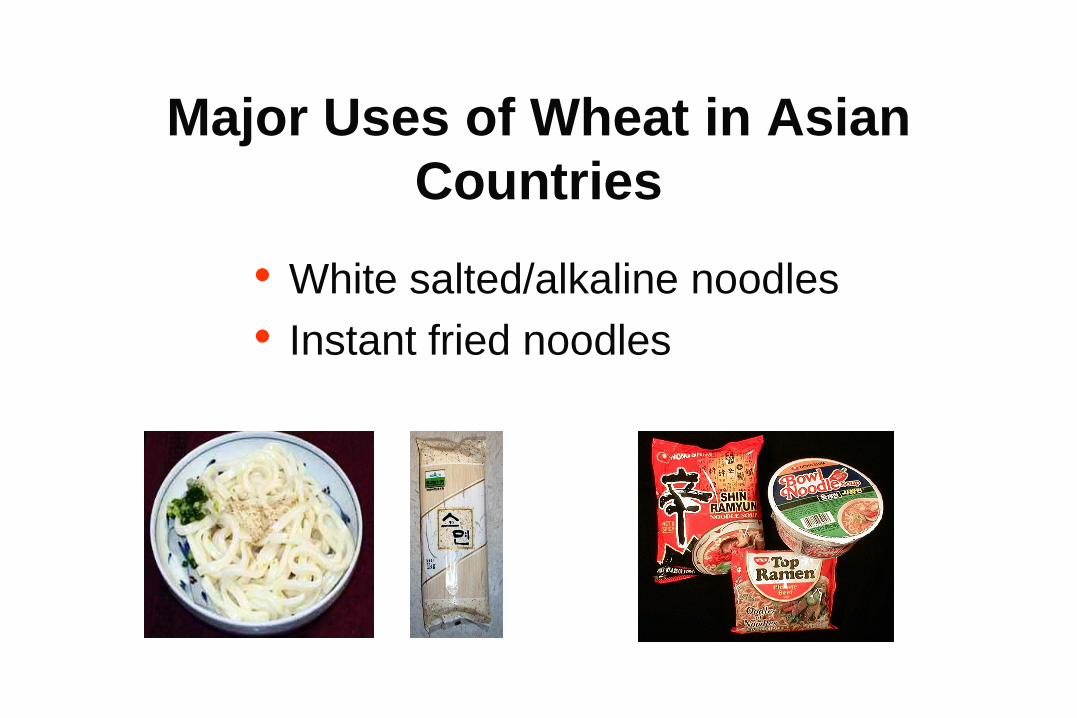
Major Uses of Wheat in Asian
Countries
• White salted/alkaline noodles
• Instant fried noodles
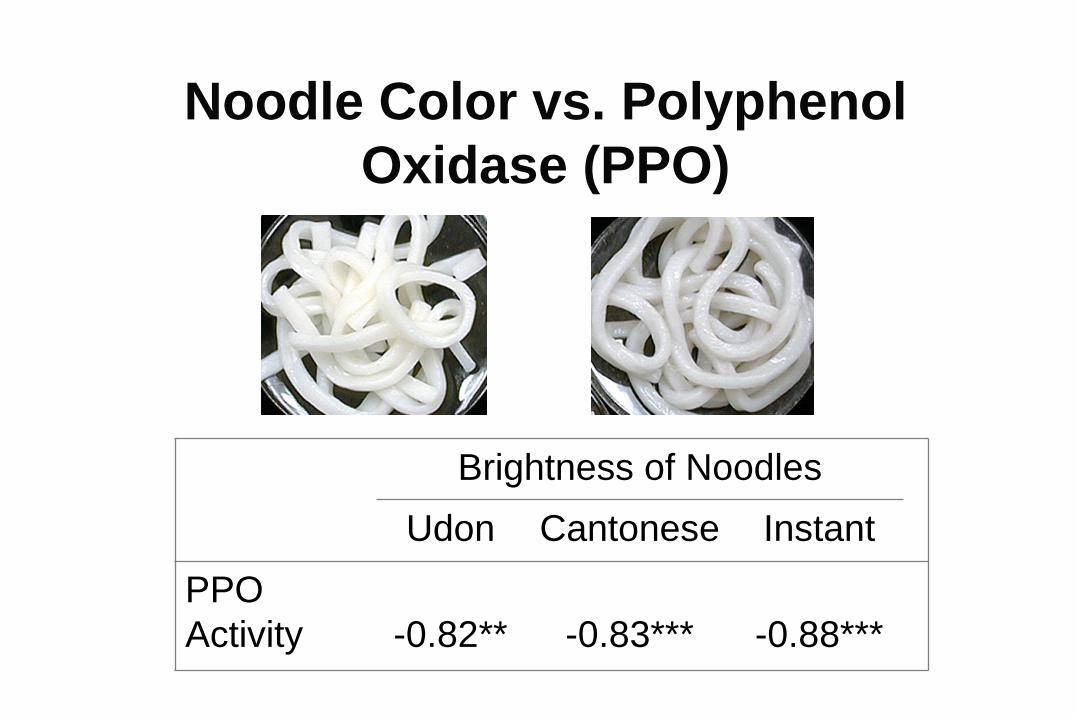
Noodle Color vs. Polyphenol
Oxidase (PPO)
Brightness of Noodles
Udon Cantonese Instant
PPO
Activity
-0.82**
-0.83***
-0.88***
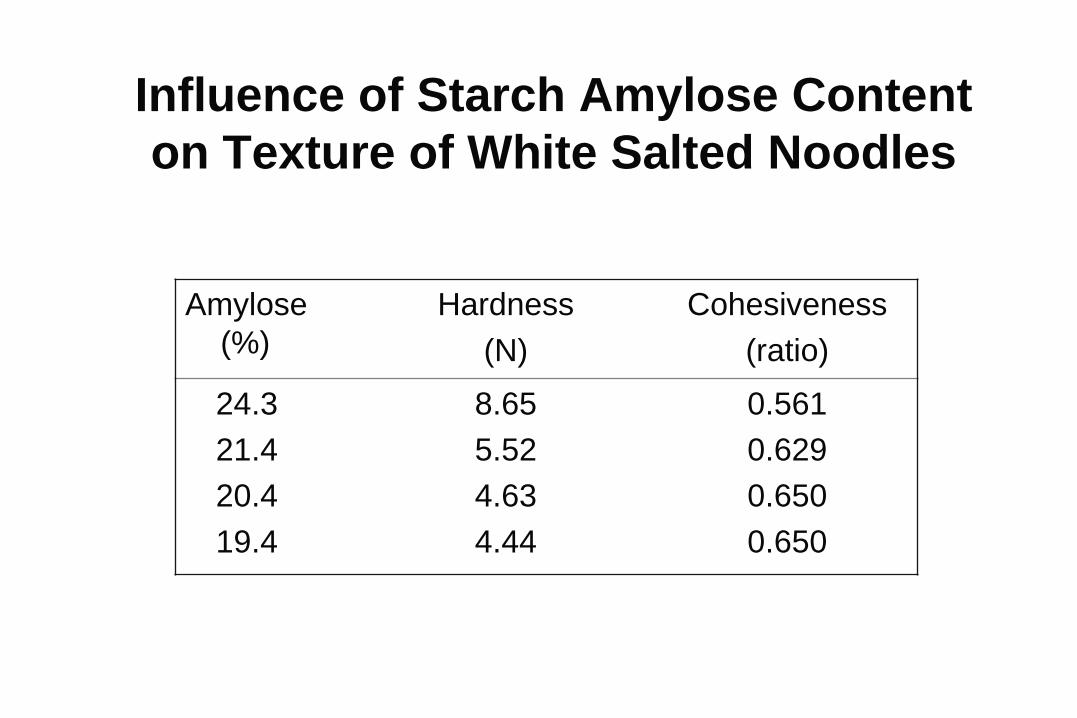
Influence of Starch Amylose Content
on Texture of White Salted Noodles
Amylose
(%)
Hardness
(N)
Cohesiveness
(ratio)
24.3
21.4
20.4
19.4
8.65
5.52
4.63
4.44
0.561
0.629
0.650
0.650
Cooking Time and Fat Absorption
of Noodles
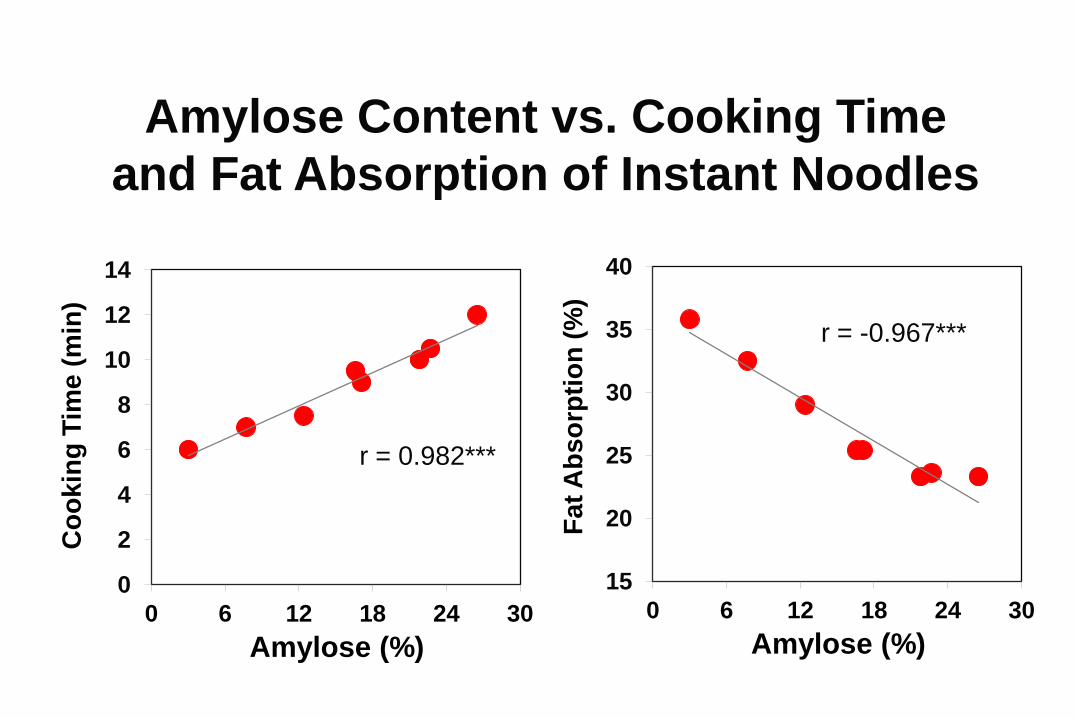
15
20
25
30
35
40
0 6 12 18 24 30
Fa
t A
bs
orp
tio
n (
%)
Amylose (%)
r = -0.967***
Amylose Content vs. Cooking Time
and Fat Absorption of Instant Noodles
0
2
4
6
8
10
12
14
0 6 12 18 24 30
Co
ok
ing
Tim
e (
min
)
Amylose (%)
r = 0.982***
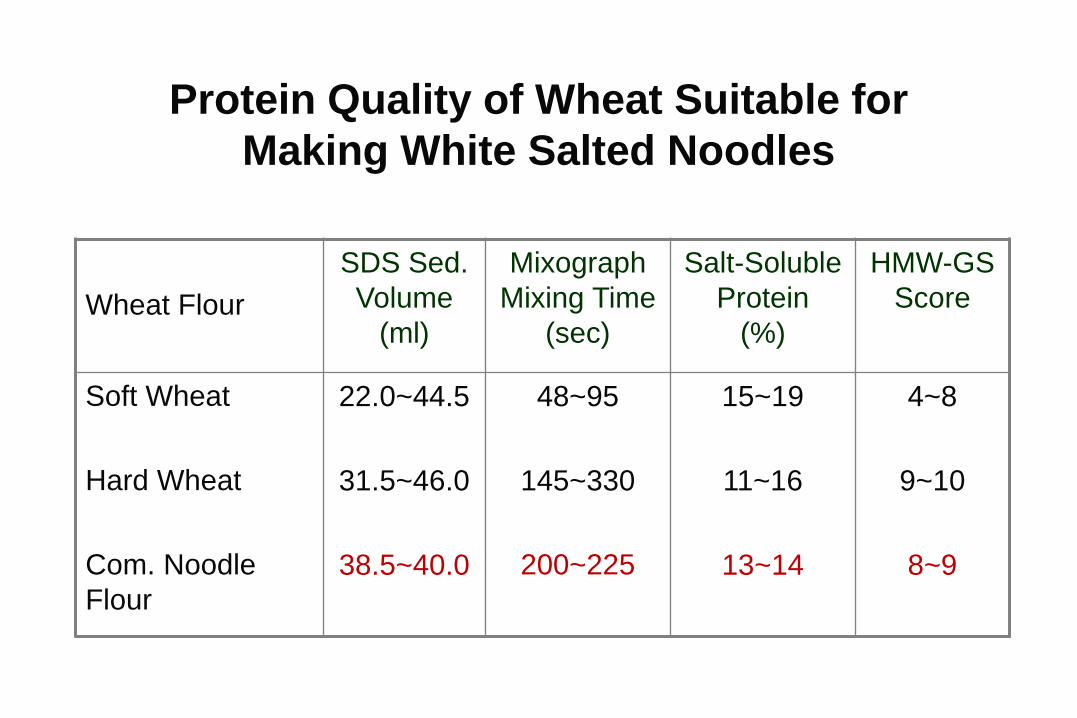
Protein Quality of Wheat Suitable for
Making White Salted Noodles
Wheat Flour
SDS Sed.
Volume
(ml)
Mixograph
Mixing Time
(sec)
Salt-Soluble
Protein
(%)
HMW-GS
Score
Soft Wheat
Hard Wheat
Com. Noodle
Flour
22.0~44.5
31.5~46.0
38.5~40.0
48~95
145~330
200~225
15~19
11~16
13~14
4~8
9~10
8~9
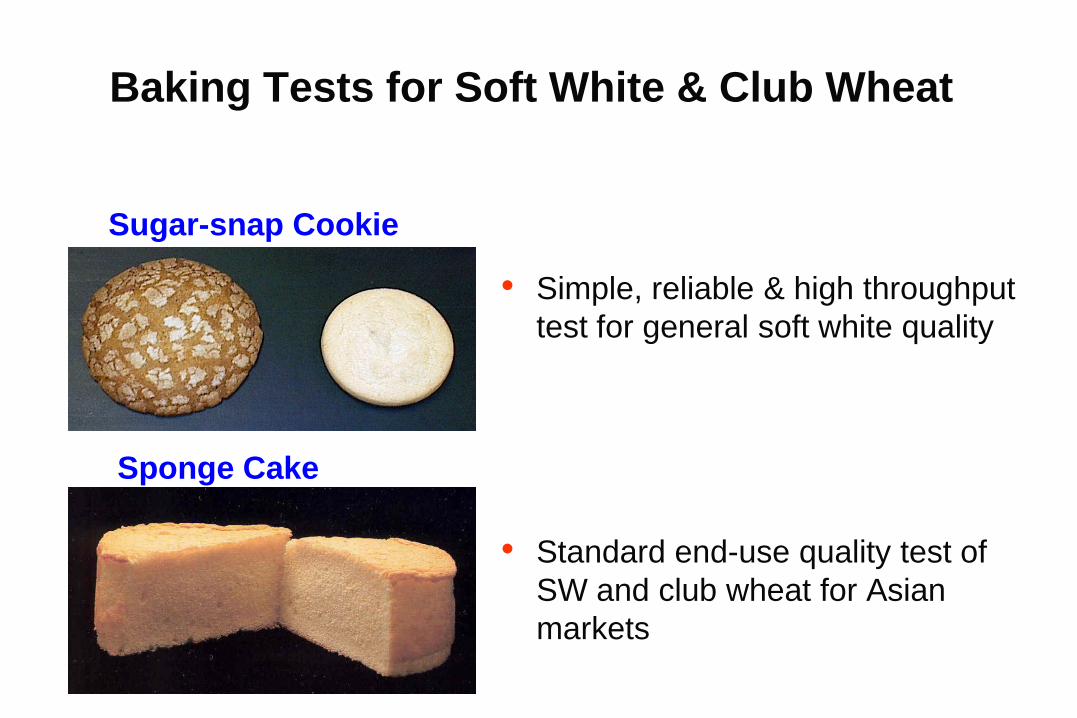
Baking Tests for Soft White & Club Wheat
• Standard end-use quality test of
SW and club wheat for Asian
markets
• Simple, reliable & high throughput
test for general soft white quality
Sugar-snap Cookie
Sponge Cake
H2O
H2O
+
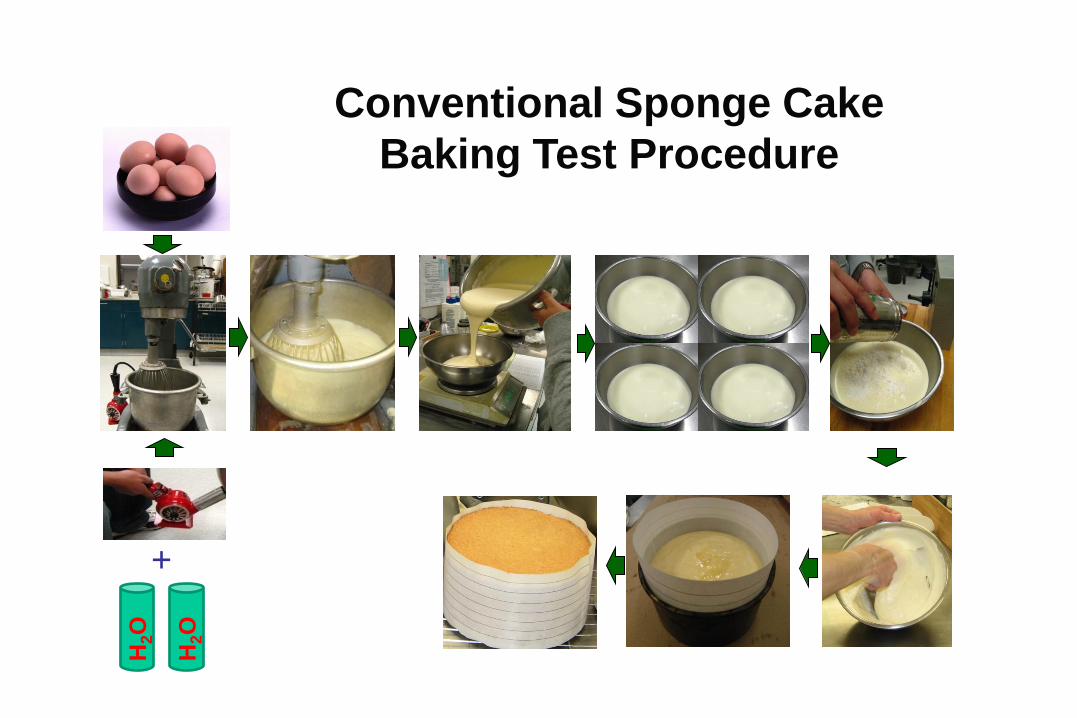
Conventional Sponge Cake
Baking Test Procedure
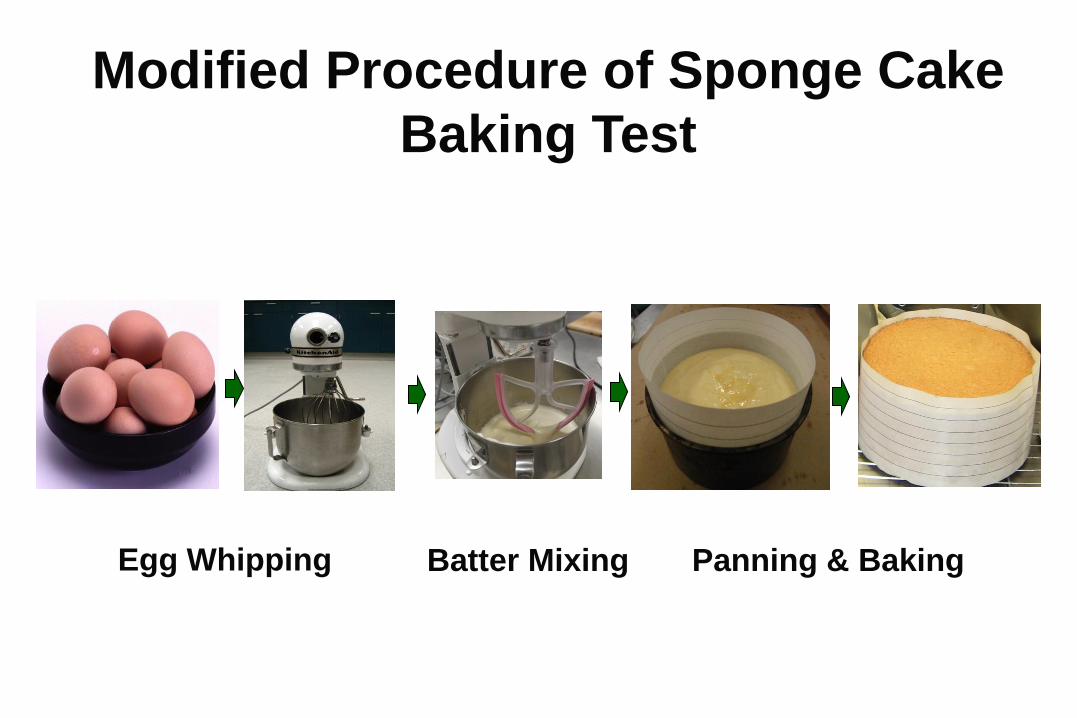
Modified Procedure of Sponge Cake
Baking Test
Egg Whipping Batter Mixing Panning & Baking
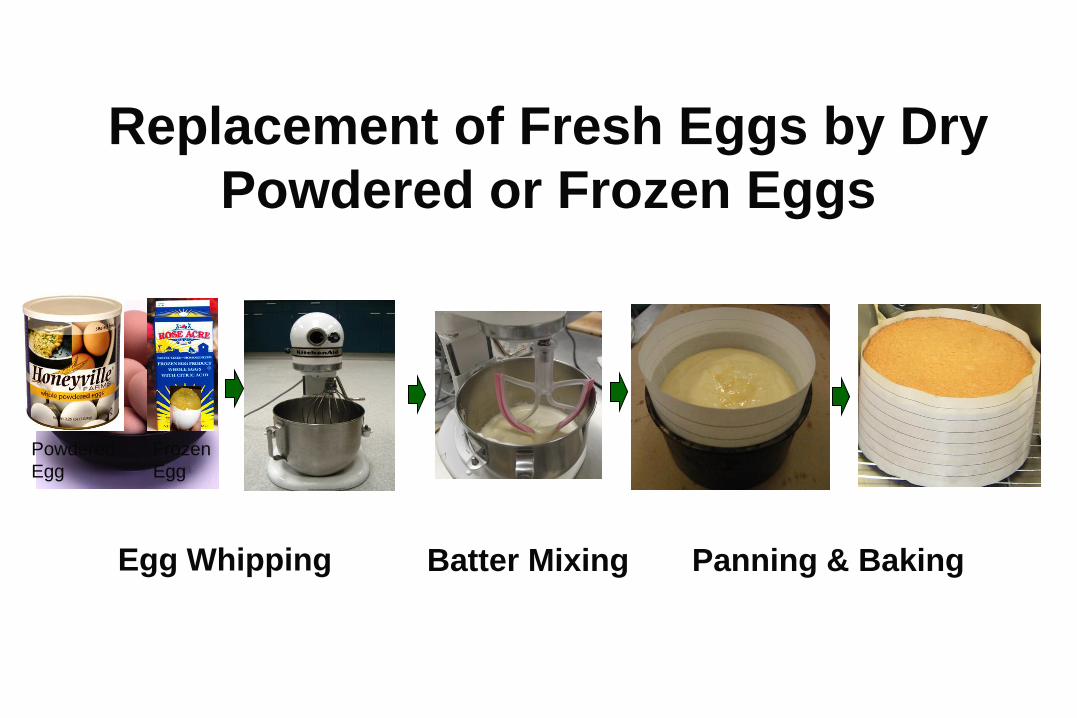
Replacement of Fresh Eggs by Dry
Powdered or Frozen Eggs
Powdered
Egg
Frozen
Egg
Egg Whipping Batter Mixing Panning & Baking
600
800
1000
1200
1400
1600
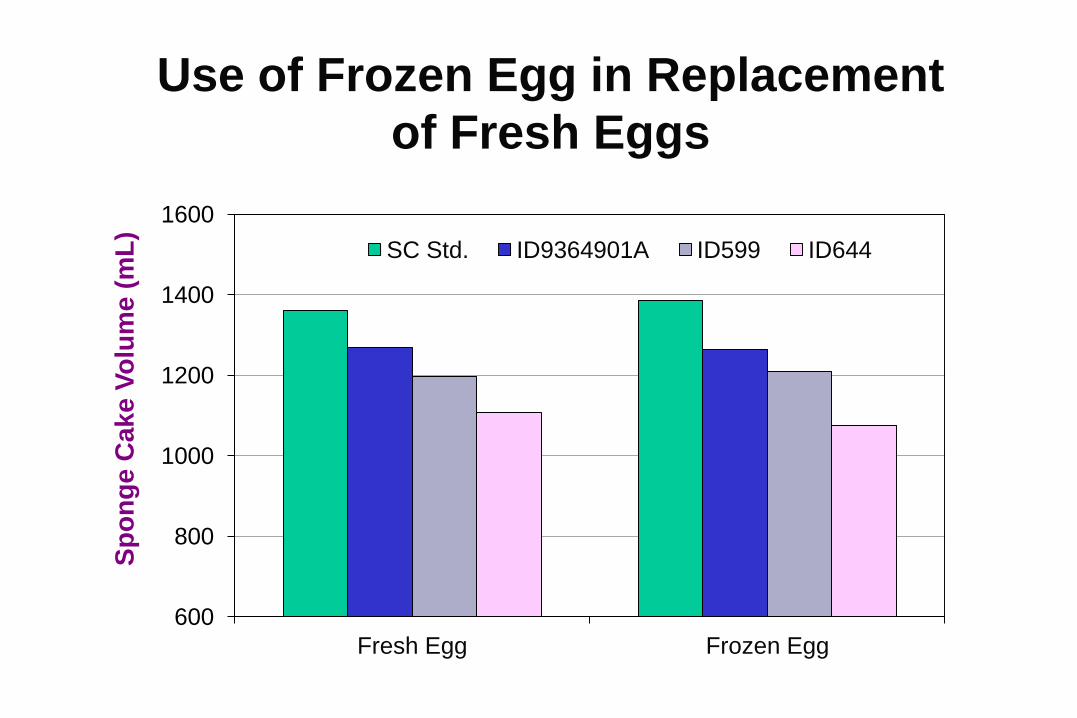
Fresh Egg Frozen Egg
Sp
on
ge C
ake V
olu
me (
mL
)
SC Std. ID9364901A ID599 ID644
Use of Frozen Egg in Replacement
of Fresh Eggs
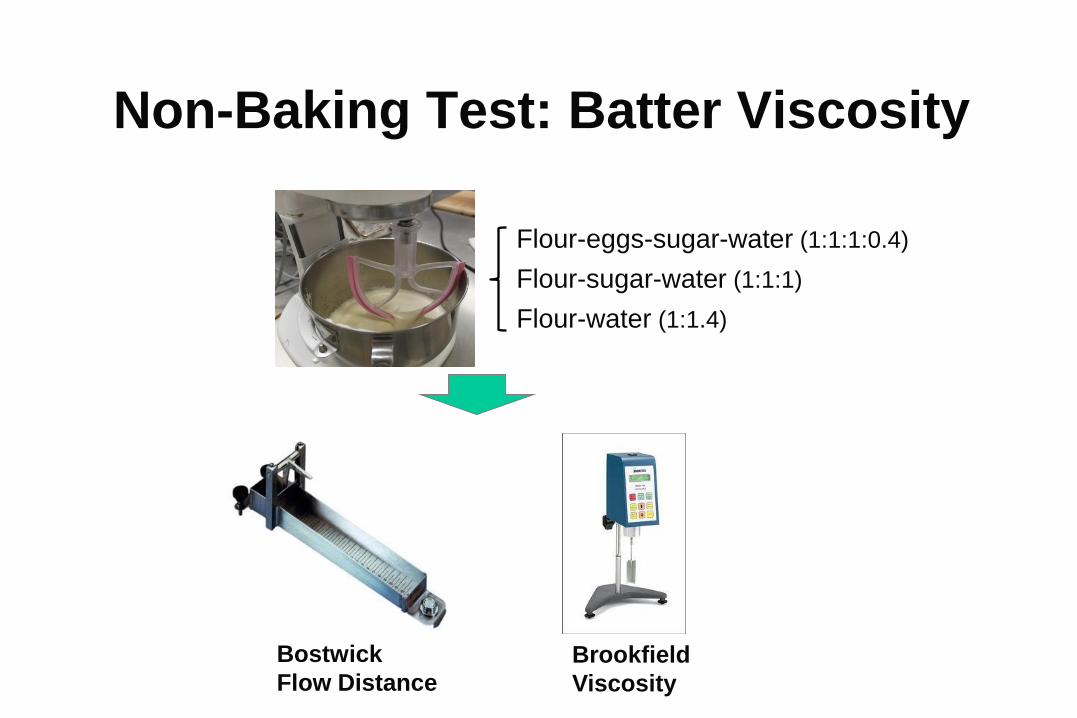
Non-Baking Test: Batter Viscosity
Brookfield
Viscosity
Bostwick
Flow Distance
Flour-eggs-sugar-water (1:1:1:0.4)
Flour-sugar-water (1:1:1)
Flour-water (1:1.4)
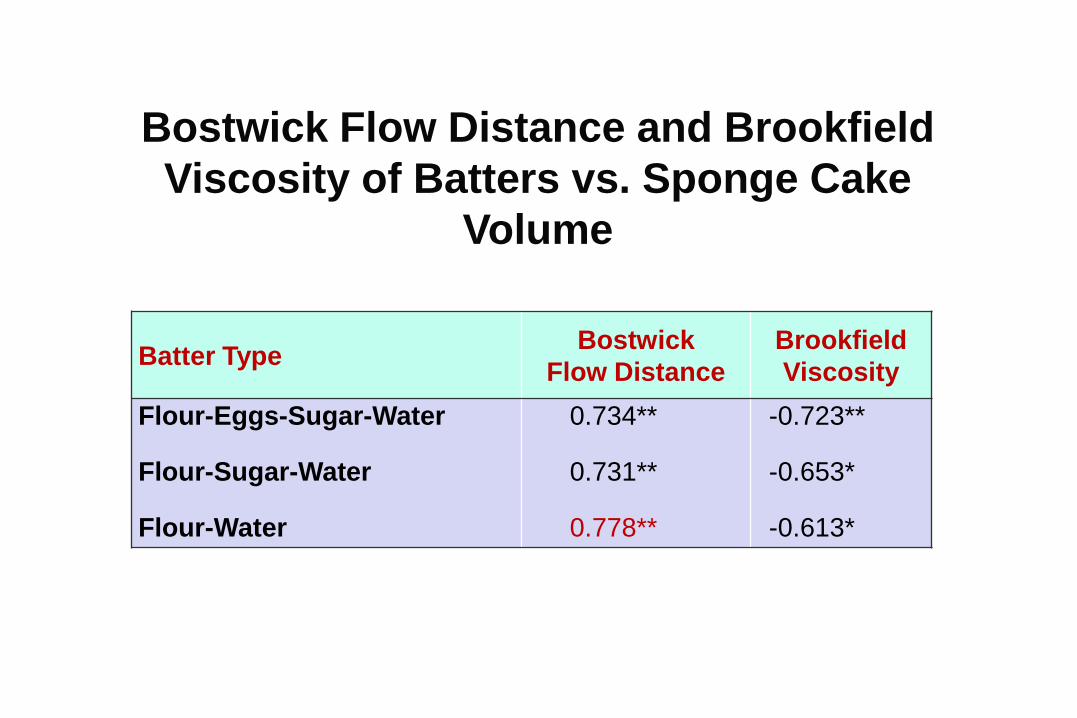
Batter Type Bostwick
Flow Distance
Brookfield
Viscosity
Flour-Eggs-Sugar-Water
Flour-Sugar-Water
Flour-Water
0.734**
0.731**
0.778**
-0.723**
-0.653*
-0.613*
Bostwick Flow Distance and Brookfield
Viscosity of Batters vs. Sponge Cake
Volume
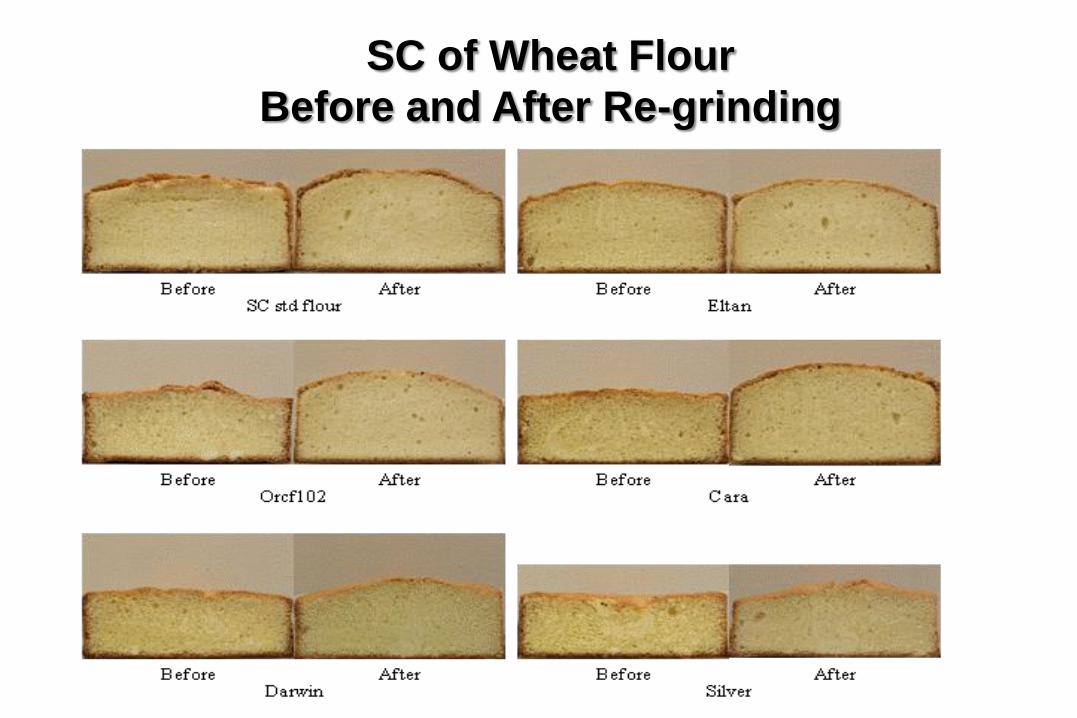
SC of Wheat Flour
Before and After Re-grinding

SC of Flour Fractions of Different
Particle Size
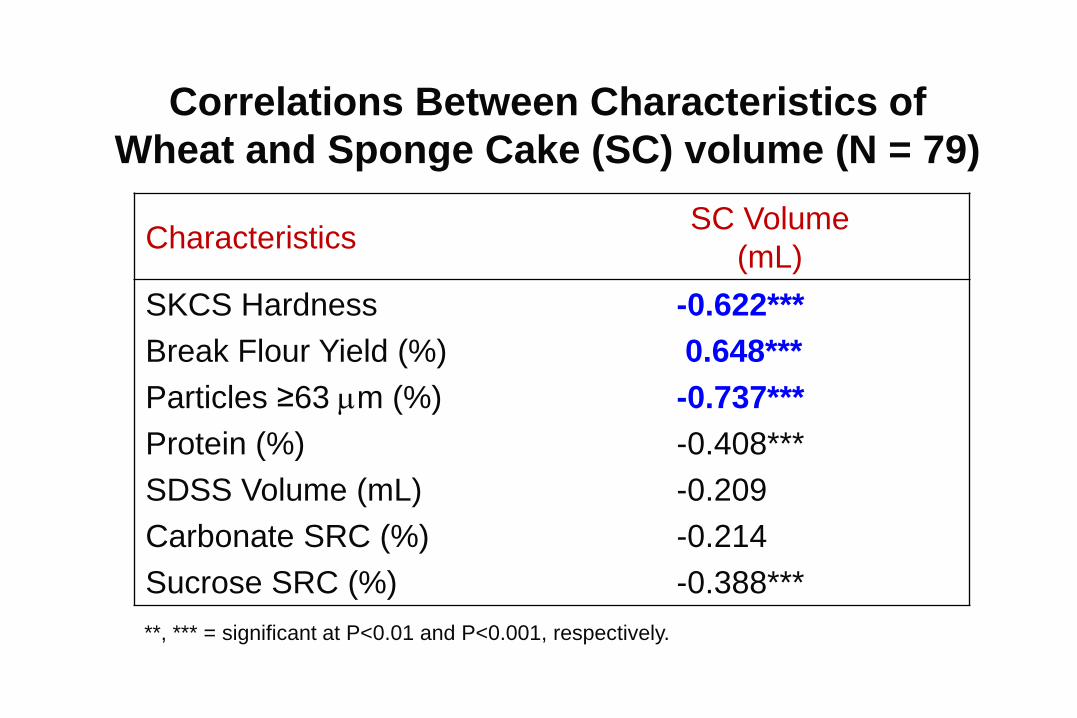
Characteristics SC Volume
(mL)
SKCS Hardness
Break Flour Yield (%)
Particles ≥63 m (%)
Protein (%)
SDSS Volume (mL)
Carbonate SRC (%)
Sucrose SRC (%)
-0.622***
0.648***
-0.737***
-0.408***
-0.209
-0.214
-0.388***
**, *** = significant at P<0.01 and P<0.001, respectively.
Correlations Between Characteristics of
Wheat and Sponge Cake (SC) volume (N = 79)
More fiber, minerals, vitamins,
phytochemicals
Low calorie density
Low glycemic index
Whole Grains over Refined
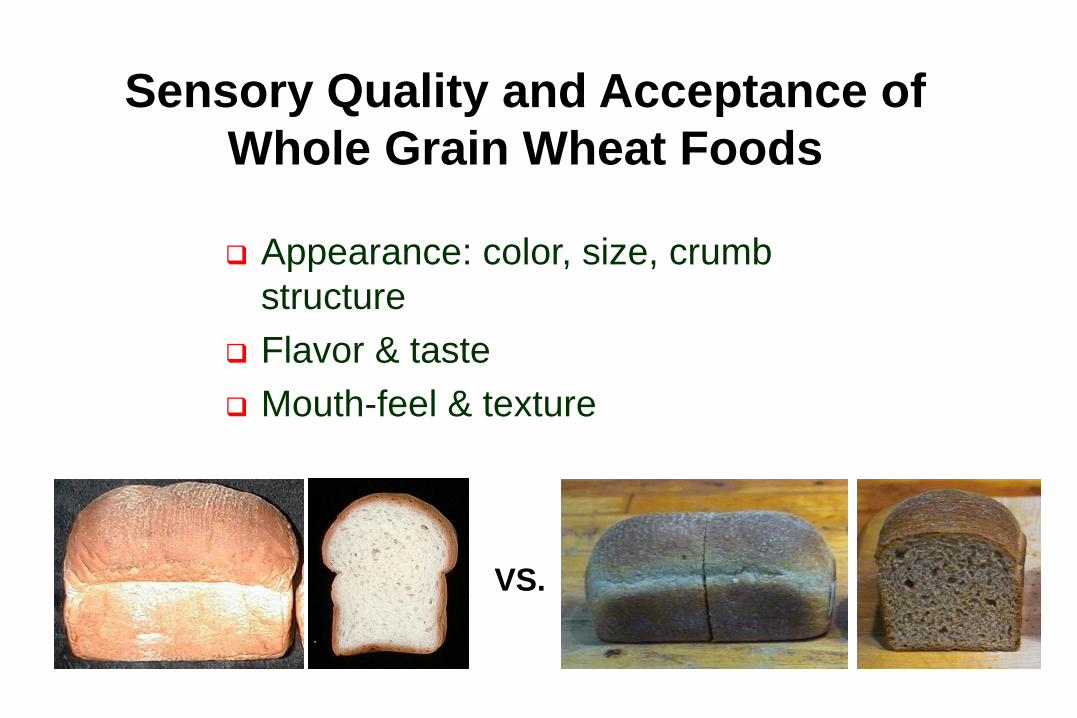
Appearance: color, size, crumb
structure
Flavor & taste
Mouth-feel & texture
Sensory Quality and Acceptance of
Whole Grain Wheat Foods
VS.
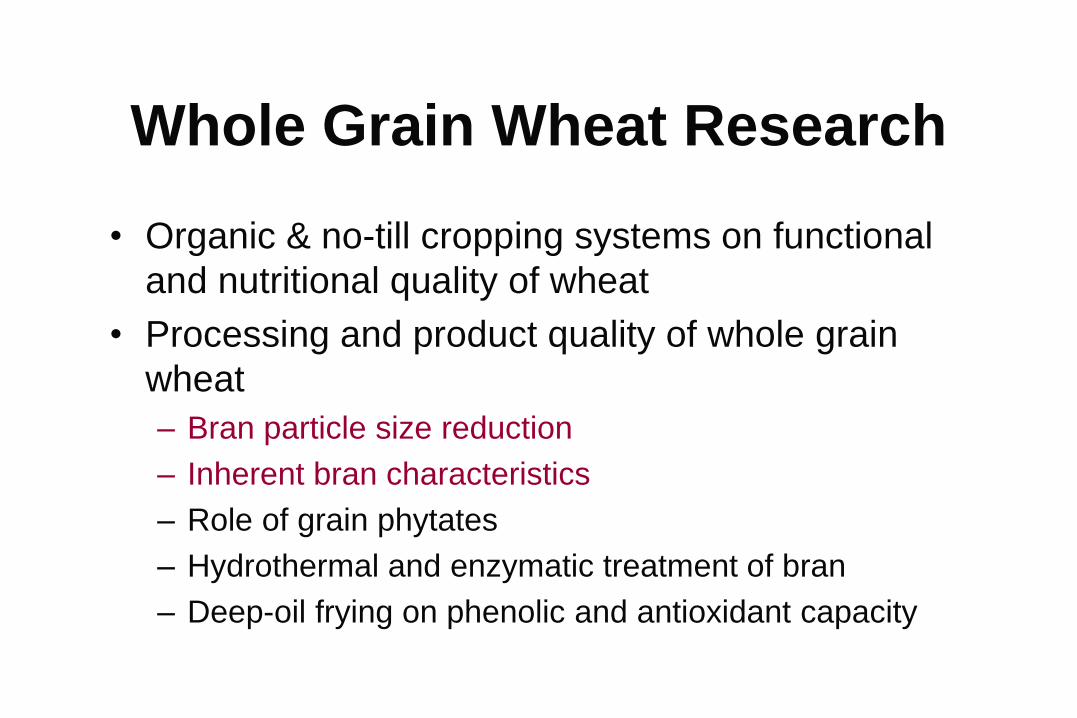
Whole Grain Wheat Research
• Organic & no-till cropping systems on functional
and nutritional quality of wheat
• Processing and product quality of whole grain
wheat
– Bran particle size reduction
– Inherent bran characteristics
– Role of grain phytates
– Hydrothermal and enzymatic treatment of bran
– Deep-oil frying on phenolic and antioxidant capacity

0.2
0.3
0.4
0.5
0.6
HW HR
Co
hesiv
en
ess o
f B
read
Cru
mb
Coarse Medium Fine
Bran Particle Size vs. Bread Crumb Texture &
Starch Retrogradation
2.0
2.2
2.4
2.6
2.8
3.0
HW HR
Retr
og
rad
ati
on
En
thalp
y (
J/g
)
Coarse Medium Fine
a a
b
a
b b
b
a a
c
b a
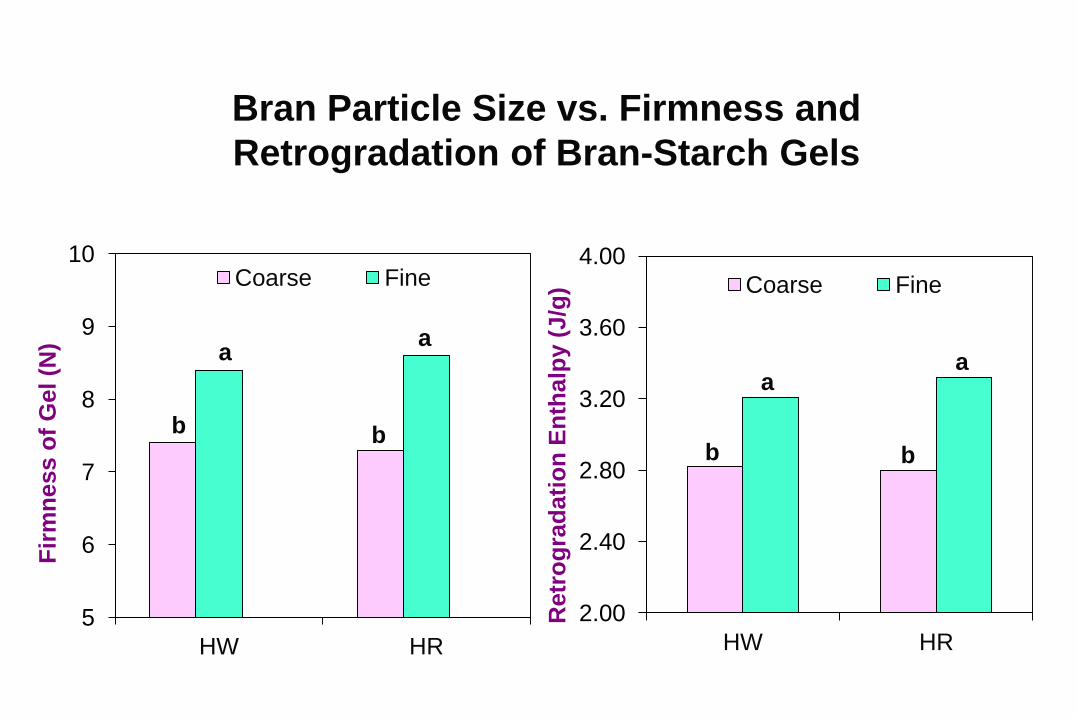
5
6
7
8
9
10
HW HR
Fir
mn
ess o
f G
el (N
)
Coarse Fine
Bran Particle Size vs. Firmness and
Retrogradation of Bran-Starch Gels
2.00
2.40
2.80
3.20
3.60
4.00
HW HR
Retr
og
rad
ati
on
En
thalp
y (
J/g
) Coarse Fine
a
b
a
b b
a
b
a
Bran Characteristics and Bread-Baking
Quality of Whole Grain Wheat Flour
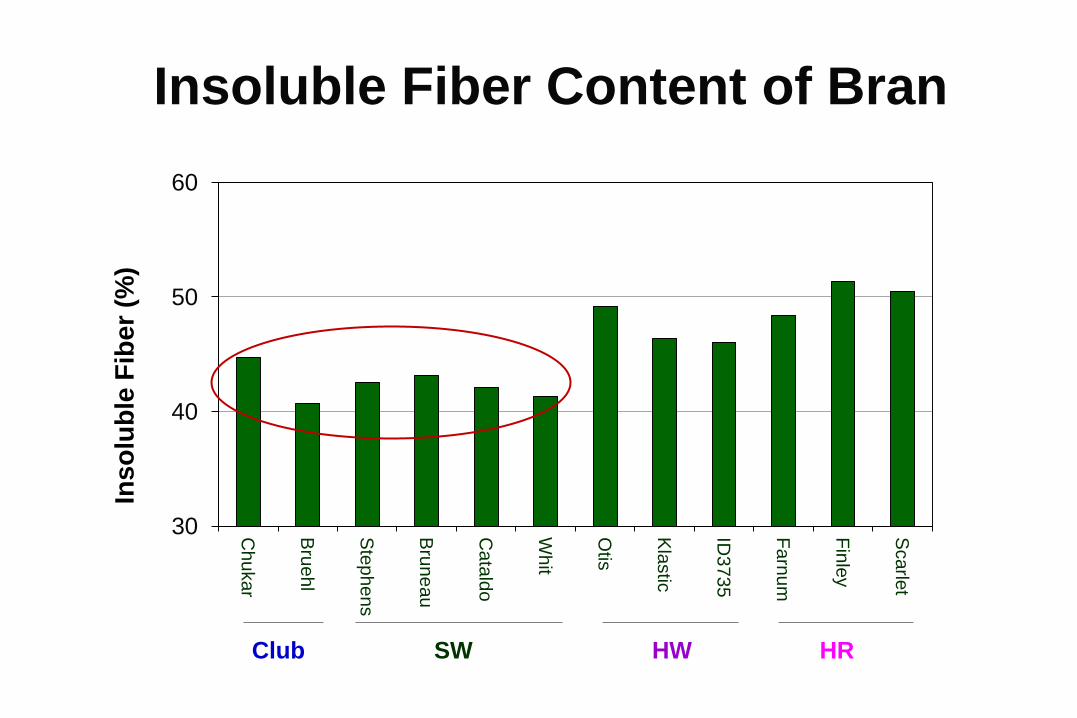
30
40
50
60
Ch
uka
r
Bru
ehl
Ste
ph
en
s
Bru
neau
Ca
tald
o
Wh
it
Otis
Kla
stic
ID3
73
5
Fa
rnu
m
Fin
ley
Sca
rlet
Inso
lub
le F
iber
(%)
Insoluble Fiber Content of Bran
Club HW HR SW
8
10
12
14
16
18
20
Ch
uka
r
Bru
ehl
Ste
ph
en
s
Bru
neau
Ca
tald
o
Wh
it
Otis
Kla
stic
ID3
73
5
Fa
rnu
m
Fin
ley
Sca
rlet
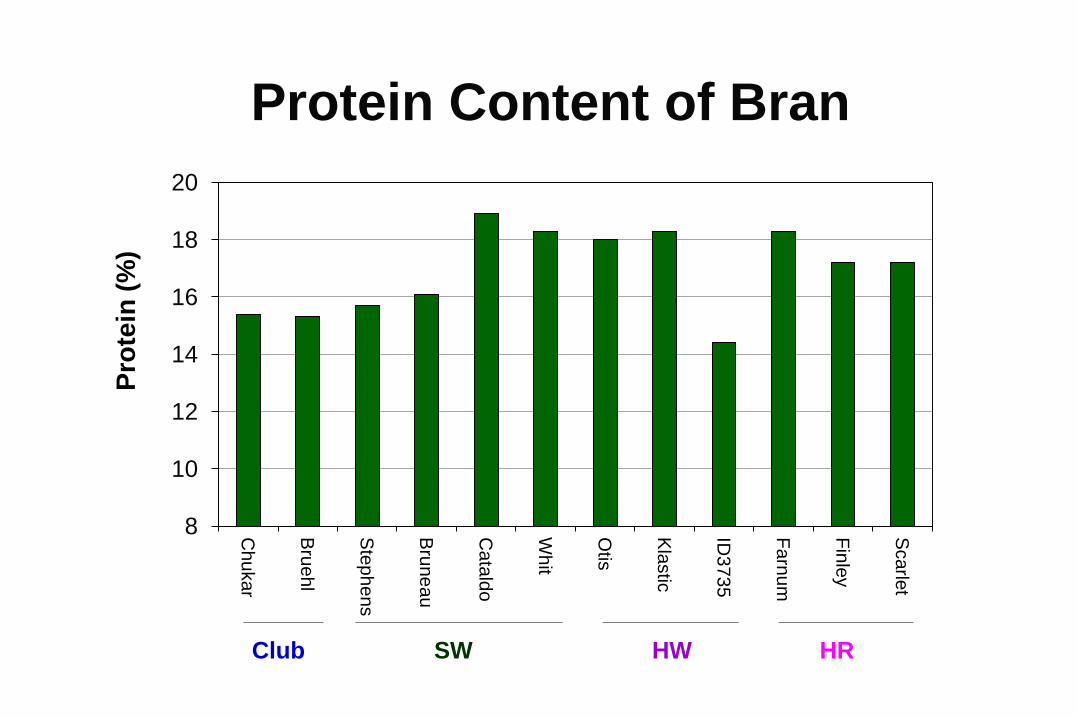
Pro
tein
(%
) Protein Content of Bran
Club HW HR SW
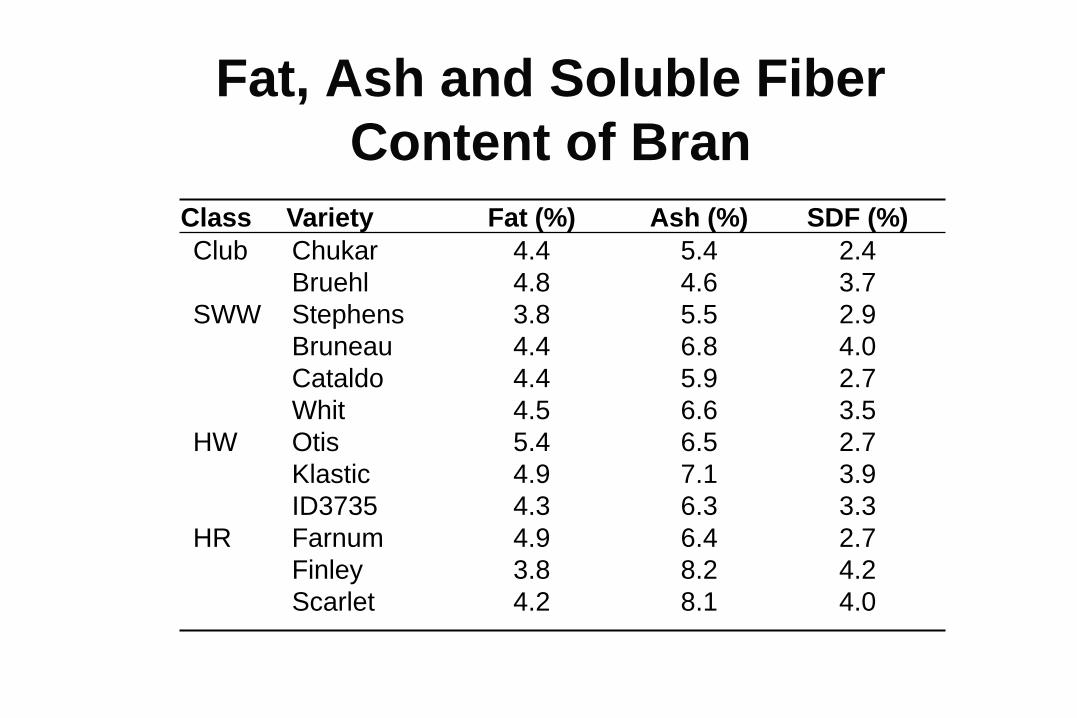
Class Variety Fat (%) Ash (%) SDF (%)
Club
SWW
HW
HR
Chukar
Bruehl
Stephens
Bruneau
Cataldo
Whit
Otis
Klastic
ID3735
Farnum
Finley
Scarlet
4.4
4.8
3.8
4.4
4.4
4.5
5.4
4.9
4.3
4.9
3.8
4.2
5.4
4.6
5.5
6.8
5.9
6.6
6.5
7.1
6.3
6.4
8.2
8.1
2.4
3.7
2.9
4.0
2.7
3.5
2.7
3.9
3.3
2.7
4.2
4.0
Fat, Ash and Soluble Fiber
Content of Bran
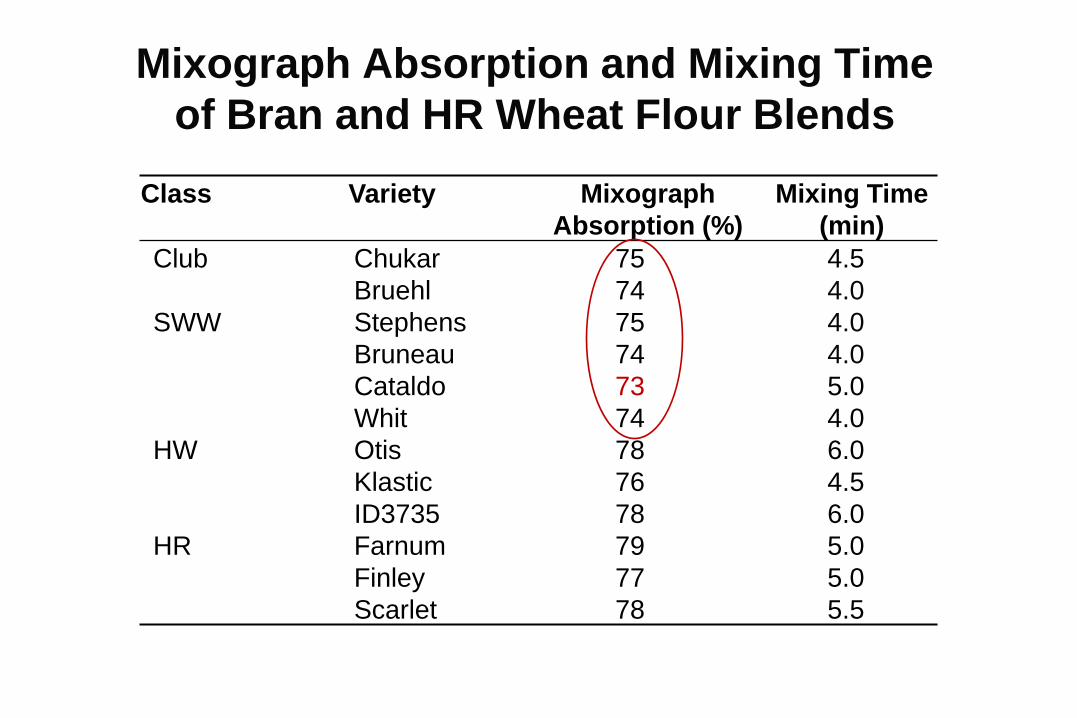
Class Variety Mixograph
Absorption (%)
Mixing Time
(min)
Club
SWW
HW
HR
Chukar
Bruehl
Stephens
Bruneau
Cataldo
Whit
Otis
Klastic
ID3735
Farnum
Finley
Scarlet
75
74
75
74
73
74
78
76
78
79
77
78
4.5
4.0
4.0
4.0
5.0
4.0
6.0
4.5
6.0
5.0
5.0
5.5
Mixograph Absorption and Mixing Time
of Bran and HR Wheat Flour Blends
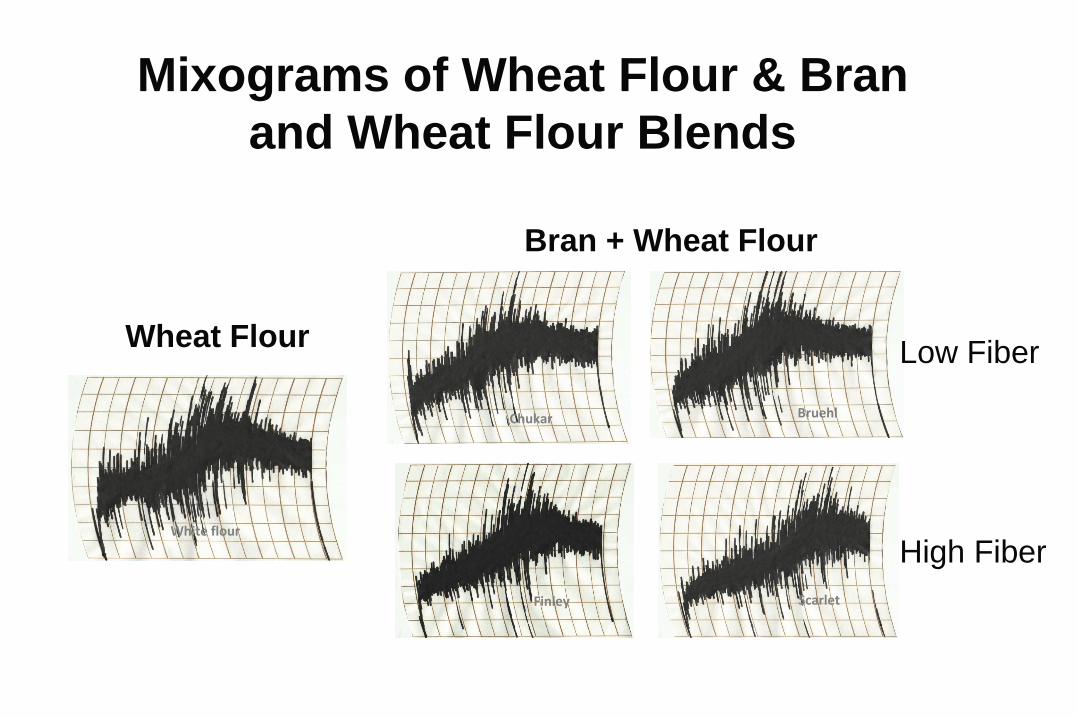
White flour
Chukar Bruehl
Scarlet Finley
Wheat Flour
Bran + Wheat Flour
Mixograms of Wheat Flour & Bran
and Wheat Flour Blends
Low Fiber
High Fiber

400
500
600
700
800
900
Ch
uka
r
Bru
ehl
Ste
ph
en
s
Bru
neau
Ca
tald
o
Wh
it
Otis
Kla
stic
ID3
73
5
Fa
rnu
m
Fin
ley
Scarle
t
Lo
af
Vo
lum
e (
mL
) Loaf Volume of Bread Baked From Bran
and HR Wheat Flour Blends
Club HW HR SW
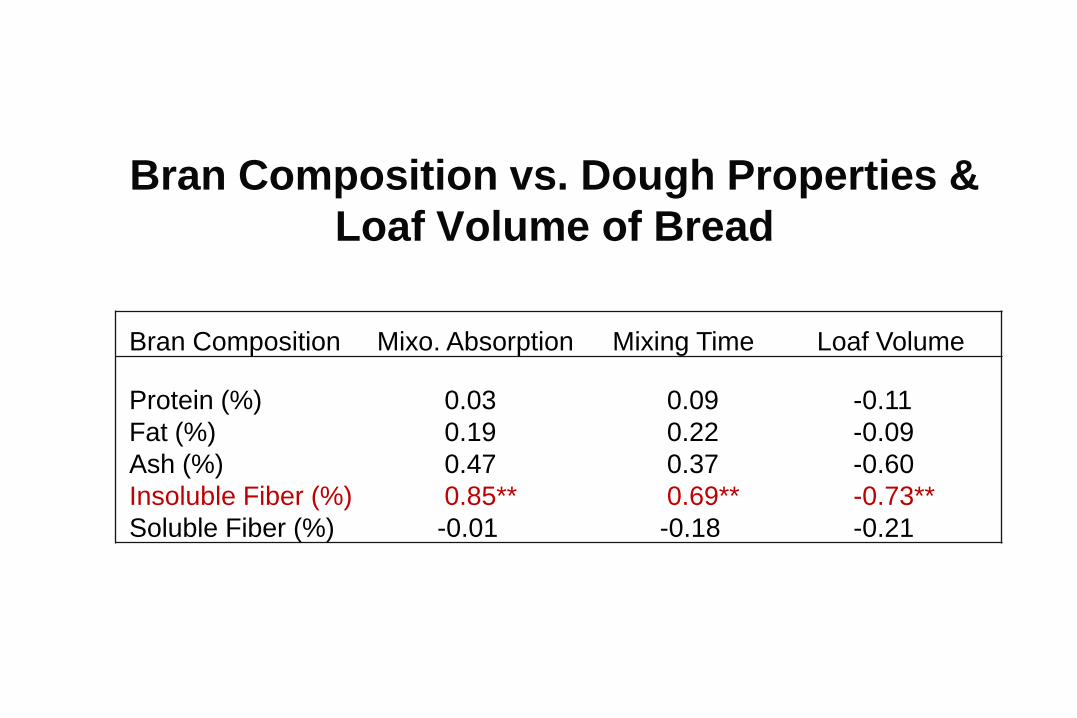
Bran Composition vs. Dough Properties &
Loaf Volume of Bread
Bran Composition Mixo. Absorption Mixing Time Loaf Volume
Protein (%)
Fat (%)
Ash (%)
Insoluble Fiber (%)
Soluble Fiber (%)
0.03
0.19
0.47
0.85**
-0.01
0.09
0.22
0.37
0.69**
-0.18
-0.11
-0.09
-0.60
-0.73**
-0.21

Grant Funding
Washington Grain Commission
USDA-NIFA-OREI
BioAg Program-WSU
Shepherd’s Grain
RDA-NICS-Korea
Acknowledgement
Cereal Biochemistry
Program-WSU
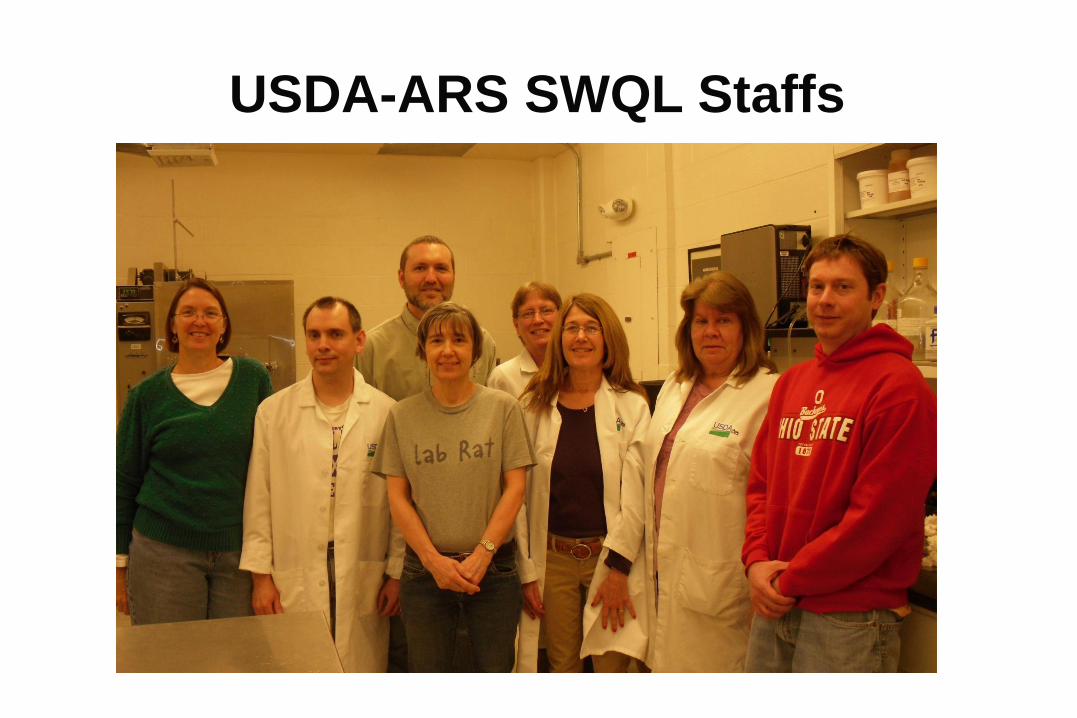
USDA-ARS SWQL Staffs
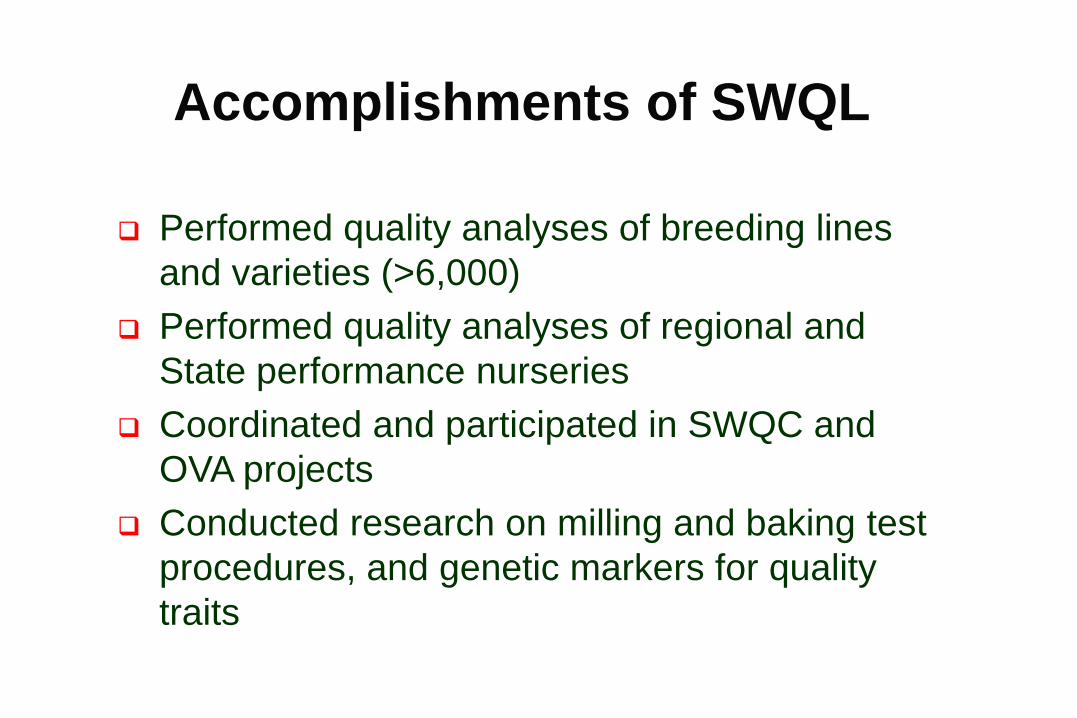
Accomplishments of SWQL
Performed quality analyses of breeding lines
and varieties (>6,000)
Performed quality analyses of regional and
State performance nurseries
Coordinated and participated in SWQC and
OVA projects
Conducted research on milling and baking test
procedures, and genetic markers for quality
traits
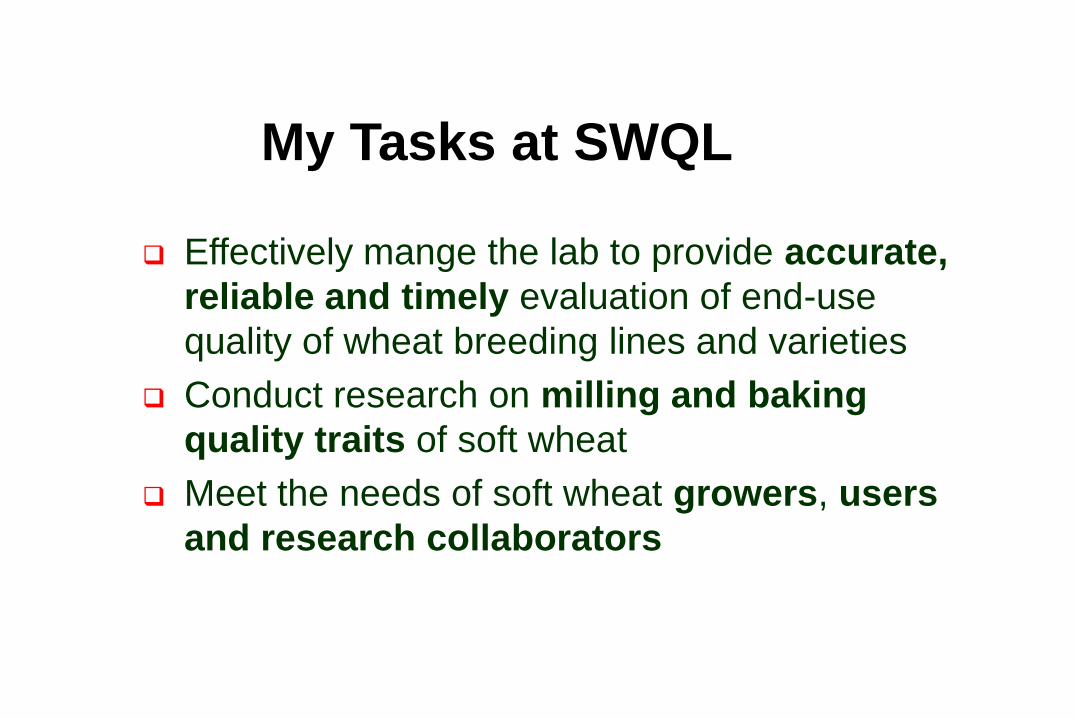
Effectively mange the lab to provide accurate,
reliable and timely evaluation of end-use
quality of wheat breeding lines and varieties
Conduct research on milling and baking
quality traits of soft wheat
Meet the needs of soft wheat growers, users
and research collaborators
My Tasks at SWQL
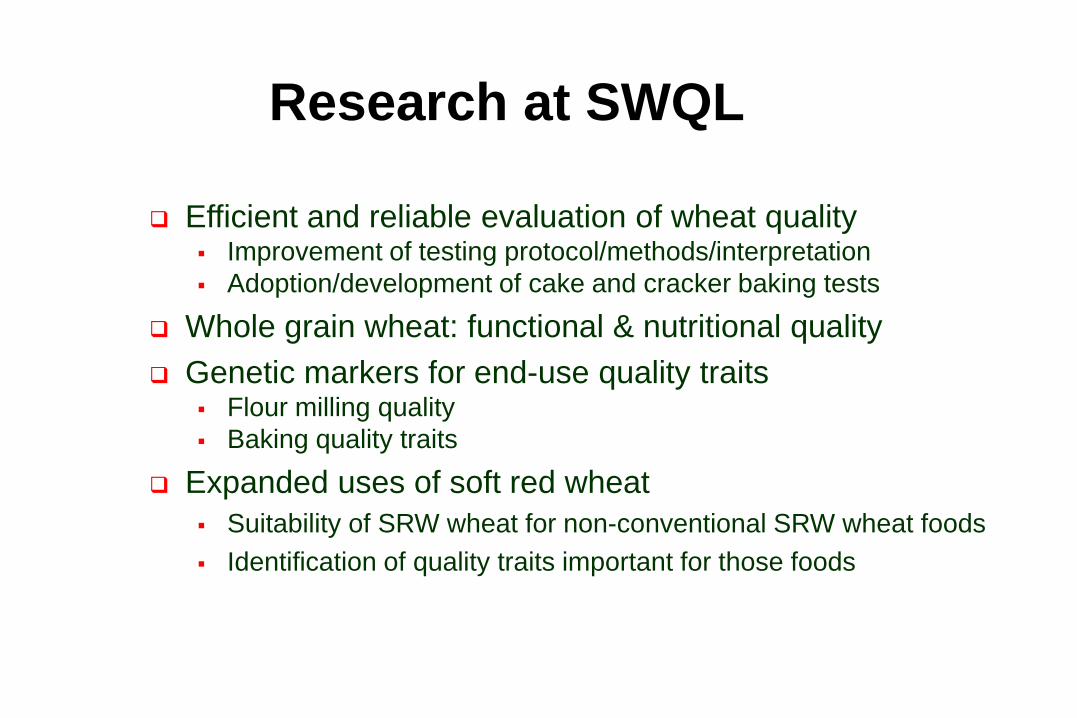
Efficient and reliable evaluation of wheat quality Improvement of testing protocol/methods/interpretation
Adoption/development of cake and cracker baking tests
Whole grain wheat: functional & nutritional quality
Genetic markers for end-use quality traits Flour milling quality
Baking quality traits
Expanded uses of soft red wheat
Suitability of SRW wheat for non-conventional SRW wheat foods
Identification of quality traits important for those foods
Research at SWQL
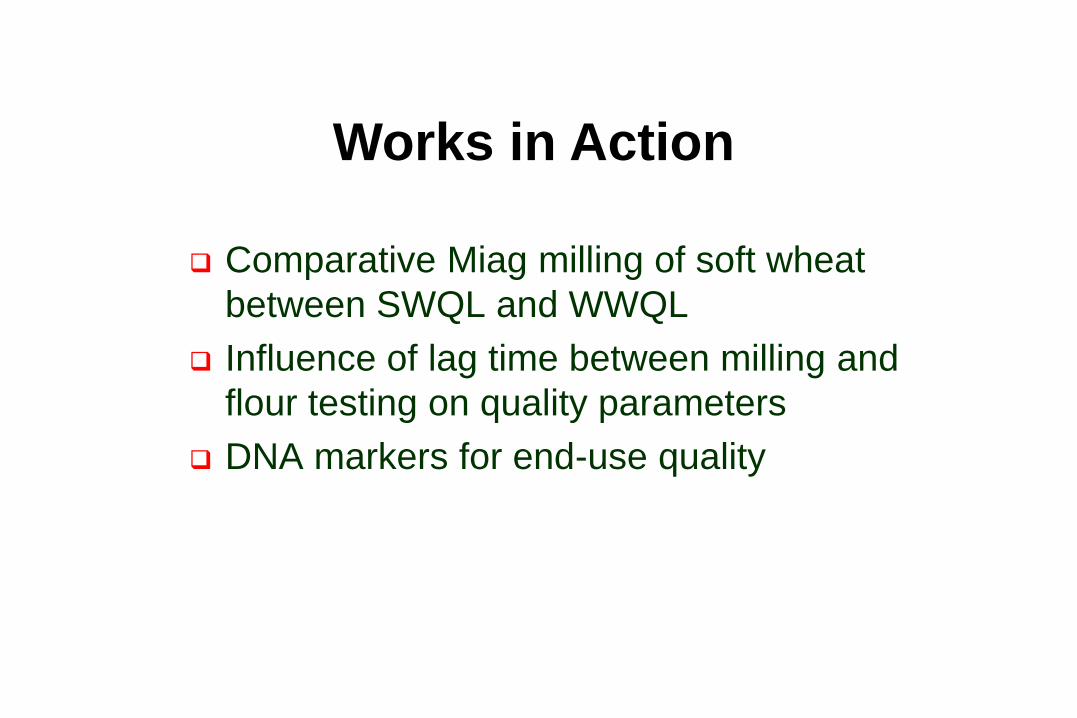
Comparative Miag milling of soft wheat
between SWQL and WWQL
Influence of lag time between milling and
flour testing on quality parameters
DNA markers for end-use quality
Works in Action