End-gas autoignition and detonation development in a ...
10
Combustion and Flame 162 (2015) 4102–4111 Contents lists available at ScienceDirect Combustion and Flame journal homepage: www.elsevier.com/locate/combustflame End-gas autoignition and detonation development in a closed chamber Hao Yu, Zheng Chen ∗ SKLTCS, Department of Mechanics and Engineering Science, College of Engineering, Peking University, Beijing 100871, China article info Article history: Received 9 March 2015 Revised 24 August 2015 Accepted 25 August 2015 Available online 16 September 2015 Keywords: Autoignition Pressure wave Detonation End-gas Hydrogen/air abstract It is generally accepted that knock in spark ignition engines might be caused by end-gas autoignition. How- ever, the detailed mechanism for autoignition-induced pressure oscillation and detonation development is still not well understood. This work studied end-gas autoignition and detonation development in a closed chamber using 1D simulation. Stoichiometric hydrogen/air mixture at different initial temperatures and pres- sures was considered and detailed chemistry was included in simulation. The objectives were to identify possible modes of end-gas combustion and to understand the mechanism of autoignition-induced pressure wave and detonation development. Depending on the chamber length as well as the initial temperature and pressure, there are three modes of end-gas combustion: normal flame propagation without autoignition, autoignition without detonation development, and detonation development. The amplitude of pressure os- cillation was found to be determined by the mode of end-gas autoignition: autoignition can induce high amplitude of pressure oscillation similar to conventional knock; and detonation development can cause ex- tremely high amplitude of pressure oscillation similar to super-knock. It was shown that autoignition and detonation development can be induced by increasing the initial temperature, initial pressure, or chamber length. The evolution of states of different flow particles was tracked and the combustion mode was found to switch from constant-pressure to constant-volume when autoignition occurs. The coupling between pres- sure wave and chemical reaction was analyzed and the mechanism for autoignition front acceleration and detonation development was investigated. Moreover, autoignition in end-gas with different values of igni- tion progress was simulated. It was demonstrated that high reactivity of end-gas promotes autoignition and detonation development. © 2015 The Combustion Institute. Published by Elsevier Inc. All rights reserved. 1. Introduction Downsized and boosted direct injection spark ignition engines (SIE) have the advantages of higher thermal efficiency and higher power density compared to traditional gasoline engine with large displacement. Therefore, it can be used to reduce fuel consumption. However, in highly-boosted gasoline engines, there is stronger ten- dency of knock when the premixture is compressed to higher temper- ature and pressure [1–4]. When knock occurs, high-frequency pres- sure oscillation can cause severe engine damage. It is generally accepted that knock in spark ignition engines is caused by end-gas autoignition [5–7]. When premixed flame prop- agates in a closed chamber, the unburned gas (end-gas) is progres- sively compressed and its temperature and pressure continuously in- crease. Under appropriate conditions, autoignition occurs in end-gas before the propagating flame can consume the fuel. Heat release dur- ing local autoignition generates pressure pulse/wave which propa- gates across the system. The unburned mixture immediately behind ∗ Corresponding author. E-mail address: [email protected], [email protected] (Z. Chen). the pressure wave might be compressed to react rapidly and, in turn, further enhance the pressure wave [4, 5, 7]. A detonation develops if there is a coherent coupling between pressure wave and local re- action/autoignition [8, 9]. The pressure wave propagates back-and- forth inside the closed chamber since it is reflected on the bound- ary walls. Consequently, high-frequency pressure oscillation or knock occurs. In the literature, there are extensive studies on end-gas au- toignition since it is closely related to engine knock. Theoretically, Strickland-Constable [59] and Livengood and Wu [10] studied flame propagation in an auto-ignitive mixture and proposed an integral method to predict the occurrence of autoignition; Zel’dovich [8, 11] first analyzed different modes of reaction front propagation caused by autoignition in a mixture with non-uniform reactivity; Bradley and coworkers [3, 6, 12–15] further investigated autoignition from a hot spot and proposed an operational peninsula in the plot of two non- dimensional parameters, namely the normalized temperature gradi- ent and the ratio of acoustic time to excitation time (the operational peninsula can be used to determine the critical conditions for deto- nation development); Kagan and Sivashinsky [16, 17] analyzed end- gas autoignition in a one-dimensional (1D) closed chamber and pro- posed a 0D model to predict autoignition. However, one-step global http://dx.doi.org/10.1016/j.combustflame.2015.08.018 0010-2180/© 2015 The Combustion Institute. Published by Elsevier Inc. All rights reserved.
Transcript of End-gas autoignition and detonation development in a ...

Combustion and Flame 162 (2015) 4102–4111
Contents lists available at ScienceDirect
Combustion and Flame
journal homepage: www.elsevier.com/locate/combustflame
End-gas autoignition and detonation development in a closed chamber
Hao Yu, Zheng Chen∗
SKLTCS, Department of Mechanics and Engineering Science, College of Engineering, Peking University, Beijing 100871, China
a r t i c l e i n f o
Article history:
Received 9 March 2015
Revised 24 August 2015
Accepted 25 August 2015
Available online 16 September 2015
Keywords:
Autoignition
Pressure wave
Detonation
End-gas
Hydrogen/air
a b s t r a c t
It is generally accepted that knock in spark ignition engines might be caused by end-gas autoignition. How-
ever, the detailed mechanism for autoignition-induced pressure oscillation and detonation development is
still not well understood. This work studied end-gas autoignition and detonation development in a closed
chamber using 1D simulation. Stoichiometric hydrogen/air mixture at different initial temperatures and pres-
sures was considered and detailed chemistry was included in simulation. The objectives were to identify
possible modes of end-gas combustion and to understand the mechanism of autoignition-induced pressure
wave and detonation development. Depending on the chamber length as well as the initial temperature and
pressure, there are three modes of end-gas combustion: normal flame propagation without autoignition,
autoignition without detonation development, and detonation development. The amplitude of pressure os-
cillation was found to be determined by the mode of end-gas autoignition: autoignition can induce high
amplitude of pressure oscillation similar to conventional knock; and detonation development can cause ex-
tremely high amplitude of pressure oscillation similar to super-knock. It was shown that autoignition and
detonation development can be induced by increasing the initial temperature, initial pressure, or chamber
length. The evolution of states of different flow particles was tracked and the combustion mode was found
to switch from constant-pressure to constant-volume when autoignition occurs. The coupling between pres-
sure wave and chemical reaction was analyzed and the mechanism for autoignition front acceleration and
detonation development was investigated. Moreover, autoignition in end-gas with different values of igni-
tion progress was simulated. It was demonstrated that high reactivity of end-gas promotes autoignition and
detonation development.
© 2015 The Combustion Institute. Published by Elsevier Inc. All rights reserved.
t
f
i
a
f
a
o
t
S
p
m
fi
b
c
s
d
e
1. Introduction
Downsized and boosted direct injection spark ignition engines
(SIE) have the advantages of higher thermal efficiency and higher
power density compared to traditional gasoline engine with large
displacement. Therefore, it can be used to reduce fuel consumption.
However, in highly-boosted gasoline engines, there is stronger ten-
dency of knock when the premixture is compressed to higher temper-
ature and pressure [1–4]. When knock occurs, high-frequency pres-
sure oscillation can cause severe engine damage.
It is generally accepted that knock in spark ignition engines is
caused by end-gas autoignition [5–7]. When premixed flame prop-
agates in a closed chamber, the unburned gas (end-gas) is progres-
sively compressed and its temperature and pressure continuously in-
crease. Under appropriate conditions, autoignition occurs in end-gas
before the propagating flame can consume the fuel. Heat release dur-
ing local autoignition generates pressure pulse/wave which propa-
gates across the system. The unburned mixture immediately behind
∗ Corresponding author.
E-mail address: [email protected], [email protected] (Z. Chen).
p
n
g
p
http://dx.doi.org/10.1016/j.combustflame.2015.08.018
0010-2180/© 2015 The Combustion Institute. Published by Elsevier Inc. All rights reserved.
he pressure wave might be compressed to react rapidly and, in turn,
urther enhance the pressure wave [4, 5, 7]. A detonation develops
f there is a coherent coupling between pressure wave and local re-
ction/autoignition [8, 9]. The pressure wave propagates back-and-
orth inside the closed chamber since it is reflected on the bound-
ry walls. Consequently, high-frequency pressure oscillation or knock
ccurs.
In the literature, there are extensive studies on end-gas au-
oignition since it is closely related to engine knock. Theoretically,
trickland-Constable [59] and Livengood and Wu [10] studied flame
ropagation in an auto-ignitive mixture and proposed an integral
ethod to predict the occurrence of autoignition; Zel’dovich [8, 11]
rst analyzed different modes of reaction front propagation caused
y autoignition in a mixture with non-uniform reactivity; Bradley and
oworkers [3, 6, 12–15] further investigated autoignition from a hot
pot and proposed an operational peninsula in the plot of two non-
imensional parameters, namely the normalized temperature gradi-
nt and the ratio of acoustic time to excitation time (the operational
eninsula can be used to determine the critical conditions for deto-
ation development); Kagan and Sivashinsky [16, 17] analyzed end-
as autoignition in a one-dimensional (1D) closed chamber and pro-
osed a 0D model to predict autoignition. However, one-step global

H. Yu, Z. Chen / Combustion and Flame 162 (2015) 4102–4111 4103
r
c
i
v
c
t
d
c
d
i
t
t
s
p
i
c
t
t
w
t
t
b
i
i
e
t
[
a
t
e
w
d
t
v
p
i
u
f
e
i
a
t
d
f
a
g
s
n
o
c
r
b
n
o
a
t
t
a
b
u
a
s
a
Fig. 1. The initial and boundary conditions used in the simulation of flame propagation
in a 1D closed chamber with the length of L.
1
c
w
b
s
t
r
t
p
t
f
i
2
2
t
t
t
c
f
t
l
T
a
k
i
w
P
c
p
fl
o
T
A
g
2
s
u
t
e
eaction was usually assumed in theoretical analysis. Since compli-
ated chemical kinetics is involved in ignition process, detailed chem-
stry needs to be considered for end-gas autoignition.
Experimentally, high speed photograph technology was used to
isualize end-gas autoignition in engine (e.g., [2, 18, 19]) and rapid
ompression machine (RCM) [4, 20, 21]. Inside the engine and RCM,
he flame front and flow are three-dimensional and thereby it is
ifficult to understand the interaction between pressure wave and
hemical reaction during the autoignition process. To overcome this
ifficulty, Nagano et al. [22] and Qi et al. [23] designed quasi 1D exper-
ment using a closed tube-shaped vessel to study end-gas autoigni-
ion and pressure oscillation. In these experiments, end-gas autoigni-
ion was successfully observed. However, the process is not truly 1D
ince there is strong flame-boundary layer interaction during flame
ropagation in a tube. Consequently, such experiments still have lim-
tations in terms of understanding autoignition and pressure wave-
hemistry interaction. (The truly 1D experiment for end-gas autoigni-
ion is to use a spherical bomb: first the premixture is preheated
o high-enough temperature; then the mixture is centrally ignited
hich results in an outwardly propagating spherical flame; finally au-
oignition occurs in the unburned mixture after it is compressed by
he outwardly propagating spherical flame. However, the spherical
omb might be damaged by strong pressure oscillation or detonation
nduced by end-gas autoignition.)
Numerically, multi-dimensional simulations were conducted to
nvestigate the end-gas autoignition process. For examples, Pan
t al. [24, 25] conducted 2D simulations to identify distinct au-
oignition modes and their contribution to knock; Liberman et al.
26, 27] conducted 2D and 3D simulations to examine the onset of
utoignition; Wang et al. [28] conducted 3D simulations to study
he coupling between pressure wave and chemical reaction; Wei
t al. [29] conducted 2D simulations to assess the effects of pressure
ave on end-gas autoignition; and Chen, Yoo and coworkers con-
ucted 2D simulations to assess the effects of turbulence on autoigni-
ion (e.g., [30–33]). Similar to experiments, the autoignition process is
ery complicated in multi-dimensional simulations. Moreover, com-
licated chemistry involved in autoignition is difficult to be included
n multi-dimensional simulations. Therefore, 1D simulations were
sed to study the autoignition process: Ju et al. [34] identified dif-
erent flame regimes of ignition in n-heptane/air mixtures; Martz
t al. [35, 36] demonstrated that the autoignition process is chem-
cally controlled and diffusion can be neglected; Zhang [37] ex-
mined the effects of thermal stratification on autoignition within
he negative-temperature coefficient (NTC) regime; Dai et al. [38]
emonstrated that different autoignition modes can be initialized
rom a cool spot when the initial temperature is in the NTC regime;
nd Terashima and Koshi [39] investigated the strong pressure wave
enerated by end-gas autoignition. However, unlike the present
tudy, detonation development caused by end-gas autoignition was
ot identified in these 1D studies except our recent work [38].
This work studied end-gas autoignition and detonation devel-
pment in a closed chamber using 1D simulation with detailed
hemistry. The interaction between pressure wave and chemical
eaction was investigated. The objectives were to identify possi-
le modes of end-gas combustion and to understand the mecha-
ism of autoignition-induced pressure wave and detonation devel-
pment. While multidimensional simulations describe the end-gas
utoignition process similar to that occurs in practice, it is difficult
o explain the detailed structure (evolution of the distributions of
emperature, pressure and species concentrations) of autoignition
nd detonation development processes which might be complicated
y turbulent flow and flame-boundary layer interaction. A 1D sim-
lation was conducted here since detailed structure of autoignition
nd detonation development can be readily obtained and the pres-
ure wave-chemistry interaction can be isolated from turbulent flow
nd flame-boundary layer interaction.
It should be emphasized that the in the present work we used
D simulations to study the interaction between pressure wave and
hemical reaction and the mechanism of detonation development,
hich are related to knock in engines. However, engine knock cannot
e fully represented by simulations in the present work since our 1D
imulations have the following limitations: (1) 3D effects including
urbulence, boundary layer and wall heat transfer (which play major
oles in engine knock) were not considered in the present 1D compu-
ation; (2) temperature inhomogeneity (local hot-spot) occurring in
ractical engines was not taken into account and the initial tempera-
ure of end-gas was assumed to be uniformly distributed; and (3) the
uel, initial temperature and pressure, domain dimension considered
n the present study were not prototypic of an engine.
. Model and numerical methods
.1. Model
We conducted 1D simulation for stoichiometric hydrogen/air mix-
ure since the chemical mechanism for hydrogen oxidation is rela-
ively well established and it has relatively small size. In the model,
he premixed H2/air flame propagates toward the right side in a 1D
losed chamber; and the end-gas between the propagating flame
ront and the right wall is continuously compressed and thereby au-
oignition and detonation might occur in the end-gas.
The computational domain is 0 ≤ x ≤ L, where L is the chamber
ength. The initial and boundary conditions are presented in Fig. 1.
he initial temperature and pressure of end-gas are shown to be T0
nd P0, respectively. The propagating flame was initialized by a hot
ernel close to the left boundary (i.e., 0 ≤ x ≤ xi ≈ 0.5 mm). The
nitial distributions for temperature and mass fraction of all species
ere from PREMIX [40] results for stoichiometric H2/air at T0 and
0. In PREMIX [40], finite-rate chemical kinetic model and multi-
omponent molecular transport model were considered for a freely-
ropagating, adiabatic, planar flame. As shown in Fig. 1, initially the
ow speed is zero (i.e., u = 0) everywhere and the initial pressure
f P0 is uniformly distributed in 0 ≤ x ≤L. The initial temperature of
0 is uniformly distributed outside of the hot kernel (i.e., xi ≤ x ≤ L).
t both boundaries (i.e., x = 0 and x = L), zero flow speed and zero
radients of temperature and mass fractions are enforced.
.2. Numerical methods
The transient flame propagation and autoignition process was
imulated using the in-house code A-SURF [38, 41, 42]. The finite vol-
me method was used in A-SURF to solve the conservation equa-
ions for 1D compressible flow with multi-components. The time
volution of the stiff reaction term was separated from that of the

4104 H. Yu, Z. Chen / Combustion and Flame 162 (2015) 4102–4111
Table 1
Typical cases considered for stoichiometric hydrogen/air in a 1D closed chamber.
Case Size L Initial T0 and P0 Equilibrium Te and Pe Observation
1 2.0 cm 900 K, 10 atm 3078 K, 30.0 atm No autoignition, no detonation development
2 2.0 cm 1000 K, 10 atm 3110 K, 27.3 atm Autoignition, no detonation development
3 2.0 cm 900 K, 20 atm 3130 K, 60.7 atm Autoignition, no detonation development
4 4.0 cm 900 K, 10 atm 3078 K, 30.0 atm Autoignition, no detonation development
5 2.0 cm 1100 K, 10 atm 3140 K, 25.2 atm Detonation development
6 2.0 cm 1000 K, 40 atm 3217 K, 112.3 atm Detonation development
7 20 cm 1000 K, 10 atm 3110 K, 27.3 atm Detonation development
P(atm)
10
15
20
25
30 6
12
3
4
5
x (cm)
Q(J/m
3s)
0 0.5 1 1.5 2
1010
1011
1012
1013
1 2 3 4 5T(K)
1000
1500
2000
2500
3000
1 2 3 4 5
6
Fig. 2. Temporal evolution of temperature, pressure, and heat release rate distribu-
tions for case 1 with L = 2 cm, T0 = 900 K and P0 = 10 atm. The time sequence from
line #1 to line #6 is: 1—0 μs, 2—120.36 μs, 3—240.97 μs, 4—361.44 μs, 5—481.85 μs,
and 6—602.36 μs.
3
T
r
t
a
t
d
s
m
s
p
p
r
t
p
#
f
w
f
g
i
c
c
t
l
w
g
convection and diffusion terms by using the Strang splitting
fractional-step procedure [43]. In the first and third half fractional
step, the non-reactive flow was solved. The temporal integration,
convective flux, and diffusive flux were calculated, respectively, us-
ing the Runge–Kutta, MUSCL-Hancock (with MINBEE flux limiter),
and central difference schemes. In the second fractional step, the
chemistry was solved using the VODE solver [44]. The detailed hy-
drogen mechanism developed by Li et al. [45] was used in simula-
tion. CHEMKIN packages [46] were incorporated into A-SURF to cal-
culate the thermodynamic and transport properties as well as the
reaction rates. Dynamically adaptive mesh was used to accurately
resolve the flame front, pressure wave, shock wave and detonation,
which were always fully covered by the finest mesh with the size
of 0.8 μm. The corresponding time step was �t = 10−10 s since
explicit integration method was used and the Courant–Friedrichs–
Lewy (CFL) number was maintained to be less than 0.5. A-SURF
was successfully used in our previous studies on ignition and flame
propagation (e.g., [47–50]). In our recent study [38], it was shown
that A-SURF can accurately capture shock wave and detonation
propagation. The details on governing equations, numerical scheme
and code validation can be found in Refs. [38, 41, 42] (see the
Supplementary Documents of [38, 42]) and thereby are not re-
peated here. Besides, the numerical resolution and grid indepen-
dence were shown in the Supplementary Material of the present
paper.
In simulation, the flow particles at different initial locations were
tracked and their thermal states were recorded [51]. The position of a
flow particle was first updated by its current flow speed (evaluated at
the present time of tn) multiplying the time step size of �t = 10−10 s;
then the thermal states and flow speed of this particle at tn+�t were
obtained from linear extrapolation of corresponding values (evalu-
ated at tn+�t) at its two neighboring grids.
3. Results and discussion
We conducted simulations for different values of chamber length
L, initial temperature T0, and initial pressure P0. Only the results for
seven typical cases were presented and discussed below. The val-
ues of (L, T0, P0) for these cases were summarized in Table 1, in
which the equilibrium temperature Te and pressure Pe were calcu-
lated under the conditions of constant volume and constant inter-
nal energy. Three modes of end-gas combustion were identified and
discussed below: (1) normal flame propagation without autoignition,
(2) autoignition without detonation development, and (3) detonation
development.
As shown in Table 1, no end-gas autoignition occurs in case 1.
Based on case 1 without end-gas autoignition, increase in tempera-
ture (case 2) or pressure (case 3) or chamber length (case 4) causes
autoignition to happen but there is no detonation development.
Based on case 2 with end-gas autoignition but no detonation, in-
crease in temperature (case 5) or pressure (case 6) or chamber length
(case 7) causes detonation development to happen. Therefore, the
combustion mode of end-gas depends on at least three factors: ini-
tial temperature, initial pressure, and chamber size.
.1. Normal flame propagation without autoignition
For case 1 with relative low initial temperature and pressure of
0 = 900 K and P0 = 10 atm, the ignition delay time of end-gas is
elative long, which makes the Livengood–Wu integral [10] to be less
han unity. Therefore, all the fresh mixture is consumed by the prop-
gating flame front and end-gas autoignition does not happen. The
emporal evolution of temperature, pressure, and heat release rate
istributions for case 1 is plotted in Fig. 2 (the time sequence is de-
cribed for different lines in the figure caption), which indicates nor-
al flame propagation without end-gas autoignition. The pressure is
hown to be nearly uniformly distributed, indicating that constant-
ressure combustion occurs (which will also be demonstrated by the
ressure-specific volume diagram in due course). The maximum heat
elease rate is shown to continuously increase. This is because that
he temperature of unburned gas continuously increases due to com-
ression. For example, in Fig. 2 the unburned gas temperature for line
5 at t = 481.85 μs is 1124 K, which is 224 K higher than that (900 K)
or line #1 at t = 0 μs.
In simulation the flame/autoignition/reaction/detonation front, Xf,
as defined as the position of local peak heat release rate. There-
ore, the absolute propagation speed is S = dXf/dt. The flame propa-
ation speed for case 1 is shown in Fig. 3. It is observed that there
s strong oscillation in flame propagation speed. This oscillation is
aused by pressure wave-induced backward and forward flow in the
losed chamber: negative flow speed reduces the flame propaga-
ion speed when the pressure wave propagates from the right to the
eft; and positive flow speed increases the flame propagation speed
hen the pressure wave is reflected on the left boundary and propa-
ates to the right. Similar observation was found in experiments for

H. Yu, Z. Chen / Combustion and Flame 162 (2015) 4102–4111 4105
xf(cm)
S(m/s)
0 0.5 1 1.5 20
10
20
30
40
50
60
normal flamepropagating to the right
Fig. 3. Change of the flame propagation speed, S = dxf /dt, with the flame front posi-
tion, xf (case 1).
t (μs)
T(K)
P(atm)
0 250 500 750 1000
1000
1500
2000
2500
3000
10
15
20
25
30
P
T
P
T
Fig. 4. Temporal evolution of temperature and pressure at the right boundary
(case 1). For case 1, the equilibrium temperature and pressure are 3078 K and 30.0 atm,
respectively.
h
p
a
i
c
b
a
l
w
p
s
a
w
t
F
t
X
t
a
i
p
p
T
t
a
d
v (m3/kg)
P(atm)
0.2 0.4 0.6 0.8
10
15
20
25
30X0=1.96 cm
X0=1.0 cm
X0=0.1 cm
OA B
C
D E
F G
Fig. 5. The pressure versus specific volume, P-v, diagrams for particles at different ini-
tial positions of X0 = 0.1, 1.0 and 1.96 cm (case 1 with the equilibrium pressure of
30.0 atm). Single arrow denotes constant-pressure combustion process (v increases);
and double arrow denotes compression process (v decreases).
P(atm)
20
30
40
50
32
457 69 8
1
T(K)
1500
2000
2500
3000
3
2 4
57 69 8
1
x (cm)
Q(J/m
3s)
1.2 1.3 1.4 1.5 1.6 1.7 1.8 1.9 2
1012
1013
1014 5
2
3
4
9 678
1
Fig. 6. Temporal evolution of temperature, pressure, and heat release rate distribu-
tions for case 2 with L = 2 cm, T0 = 1000 K and P0 = 10 atm. The time sequence
from line #1 to line #9 is: 1—282.81 μs, 2—320.83 μs, 3—323.68 μs, 4—323.83 μs,
5—323.91 μs, 6—323.99 μs, 7—324.15 μs, 8—324.62 μs, and 9—325.02 μs.
3
t
a
b
c
p
o
r
h
T
r
t
p
F
t
t
F
1
p
t
t
ydrogen/air flame propagating in a closed duct [52]. For the dis-
lacement speed defined as S-uf (where uf is the local flow speed
t the flame front) [53], there is no oscillation and it monotonically
ncreases since the heat release rate continuously increases due to
ompression (see Fig. 2).
The temporal evolution of temperature and pressure at the right
oundary is depicted in Fig. 4. Slight oscillation is observed and the
mplitude of the pressure oscillation is within 2.5 atm. Such oscil-
ation is also caused by the back-and-forth propagation of pressure
ave in the closed chamber. After all the mixture is consumed by the
ropagating flame front (i.e., t > 586 μs), the temperature and pres-
ure are shown to approach to their equilibrium values of Te = 3078 K
nd Pe = 30.0 atm.
The thermal states of flow particles at different initial positions
ere tracked. The P-v (pressure versus specific volume) diagrams for
hree particles initially at X0 = 0.1, 1.0 and 1.96 cm are shown in
ig. 5. Each particle goes through three stages: compression, combus-
ion and compression. For example, for the flow particle initially at
0 = 1.0 cm, it is first compressed along OAD in Fig. 5; then it goes
hrough the flame front along DE; and finally it is compressed again
long EG. When all the mixture is consumed (around points G and C
n Fig. 5), compression and expansion occur due to the back-and-forth
ropagation of pressure wave. It is noticed that all the combustion
rocesses (AB, DE and FG in Fig. 5) occur at nearly constant pressure.
herefore, constant-pressure rather than constant-volume combus-
ion in fact occurs for flame propagation in a closed chamber without
utoignition. This is also indicated by the nearly constant-pressure
istribution at different times shown in Fig. 2.
.2. Autoignition without detonation development
According to the Livengood–Wu integral [10], decrease in igni-
ion delay time (by increasing the initial temperature or pressure)
nd increase in flame propagation time (by increasing the cham-
er length) both help to induce end-gas autoignition. Compared to
ase 1 without autoignition, cases 2–4 have larger initial temperature,
ressure, and chamber length, respectively, and end-gas autoignition
ccurs in these three cases. As shown in the Supplementary Mate-
ial, the Livengood–Wu integral can well predict the autoignition of
ydrogen/air.
When the initial temperature is increased from T0 = 900 K to
0= 1000 K (from case 1 to case 2), the ignition delay time is greatly
educed and thereby end-gas autoignition occurs before all the mix-
ure is consumed by the propagating flame front. The temperature,
ressure, and heat release rate distributions for case 2 are plotted in
ig. 6. Since the pressure wave reflected on the right boundary fur-
her increases the local temperature and reactivity, end-gas autoigni-
ion starts near the right boundary (see line #3 for t = 323.68 μs in
ig. 6). For line #3, the temperature and pressure of end-gas are above
200 K and 20 atm, respectively. The autoignition front is shown to
ropagate to the left and collide with the flame front propagating
o the right at x ≈ 1.52 cm (see line #9 in Fig. 6). It is noted that
he time difference between lines #9 and #3 is 1.34 μs. Therefore,
4106 H. Yu, Z. Chen / Combustion and Flame 162 (2015) 4102–4111
xf(cm)
S(m/s)
S(m/s)
0 0.5 1 1.5 20
20
40
60
80
2000
4000
6000
8000
ignition frontpropagating to the left
normal flamepropagating to the right
1
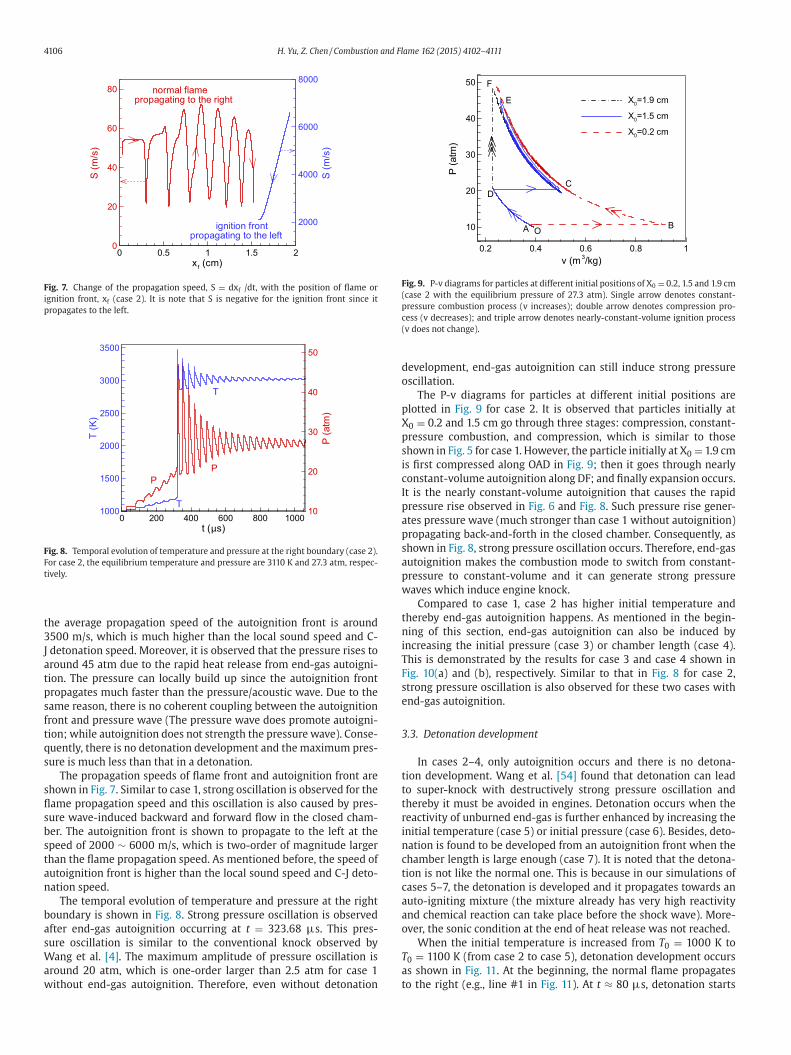
Fig. 7. Change of the propagation speed, S = dxf /dt, with the position of flame or
ignition front, xf (case 2). It is note that S is negative for the ignition front since it
propagates to the left.
t (μs)
T(K)
P(atm)
0 200 400 600 800 10001000
1500
2000
2500
3000
3500
10
20
30
40
50
P
T
P
T
Fig. 8. Temporal evolution of temperature and pressure at the right boundary (case 2).
For case 2, the equilibrium temperature and pressure are 3110 K and 27.3 atm, respec-
tively.
v (m3/kg)
P(atm)
0.2 0.4 0.6 0.8 1
10
20
30
40
50
X0=1.9 cm
X0=1.5 cm
X0=0.2 cm
OA B
C
D
E
F
Fig. 9. P-v diagrams for particles at different initial positions of X0 = 0.2, 1.5 and 1.9 cm
(case 2 with the equilibrium pressure of 27.3 atm). Single arrow denotes constant-
pressure combustion process (v increases); double arrow denotes compression pro-
cess (v decreases); and triple arrow denotes nearly-constant-volume ignition process
(v does not change).
d
o
p
X
p
s
i
c
I
p
a
p
s
a
p
w
t
n
i
T
F
s
e
3
t
t
t
r
i
n
c
t
c
a
a
o
T
a
t
the average propagation speed of the autoignition front is around
3500 m/s, which is much higher than the local sound speed and C-
J detonation speed. Moreover, it is observed that the pressure rises to
around 45 atm due to the rapid heat release from end-gas autoigni-
tion. The pressure can locally build up since the autoignition front
propagates much faster than the pressure/acoustic wave. Due to the
same reason, there is no coherent coupling between the autoignition
front and pressure wave (The pressure wave does promote autoigni-
tion; while autoignition does not strength the pressure wave). Conse-
quently, there is no detonation development and the maximum pres-
sure is much less than that in a detonation.
The propagation speeds of flame front and autoignition front are
shown in Fig. 7. Similar to case 1, strong oscillation is observed for the
flame propagation speed and this oscillation is also caused by pres-
sure wave-induced backward and forward flow in the closed cham-
ber. The autoignition front is shown to propagate to the left at the
speed of 2000 ∼ 6000 m/s, which is two-order of magnitude larger
than the flame propagation speed. As mentioned before, the speed of
autoignition front is higher than the local sound speed and C-J deto-
nation speed.
The temporal evolution of temperature and pressure at the right
boundary is shown in Fig. 8. Strong pressure oscillation is observed
after end-gas autoignition occurring at t = 323.68 μs. This pres-
sure oscillation is similar to the conventional knock observed by
Wang et al. [4]. The maximum amplitude of pressure oscillation is
around 20 atm, which is one-order larger than 2.5 atm for case 1
without end-gas autoignition. Therefore, even without detonation
evelopment, end-gas autoignition can still induce strong pressure
scillation.
The P-v diagrams for particles at different initial positions are
lotted in Fig. 9 for case 2. It is observed that particles initially at
0 = 0.2 and 1.5 cm go through three stages: compression, constant-
ressure combustion, and compression, which is similar to those
hown in Fig. 5 for case 1. However, the particle initially at X0 = 1.9 cm
s first compressed along OAD in Fig. 9; then it goes through nearly
onstant-volume autoignition along DF; and finally expansion occurs.
t is the nearly constant-volume autoignition that causes the rapid
ressure rise observed in Fig. 6 and Fig. 8. Such pressure rise gener-
tes pressure wave (much stronger than case 1 without autoignition)
ropagating back-and-forth in the closed chamber. Consequently, as
hown in Fig. 8, strong pressure oscillation occurs. Therefore, end-gas
utoignition makes the combustion mode to switch from constant-
ressure to constant-volume and it can generate strong pressure
aves which induce engine knock.
Compared to case 1, case 2 has higher initial temperature and
hereby end-gas autoignition happens. As mentioned in the begin-
ing of this section, end-gas autoignition can also be induced by
ncreasing the initial pressure (case 3) or chamber length (case 4).
his is demonstrated by the results for case 3 and case 4 shown in
ig. 10(a) and (b), respectively. Similar to that in Fig. 8 for case 2,
trong pressure oscillation is also observed for these two cases with
nd-gas autoignition.
.3. Detonation development
In cases 2–4, only autoignition occurs and there is no detona-
ion development. Wang et al. [54] found that detonation can lead
o super-knock with destructively strong pressure oscillation and
hereby it must be avoided in engines. Detonation occurs when the
eactivity of unburned end-gas is further enhanced by increasing the
nitial temperature (case 5) or initial pressure (case 6). Besides, deto-
ation is found to be developed from an autoignition front when the
hamber length is large enough (case 7). It is noted that the detona-
ion is not like the normal one. This is because in our simulations of
ases 5–7, the detonation is developed and it propagates towards an
uto-igniting mixture (the mixture already has very high reactivity
nd chemical reaction can take place before the shock wave). More-
ver, the sonic condition at the end of heat release was not reached.
When the initial temperature is increased from T0 = 1000 K to
0 = 1100 K (from case 2 to case 5), detonation development occurs
s shown in Fig. 11. At the beginning, the normal flame propagates
o the right (e.g., line #1 in Fig. 11). At t ≈ 80 μs, detonation starts

H. Yu, Z. Chen / Combustion and Flame 162 (2015) 4102–4111 4107
x (cm)
T(K)
3.5 3.6 3.7 3.8 3.9 41000
2000
3000
(b)
1
2
3
4
5
6
7
x (cm)
T(K)
1.86 1.88 1.9 1.92 1.94 1.96 1.98 2
1000
2000
3000
(a)
12
3
4
5
6
7
Fig. 10. Temporal evolution of temperature distribution for (a) case 3 with L = 2 cm,
T0 = 900 K and P0 = 20 atm (the time sequence from line #1 to line #7 is:
1—687.26 μs, 2—688.01 μs, 3—688.09 μs, 4—688.13 μs, 5—688.16 μs, 6—688.20 μs,
and 7—688.24 μs); (b), case 4 with L = 4 cm, T0 = 900 K and P0 = 10 atm (the time
sequence from line #1 to line #7 is: 1—1034.59 μs, 2—1061.64 μs, 3—1062.10 μs,
4—1062.18 μs, 5—1062.26 μs, 6—1062.41 μs, and 7—1062.65 μs).
P(atm)
25
50
75
1008
6
5
43
7
x (cm)
Q(J/m
3s)
0.4 0.5 0.6 0.7 0.8 0.9 1 1.1
1011
1012
1013
1014
1015
1 23
4
5 6 87
T(K)
1000
2000
3000
1 2 3 4 5 6 87
Fig. 11. Temporal evolution of temperature, pressure, and heat release rate distribu-
tions for case 5 with L = 2.0 cm, T0 = 1100 K and P0 = 10 atm. The time sequence from
line #1 to line #8 is: 1—75.00 μs, 2—83.01 μs, 3—86.00 μs, 4—86.50 μs, 5—86.76 μs,
6—86.88 μs, 7—87.11 μs, and 8—87.81 μs.
t
h
r
P
n
t
i
F
o
d
w
p
F
t
i
xf(cm)
S(m/s)
0 0.5 1 1.5 210
1
102
103
104
A : S=70 m/s
B : S=35 m/s
1 : S=80 m/s
2 : S=120 m/s
3 : S=287 m/s
4 : S=458 m/s
5 : S=815 m/s
6 : S=1365 m/s
7 : S=1970 m/s
8 : S=2233 m/s
C : S=1959 m/s
A
B
C
detonation
flame
34
5
678
1
2
Fig. 12. Change of the propagation speed, S = dxf /dt, with the position of
flame/ignition/detonation front, xf (case 5). The C-J detonation speed is around
1960 m/s. It is noted that points 1–8 in this figure correspond to lines 1–8 in Fig. 14,
not those in Fig. 11.
t (μs)
T(K)
P(atm)
0 100 200 300 4001000
2000
3000
4000
101
102
T
P
Fig. 13. Temporal evolution of temperature and pressure at the right boundary
(case 5). For case 5, the equilibrium temperature and pressure are 3140 K and 25.2 atm,
respectively.
(
c
m
t
b
3
a
g
d
c
[
i
s
t
r
F
f
p
A
S
t
t
d
r
i
0
o develop and there is rapid increase in both peak pressure and peak
eat release rate (from line #2 to line #6 in Fig. 11). The peak pressure
eaches 130 atm, which is about five times of the equilibrium value of
e = 25.2 atm (as listed in Table 1 for case 5). At t ≈ 87μs, the deto-
ation is fully developed and afterwards the end-gas is consumed by
he self-sustaining detonation propagating to the right (lines #6-#8
n Fig. 11).
The propagation speed of the reaction front for case 5 is shown in
ig. 12. The initial normal flame propagates to the right at the speed
f 70 m/s (point A in Fig. 12). At point B, the propagation speed is re-
uced to 35 m/s. This is because that the left-propagating pressure
ave induces backward flow in the closed chamber. Therefore, flame
ropagation speed oscillation similar to those shown in Fig. 3 and
ig. 7 (respectively for case 1 and case 2) would appear for case 5 if
here is no detonation development. It is observed that there is rapid
ncrease of propagation speed from 80 m/s (point #1) to 2233 m/s
point #8), which corresponds to the detonation development pro-
ess to be explained later in Fig. 14. After the detonation develop-
ent, self-sustaining detonation propagates to the right approaching
o the C-J detonation speed of 1960 m/s (point C in Fig. 12).
The temporal evolution of temperature and pressure at the right
oundary is shown in Fig. 13. Extremely high pressure around
00 atm is observed when the detonation reflects at the right bound-
ry. The peak pressure is about six times of that for case 2 with end-
as autoignition but no detonation (see Fig. 8). Therefore, detonation
evelopment can cause extremely large amplitude of pressure os-
illation, which is close to the super-knock observed by Wang et al.
4, 54].
To explain the deflagration to detonation transition process shown
n Fig. 11, we plotted the enlarged display of temperature and pres-
ure distributions during detonation development in Fig. 14. As men-
ioned before, the reaction front propagation speeds at times cor-
esponding to lines #1–8 in Fig. 14 are marked by points #1–8 in
ig. 12. At t = 80 μs (line #1 in Fig. 14), the pressure is nearly uni-
ormly distributed in the whole domain while there is obvious tem-
erature gradient in the range of 0.554 ≤ x ≤ 0.6 cm (between points
and B in Fig. 14b), which is in the upstream of the preheat zone.
uch temperature gradient is caused by heat release from local au-
oignition and it can induce detonation development according to the
heory of Zel’dovich [8, 11] on detonation generated by reactivity gra-
ient (more details can also be found in Ref. [13]). The end-gas in the
ange of 0.554 ≤ x ≤ 0.6 cm at t = 80 μs has very high reactivity and
s close to autoignition. Due to the negative temperature gradient in
.554 ≤ x ≤ 0.6 cm, autoignition first occurs around x = 0.554 cm

4108 H. Yu, Z. Chen / Combustion and Flame 162 (2015) 4102–4111
x (cm)
T(K)
P(atm)
0.5 0.6 0.7 0.8 0.91000
1500
2000
2500
3000
20
40
60
80
Thin lines: T
Thick lines: P
2 3 4 5 6
7
8
10
1
(a)
x (cm)
T(K)
P(atm)
0.5 0.6 0.7 0.8 0.91100
1200
1300
1400
10
12
14
16
Thin lines: T
Thick lines: P
2
4
1
3
(b)
A
B
Fig. 14. Enlarged display of temperature and pressure distributions during detonation
development in case 5. The time sequence from line #1 to line #8 is: 1—80.00 μs,
2—82.50 μs, 3—83.55 μs, 4—85.00 μs, 5—86.00 μs, 6—86.52 μs, 7—86.76 μs, and 8—
86.97 μs.
o
i
i
t
t
c
t
s
F
e
c
m
t
fi
p
n
p
a
m
t
p
f
t
t
o
a
t
a
l
s
i
t
c
T
t
T
r
t
p
h
d
I
4
c
c
(point A in Fig. 14b) and the local heat release generates pressure
pulse/wave propagating to the right, where the H2/air premixture is
on the threshold of autoignition. The pressure wave initiates autoigni-
tion of this premixture, the heat release of which further strengthens
the pressure wave. Therefore, the autoignition front accelerates and
interacts coherently with the pressure wave. Such coherent coupling
between pressure wave and local autoignition (or chemical reaction)
results in local pressure build-up (line #2 in Fig. 14) and acceleration
of the autoignition front propagation [7]. At the beginning (line #2
in Fig. 14), the pressure wave propagates much faster than the reac-
tion/autoignition front (according to point #2 in Fig. 12, the speed
v (m3/kg)
P(atm)
0 0.2 0.4 0.6 0.80
20
40
60
80
100
120
X0= 0.52 cm
X0= 0.57 cm
X0= 0.69 cm
X0= 0.77 cm
X0= 0.79 cm
X0= 0.81 cm
X0= 0.99 cm
O
B
F
IJ
K
C
12
3
4
5
6
7
1234567
(a)
A
H
G
D
E
Fig. 15. (a) P-v and (b) P-λ diagrams for particles at different initial positions of X0 = 0.52
denote the maximum pressure.
f the reaction front is only 120 m/s). Then, the unburned end-gas
mmediately behind the pressure wave has higher reactivity after be-
ng compressed, which results in abrupt acceleration in the propaga-
ion speed (lines #2–7 Fig. 14 and points #2–7 in Fig. 12). Eventually,
he enhanced coherent interaction between pressure wave and local
hemical reaction leads to the formation of an over-driven detona-
ion wave (line #8 in Fig. 14), which slows down to become a self-
ustaining detonation propagating to the right (lines #7-8 in Fig. 11).
To give more details on the detonation development process, in
ig. 15 we plotted the P-v and P-λ diagrams for particles at differ-
nt initial positions. The reaction process, λ, was defined as the per-
entage of hydrogen consumed, i.e., λ = 1 − YH2/Y 0
H2(where YH2
is the
ass fraction of hydrogen and the superscript 0 indicates the state in
he initial unburned end-gas). Particle #1 initially at X0 = 0.52 cm is
rst compressed along OA in Fig. 15(a); then it goes through constant-
ressure combustion along AK before autoignition happens; and fi-
ally it is compressed along KJ. This behavior is similar to that of the
article initially at X0 = 1.0 cm in case 2 shown in Fig. 9. Particle #2
t X0 = 0.57 cm is located at the position where detonation develop-
ent starts (see Fig. 14). Both pressure and specific volume are shown
o slightly increase when particle #2 goes through the combustion
rocess along AJ in Fig. 15(a). The pressure rise is due to heat release
rom chemical reaction while the increase of specific volume is due
o expansion (which also reduces pressure rise) after being passed by
he pressure wave. Particles #3–5 experience the transition to det-
nation; while particle #6 goes through the over-driven detonation
fter the transition process. For particle #6, it is first compressed by
he propagating flame along OA; then it goes through a shock wave
long ABCDEF; and finally it experiences expansion along FG. Simi-
ar processes also happen to particle #7 which goes through a self-
ustaining detonation propagating close to the C-J speed. It is noticed
n Fig. 15(b) that, for particles #4–7 the reaction progress is not close
o zero when the peak pressure is reached, indicating that chemi-
al reaction already takes place within and before the shock wave.
his is because particles #4–7 have very high reactivity and are on
he threshold of autoignition before it goes through the shock wave.
herefore, curves AC, AD, AE and AF are not Hugoniot curves; and the
esults in Fig. 15 are not similar to those for traditional ZND detona-
ion structure, in which chemical reaction occurs only after the peak
ressure (the von Neumann spike) is reached.
Compared to case 2 without detonation development, case 5 has
igher initial temperature and thereby detonation occurs. Detonation
evelopment can also be triggered by increasing the initial pressure.
n case 6, the initial pressure is increased from 10 atm (case 2) to
0 atm (case 6) while the initial temperature of T0 = 1000 K and the
hamber length of L = 2 cm are both kept unchanged. The results for
ase 6 in Fig. 16 show the detonation development and propagation
λ0 0.2 0.4 0.6 0.8 1
1
23
4
5
6
7
(b)
, 0.57, 0.69, 0.77, 0.79, 0.81, and 0.99 cm (case 5). The open circles in the right figure
H. Yu, Z. Chen / Combustion and Flame 162 (2015) 4102–4111 4109
P(atm)
100
200
300
400
3
4 5 6
7
87
x (cm)
Q(J/m
3s)
1 1.2 1.4 1.6 1.8 210
11
1012
1013
1014
1015
1016
1 2
34 5 6
8 7
6
7
T(K)
1000
2000
3000
21 74 5 76
6
8
3
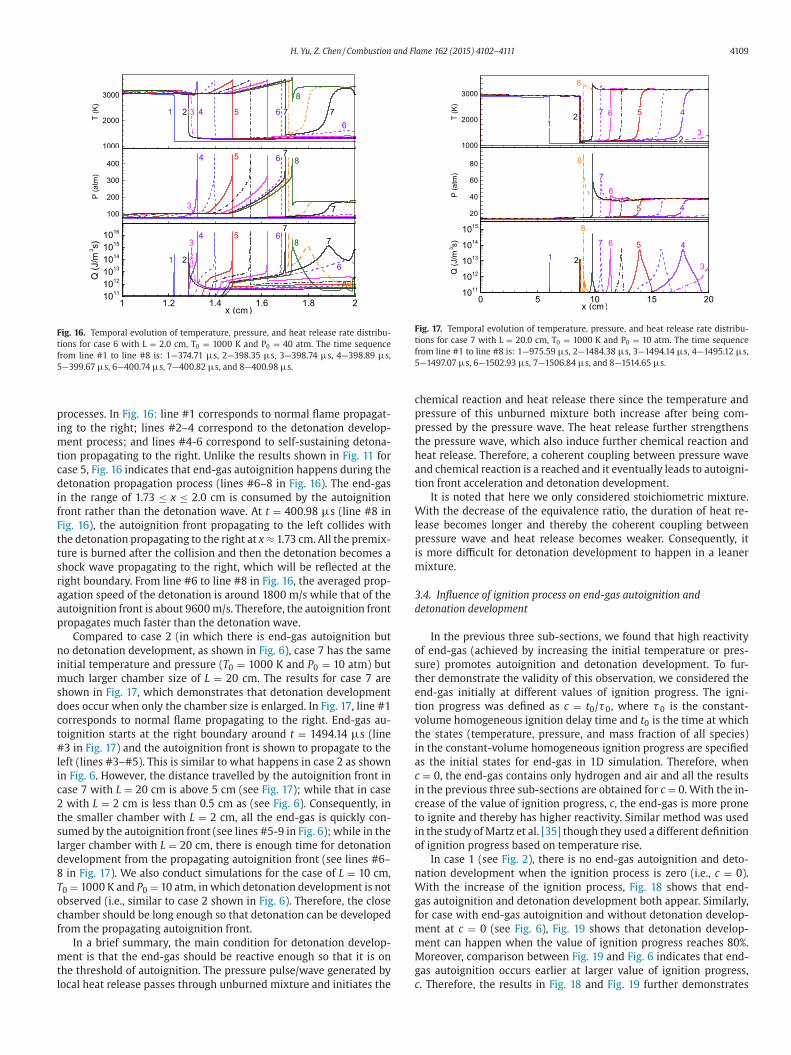
Fig. 16. Temporal evolution of temperature, pressure, and heat release rate distribu-
tions for case 6 with L = 2.0 cm, T0 = 1000 K and P0 = 40 atm. The time sequence
from line #1 to line #8 is: 1—374.71 μs, 2—398.35 μs, 3—398.74 μs, 4—398.89 μs,
5—399.67 μs, 6—400.74 μs, 7—400.82 μs, and 8—400.98 μs.
p
i
m
t
c
d
i
f
F
t
t
s
r
a
a
p
n
i
m
s
d
c
t
#
l
i
c
2
t
s
l
d
8
T
o
c
f
m
t
l
P(atm)
20
40
60
80
45
6
8
7
x (cm)
Q(J/m
3s)
0 5 10 15 2010
11
1012
1013
1014
1015
1 23
456
8
7
T(K)
1000
2000
3000
21
7 456
8
32
Fig. 17. Temporal evolution of temperature, pressure, and heat release rate distribu-
tions for case 7 with L = 20.0 cm, T0 = 1000 K and P0 = 10 atm. The time sequence
from line #1 to line #8 is: 1—975.59 μs, 2—1484.38 μs, 3—1494.14 μs, 4—1495.12 μs,
5—1497.07 μs, 6—1502.93 μs, 7—1506.84 μs, and 8—1514.65 μs.
c
p
p
t
h
a
t
W
l
p
i
m
3
d
o
s
t
e
t
v
t
i
a
c
i
c
t
i
o
n
W
g
f
m
m
M
g
c
rocesses. In Fig. 16: line #1 corresponds to normal flame propagat-
ng to the right; lines #2–4 correspond to the detonation develop-
ent process; and lines #4-6 correspond to self-sustaining detona-
ion propagating to the right. Unlike the results shown in Fig. 11 for
ase 5, Fig. 16 indicates that end-gas autoignition happens during the
etonation propagation process (lines #6–8 in Fig. 16). The end-gas
n the range of 1.73 ≤ x ≤ 2.0 cm is consumed by the autoignition
ront rather than the detonation wave. At t = 400.98 μs (line #8 in
ig. 16), the autoignition front propagating to the left collides with
he detonation propagating to the right at x ≈ 1.73 cm. All the premix-
ure is burned after the collision and then the detonation becomes a
hock wave propagating to the right, which will be reflected at the
ight boundary. From line #6 to line #8 in Fig. 16, the averaged prop-
gation speed of the detonation is around 1800 m/s while that of the
utoignition front is about 9600 m/s. Therefore, the autoignition front
ropagates much faster than the detonation wave.
Compared to case 2 (in which there is end-gas autoignition but
o detonation development, as shown in Fig. 6), case 7 has the same
nitial temperature and pressure (T0 = 1000 K and P0 = 10 atm) but
uch larger chamber size of L = 20 cm. The results for case 7 are
hown in Fig. 17, which demonstrates that detonation development
oes occur when only the chamber size is enlarged. In Fig. 17, line #1
orresponds to normal flame propagating to the right. End-gas au-
oignition starts at the right boundary around t = 1494.14 μs (line
3 in Fig. 17) and the autoignition front is shown to propagate to the
eft (lines #3–#5). This is similar to what happens in case 2 as shown
n Fig. 6. However, the distance travelled by the autoignition front in
ase 7 with L = 20 cm is above 5 cm (see Fig. 17); while that in case
with L = 2 cm is less than 0.5 cm as (see Fig. 6). Consequently, in
he smaller chamber with L = 2 cm, all the end-gas is quickly con-
umed by the autoignition front (see lines #5-9 in Fig. 6); while in the
arger chamber with L = 20 cm, there is enough time for detonation
evelopment from the propagating autoignition front (see lines #6–
in Fig. 17). We also conduct simulations for the case of L = 10 cm,
0 = 1000 K and P0 = 10 atm, in which detonation development is not
bserved (i.e., similar to case 2 shown in Fig. 6). Therefore, the close
hamber should be long enough so that detonation can be developed
rom the propagating autoignition front.
In a brief summary, the main condition for detonation develop-
ent is that the end-gas should be reactive enough so that it is on
he threshold of autoignition. The pressure pulse/wave generated by
ocal heat release passes through unburned mixture and initiates the
hemical reaction and heat release there since the temperature and
ressure of this unburned mixture both increase after being com-
ressed by the pressure wave. The heat release further strengthens
he pressure wave, which also induce further chemical reaction and
eat release. Therefore, a coherent coupling between pressure wave
nd chemical reaction is a reached and it eventually leads to autoigni-
ion front acceleration and detonation development.
It is noted that here we only considered stoichiometric mixture.
ith the decrease of the equivalence ratio, the duration of heat re-
ease becomes longer and thereby the coherent coupling between
ressure wave and heat release becomes weaker. Consequently, it
s more difficult for detonation development to happen in a leaner
ixture.
.4. Influence of ignition process on end-gas autoignition and
etonation development
In the previous three sub-sections, we found that high reactivity
f end-gas (achieved by increasing the initial temperature or pres-
ure) promotes autoignition and detonation development. To fur-
her demonstrate the validity of this observation, we considered the
nd-gas initially at different values of ignition progress. The igni-
ion progress was defined as c = t0/τ 0, where τ 0 is the constant-
olume homogeneous ignition delay time and t0 is the time at which
he states (temperature, pressure, and mass fraction of all species)
n the constant-volume homogeneous ignition progress are specified
s the initial states for end-gas in 1D simulation. Therefore, when
= 0, the end-gas contains only hydrogen and air and all the results
n the previous three sub-sections are obtained for c = 0. With the in-
rease of the value of ignition progress, c, the end-gas is more prone
o ignite and thereby has higher reactivity. Similar method was used
n the study of Martz et al. [35] though they used a different definition
f ignition progress based on temperature rise.
In case 1 (see Fig. 2), there is no end-gas autoignition and deto-
ation development when the ignition process is zero (i.e., c = 0).
ith the increase of the ignition process, Fig. 18 shows that end-
as autoignition and detonation development both appear. Similarly,
or case with end-gas autoignition and without detonation develop-
ent at c = 0 (see Fig. 6), Fig. 19 shows that detonation develop-
ent can happen when the value of ignition progress reaches 80%.
oreover, comparison between Fig. 19 and Fig. 6 indicates that end-
as autoignition occurs earlier at larger value of ignition progress,
. Therefore, the results in Fig. 18 and Fig. 19 further demonstrates

4110 H. Yu, Z. Chen / Combustion and Flame 162 (2015) 4102–4111
T(K)
1000
2000
3000
(a), c = 0%T(K)
1000
2000
3000
(b), c = 90%
x (cm)
T(K)
0 0.5 1 1.5 2
1000
2000
3000(c), c = 99%
Fig. 18. Temporal evolution of temperature distributions at different values of ignition
process (c = 0%, 90% and 99%) for case 1 with L = 2 cm, T0 = 900 K and P0 = 10 atm.
T(K)
1000
2000
3000
(a), c = 10 %
T(K)
1000
2000
3000
(b), c = 50%
x (cm)
T(K)
0 0.5 1 1.5 2
1000
2000
3000(c), c = 80%
Fig. 19. Temporal evolution of temperature distributions at different values of ignition
process (c = 10%, 50% and 80%) for case 2 with L = 2 cm, T0 = 1000 K and P0 = 10 atm.
k
b
a
a
s
t
t
k
e
t
F
a
c
r
v
c
c
w
d
m
m
v
t
e
t
t
d
o
p
o
i
o
p
fl
d
A
o
E
h
a
r
S
i
R
that high reactivity of end-gas promotes autoignition and detonation
development.
4. Conclusions
Combustion of end-gas in a closed chamber filled with stoichio-
metric H2/air mixture was studied by 1D simulation considering de-
tailed chemistry. Depending on the chamber size as well as the ini-
tial temperature and pressure, three modes of end-gas combustion
were identified: (1) normal flame propagation without autoignition,
(2) autoignition without detonation development, and (3) detonation
development.
When there is no end-gas autoignition, the amplitude of pressure
oscillation is small and the peak pressure is close to the equilibrium
value under the conditions of constant volume and constant inter-
nal energy. Each flow particle was found to go through three stages:
compression, combustion and compression. It was demonstrated that
constant-pressure rather than constant-volume combustion happens
to flame propagation in a closed chamber without autoignition.
When there is end-gas autoignition but no detonation develop-
ment, high amplitude of pressure oscillation similar to conventional
nock was observed. It is end-gas autoignition that makes the com-
ustion mode to switch from constant-pressure to constant-volume
nd generates strong pressure waves which induce engine knock. The
utoignition front was found to propagate much faster than the pres-
ure/acoustic wave and thereby there is no coherent coupling be-
ween the pressure wave and chemical reaction.
When there is detonation development, extremely high ampli-
ude of pressure oscillation was observed, which is similar to super-
nock observed by Wang et al. [4, 54]. Negative temperature gradi-
nt was found to appear in the upstream of the preheat zone due to
he heat release from local autoignition (between points A and B in
ig. 14b) and it triggers detonation development according to the re-
ctivity gradient theory of Zel’dovich [8, 11]. Detailed analysis indi-
ated that coherent coupling between pressure wave and chemical
eaction leads to autoignition front acceleration and detonation de-
elopment. Besides, it was found that the detonation development
an be promoted by increasing the initial temperature, pressure, or
hamber size.
Furthermore, simulations on end-gas at different ignition progress
ere conducted. It was demonstrated that the reactivity of end-gas
etermines whether end-gas autoignition and detonation develop-
ent occur. At higher initial temperature and pressure, end-gas is
ore reactive and thereby end-gas autoignition and detonation de-
elopment are more prone to occur.
It is noted that 1D simulation was conducted here and the ini-
ial temperature of end-gas was uniformly distributed. Therefore, the
ffects of temperature inhomogeneity (local hot-spot) and turbulent
ransport on the end-gas combustion were not examined, which cer-
ainly deserve further investigation.
It is also noted that in multi-dimensional flows, deflagration-to-
etonation transition usually occurs with the help of the appearance
f obstacles, boundary layers, or turbulent mixing (see the review
aper of Oran and Gamezo [55]). In 1D or quasi 1D flows, in previ-
us studies detonation was found to be developed only when there
s temperature/concentration gradient initially specified (e.g., [13])
r when there is friction-induced preheating [56–58]. However, the
resent simulation demonstrated for the first time that even in 1D
ow only with an initial propagating flame, detonation can still be
eveloped when the reactivity of end-gas is high enough.
cknowledgments
This work was supported by National Natural Science Foundation
f China (Nos. 51322602 and 51136005) and State Key Laboratory of
ngines at Tianjin University (No. K2014-01). We acknowledge the
elpful discussions with Professor Yiguang Ju at Princeton University
nd Professor Zhi Wang at Tsinghua University. We also thank the
eviewers for providing helpful comments and suggestions.
upplementary materials
Supplementary material associated with this article can be found,
n the online version, at doi:10.1016/j.combustflame.2015.08.018.
eferences
[1] P.K. Senachin, V.S. Babkin, Combust. Explo. Shock Waves 18 (1982) 1–5.[2] Z. Wang, X. He, J. Wang, S. Shuai, F. Xu, D. Yang, Energ. Convers. Manage. 51 (2010)
908–917.[3] G.T. Kalghatgi, D. Bradley, Int J. Engine Res 13 (2012) 399–414.
[4] Z. Wang, H. Liu, T. Song, Y. Qi, X. He, S. Shuai, J. Wang, Int J. Engine Res. 16 (2015)166–180.
[5] J.B. Heywood, Internal Combustion Engines Fundamentals, McGraw Hill, NewYork, 1988.
[6] D. Bradley, G.T. Kalghatgi, M. Golombok, J. Yeo, Proc. Combust. Inst. 26 (1996)
2653–2660.[7] J. Pan, G. Shu, H. Wei, Combust. Sci. Technol. 186 (2014) 192–209.
[8] Y. Zeldovich, Combust. Flame 39 (1980) 211–214.[9] J.H.S. Lee, The Detonation Phenomenon, Cambridge University Press, Cambridge,
2008.

H. Yu, Z. Chen / Combustion and Flame 162 (2015) 4102–4111 4111
[
[
[
[
[
[[
[
[
[
[
[
[[
[[
[
[[
[[
[
[[
[
[
[
[[
[10] J.C. Livengood, P.C. Wu, Proc. Combust. Inst. 5 (1955) 347–356.[11] Y.B. Zeldovich, V.B. Librovich, G.M. Makhviladze, G.I. Sivashinsky, Acta Astronaut
15 (1970) 313–321.[12] D. Bradley, C. Morley, X.J. Gu, D.R. Emerson, SAE-2002-01-2868, 2002.
[13] X.J. Gu, D.R. Emerson, D. Bradley, Combust. Flame 133 (2003) 63–74.[14] D. Bradley, G.T. Kalghatgi, Combust. Flame 156 (2009) 2307–2318.
[15] D. Bradley, Philos. T. Roy. Soc. A. 370 (2012) 689–714.[16] L.S. Kagan, P.V. Gordon, G.I. Sivashinsky, Combust. Theor. Model. 16 (2012) 1–
12.
[17] L. Kagan, G. Sivashinsky, Proc. Combust. Inst. 34 (2013) 857–863.[18] N. Kawahara, E. Tomita, Y. Sakata, Proc. Combust. Inst. 31 (2007) 2999–3006.
[19] N. Kawahara, E. Tomita, Int. J. Hydrogen Energy 34 (2009) 3156–3163.20] J.F. Griffiths, J.P. MacNamara, C.G.W. Sheppard, D.A. Turton, B.J. Whitaker, Fuel 17
(2002) 2219–2225.[21] M. Pöschl, T. Sattelmayer, Combust. Flame 153 (2008) 562–573.
22] Y. Nagano, T. Ohira, M. Oomaka, Y. Uyama, T. Kitagawa, One-dimensional Flame
Propagation and Auto-ignition of End Gas in Constant Volume Vessel, in: TheEighth International Conference on Modeling and Diagnostics for Advanced En-
gine Systems (COMODIA 2012), Fukuoka, Japan, 2012.23] Y. Qi, X. He, Z. Wang, J. Wang, H. Zhang, Y. Jiang, Int. J. Hydrogen Energy 40 (2015)
2377–2385.[24] J. Pan, C.G.W. Sheppard, SAE-942060, 1994.
25] J. Pan, C.G.W. Sheppard, A. Tindall, SAE-982616, 1998.
26] M.A. Liberman, M.F. Ivanov, O.E. Peil, D.M. Valiev, L.E. Eriksson, Combust. Sci.Technol. 177 (2004) 151–182.
[27] M.A. Liberman, M.F. Ivanov, D.M. Valiev, L.E. Eriksson, Combust. Sci. Technol. 178(2006) 1613–1647.
28] Z. Wang, Y. Wang, R.D. Reitz, Energ. Fuel. 26 (2012) 7107–7119.29] H. Wei, Y. Shang, C. Chen, D. Gao, D. Feng, Int. J. Hydrogen Energy 39 (2014) 21265–
21274.
30] J.H. Chen, E.R. Hawkes, R. Sankaran, S.D. Mason, H.G. Im, Combust. Flame 145(2006) 128–144.
[31] C.S. Yoo, T. Lu, J.H. Chen, C.K. Law, Combust. Flame 158 (2011) 1727–1741.32] M.B. Luong, Z. Luo, T. Lu, S.H. Chung, C.S. Yoo, Combust. Flame 160 (2013) 2038–
2047.
[33] M.B. Luong, T. Lu, S.H. Chung, C.S. Yoo, Combust. Flame 161 (2014) 2878–2889.34] Y. Ju, W. Sun, M.P. Burke, X. Gou, Z. Chen, Proc. Combust. Inst. 33 (2011) 1245–
1251.[35] J.B. Martz, H. Kwak, H.G. Im, G.A. Lavoie, D.N. Assanis, Proc. Combust. Inst. 33
(2011) 3001–3006.36] J.B. Martz, G.A. Lavoie, H.G. Im, R.J. Middleton, A. Babajimopoulos, D.N. Assanis,
Combust. Flame 159 (2012) 2077–2086.[37] H. Zhang, E.R. Hawkes, J.H. Chen, S. Kook, Proc. Combust. Inst. 34 (2013) 803–812.
38] P. Dai, Z. Chen, S. Chen, Y. Ju, Proc. Combust. Inst. (2014) 35.
39] H. Terashima, M. Koshi, Combust. Flame 162 (2015) 1944–1956.40] R.J. Kee, J.F. Grcar, M.D. Smooke, J.A. Miller, Sandia National Laboratories-SAND85-
8240, 1985.[41] Z. Chen, Combust. Flame 157 (2010) 2267–2276.
42] Z. Chen, M.P. Burke, Y. Ju, Proc. Combust. Inst. 32 (2009) 1253–1260.43] G. Strang, SIAM J. Numer. Anal. 5 (1968) 506–517.
44] P.N. Brown, G.D. Byrne, A.C. Hindmarsh, SIAM J. Sci. Comput 10 (1989) 1038–1051.
45] J. Li, Z. Zhao, A. Kazakov, F.L. Dryer, Int. J. Chem. Kinet. 36 (2004) 566–575.46] R.J. Kee, F.M. Rupley, J.A. Miller, Sandia National Laboratories-SAND89-8009B,
1989.[47] Z. Chen, M.P. Burke, Y. Ju, Proc. Combust. Inst 33 (2011) 1219–1226.
48] Z. Chen, Combust. Flame 158 (2011) 291–300.49] H. Yu, W. Han, J. Santner, X. Gou, C.H. Sohn, Y. Ju, Z. Chen, Combust. Flame 161
(2014) 2815–2824.
50] Z. Chen, Combust. Flame 162 (2015) 2242–2253.[51] R. Zhou, J. Wang, Combust. Flame 159 (2012) 3632–3645.
52] H. Xiao, X. Shen, J. Sun, Int. J. Hydrogen Energy 37 (2012) 11466–11473.53] D. Veynante, T. Poinsot, Theoretical and Numerical Combustion, Edwards,
Philadelphia, 2005.54] Z. Wang, Y. Qi, X. He, J. Wang, S. Shuai, C.K. Law, Fuel 144 (2015) 222–227.
55] E.S. Oran, V.N. Gamezo, Combust. Flame 148 (2007) 4–47.
56] L. Kagan, G. Sivashinsky, Combust. Flame 154 (2008) 186–190.[57] M.H. Wu, P. Burke, S.F. Son, R.A. Yetter, Proc. Combust. Inst. 31 (2007) 2429–2436.
58] M.H. Wu, C.Y. Wang, Proc. Combust. Inst. 33 (2011) 2287–2293.59] R.F. Strickland-Constable, Symp. (Int.) Combust, in: 3Third Symposium on Com-
bustion and Flame and Explosion Phenomena, 1949, pp. 229–235.