Investigation of Autoignition and Combustion Stability of ...

The Preignition and Autoignition Oxidation of Alternatives to Petroleum
Derived JP-8 and their Surrogate Components in a Pressurized Flow Reactor
and Single Cylinder Research Engine
A Thesis
Submitted to the Faculty
of
Drexel University
by
Matthew S. Kurman
in partial fulfillment of the
requirements for the degree
of
Master of Science in Mechanical Engineering
September 2009

© Copyright 2009 Matthew S. Kurman. All Rights Reserved.

iiDedication
This work is dedicated to my family, friends, and Jolly.

iiiAcknowledgments
I would like to thank my advisors Dr. Nicholas P. Cernansky and Dr. David L.
Miller for giving me the opportunity to be a part of the Combustion Chemistry Group.
Their support and direction throughout this part of my life was highly appreciated. I
have learned so much from them. A special thank you goes out to them for giving me
several opportunities to travel and present my research.
I would like to highly thank Robert Natelson for all of the great times that we
worked together in the Hess Lab. Everything from studying for classes to all-nighters
was much more exciting with Rob’s support. Rob pushed me to work hard and
always encouraged me to keep on track. I would like to thank Jamie Lane for being a
great friend and office buddy. I have many great memories from sharing an office
with him. I want to thank Mark Shiber from the machine shop for all of his help and
advice with machining. I would like to thank Dr. Alan C. W. Lau for all of his help
and guidance throughout my graduate studies.
I want to thank my fiancée Jennifer Penn for giving me the much needed
support to stay focused and to keep my eye on the prize. She was always there for me
and gave me encouragement when I needed it most. I would like to thank my friends,
Doug Young and Travis Giffing, back home in Lancaster County, PA and my family
for their encouragement. They really stuck by me and supported me even though I
was away from home. I would also like to thank Jolly, my Mom’s dog, for her
excitement to see me each and every time I came home.

iv I have made many friends and met many people along the way that supported
me during this research. Thanks goes out to all of you for your support.
I would like to acknowledge the U.S. Army Research Office for their greatly
appreciated funding under Grant Numbers DAAD19-03-1-0070 and W911NF-07-1-
0522.

vTable of Contents
LIST OF TABLES..................................................................................................... viii
LIST OF FIGURES ..................................................................................................... ix
ABSTRACT................................................................................................................. xi
CHAPTER 1: INTRODUCTION..................................................................................1
1.1 Motivation.............................................................................................1
1.2 Research Objective ...............................................................................3
1.3 Research Program .................................................................................3
CHAPTER 2: BACKGROUND AND LITERATURE REVIEW ................................6
2.1 Overview...............................................................................................6
2.2 Hydrocarbon Oxidation ........................................................................6
2.3 Chemistry of Small Alkanes .................................................................9
2.4 Chemistry of n-Decane .......................................................................11
2.5 Chemistry of Cycloalkanes .................................................................13
2.6 Chemistry of Petroleum and Alternative Jet Fuels .............................15
2.6.1 Petroleum JP-8 ...........................................................................16
2.6.2 Fischer-Tropsch Jet Fuel ............................................................17
2.6.3 Coal Derived Jet Fuel.................................................................19
2.6.4 Blends of Alternative Jet Fuels ..................................................20
2.7 Closure ................................................................................................21
CHAPTER 3: EXPERIMENTAL FACILITY ............................................................23
3.1 Introduction.........................................................................................23
3.2 Pressurized Flow Reactor Facility ......................................................24
3.3 Single Cylinder Research Engine Facility ..........................................25

vi3.4 Controlled Cool Down........................................................................28
3.5 Siemens Ultramat 22P CO and CO2 Detector.....................................28
3.6 Sample Storage System.......................................................................29
3.7 Trace GC Gas Chromatograph and Trace DSQ Mass Spectrometer ..32
3.8 Pressurized Flow Reactor Facility Upgrades and Maintenance .........38
3.8.1 Sample Probe Construction and Laser Welding ........................38
3.8.2 Replacement of the Inlet Bead Heater Controller ......................40
3.8.3 Replacement of the Chromalox 10 kW Air Circulation Heater and Controllers ....................................................................................40
3.8.4 Cleaning the 3 kW Heater Electrical Connectors ......................42
3.9 Closure ................................................................................................44
CHAPTER 4: FISCHER-TROPSCH JET FUEL, PETROLEUM JP-8, AND N-DECANE/ISO-OCTANE OXIDATION.....................................................................45
4.1 Introduction.........................................................................................45
4.2 Results and Discussion .......................................................................47
4.2.1 CO and CO2 Comparison of Petroleum JP-8 with Fischer-Tropsch Jet Fuel .....................................................................47
4.2.2 Oxidation of the n-Decane/iso-Octane Mixture .........................49
4.2.3 Oxidation of the Tuned n-Decane/iso-Octane Mixture..............50
4.3 Closure ................................................................................................51
CHAPTER 5: THE OXIDATION OF ALTERNATIVE JET FUELS AND A FISCHER-TROPSCH JET FUEL SURROGATE IN COMPLEMENTARY COMBUSTION FACILITIES.....................................................................................53
5.1 Introduction.........................................................................................53
5.2 Experimental Conditions ....................................................................54
5.3 Results and Discussion .......................................................................55
5.3.1 Jet Fuels in the PFR....................................................................55

vii5.3.2 Petroleum JP-8, Coal Derived Jet Fuel, and Fischer-Tropsch Jet Fuel Surrogate in the Single Cylinder Research Engine.....................58
5.4 Closure ................................................................................................61
CHAPTER 6: INTERMEDIATE SPECIES ANALYSIS OF N-DECANE AND DECALIN....................................................................................................................63
6.1 Introduction.........................................................................................63
6.2 Experimental Conditions ....................................................................64
6.3 Results and Discussion .......................................................................64
6.3.1 Detailed Speciation of Intermediates Produced during n-Decane Oxidation in the PFR...........................................................................65
6.3.2 Detailed Speciation of Intermediates Produced during Decalin Oxidation in the PFR...........................................................................69
6.4 Closure ................................................................................................75
CHAPTER 7: CONCLUSIONS AND RECOMMENDATIONS FOR FUTURE WORK .........................................................................................................................77
7.1 Introduction.........................................................................................77
7.2 Conclusions.........................................................................................78
7.3 Recommendations for Future Work....................................................80
7.4 Closure ................................................................................................82
LIST OF REFERENCES.............................................................................................83
APPENDIX A: GENERAL OPERATING PROCEDURE FOR THE PRESSURIZED FLOW REACTOR DURING A CONTROLLED COOL DOWN EXPERIMENT...89
A.1 Typical PFR Heater Set-Point Schedule ............................................98
A.2 Pictures of Selected PFR Facility Components ...............................100

viiiLIST OF TABLES
Table 1.1: JP-8 specifications defined by MIL-DTL-83133E. ..................................... 3
Table 2.1: Comparison of selected properties of the jet fuel samples. ....................... 15
Table 2.2: Composition of petroleum JP-8, POSF 3773. ........................................... 17
Table 2.3: Composition of Fischer-Tropsch Jet Fuel, POSF 4734. ............................ 18
Table 2.4: Components in Fischer-Tropsch Jet Fuel, POSF 4734.............................. 18
Table 2.5: Composition of coal derived jet fuel, POSF 4765..................................... 20
Table 3.1: Selected research engine specifications..................................................... 27
Table 3.2: Typical experimental operating conditions of the PFR. ............................ 28
Table 3.3: MS operating parameters. .......................................................................... 33
Table 3.4: Resistance of each heater element. ............................................................ 43
Table 4.1: Properties of petroleum and Fischer-Tropsch samples.............................. 46
Table 4.2: Properties of the mixture and components. ............................................... 46
Table 5.1: Properties of coal derived and Fischer-Tropsch jet fuel samples. ............. 54
Table 6.1: Species identified by GC/MS/FID in n-decane oxidation samples. .......... 68
Table 6.2: Species identified by GC/MS/FID in decalin oxidation samples. ............. 71
Table A.1: Typical set-points for PFR heaters during warm-up phase....................... 99

ixLIST OF FIGURES
Figure 2.1: Branching pathways of hydrocarbon oxidation at low and intermediate temperatures. Based on extensive experimental and modeling research of linear and lightly branched paraffins of C3 – C8 by many groups.............. 8
Figure 3.1: Schematic of the PFR identifying key components. ................................ 25
Figure 3.2: Schematic of the single cylinder research engine facility with key components identified. ............................................................................. 27
Figure 3.3: Schematic of the heated sample storage system cart in sample collection mode. ........................................................................................................ 31
Figure 3.4: Schematic of the heated sample storage system cart in sample analysis mode. ........................................................................................................ 32
Figure 3.5: Programmed GC temperature profile. ...................................................... 33
Figure 3.6: 4-port and 6-port valves in the off position, prep run. ............................. 35
Figure 3.7: GC valves in the sample injection position with the 6-port valve on and the 4-port valve off................................................................................... 36
Figure 3.8: 4-port and 6-port valves off in the sample injection position................... 36
Figure 3.9: Position of GC valves at 4.00 minutes with the 6-port valve off and the 4-port valve on. ........................................................................................ 37
Figure 3.10: Off position of the 4-port and 6-port valves at end of program. ............ 37
Figure 3.11: Schematic of the sample probe tip showing laser welding locations and dimensions................................................................................................ 39
Figure 3.12: Wiring diagram of 3 kW heater elements. Connection e and f are on the backside of the heater............................................................................... 43
Figure 4.1: Chemical structure of each species in the binary mixture........................ 47
Figure 4.2: CO production of Fischer-Tropsch jet fuel and petroleum JP-8. ............. 48
Figure 4.3: CO2 production of Fischer-Tropsch jet fuel and petroleum JP-8............. 49
Figure 4.4: CO and CO2 production of 59.4% n-decane/40.6% iso-octane mixture. . 50
Figure 4.5: Reactivity map of Fischer-Tropsch jet fuel and 53.1% n-decane / 46.9% iso-octane mixture. ................................................................................... 51

xFigure 5.1: Reactivity map of natural gas, petroleum, and coal derived jet fuel in the
pressurized flow reactor. .......................................................................... 57
Figure 5.2: Autoignition of natural gas, petroleum, and coal derived jet fuel in the single cylinder research engine. ............................................................... 59
Figure 5.3: Autoignition of surrogate for Fischer-Tropsch jet fuel. ........................... 61
Figure 6.1: Reactivity of n-decane, Fischer-Tropsch jet fuel, and n-decane/iso-octane blend based on CO production. ................................................................ 66
Figure 6.2: CO and CO2 production during n-decane oxidation. ............................... 67
Figure 6.3: Chromatogram of the 700 K n-decane oxidation sample......................... 68
Figure 6.4: Chemical structure of the identified species during n-decane oxidation.. 69
Figure 6.5: Reactivity map of decalin oxidation in the PFR....................................... 70
Figure 6.6: Chemical structure of the identified species during decalin oxidation. ... 72
Figure 6.7: MS (top) and FID (bottom) chromatograms produced from decalin oxidation at 690 K. ................................................................................... 74
Figure A.1: Picture of PFR controllers with arrows identifying main power supply control switches...................................................................................... 100
Figure A.2: Picture of PFR computer with the arrow identifying the PFR mass flow controller. ............................................................................................... 101
Figure A.3: Picture of sample connections to the CO and CO2 detector, and calibration controls................................................................................. 102
Figure A.4: Picture of air operated sample valve identified with arrow................... 103
Figure A.5: Picture of the ISCO Model 500D fuel syringe pump. ........................... 103

xiABSTRACT
The Preignition and Autoignition Oxidation of Alternatives to Petroleum Derived JP-8 and their Surrogate Components in a Pressurized Flow Reactor and
Single Cylinder Research Engine Matthew S. Kurman
Dr. Nicholas P. Cernansky and Dr. David L. Miller The U.S. Department of Defense (DoD) Directive 4140.13 has required the
use of JP-8 specification fuels whenever possible. The specifications for JP-8 allow a
broad range of thermophysical characteristics, such as chemical composition,
distillation characteristics, and heat of combustion, which can be produced from
multiple sources and processes. For applications in military power systems operating
with compression ignition (CI) engines and some gas turbines, it is necessary to study
the effects of fuel source on the preignition and autoignition reactivity that occurs in
the 600-1000 K temperature range of the resulting jet fuels and to develop reactivity
surrogates for their behavior. The use of alternative sources for JP-8, rather than
petroleum sources, has these advantages: improved U.S. energy security, a wider
range of feedstocks, and decreased emissions of SOx and particulate matter. To study
the effect of fuel source, the oxidation of three jet fuels from different sources
(petroleum, natural gas, and coal) was examined. Preignition experiments were
conducted in a pressurized flow reactor (PFR) under lean, dilute conditions at
temperatures of 600-800 K and 8 atm pressure. Autoignition experiments were
conducted in a single cylinder research engine. Results were compared to a typical
sample of petroleum-derived jet fuel.
Petroleum, natural gas, and coal derived fuels contain hundreds of
components, many with unknown reactivity, and even if known, proper kinetic

xiisimulations require computational resources beyond current abilities. To overcome
these limitations, the use of surrogates, mixtures of approximately 1-10 components
that mimic the properties and behaviors of the real fuel, has been recognized as a
feasible approach to chemical kinetic model building. Since the chemical
composition varies widely between petroleum and alternative jet fuels, new
surrogates need to be developed for alternative fuels as well.
Samples of the jet fuels derived from coal, natural gas, and petroleum were
oxidized in two complementary experimental facilities to explore their preignition
and autoignition behavior. In both facilities, the order of reactivity, based on carbon
monoxide production, in descending order was Fischer-Tropsch, petroleum, and coal.
The reactivity differences are attributed to composition differences. Results showed
that all the fuels exhibit negative temperature coefficient behavior as expected, but
Fischer-Tropsch jet fuel produces significantly more carbon monoxide than
petroleum and coal derived jet fuel before entering the negative temperature
coefficient region.
Possible surrogates and their components were also tested in the facilities to
elucidate how compositional differences affect preignition and autoignition
chemistry. A mixture of n-decane/iso-octane was studied as a surrogate fuel for
Fischer-Tropsch jet fuel. The mixture was then tuned to approximate the low and
intermediate temperature reactivity of Fischer-Tropsch jet fuel. Fischer-Tropsch jet
fuel and the mixture showed similar reactivity based on measurements of carbon
monoxide.
xiii To further explore the chemistry and impact of the n-decane component of the
surrogate for Fischer-Tropsch jet fuel and the decalin component of coal derived jet
fuel, PFR experiments were conducted to identify intermediate species profiles using
gas chromatography with flame ionization detection and gas chromatography coupled
to a mass spectrometer. The major intermediate species that were identified with n-
decane oxidation included components of the functional groups aldehydes and
alkenes. Cyclic species were the major species observed with decalin oxidation. The
research presented will aid in the overall development and use of chemical kinetic
models that will be employed for simulating combustion characteristics of gas
turbines and CI engines while improving such traits as fuel efficiency, emissions, and
power output.


1CHAPTER 1: INTRODUCTION
1.1 Motivation
While there are replacements for hydrocarbon fuels in many energy sectors,
there are no candidates to replace the energy density of liquid fuels for air
transportation and long haul freight movers. As the world approaches the production
maximum from petroleum reserves, there exists a need to produce alternatively
sourced liquid fuels, defined as fuels from non-petroleum sources. If the raw material
for such fuels is discovered in the U.S., their use would increase U.S. energy security.
Many such replacements exist: for example, a jet fuel using Fischer-Tropsch
processing of syngas (CO and H2) generated from natural gas (Muzzell et al., 2006)
or a Pennsylvania State University, University of Dayton, PARC Technical Services,
and Wright-Patterson Air Force Base coal-derived jet fuel manufactured in a
hydrotreating process (Balster et al., 2008), to name two. Both fuel samples meet
most U.S. military jet fuel JP-8 specifications and could probably be used as the
international commercial jet fuel, Jet A-1, but with the addition of a fuel system icing
inhibitor, a corrosion inhibitor, and a static dissipater for JP-8 applications.
Though envisioned as a jet fuel, the DoD has designated JP-8 as the single
fuel forward for all combustion engines wherever applicable (TARDEC, 2001). This
includes running JP-8 in compression ignition (CI) engines, where the preignition and
autoignition chemistry at temperatures between 600 and 1000 K can play a crucial
role. Combustion chemistry at these temperatures is a complex process involving
competing reaction paths and noted by phenomena such as cool flames and Negative
Temperature Coefficient (NTC) behavior.

2 As simulations have become more integral to the design process, chemical
kinetic models for JP-8 are needed for the design of both next generation jet and CI
engines. Because of its broad composition, direct development of chemical kinetic
models for JP-8 is not possible. Instead, utilization of appropriate surrogates,
mixtures of approximately 1-10 components that mimic the properties and behavior
of the real fuel, have been suggested as a feasible approach to model building (Colket
et al., 2007).
JP-8 composition specifications are based on general physical properties
rather than specific compositions, as shown in Table 1.1, to allow its production from
alternative feedstocks and with a variety of processing methods. This practice leads
to wide variations in JP-8 composition. JP-8 derived from petroleum contains
significant amounts of n- and iso-paraffins, mono- and dicycloparaffins, and alkylated
aromatics. Jet fuel produced through a Fischer-Tropsch process is composed entirely
of n- and iso-paraffins. Coal-derived jet fuel produced through hydrotreating
produces a fuel of 97% mono-, di-, and tricycloparaffins (Balster et al., 2008).
The use of alternative sources for JP-8 rather than petroleum derived fuels
has these advantages: improved U.S. energy security, a wider range of feedstocks,
and decreased emissions of SOx and particulate matter. U.S. energy security can be
improved with the aid use of resources found within the U.S. If resources such as
coal and natural gas can be used to produce acceptable liquid fuels, it reduces the
need to rely on foreign nations for petroleum. Harmful emissions, such as SOx and
particulate matter, are reduced from the Fischer-Tropsch and coal-derived jet fuel as
they contain no sulfur or aromatic components.

3Table 1.1: JP-8 specifications defined by MIL-DTL-83133E.
Property Minimum Maximum Aromatics - 25.0% vol Alkenes - 5.0% vol Naphthalenes - 3.0% vol Total Sulfur - 0.30% mass Distillation – 10% Recovered - 205 °C Evaporation Point - 300 °C Flash Point 38 °C - API Gravity 37.0 51.0 Freezing Point - -47 °C Heat of Combustion 42.8 MJ/kg - Hydrogen Content 13.4% mass - Fuel System Icing Inhibitor 0.10% vol 0.15% vol
1.2 Research Objective
The objective of this study was to compare the low and intermediate
temperature oxidation characteristics of petroleum derived jet fuel and jet fuel
produced from alternative sources and processes. The experimental data will aid in
the development and validation of chemical kinetic mechanisms which will be useful
in designing new and improved engines.
1.3 Research Program
The experimental approach of this study was to oxidize a selected jet fuel,
under lean, dilute conditions at temperatures of 600-800 K (low and intermediate
temperature regime) and 8 atm pressure in a pressurized flow reactor and single
cylinder research engine. There was also an attempt to develop a surrogate fuel for
low and intermediate temperature reactivity. Chapters in this thesis are based on
presented papers and papers in preparation for journal submission. The specific
experimental stages are listed below:
4 (1) Examine the reactivity of a natural gas based Fischer-Tropsch jet fuel
manufactured by Syntroleum and designated as S-8. Compare reactivity to that of
petroleum-derived JP-8 in the pressurized flow reactor, and propose surrogate
components for Fischer-Tropsch jet fuel. The program included: (a) determining the
reactivity of the fuels by measuring the CO produced over the low and intermediate
temperature regime and examining the similarities and differences of the alternative
and petroleum fuels with respect to CO production; (b) choosing a mixture of
hydrocarbon components that include linear and branched alkanes to represent the
average molecular formula of Fischer-Tropsch jet fuel and to approximate a cetane
number slightly higher than that of jet fuel, in anticipation of the higher reactivity of
Fischer-Tropsch jet fuel; and (c) after choosing a mixture of n-decane and iso-octane
as surrogate components, performing experiments with the pressurized flow reactor
while varying the cetane number of the surrogate mixture to match reactivity of a
sample of Fischer-Tropsch jet fuel. This particular phase of the study was the first
investigation of an alternative jet fuel in the pressurized flow reactor at Drexel
University.
(2) Further explore the n-decane/iso-octane mixture as a surrogate for
Fischer-Tropsch jet fuel. The experimental method consisted of: (a) tuning the binary
mixture composition to approximate the reactivity of Fischer-Tropsch jet fuel
throughout the low and intermediate temperature regime; and (b) measuring the
intermediate species produced during the low and intermediate temperature oxidation
of neat n-decane with the aid of gas chromatography and mass spectrometry, in order
to identify the branching pathways controlling auto-ignition. n-Decane was studied

5neat, rather than in a n-decane/iso-octane mixture, in order to simplify the
investigation of the branching pathways produce from n-alkane oxidation.
(3) Investigate and compare the reactivity of petroleum derived, natural gas
derived Fischer-Tropsch, and coal-derived jet fuel in both the pressurized flow reactor
and a single cylinder research engine. Decalin is the most prevalent component of
coal-derived jet fuel. In order to determine important pathways for the oxidation of
decalin, decalin was oxidized in the flow reactor and samples were extracted for
analysis. Ultimately, the pathways will aid in the improvement and advancement of
the chemical mechanism for decalin in the low and intermediate temperature regime
at elevated pressure. The overall experimental method consisted of: (a) exploring and
comparing the reactivity of each of the jet fuels in both facilities; (b) examining the n-
decane/iso-octane mixture in the single cylinder research engine to test the oxidation
behavior and to compare the reactivity to that of the Fischer-Tropsch jet fuel; (c)
collecting and performing a detailed chemical analysis of decalin PFR samples with
the aid of gas chromatography and mass spectrometry. This particular phase of the
study was the first time that alternative fuels, natural gas and coal derived jet fuel,
were examined in the single cylinder research engine at Drexel University.

6CHAPTER 2: BACKGROUND AND LITERATURE REVIEW
2.1 Overview
This chapter aims to provide an overview of the present state of our
understanding of hydrocarbon combustion in the low and intermediate temperature
regimes. Additionally, this chapter describes past and ongoing combustion research
related to n-alkanes, cycloalkanes, and alternative jet fuels. Section 2.2 introduces
details pertaining to the chemistry of hydrocarbon oxidation and the theory of
chemical kinetics. Section 2.3 discusses kinetics of small alkanes. Section 2.4
discusses details of previous n-decane work. Previous work concerning cycloalkanes
is described in Section 2.5. Section 2.6 discusses petroleum and alternative jet fuels.
Section 2.7 presents the closure to Chapter 2.
2.2 Hydrocarbon Oxidation
The oxidation of saturated, straight chain hydrocarbons is characteristically
divided into three temperature regimes:
1.) Low temperature (< 650 K),
2.) Intermediate temperature (650-1000 K), and
3.) High temperature (> 1000 K).
The temperature boundaries correspond to atmospheric pressure, and shift to higher
temperatures with increasing pressure. Different reaction pathways are dominant at
different temperatures, and the pathways are controlled by the concentration of
radical species. At low temperatures, alkylperoxy radicals (RO2•) are dominant.
Hydroperoxy (HO2•) and hydroxyl (OH•) radicals control the intermediate

7temperature regime, and OH•, oxygen (O•), and hydrogen (H•) radicals dominate the
high temperature regime. Hydrocarbons with other structures may or may not behave
accordingly to this hierarchy. Therefore, chemical composition affects reactivity
behavior of hydrocarbons. Each of the temperature regimes come into play in CI
engines.
Modern explanations of hydrocarbon oxidation are based on the mechanism of
free radicals proposed by Semenov (1935). The general theory of autoignition for
smaller n-paraffins is well-accepted based on extensive research and modeling (e.g.,
Miller et al., 2005; Law, 2006). Figure 2.1 shows the general scheme of linear and
lightly branched paraffins with carbon number 3 and higher. Initially, hydrogen is
abstracted from the parent fuel molecule RH to produce the R• alkyl radical. The
formation of the initial radical from the parent fuel molecule is known as primary
initiation. Secondary initiation occurs when a radical is formed from a stable species
other than the parent fuel molecule. Oxygen addition to the alkyl radical will produce
the alkylperoxy radical RO2•. The alkylperoxy radical has a number of different
possible pathways (e.g., decomposition to produce alkoxy radicals, RO•, and
aldehydes RCHO, reversible isomerization to produce an alkylhydroperoxy radical,
Q•OOH, and reaction with a fuel molecule to produce an alkyl radical, R•). The
reaction of RO2• with a fuel molecule yields one alkyl radical, R•, and
alkylhydroperoxide, ROOH. Reactions that convert one radical into another radical
are known as chain propagation reactions. If the temperature is high enough, the
alkylhydroperoxy may decompose by beta scission to produce an alkene, a carbonyl,
and a hydroxyl, or react with O2 to produce a dihydroperoxide. This may decompose

8to produce a ketohydroperoxide and a hydroxyl. Further decomposition will produce
another hydroxyl, a carbonyl, and an aldehyde. If the temperature increases to
approximately 850 K, the intermediate temperature region reactions will become
important, and the alkyl radical can react with O2 to produce a hydroperoxy radical,
HO2•, and an alkene. The HO2• may abstract an H-atom from the parent fuel
molecule producing hydrogen peroxide. Decomposition of hydrogen peroxide, when
the temperature is high enough, produces 2 hydroxyls. The conversion of 1 radical
into 2 radicals is called a chain branching pathway. Hydroxyls react with parent fuel
molecules to produce alkyl radicals and H2O. Reactions which reduce the number of
radicals in the system are called termination reactions.
Figure 2.1: Branching pathways of hydrocarbon oxidation at low and intermediate temperatures. Based on extensive experimental and modeling
research of linear and lightly branched paraffins of C3 – C8 by many groups.

9 Clearly, hydrocarbon oxidation chemistry that occurs in the low and
intermediate temperature regime is a complex process that contains numerous
competing reactions. To add to the complexity, as the molecular weight of the
hydrocarbon increases, the number of possible intermediate species produced from
the different reaction pathways at these temperatures also increases. To further
improve and expand chemical kinetic models, gas chromatography and mass
spectroscopy can be utilized to identify and quantify intermediate species produced
and to classify which reaction pathways are dominant.
2.3 Chemistry of Small Alkanes
Alkanes represent the most abundant chemical class found in JP-8 jet fuel
(Edwards et al., 2001). This section is a brief report of selected work dealing with
alkanes lighter than n-decane. Propane has been previously studied with the
pressurized flow reactor (Koert et al., 1994). Propane was oxidized between 600-
900 K, with lean equivalence ratio of 0.4, and elevated pressure of 10 and 15 atm.
Low temperature reactivity, as a measure of CO production, occurred during 680-
770 K. Maximum production of several species produced during the oxidation
occurred at approximately 720 K. CO was the major species that was produced with
a peak production at 780 K. Propane was also studied in a jet stirred flow reactor
with temperatures of 900-1200 K, pressures ranging from 1-10 atm, and a wide range
of equivalence ratios (Dagaut et al., 1987). There has been rapid compression
machine work with n-butane between 700-900 K, a wide range of equivalence ratios
from 0.8-1.2, and elevated pressures from 9-11 bar (Minetti et al., 1994). Products of
combustion were also measure with the use of a gas chromatograph coupled to a mass

10spectrometer. Results indicated that 3 different distinct temperature zones can be
identified. The temperature zone between 700-760 K had two-stage ignition
characteristics such as pressure buildup and light emission from a cool flame. The
760-850 K temperature zone had a increase in total delay time with increasing
temperature to signify the negative temperature coefficient regime. From 850 K and
higher, ignition occurs in one stage and the delay time decreases. Major carbon
containing species that were identified and quantified throughout zones included 1-
butene, methanol, carbon monoxide, 2-butene, and ethene. A noticeable similarity
between each of the products with respect to two-stage ignition was observed (Minetti
et al., 1994).
Since it is a primary reference fuel for gasoline, iso-octane (2,2,4-trimethyl-
pentane) has received considerable attention. A modeling study by Curran et al.
(2002) reviewed experimental data over the temperatures 550-1700 K and pressures
1-45 atm and developed an iso-octane model. The kinetic model for iso-octane has
been modified and updated (Tanaka et al., 2003; He et al., 2005; Jia et al., 2006;
Chaos et al., 2007) as new data have become available. Neat iso-octane has
previously been investigated in the PFR (Lenhert, 2004a). The PFR was operated
under the controlled cool down methodology with 8 atm pressure, an equivalence
ratio of 1.0, a residence time of 250 ms, and over the temperature range of 600 to
765 K. The start of the NTC regime was at 665 K with a peak production of
approximately 250 ppm CO and 350 ppm CO2. The major alkene intermediate that
was produced during the oxidation process was 2-methyl-1-propene with a peak
production of approximately 175 ppm at 670 K. The major aldehyde identified was
11formaldehyde with a peak production of approximately 300 ppm at 670 K. A
comprehensive review of alkanes used in jet fuel surrogates was reported (Colket et
al., 2007).
2.4 Chemistry of n-Decane
n-Decane is a moderate molecular weight linear alkane that may be used as
potential surrogate component for Fischer-Tropsch jet fuel. There are relatively few
detailed and validated n-decane reaction mechanisms available which include low
temperature reaction pathways at elevated pressures. Several studies have focused on
modeling n-decane at the low and intermediate temperature regimes. The
development of models at lower temperatures requires additional speciation data to
determine the dominant reaction paths.
The oxidation of n-decane at low and intermediate temperatures has been
experimentally studied by Dagaut et al., (1994) for stoichiometric n-decane in a jet-
stirred reactor at 550-1150 K temperature, 10 atm pressure, and 1 s residence time. A
model was developed and focused on the production of cyclic ethers at low
temperatures. However, the model’s ability to transition from low and intermediate
to high temperatures was poor and it was concluded that increasing the importance of
peroxy radicals was necessary.
A reaction mechanism with 600 reactions and 67 species based on flat-flame
burner experiments predicted the NTC behavior seen in the transition from low and
intermediate to high temperatures (Bikas et al., 2001). However, when this model
was applied to recent data, it did not predict the measurements very well (Zhao et al.,

122005). Overall, these n-decane models perform reasonably well at high temperatures
but do not capture the relevant low and intermediate temperature behavior.
Several researchers have focused on developing models for a wide range of
n-alkanes including n-decane. A unified model for high molecular weight alkanes,
including n-decane, simulated autoignition delay times (Buda et al., 2005).
Validation experiments were conducted in shock tubes and rapid compression
machines. Ranzi et al. (2005) conducted a wide range kinetic modeling study of the
partial oxidation and combustion of n-alkanes up to C16. The mechanism included
lumping techniques to simplify the model without losing chemical detail and was
experimentally validated with a broad range of experimental conditions. Sirjean et al.
(2008) generated a detailed chemical kinetic reaction model used for modeling
pyrolysis and oxidation of n-alkanes up to C12 at high temperatures. The model
contains 1459 reactions and 194 species. Validation tests were conducted with
laminar flame speed measurements, ignition delay times and species profiles with
shock tubes, and species concentration profiles with jet stirred and flow reactors.
Westbrook et al. (2009) developed comprehensive detailed chemical kinetic reaction
mechanisms for combustion of n-alkanes from C8-C16. These mechanisms include
both high temperature and low temperature reaction pathways. The n-decane reaction
mechanism contains 3878 reactions with 940 species. Validation of the mechanism
includes experimental data from shock tube ignition, rapid compression machine
ignition, jet-stirred reactors, flow reactors, and laminar flame experiments.

132.5 Chemistry of Cycloalkanes
Research exploring the branching pathways of cycloparaffins at low and
intermediate temperatures is scarce. Research on cyclopentane and cyclohexane in
shock tubes was performed over equivalence ratios 0.5-2, a temperature range 1230-
1800 K, and a pressure range of 7.3-9.5 atm (Sirjean et al., 2007). The onset of
ignition was detected with excited OH radical emission using a photomultiplier tube.
The shock tube experiments showed that cyclopentane is much less reactive than
cyclohexane, with the autoignition delay times for cyclopentane being 10 times
longer than cyclohexane. Cyclohexane was much more reactive due to the formation
of cyclohexyl radicals, in which 51 % of the cyclohexyl radicals react to 1-hexen-6-
yl, and 45 % react to form cyclohexene and hydrogen radicals. Whereas,
cyclopentane reacts to form cyclopentyl radicals in which 80 % of cyclopentyl
radicals react to 1-penten-5-yl radicals and 12 % react to form cyclopentene and
hydrogen radicals. The formation of the additional hydrogen radicals in cyclohexane
reactions promotes a branching step with oxygen molecules to produce oxygen atoms
and hydroxyl radicals which support chain branching pathways. The additional chain
branching pathways are ultimately responsible for the increase in reactivity of
cyclohexane compared to cyclopentane.
In our facilities, the low temperature oxidation (600-800 K) of
methylcyclohexane was studied (Lenhert, 2004b). Intermediate species identification
and quantification showed that methylcyclohexane (MCH) undergoes a
dehydrogenation process at preignition conditions in contrast to previous
investigators who proposed the removal of the methyl group. Hydrogen abstraction
from the ring is followed by molecular oxygen addition and internal isomerization,

14therefore, the ring tends to remain closed. Alkenes are then produced from the
decomposition of the molecule.
Another study (Natelson et al., 2007), comparing the reactivity of
methylcyclohexane and n-butylcyclohexane (nBCH), found that the MCH was
unreactive alone whereas nBCH was reactive. Recently, a low temperature oxidation
mechanism for methylcyclohexane was developed based on autoignition experiments
in a rapid compression machine (Pitz et al., 2007). The ignition delay times,
indicated that the oxidation of methylcyclohexane proceeds through the NTC regime
similar to straight chain alkanes. Another study showed that aromatic components
were produced from cycloparaffin flames (McEnally et al., 2005). The comparison of
aromatic species production from cycloparaffins and their conjugate alkenes showed
similar conversions and it was argued that the aromatics were produced from
cyclization of the alkenes and not direct dehydrogenation reactions of the rings.
However, it is important to note these flame experiments emphasize the high
temperature oxidation pathways.
Research on cyclohexane has also expanded and included low temperature
combustion studies. Among the experiments used for model comparison were
autoignition studies in a rapid compression machine at temperatures of 600-900 K
(Lemaire et al., 2001). A model for the oxidation of cyclohexane was developed for
low to high temperatures (Silke et al., 2007). To predict the production of benzene,
the model included dehydrogenation of cyclohexane. An additional cyclohexane
mechanism has been developed based on density functional theory (Cavallotti et al.,
2007).

152.6 Chemistry of Petroleum and Alternative Jet Fuels
This section will discuss petroleum derived JP-8 and two different alternatives
to petroleum derived jet fuel. All jet fuel samples were acquired from Wright-
Patterson Air Force Base (WPAFB). The first fuel that will be discussed is petroleum
JP-8, POSF 3773, manufactured from a conventional refining process. The second
fuel that will be discussed is a Fischer-Tropsch jet fuel, POSF 4734, derived from
natural gas. The third is coal-derived jet fuel, POSF 4765. Two methods of
producing coal-derived jet fuel, direct and indirect liquefaction, will also be
discussed. Table 2.1 shows an analysis of fuel properties provided with the samples.
Table 2.1: Comparison of selected properties of the jet fuel samples.
Jet Fuel Sample Petroleum POSF 3773
F-T natural gas POSF 4734
Coal POSF 4765
Aromatics 15.9% vol 0.0% vol 1.8% Alkenes 0.7% vol - -
Cetane Index 45.8 - - API Gravity 44.6 55.3 31.1
Heat of Combustion 43.3 MJ/kg 44.1 MJ/kg 43.0 MJ/kg Hydrogen Content 13.9% mass 15.3% mass 13.2% mass Fuel System Icing
Inhibitor 0.07% vol - 0.00% vol
Total Sulfur 0.07% mass 0.00% mass 0.00% mass IBP Distillation 150°C 153°C 181°C 10% Distillation 170°C 169°C 192°C 20% Distillation 176°C 176°C 194°C 50% Distillation 196°C 201°C 204°C 90% Distillation 237°C 249°C 243°C EP Distillation 256°C 271°C 270°C

162.6.1 Petroleum JP-8
Petroleum JP-8 is derived from the distillate fuel fraction in a conventional
refining process and is used as the standard fuel for the United States Air Force
aviation power systems. Fractional distillation utilizes crude oil, which contains
many hydrocarbons with different molecular masses, to produce various petroleum
based products. The distillation process includes heating the crude oil and then
directing it to a fractionation column where the oil is separated based on boiling
points. Three main fractions are produced from the distillation process: the naphtha
fraction (125-160°C boiling range) consists mainly of lighter hydrocarbons which are
used as gasoline products; the middle distillate kerosene fraction (160-250°C boiling
range) consists of hydrocarbons which are processed to kerosene and jet fuels; and
heavy residuum distillate fraction (250-350°C boiling range) which is processed to
manufacture diesel and heating oils (Speight, 2006). As with most real fuels, JP-8
contains many different classes of hydrocarbons and a wide variability in chemical
composition.
The petroleum JP-8 sample used in this study is designated by WPAFB as
POSF 3773. As with other JP-8 fuels, POSF 3773 contains linear and branched
alkanes, cyclo-alkanes, aromatics, and alkenes as shown in Table 2.2 (Holley et al.,
2007). As mentioned in Section 1.1 and shown in Table 1.1, the specifications for
JP-8 are based on general physical properties rather than specific chemical
composition which leads to wide variations in chemical composition between
different samples of JP-8. Holley at al. (2007) compared POSF 3773 to a “world
survey average” blended sample of JP-8, US commercial jet fuel (Jet A), US Navy jet

17fuel (JP-5), and Russian jet fuel (TS-1), and POSF 3773 was shown to represent
typical composition of the jet fuels. Natelson et al. (2008) showed that POSF 3773
represented typical low temperature reactivity behavior of three JP-8 samples.
Therefore, the sample of “typical” petroleum derived JP-8 which is assigned as POSF
3773 was used in this study.
Table 2.2: Composition of petroleum JP-8, POSF 3773.
Class Composition (%) Paraffins (n- and i-) 57.2
Cycloparaffins 17.4 Dicycloparaffins 6.1 Tricycloparaffins 0.6 Alkylbenzenes 13.5 Indans/tetralins 3.4
Indenes <0.2 Napthalene <0.2 Napthalenes 1.7
Acenaphthenes <0.2 Acenaphthylenes <0.2 Tricylic aromatics <0.2
2.6.2 Fischer-Tropsch Jet Fuel
The chemical composition of Fischer-Tropsch jet fuel differs greatly from that
of petroleum-derived JP-8. Our sample, designated by Wright-Patterson Air Force
Base as POSF 4734, is called S-8 by its manufacturer, Syntroleum, and is composed
entirely of alkanes as shown in Table 2.3 (Shafer et al., 2006). Syntroleum
manufactured this jet fuel using natural gas as the feedstock to produce a syngas of
CO2 and H2. The syngas is then converted to liquid hydrocarbons by utilizing the
Fischer-Tropsch process. Further analysis has been conducted to determine the major

18components of S-8 (Bruno et al., 2006). Table 2.4 shows the components identified
utilizing gas chromatography/mass spectrometry. Each component had a peak
chromatographic area count greater than 1% of the total raw total ion chromatogram
(TIC) area. The major species identified, with an area count greater than 2%, were n-
dodecane, n-undecane, and 4-methyloctane. Note that the fuel contains a mixture of
linear and lightly branched alkanes of C9 to C15.
Table 2.3: Composition of Fischer-Tropsch Jet Fuel,
POSF 4734.
Table 2.4: Components in Fischer-Tropsch Jet Fuel, POSF 4734.
Class % Components > 1% Alkanes 99.7 2,5-dimethylheptane 2,6-dimethyldecane
Monocycloalkanes <0.2 4-methyloctane 4-ethyldecane Dicycloalkanes 0.3 3-methyloctane 5-methylundecane Tricycloalkanes <0.2 n-nonane 2-methylundecane Alkylbenzenes <0.2 4-methylnonane 3-methylundecane Indans/tetralins <0.2 3-methylnonane n-dodecane Naphthalenes <0.2 n-decane x,y-dimethylundecane
Substituted naphthalenes <0.2 2,5-dimethylnonane 2,4-dimethylundecane 5-methyldecane 2-methyldodecane 4-methyldecane n-tridecane 2-methyldecane n-tetradecane 3-methyldecane n-pentadecane n-undecane
As shown in Table 2.4, real hydrocarbon fuels contain many components (this
list of 25 species only contains species with molar percentages greater than 1%) and
chemical compositions that vary. Therefore, a high priority objective of several
research groups is to develop surrogates for the real fuels to aid in experimental and
modeling studies. The surrogates typically contain 2-10 components whose
combustion characteristics are known. The selection of surrogate components and

19their proportions are based on matching physical and chemical targets for the
particular application. A key target for reciprocating engine applications is auto-
ignition which depends on low and intermediate temperature reactivity.
2.6.3 Coal Derived Jet Fuel
Coal-derived jet fuel also has a chemical composition different from
conventional petroleum derived jet fuel. The fuel can be produced from methods
such as direct and indirect liquefaction. Direct liquefaction consists of reducing the
coal to a solvent at elevated temperature and pressure. The elevated temperature
promotes the cracking of the carbon-carbon bonds of the coal. The elevated pressure
preserves the solvent in liquid phase. Hydrogen gas is bubbled through the solvent,
and aided by a catalyst which increases the rate of reactions, hydrogenates the solvent
to produce liquid hydrocarbon fuel (Williams et al., 2003; Lumpkin, 1988). The
liquid hydrocarbon fuel produced contains high concentrations of cyclic compounds
with relatively low concentrations of linear alkanes (Balster et al., 2008). The coal-
derived jet fuel used in this study, designated as JP-900 POSF 4765, was
manufactured using such a direct liquefaction technique and contains mostly
cycloparaffins, as shown in Table 2.5. Another method used to produce jet fuel from
coal is the indirect liquefaction technique. The indirect liquefaction method involves
gasifying the coal to produce H2 and CO, also known as syngas. The syngas can then
be made into liquid hydrocarbons by the Fischer-Tropsch process (Larson et al.,
2003).

20Table 2.5: Composition of coal derived jet fuel, POSF 4765.
Class Composition (%)
Paraffins <1.0 Cycloparaffins 97.3 Alkylbenzenes <1.0 Indans/tetralins 1.6
Napthalene/napthalenes <1.0
2.6.4 Blends of Alternative Jet Fuels
There are issues with operating power systems with 100 % alternative fuels.
The lack of aromatics in the alternative fuels can be detrimental to the seals in current
power systems. Fischer-Tropsch jet fuel causes the seals to shrink and fail (DeWitt et
al., 2008). However, alternative fuels can be mixed with petroleum-derived JP-8. A
50/50 blend of Fischer-Tropsch jet fuel with petroleum JP-8 satisfies the military’s
requirements for a fuel to be identified as JP-8. If the concentration of Fischer-
Tropsch jet fuel is increased to more than 50 %, the minimum specific gravity is
outside the acceptable range.
Corporan et al. (2007) developed and studied mixtures of Fischer-Tropsch
with petroleum JP-8 in engine experiments. A T63 turboshaft engine and an
atmospheric swirl-stabilized research combustor were used to investigate emission
characteristics of traditional petroleum derived JP-8, natural gas derived Fischer-
Tropsch jet fuel, and blends of the petroleum and Fischer-Tropsch jet fuel. A wide
range of temperatures and equivalence ratios were tested. The analysis revealed a
notable reduction in particulate matter with the use of the Fischer-Tropsch/petroleum
JP-8 blend on both the turboshaft engine and research combustor. Also, with the use
of the Fischer-Tropsch/petroleum JP-8 blend, reductions of over 50 % of particulate

21mass, and a reduction in smoke number with the engine tests were observed.
Polycyclic aromatic hydrocarbon (PAH) species were not detected in the soot
samples collected with blends of more than 50 % Fischer-Tropsch jet fuel.
Additional benefits include a reduction in SOx levels, as a result of the sulfur free
characteristic of synthetic jet fuel addition to the blend, and no measurable fuel usage
difference or negative engine performance were observed. (Corporan et al., 2007).
2.7 Closure
This chapter presented an overview and review of ongoing combustion
research and modeling efforts related to n-alkanes, cycloalkanes, petroleum JP-8, and
alternative jet fuels in the low and intermediate temperature regimes. The oxidation
of hydrocarbons in these temperature regimes is not a straight forward combustion
process that only produces CO2 and H2O. Many intermediate reactions are occurring.
As the molecular weight of the hydrocarbon increases, more intermediate species are
produced. To predict the combustion behavior of these hydrocarbons, chemical
kinetic models are developed. The models can predict a wide range of combustion
characteristics such as laminar flame speeds, ignition delay times, and species
concentration profiles.
Petroleum JP-8, Fischer-Tropsch natural gas derived jet fuel, and coal derived
jet fuel were also discussed. Petroleum derived JP-8 is derived from the distillate fuel
fraction in a conventional crude oil refining process whereas the natural gas and coal
derived jet fuels are manufactured from non-petroleum based feedstocks. Producing
liquid jet fuels from different sources and processing methods leads to differences in

22chemical composition. To meet the current specifications of a fuel to be identified as
JP-8, blends of alternative fuel with petroleum derived JP-8 need to be utilized.

23CHAPTER 3: EXPERIMENTAL FACILITY
3.1 Introduction
The oxidation of alternative fuels for petroleum JP-8 was studied with the aid
of the pressurized flow reactor (PFR), single cylinder research engine facility, and the
analytical chemistry lab, consisting of a gas chromatograph (GC) with a flame
ionization detector (FID) coupled to a mass spectrometer (MS). Section 3.2 describes
the pressurized flow reactor facility, which was used extensively throughout the
course of this research for preignition studies, and Section 3.3 discusses the single
cylinder research engine facility, which was used to investigate autoignition
reactivity. The PFR was operated using a controlled cool down methodology, which
consists of heating the flow reactor and allowing it to cool at a controlled rate, as
described in Section 3.4. Samples extracted from the PFR, throughout the low and
intermediate temperature regime, were analyzed online utilizing an Ultramat 22P
CO/CO2 analyzer, as described in Section 3.5. Offline analysis was achieved by
storing samples in a heated sample storage system, described in Section 3.6, for
transportation of the collected samples from the pressurized flow reactor to the
analytical facility. Section 3.7 describes the analytical chemistry lab which was used
to analyze the collected species. Section 3.8 contains subsections that describe the
upgrades and replacement of parts for the pressurized flow reactor facility and
analytical equipment. A brief closure to this chapter is presented in Section 3.9.
243.2 Pressurized Flow Reactor Facility
The PFR, shown in Figure 3.1, is designed to study combustion chemistry
with relative isolation from fluid mechanics and temperature gradients (Koert et al.,
1992). The PFR can safely reach temperatures up to 850 K. The PFR is designed to
withstand pressures up to 20 atm, however, during this study, 8 atm was the
maximum experimental pressure. The key operational feature of the PFR is a quartz
reactor tube within a pressure vessel. The inside of the reactor tube and the annulus
between it and the pressure vessel are maintained at the same pressure, which is
controlled by a pressure regulating valve. Synthetic air, composed of nitrogen (purity
= 99.9%) and oxygen (purity = 99.994%), is heated to the reaction temperature. A
high pressure syringe pump (Isco 500D) injects the liquid fuel into the centerline of a
heated nitrogen stream to ensure vaporization. The synthetic air and the prevaporized
fuel/nitrogen mixture are mixed in an opposed jet annular mixing nozzle at the
entrance of the quartz reactor tube. A water-cooled, borosilicate glass-lined stainless
steel probe extracts samples from the centerline of the quartz reactor tube and
quenches the chemical reactions. A type-K thermocouple is also integrated into the
probe assembly to measure the sample temperature. To limit temperature rise due to
heat release, nitrogen is added to the fuel. The nitrogen dilution of the fuel is defined
by,
OxygenNitrogen
OxygenOxygenNitrogen
QQQQQ
Dilution+−+
=76.4
% , (1)
where NitrogenQ and OxygenQ are the total volumetric flow rate of nitrogen and oxygen.

25Temperature rise is monitored by comparing inlet and sample temperatures; average
temperature rise was 25 K, with maximum values of approximately 35 K at peak
reactivity. To minimize heat loss and to maintain isothermal conditions of the PFR,
the walls of the pressure vessel are insulated and the reactor is heated with eight
800 W independently controlled bead heaters.
Figure 3.1: Schematic of the PFR identifying key components. 3.3 Single Cylinder Research Engine Facility
Engine experiments were conducted with a modified single cylinder, variable
compression ratio Cooperative Fuel Research (CFR) engine coupled to a
dynamometer, Fig. 3.2. The engine has a moveable cylinder head which allows for
variable compression ratios. For this study, the compression ratio was held constant
at 16:1. The bore is 8.25 cm, the stroke is 11.43 cm, and the displacement is 611 cm3.

26For each experiment, the inlet manifold pressure was 0.1 MPa, the engine speed was
750 RPM, and the equivalence ratio was 0.478. Experiments were run at an inlet
temperature of 480 K, above the boiling points of the fuels in this study and thus
eliminating concerns about fuel condensation. The fuels were injected into the air
stream well upstream of the heated inlet manifold and the fuel/air mixture passed
through turbulators to ensure mixing and complete vaporization. The engine was
operated under a premixed combustion ignition (PCI) mode controlled by the
autoignition process. Figure 3.2 shows the main components of the single cylinder
research engine facility: heated intake manifold, inlet and exhaust thermocouples, fast
sampling valve for offline analysis, gas analyzers, and data control system. Table 3.1
lists selected CFR engine specifications.

27
Figure 3.2: Schematic of the single cylinder research engine facility with key
components identified.
Table 3.1: Selected research engine specifications.
Stroke 114.3 mm Displacement 611.6 cm3 Compression Ratio 4:1-18:1 Intake Valve Opens 10° before TDC Intake Valve Closes 34° after BDC Exhaust Valve Opens 40° before BDCExhaust Valve Closes 15° after TDC
CFR EngineCFR Engine

283.4 Controlled Cool Down
For the PFR experiments, a methodology known as controlled cool down
(CCD) was followed, in which pressure and residence time were held constant while
the temperature varied. A controlled cool down experiment is performed by heating
the reactor with the 10 kW and 3 kW air circulation heaters, and the eight 800 W bead
heaters to the desired temperature for the study. Once the temperature is reached, the
heaters are turned off, and the reactor cools at a rate of 2-5 K/min. The probe
position is adjusted to maintain a constant residence time as the temperature changes.
The extracted gas sample flowed through a heated (493 K) sample line to a
nondispersive infrared (NDIR) analyzer for CO and CO2 measurements.
Experimental error is ± 25 ppm. At these temperatures, CO has been shown to be a
good indicator of reactivity; CO does not oxidize to CO2 significantly and separate
pathways produce the species (Wilk et al., 1989). The start of NTC occurs at the
temperature of maximum CO production. Table 3.2 shows the typical operating
conditions for an experiment in the PFR utilizing the CCD methodology.
Table 3.2: Typical experimental operating conditions of the PFR.
Temperature Range 600-800 KPressure 8 atm
Equivalence Ratio 0.30 Residence Time 120 ms
N2 Dilution in Fuel 80.0%
3.5 Siemens Ultramat 22P CO and CO2 Detector
During the controlled cool down experiments, the Siemens Ultramat 22P
(7MB1123-1FF13-2AA1) analyzer was used online with the PFR to monitor CO and

29CO2. Once the sample is extracted from the PFR, the sample goes through the heated
sample transfer line to the sample storage cart. The sample storage cart is connected
to the Ultramat 22P with unheated 1/8” stainless steel tubing. The tubing is unheated
to allow high boiling point species to condense before entering and damaging the
analyzer. A sample flow of 3 l/min was maintained by a stainless steel needle valve.
The sample is then analyzed by the Ultramat 22P for CO and CO2 concentrations.
The exhaust from the Ultramat 22P is plumbed directly into the fume hood that is
located near the PFR facility. The CO and CO2 channels were checked periodically
with calibration standards to test reproducibility. The reproducibility was between 3-
5% of each calibration standard tested. Experimental accuracy of the detector was ±
25 ppm.
However, during the course of this research, the Ultramat 22P was
experiencing some operational problems. There were several occasions where the
analyzer would randomly go to 5535 ppm for the CO measurement. When this would
happen, the analyzer would be turned off and then turned back on. Following the
restart, the analyzer would function properly. It is recommended for future work that
the Ultramat 22P be replaced.
3.6 Sample Storage System
The sample storage system consists of a cart mounted Cole-Parmer heated
oven which contains a 16 position electronically controlled multi-position valve with
16 10-mL stainless steel sample storage loops. The oven was maintained at a
temperature of 190 °C during experiments and placed in the sample train before the

30CO/CO2 detector. Fifteen sample loops were used for sample storage purposes and
the other loop was needed to switch from sample collection to sample analysis mode.
When connected to the PFR via the heated transfer line, which was set to
190 °C, sample gas continuously flowed through a 10 mL sample loop, then to the
CO/CO2 detector, then exited to an exhaust vent. The on/off valve A is in the open
position for sample to flow to the CO/CO2 detector during sample collection mode.
The sample was continuously monitored for CO and CO2. When a sample needs to
be collected, the step button on the electronic actuator was pressed and the multi-
position valve switched to the next 10 mL sample storage loop. Each press of the
actuator positioned the sample line to an empty loop in which a sample was collected
and stored. The remote electronic actuator displayed the position number of the
sample loop being filled. This process was continued until 15 samples were collected
in 15 different sample storage loops. Figure 3.3 is a schematic of the sample
collection system in sample collection mode.
Once all of the sample storage loops were filled, the on/off valve A on the
sample storage cart was closed. The storage cart was then disconnected from the
flow reactor and the end of the storage cart that was connected to the flow reactor was
sealed. The storage cart was then disconnected from the CO/CO2 detector. Once
disconnected, the sample storage cart was moved to the analytical lab to be connected
to the GC/MS/FID system. Once connected to the GC/MS/FID system, the on/off
valve 1 is opened and a vacuum line from the GC valve oven evacuates the transfer
line. After the transfer line is evacuated, the vacuum is turned off. To remove a
sample from the sample storage cart, the step button on the remote electronic actuator

31is pressed, and a 10 mL sample loop opens to allow the sample gas to exit through the
opened on/off valve A. The sample then enters the GC valve oven. Figure 3.4 is a
schematic of the sample collection system in sample analysis mode. Details of the
injection process and the GC valve oven are presented in Section 3.7.
Flow Reactor
On/Off Valve A
Exhaust Vent
1/16” OD x 50cm
1/16” OD x 20cm
1/8” OD x 300cm
CO/CO2 Detector
Sample Loop
1/8” OD: 10mL
1/16” OD x 2cm
16 Pos. Valve .75 mm port
VICI
Position
Step Home
VICI Remote Electronic Actuator Controller
Figure 3.3: Schematic of the heated sample storage system cart in sample collection mode.

32
This End Sealed
On/Off Valve A Exhaust
Vent (Vacuum)
1/16” OD x 50cm
1/16” OD x 20cm
1/8” OD x 120cm
GC Valve Oven
Sample Loop
1/8” OD: 10mL
1/16” OD x 2cm
16 Pos. Valve .75 mm port
VICI
Position
Step Home
VICI Remote Electronic Actuator Controller
Metering Valve
GC Injector
On/Off Valve 1 On/Off
Valve 3
On/Off Valve 2
Vacuum
Figure 3.4: Schematic of the heated sample storage system cart in sample analysis mode.
3.7 Trace GC Gas Chromatograph and Trace DSQ Mass Spectrometer
The stable intermediates that were stored in the sample storage cart were
analyzed offline using a Thermo Finnigan TraceGC gas chromatograph with flame
ionization detection (GC/FID) and the gas chromatograph coupled to the Thermo
Finnigan TraceDSQ mass spectrometer (GC/MS). For separation of the species, a
Supelco Petrocol DH column (100 m length, 0.5 µm film thickness, 0.25 mm OD)
was used. To provide sufficient separation of lighter hydrocarbons, the initial column
oven temperature was sub-ambient. Identification was determined both by analyzing
the retention time and the mass spectrum of the sample gases. The unknown mass
spectra were then compared to the NIST Version 2.0 spectrum database for

33identification purposes. Figure 3.5 shows a typical programmed GC temperature
profile. Table 3.3 shows typical MS operating parameters.
Figure 3.5: Programmed GC temperature profile.
Table 3.3: MS operating parameters.
Parameter Set Point Ion Source Temperature 200 °C
Scan Range 10-250 amu/zScan Rate 500 amu/sec
Multiplier Voltage 1812 V Ionization Mode Electron Electron Energy -70 eV
Emission Current 100 µA Chromatographic Filter 4 sec
The samples from the sample cart are transferred to the GC/MS/FID system
via a heated 1/8’’ stainless steel transfer line. The line is heated with a bead heater
controlled with a Variac to 190 °C. The line is connected to the heated GC valve

34oven. The oven contains a 4-port and 6-port multi-position electronically controlled
valve. The 4-port and 6-port multi-position valves are necessary to properly control
the supply vacuum, sample injection, and helium carrier gas. The 6-port valve allows
switching the column flow through the 1 mL sample loop to begin the analysis. The
temperature of the GC valve oven is controlled with the key pad on the GC and was
set to 190 °C. The 4-port and 6-port multi-position valves have on/off positions that
are controlled by the GC, either the key pad or the software. Figures 3.6-3.10 shows
the programmed GC valve sequence necessary for analyzing a sample. Figure 3.6
shows both the 4-port and 6-port multi-position valves in the off position. Prior to
injecting a gas phase sample into the GC, the 1 mL sample loop is evacuated to
ensure no contamination from the previous sample is present. With the 4-port and 6-
port multi-position valves in these positions, on/off valve 1 closed, on/off valve 2
open, and the metering valve open, a vacuum is created inside the 1 mL sample
storage loop. The pressure inside the 1 mL sample loop can reach 1 Torr with the aid
of the vacuum pump. Once vacuum is achieved, the step button on the remote
electronic actuator controller is pressed and on/off valve 1 is opened to allow sample
to flush out the loop. After a few seconds of flushing, on/off valve 3, the metering
valve, and on/off valve 1, are closed. With these valves closed, the sample is stored
in the 1 mL sample loop ready to be injected. However, it is necessary to always
inject at the same pressure and temperature to make certain the total mass of the
sample is constant. For this study, the sample pressure was set at 570 Torr. To
achieve this injection pressure, it is necessary to open on/off valve 3 and the metering
valve to vent any excess pressure. The pressure is monitored by a Setra pressure
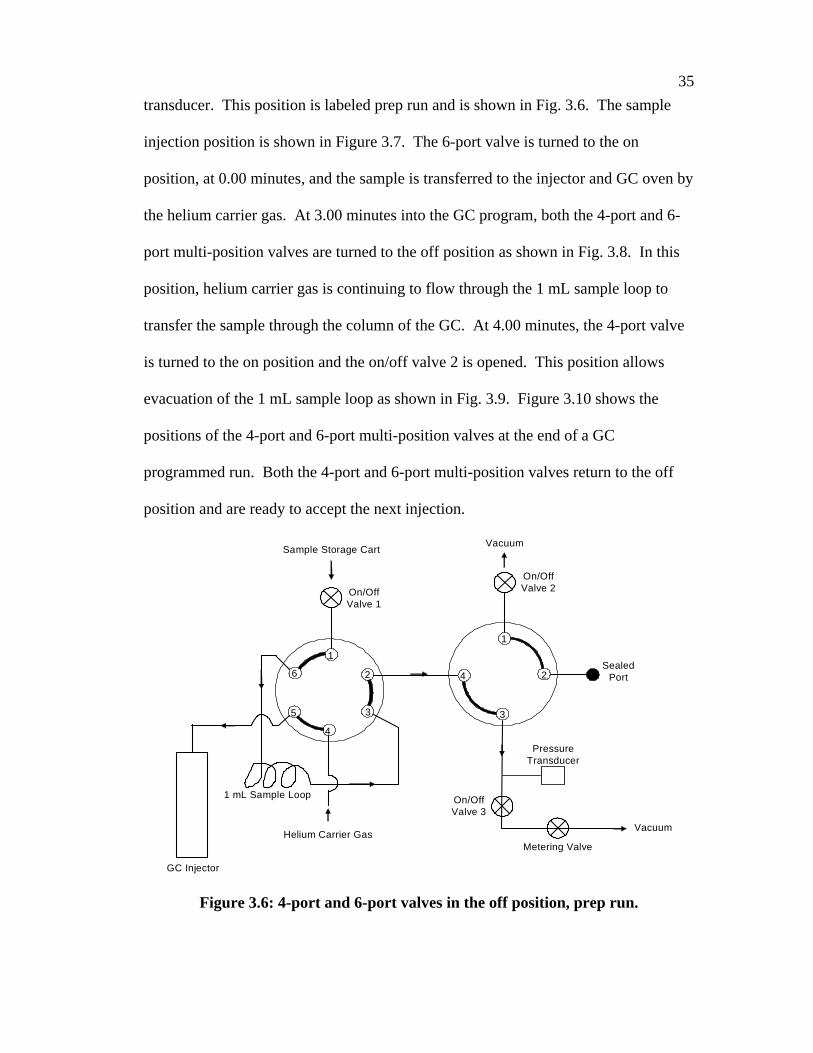
35transducer. This position is labeled prep run and is shown in Fig. 3.6. The sample
injection position is shown in Figure 3.7. The 6-port valve is turned to the on
position, at 0.00 minutes, and the sample is transferred to the injector and GC oven by
the helium carrier gas. At 3.00 minutes into the GC program, both the 4-port and 6-
port multi-position valves are turned to the off position as shown in Fig. 3.8. In this
position, helium carrier gas is continuing to flow through the 1 mL sample loop to
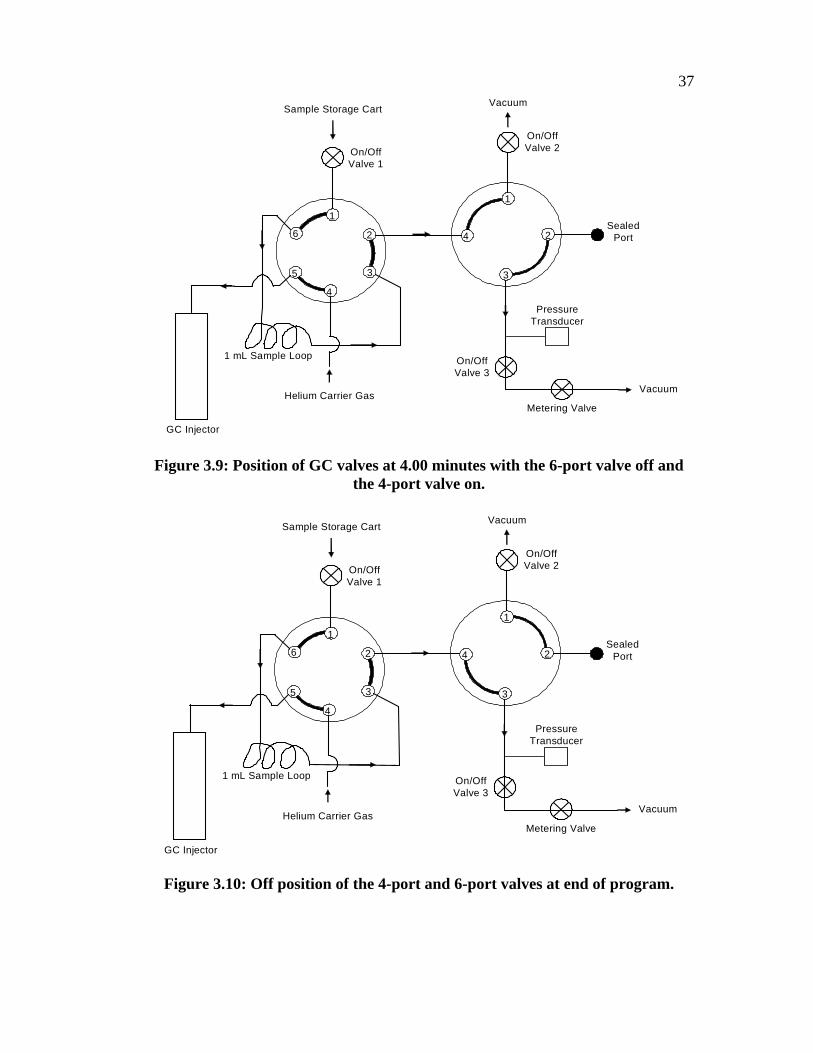
transfer the sample through the column of the GC. At 4.00 minutes, the 4-port valve
is turned to the on position and the on/off valve 2 is opened. This position allows
evacuation of the 1 mL sample loop as shown in Fig. 3.9. Figure 3.10 shows the
positions of the 4-port and 6-port multi-position valves at the end of a GC
programmed run. Both the 4-port and 6-port multi-position valves return to the off
position and are ready to accept the next injection.
1
24
3
Vacuum
Sealed Port
On/Off Valve 2
Pressure Transducer
On/Off Valve 3
Metering Valve
Vacuum
1
26
4
Sample Storage Cart
On/Off Valve 1
35
Helium Carrier Gas
GC Injector
1 mL Sample Loop
Figure 3.6: 4-port and 6-port valves in the off position, prep run.

36j
1
24
3
Vacuum
Sealed Port
On/Off Valve 2
Pressure Transducer
On/Off Valve 3
Metering Valve
Vacuum
1
26
4
Sample Storage Cart
On/Off Valve 1
35
Helium Carrier Gas
GC Injector
1 mL Sample Loop
Figure 3.7: GC valves in the sample injection position with the 6-port valve on and the 4-port valve off.
1
24
3
Vacuum
Sealed Port
On/Off Valve 2
Pressure Transducer
On/Off Valve 3
Metering Valve
Vacuum
1
26
4
Sample Storage Cart
On/Off Valve 1
35
Helium Carrier Gas
GC Injector
1 mL Sample Loop
Figure 3.8: 4-port and 6-port valves off in the sample injection position.
37
1
24
3
Vacuum
Sealed Port
On/Off Valve 2
Pressure Transducer
On/Off Valve 3
Metering Valve
Vacuum
1
26
4
Sample Storage Cart
On/Off Valve 1
35
Helium Carrier Gas
GC Injector
1 mL Sample Loop
Figure 3.9: Position of GC valves at 4.00 minutes with the 6-port valve off and the 4-port valve on.
1
24
3
Vacuum
Sealed Port
On/Off Valve 2
Pressure Transducer
On/Off Valve 3
Metering Valve
Vacuum
1
26
4
Sample Storage Cart
On/Off Valve 1
35
Helium Carrier Gas
GC Injector
1 mL Sample Loop
Figure 3.10: Off position of the 4-port and 6-port valves at end of program.

383.8 Pressurized Flow Reactor Facility Upgrades and Maintenance
Throughout the course of this research, several facility upgrades and
maintenance procedures were performed. This included updating the sample probe
construction and welding procedure, replacing the PFR inlet bead heater controller,
replacing the Chromalox 10 kW air circulation heater and controllers, cleaning the
3 kW heater electrical connectors and replacing the insulators, and replacing
miscellaneous mass spectrometer and gas chromatograph parts. The following
sections provide detailed descriptions of the upgrades.
3.8.1 Sample Probe Construction and Laser Welding
In the past, the technique for manufacturing the sample probe consisted of
TIG welding the 3/8” sample probe shaft to the sample probe tip (Koert, 1990 and
Lenhert, 2004b). Silver solder was utilized to attach the 1/16” stainless steel sheathed
thermocouple and the 1/8” stainless steel glass lined tube to the sample probe tip.
The welding was performed in the Drexel University Machine Shop. Conventional
TIG welding was sufficient for welding the 3/8” O.D. tube to the sample probe tip.
However, to TIG weld the thermocouple and the glass lined tube to the sample probe
tip, extreme care had to be taken so as not to damage the thermocouple or the glass
lining of the tube. A recent modification of this technique was to silver solder the
thermocouple and the glass lined sample tube to the back side of the sample tip and
apply stainless steel putty to the face of the tip (Lenhert, 2004b). There were
disadvantages with this technique such as the putty being soluble in water and
difficulty in the nature of TIG welding such small parts.

39 The new technique utilized the original design of the sample probe tip, but all
of the welding was performed using a laser welder. Figure 3.11 shows the sample
probe tip, sample probe shaft dimensions, and laser welding locations. Using this
type of welding system, precise welds could be achieved. Extreme care can be given
with the laser, therefore reducing the possibility of damaging either the sheathing of
the thermocouple or the glass lining of the sample tube. The sample tip was welded
to the 3/8” sample probe shaft in this manner as well. Precision Joining
Technologies, Inc. in Miamisburg, Ohio, was the vendor that was chosen to perform
the laser welding. After the sample probes were returned from the welder, the welds
were inspected to check for deterioration or cracking of the glass lining before
completing the assembly.
.3000”
1.2500”
.1100” .0625”
.1250”.3000” .3750”
ThermocoupleSample probe shaft
Stainless steel glass lined tubing
Laser weld thermocouple to tip
Laser weld tip to sample probe shaft
Laser weld glass lined tubing to tip
Side view of sample tip3-D view of sample tip
Figure 3.11: Schematic of the sample probe tip showing laser welding locations
and dimensions.

403.8.2 Replacement of the Inlet Bead Heater Controller
During a preheat phase of a PFR controlled cool down experiment on
November 14, 2006, the inlet bead heater controller failed. While monitoring the
temperature of the flow reactor’s bead heaters, the inlet temperature dropped rapidly.
The rack mounted controller was then removed from the controller assembly. Once
removed, the controller was tested and inspected. The transformer inside the
controller was at fault and unfortunately the complete controller had to be replaced.
Omega model number (Omega, CN1001TC-AI, $405.00) was used as a replacement
controller and was installed on January 29, 2007.
3.8.3 Replacement of the Chromalox 10 kW Air Circulation Heater and
Controllers
The main heater for the PFR is the Chromalox 10 kW air circulation heater.
The original unit was installed for the facility during the mid 1980’s. On January 29,
2007, the preheating phase of a controlled cool-down experiment was being
conducted and the 30 Amp, 277/480 Volt, breaker for the main power to the heater
tripped. Once the breaker tripped, an initial check of loose wires for any signs of a
malfunction revealed no problem. The breaker was reset and the preheat stage of the
experiment was continued. During the rest of the preheat stage, the rate at which the
temperature increased of the PFR was drastically reduced. Typically, the PFR can
reach operating temperature of 800 K in approximately 6-7 hours. During this
experiment it took approximately 11 hours to reach operating temperature. The
components of the 10 kW heater that were checked included wire connections, the

41breaker, and temperature controllers. After thoroughly investigating the cause of the
tripped breaker and slow heating time, it was determined that the 10 kW heater
assembly was at fault. The wire connection cap was removed from underneath the
heater and voltage was found to be present. However, a resistance check of the heater
elements showed that 4 of the 6 heater elements were faulty.
The heater is designed so that the subassembly, which includes the heater
elements, can be replaced. Initially, just the subassembly (Chromalox, TMISB-
6WXX 480V 10KW 1-3P, $6212.00) was going to be replaced. However, during the
disassembly of the 10 kW heater, it was found that the outside of the heater assembly
was corroded and holes were present in the housing. The suspected cause of this was
due to insulation being wrapped around the housing to prevent heat loss. The
insulation was probably trapping moisture which corroded the sheet metal housing of
the 10kW heater. It was then determined that the entire 10 kW heater assembly had
to be replaced. Chromalox was contacted and a quote was generated for a
replacement 10 kW air circulation heater (Chromalox, GCHISB-6WXX 480V 1-3PH
10kw, $6655.00). The heater was ordered on April 20, 2007. Due to several delays
in the manufacturing process, the heater did not arrive until August 7, 2007. The
installation of the entire 10 kW heater assembly was completed on August 8, 2007.
There was an ongoing problem with the temperature and overtemperature
controllers for the 10 kW heater. The problem was that the overtemperature
controller would trip when a fault was not present. With the old heater this was not
much of a concern and the overtemperature controller was just reset. However, since
the new heater was just installed, it was decided to upgrade both of the controllers as

42well. Both the process controller (Chromalox, 2104-R0000, $390.00) and limit
controller (Chromalox, 3101-11000, $430.00) were purchased from Chromalox. The
installation was completed on September 6, 2007.
3.8.4 Cleaning the 3 kW Heater Electrical Connectors
The 3 kW heater assembly utilizes four semi-cylindrical Lindberg heater units
wired in parallel with a 115 VAC, 50 Amp power supply. The electrical connections
for each heater element are brought outside of the pressure vessel through electrical
sealing assemblies. The electrical circuit is made by connecting the eight electrodes
as shown in Fig. 3.12, with the individual heater unit connector pairings as shown in
Table 3.4. Details of the heater assembly have been discussed (Bhat, 1998). During
this research, the efficiency of heating the flow reactor was diminishing. It was
suspected that one of the four heater elements may have failed. However, a resistance
check of each heater element showed that the elements were fine, as shown in Table
3.4.

43
c
dh
e
g
f
a
b
10 kW Heater
3 kWHeater
Connecting Flange
Power Supply
Figure 3.12: Wiring diagram of 3 kW heater elements. Connection e and f are on the backside of the heater.
Table 3.4: Resistance of each heater element.
Connection Resistance (Ω ) b-g 21.35 a-h 15.96 f-c 21.33 d-e 15.91
The electrical supply wire connects to each of the sealing arrangement’s copper
electrodes by a copper wire clamp. The connection was found to be poor due to the
copper corroding. The sealing arrangements were then removed and cleaned using
the glass-bead blaster in Drexel’s Machine Shop. Once cleaned, the sealing
assemblies were reinstalled and the electrical connections were securely tightened.

443.9 Closure
This chapter described the experimental facility and test procedures, and
described modifications to the facility to upgrade capabilities and maintain operation.
The experimental facilities included the PFR, used to investigate preignition
chemistry, and the single cylinder research engine, used to investigate autoignition
behavior. The analytical facility included the GC/MS/FID system and CO/CO2
detector which were used to detect species produced during the oxidation process.
Also, this chapter discussed the necessary replacement of parts and upgrades to the
existing research facility.

45CHAPTER 4: FISCHER-TROPSCH JET FUEL, PETROLEUM JP-8, AND N-
DECANE/ISO-OCTANE OXIDATION 4.1 Introduction
The first component of this study was to examine the low and intermediate
temperature reactivity of Fischer-Tropsch jet fuel, compare its reactivity to that of
petroleum-derived JP-8, and propose surrogate components for Fischer-Tropsch jet
fuel. Section 4.2 presents the results of the investigation and Section 4.3 discusses
the implications of this study.
Previous research has shown that it is important to choose a JP-8 with the
typical composition and reactivity of all JP-8’s (Lenhert, 2004b; Natelson, 2008). As
described previously, a sample fitting these requirements was obtained from Wright-
Patterson Air Force Base and is identified as JP-8 POSF 3773. A Fischer-Tropsch jet
fuel sample, one of only a few samples available at the time of this study, and
considered an average sample was also obtained from Wright-Patterson Air Force
Base. It is identified by its manufacturer as S-8 and by Wright-Patterson Air Force
Base as POSF 4734. Table 4.1 shows properties of these two samples.
A potential Fischer-Tropsch jet fuel surrogate, containing a mixture of
n-decane/iso-octane was investigated as well. n-Decane was selected as a component
representing the linear alkanes because it is one of the more common high molecular
weight alkanes, and it approximates the average chemical formula for JP-8, C11H21.
iso-Octane (2,2,4-trimethyl-pentane) was selected as a component representing the
branched alkanes because it is the most researched moderate molecular weight
branched alkane. An initial mixture of 59.4% n-decane / 40.6% iso-octane was
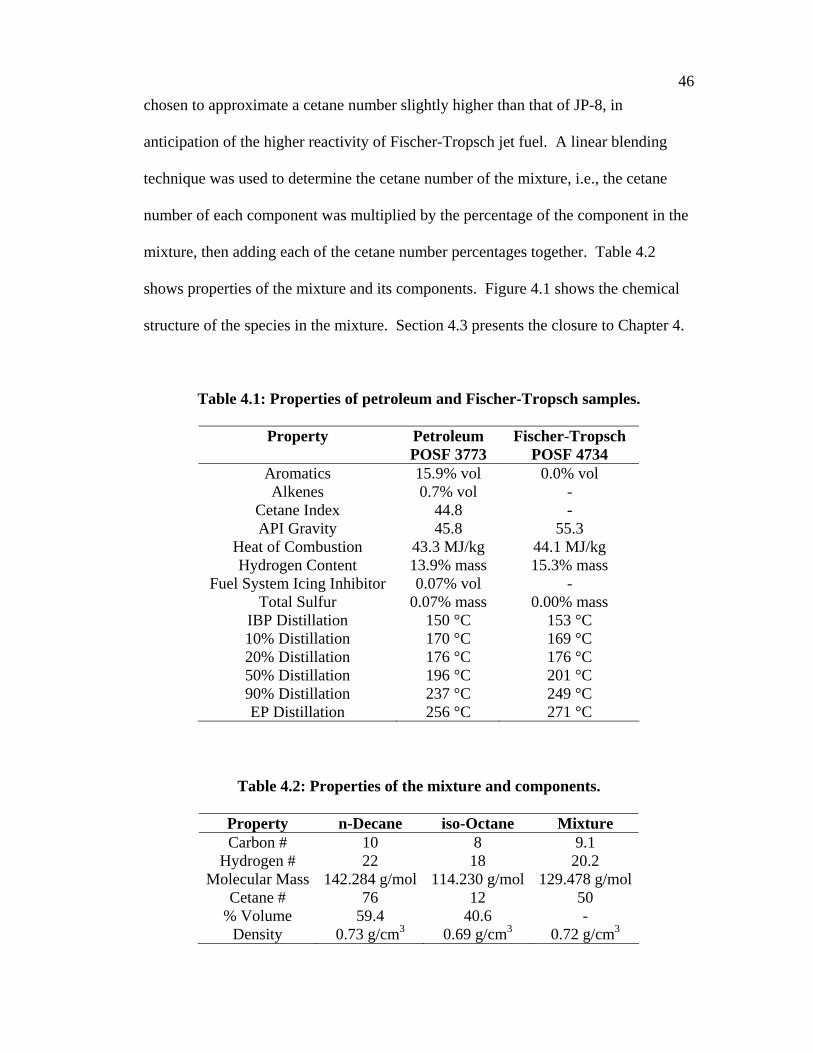
46chosen to approximate a cetane number slightly higher than that of JP-8, in
anticipation of the higher reactivity of Fischer-Tropsch jet fuel. A linear blending
technique was used to determine the cetane number of the mixture, i.e., the cetane
number of each component was multiplied by the percentage of the component in the
mixture, then adding each of the cetane number percentages together. Table 4.2
shows properties of the mixture and its components. Figure 4.1 shows the chemical
structure of the species in the mixture. Section 4.3 presents the closure to Chapter 4.
Table 4.1: Properties of petroleum and Fischer-Tropsch samples.
Property Petroleum POSF 3773
Fischer-Tropsch POSF 4734
Aromatics 15.9% vol 0.0% vol Alkenes 0.7% vol -
Cetane Index 44.8 - API Gravity 45.8 55.3
Heat of Combustion 43.3 MJ/kg 44.1 MJ/kg Hydrogen Content 13.9% mass 15.3% mass
Fuel System Icing Inhibitor 0.07% vol - Total Sulfur 0.07% mass 0.00% mass
IBP Distillation 150 °C 153 °C 10% Distillation 170 °C 169 °C 20% Distillation 176 °C 176 °C 50% Distillation 196 °C 201 °C 90% Distillation 237 °C 249 °C EP Distillation 256 °C 271 °C
Table 4.2: Properties of the mixture and components.
Property n-Decane iso-Octane Mixture Carbon # 10 8 9.1
Hydrogen # 22 18 20.2 Molecular Mass 142.284 g/mol 114.230 g/mol 129.478 g/mol
Cetane # 76 12 50 % Volume 59.4 40.6 -
Density 0.73 g/cm3 0.69 g/cm3 0.72 g/cm3

47
n-decane iso-octane
Figure 4.1: Chemical structure of each species in the binary mixture.
4.2 Results and Discussion
This section describes the experimental results of oxidation of the jet fuels and
the potential surrogate mixture. For these experiments, the PFR was operated under
the controlled cool down methodology, as described in Section 3.4. Subsection 4.2.1
compares the CO and CO2 production of the petroleum derived JP-8 with the Fischer-
Tropsch jet fuel. Subsection 4.2.2 discusses the results of the oxidation of the
potential surrogate. Subsection 4.2.3 discusses the results of tuning the surrogate
mixture to match the low and intermediate temperature reactivity of Fischer-Tropsch
jet fuel.
4.2.1 CO and CO2 Comparison of Petroleum JP-8 with Fischer-Tropsch Jet Fuel
Figure 4.2 compares the CO production of the petroleum-derived JP-8 and the
Fischer-Tropsch jet fuel. The former produced a maximum CO concentration of
600 ppm at 692 K. The latter initiated the NTC region at approximately the same
temperature, producing 890 ppm of CO at 690 K. The Fischer-Tropsch jet fuel
produced more CO than the petroleum-derived JP-8; however, the reactivity followed
similar trends.

48
0100200300400500600700800900
1000
600 650 700 750 800
Temperature (K)
CO
Pro
duct
ion
(ppm
)
F-T POSF #4734 JP-8 POSF #3773
Figure 4.2: CO production of Fischer-Tropsch jet fuel and petroleum JP-8.
The higher reactivity of the Fischer-Tropsch jet fuel is a result of its 100% alkane
composition. Because petroleum-derived JP-8 consists of approximately 40%
aromatics and cycloalkanes, which have lower cetane numbers and are less reactive
than alkanes, the petroleum-derived JP-8 produced significantly less CO. In addition,
in the absence of aromatics, which scavenge radicals, higher reactivity of Fischer-
Tropsch jet fuel is expected.
Figure 4.3 compares the CO2 production of the petroleum-derived JP-8 and
the Fischer-Tropsch jet fuel. Maximum CO2 production was approximately 250 ppm
for each fuel, and the difference between the fuels is within the 50 ppm experimental
error.

49
0
50
100
150
200
250
300
600 650 700 750 800
Temperature (K)
CO
2 Pro
duct
ion
(ppm
)
F-T POSF #4734 JP-8 POSF #3773
Figure 4.3: CO2 production of Fischer-Tropsch jet fuel and petroleum JP-8.
4.2.2 Oxidation of the n-Decane/iso-Octane Mixture
A mixture of 59.4% n-decane/40.6% iso-octane by volume was oxidized in
the PFR. The CO and CO2 produced from the mixture are shown in Figure 4.4. The
maximum CO concentration was 990 ppm at 694 K.

50
0
100
200
300
400
500
600
700
800
900
1000
600 650 700 750 800
Temperature (K)
Prod
uctio
n (p
pm)
CO CO2
Figure 4.4: CO and CO2 production of 59.4% n-decane/40.6% iso-octane
mixture. Thus, the mixture entered the NTC region within 4 K of the 690 K measured for the
Fischer-Tropsch jet fuel. Since the mixture produced 100 ppm more CO than the
Fischer-Tropsch jet fuel, a slight adjustment of the mixture composition will be
required to properly match the low temperature reactivity.
4.2.3 Oxidation of the Tuned n-Decane/iso-Octane Mixture
Figure 4.5 compares CO and CO2 production of the Fischer-Tropsch jet fuel
and the mixture of 53.1% n-decane / 46.9% iso-octane by volume. The mixture

51proportions were first estimated to approximate the cetane number, and then further
modified to approximate the reactivity of Fischer-Tropsch jet fuel. Maximum CO
production was approximately 875 ppm for both JP-8 and the two component
mixture, and identical within the experimental error of 50 ppm. The maximum CO2
production for both fuels was also the same at approximately 200 ppm.
0
100200
300
400
500600
700
800900
1000
600 650 700 750 800
Temperature (K)
Prod
uctio
n (p
pm)
CO:F-T POSF #4734 CO2:F-T POSF #4734CO:Mixture CO2:Mixture
Figure 4.5: Reactivity map of Fischer-Tropsch jet fuel and 53.1% n-decane / 46.9% iso-octane mixture.
4.3 Closure
Fischer-Tropsch jet fuel was oxidized in the PFR facility at temperatures of
600-800 K and 8 atm pressure. Before entering the NTC region of reduced activity,

52Fischer-Tropsch jet fuel was significantly more reactive than petroleum-derived JP-8.
The higher amount of reactivity is caused by the difference in chemical composition
between the two types of fuel. Fischer-Tropsch jet fuel, unlike petroleum-derived
JP-8, contains 100% alkanes.
There is an ongoing effort to develop surrogate fuels to aid in developing
models for the real fuels. Due to the differences in chemical composition of the fuels,
such as the lack of aromatics and cycloalkanes in Fischer-Tropsch jet fuel, surrogates
for petroleum-derived JP-8 may not be appropriate for Fischer-Tropsch jet fuel when
reactivity and emissions are the targets for the surrogate. Such targets may be crucial
for the optimization of advanced engine designs such as HCCI engines, where
ignition relies on the chemistry of the fuel.
An initial mixture of 59.4% n-decane/40.6% iso-octane was investigated as a
possible surrogate for Fischer-Tropsch jet fuel, with the targets being chemical
formula and reactivity in the low and intermediate temperature regimes. This mixture
produced more CO than Fischer-Tropsch jet fuel; therefore, a slight adjustment of the
mixture’s composition, 53.1% n-decane/46.9% iso-octane, was required to properly
match the low temperature reactivity based on the production of CO.

53CHAPTER 5: THE OXIDATION OF ALTERNATIVE JET FUELS AND A FISCHER-TROPSCH JET FUEL SURROGATE IN COMPLEMENTARY
COMBUSTION FACILITIES 5.1 Introduction
The purpose of this phase of the study was to explore the reactivity
differences and to investigate the preignition and autoignition behavior of alternative
jet fuels compared to petroleum jet fuel in a pressurized flow reactor (PFR) and single
cylinder research engine. Results were compared to a typical sample of petroleum
derived jet fuel, POSF 3773. A possible surrogate for Fischer-Tropsch jet fuel, which
contains a mixture of 53.1% n-decane/46.9% iso-octane, was also tested in the
facilities to compare preignition and autoignition behavior. The alternative jet fuels
selected were the Fischer-Tropsch jet fuel used in Chapter 4 and a coal derived jet
fuel identified as POSF 4765. Both alternative fuels are manufactured from sources
other than petroleum. Table 5.1 shows properties of the coal derived and Fischer-
Tropsch jet fuels. The experimental conditions are presented in Section 5.2. Section
5.3 discusses the results of the PFR and research engine experiments. Section 5.4
closes the Chapter.

54Table 5.1: Properties of coal derived and Fischer-Tropsch jet fuel samples.
Property Coal
POSF 4765 Fischer-Tropsch
POSF 4734 Aromatics 1.8% vol 0.0% vol Alkenes - -
Cetane Index - - API Gravity 33.1 55.3
Heat of Combustion 43.0 MJ/kg 44.1 MJ/kg Hydrogen Content 13.2% mass 15.3% mass
Fuel System Icing Inhibitor - - Total Sulfur 0.00% mass 0.00% mass
IBP Distillation 181 °C 153 °C 10% Distillation 192 °C 169 °C 20% Distillation 194 °C 176 °C 50% Distillation 204 °C 201 °C 90% Distillation 243 °C 249 °C EP Distillation 270 °C 271 °C
5.2 Experimental Conditions
For the PFR experiments, the controlled cool down methodology, as described
in Section 3.4, was followed. Engine experiments were conducted with the
Cooperative Fuel Research (CFR) engine coupled to the dynamometer, as described
in Section 3.3. For this phase of the study, the compression ratio was held constant at
16:1. The bore is 8.25 cm, the stroke is 11.43 cm, and the displacement is 611 cm3.
For each experiment, the inlet manifold pressure was 0.1 MPa, the engine speed was
750 RPM, and the equivalence ratio was 0.478. Experiments were run at an inlet
temperature of 480 K, above the boiling points of the fuels and thus eliminating
concerns about fuel condensation.
555.3 Results and Discussion
All three of the fuels, plus the surrogate mixture, were oxidized in both
facilities. The order of reactivity in descending order was Fischer-Tropsch,
petroleum, and coal derived jet fuel. The reactivity differences are attributed to
composition differences. The results from the PFR are presented first, followed by
the results from the single cylinder research engine.
5.3.1 Jet Fuels in the PFR
Three samples of jet fuel were oxidized in the PFR. As the actual empirical
formula was unknown and was not determined for this study, an average formula of
C11H21 was used (Edwards et al., 2001). This led to a fuel flow rate into the PFR of
1.050 mL/min at the given equivalence ratio and nitrogen dilution of fuel. The same
fuel flow rate was used for the other jet fuel samples. This fuel flow rate at the given
equivalence ratio and nitrogen dilution of fuel corresponds with a fuel concentration
of 775 ppm, and thus an average carbon atom concentration of 8525 carbon atoms per
million molecules of reacting mixture (fuel, N2, and O2) was available. As shown in
Fig. 5.1, the petroleum JP-8 showed substantial reactivity (>150 ppm CO) at 644 K.
Reactivity continued to increase as temperature increased, until peak reactivity,
indicated by 650 ppm CO, occurred at 689 K. The characteristic NTC region then
occurred, as reactivity decreased with increasing temperature. Significant reactivity
ceased at 742 K.
The reactivity of the natural gas derived jet fuel, POSF 4734, was different
from the petroleum derived, POSF 3773, sample. The Fischer-Tropsch jet fuel
sample showed significant reactivity at temperatures as low as 632 K, 12 K lower

56than the petroleum sample. The Fischer-Tropsch sample produced a maximum of
880 ppm CO at 687 K. The NTC peaks occurred at approximately the same
temperature, but the Fischer-Tropsch jet fuel produced 230 ppm CO more than the
petroleum sample. Significant reactivity continued until 754 K, 12 K higher than the
petroleum sample. Thus, the Fischer-Tropsch jet fuel showed reactivity across a
wider range of temperatures, and this range was symmetrical when comparing the
Fischer-Tropsch jet fuel to the petroleum JP-8, as shown in Fig. 5.1.
The composition can explain the difference in reactivity of the Fischer-
Tropsch jet fuel. The Fischer-Tropsch process produces a fuel of n- and iso-paraffins.
Such fuels have cetane numbers of approximately 70 or higher, while petroleum JP-8
has cetane numbers of approximately 45 (Muzzell et al., 2006). These large
differences in composition and cetane number have a significant effect on preignition
reactivity.

57
0
100
200
300
400
500
600
700
800
900
1000
600 650 700 750 800
Temperature (K)
CO
Mol
ar F
ract
ion
(ppm
)
F-T POSF 4734 Petrol POSF 3773 Coal POSF 4765
Figure 5.1: Reactivity map of natural gas, petroleum, and coal derived jet fuel in
the pressurized flow reactor. The reactivity of the coal derived jet fuel was different from both the
petroleum and natural gas derived jet fuels. Figure 5.1 shows that the coal derived jet
fuel produced significantly less CO than the other samples and had a much narrower
low temperature reaction zone. Significant reactivity did not begin until 655 K, 11 K
higher than for the petroleum sample. The coal jet fuel produced a maximum of
480 ppm CO at 688 K. While the temperature of peak reactivity was approximately
the same as the other samples, the value for the coal jet fuel was lower, producing
170 ppm CO less than the petroleum sample. Notably, the reaction region of the coal
jet fuel was not only narrower, as shown in Fig. 5.1, but also asymmetric with the

58reactivity decreasing more sharply with increasing temperature. Significant reactivity
was observed at temperatures only up to 710 K, 32 K less than the petroleum sample.
The reactivity differences of the coal-derived jet fuel again can be attributed to
the composition. Previous PFR experiments, by Agosta (2002), of
methylcyclohexane and decalin have shown that cycloparaffins have narrow ranges of
reactivity at temperatures of 600-800 K. Two decalin experiments were conducted in
the PFR. The first decalin experiment had an equivalence ratio of 0.3 and CO was
produced between the narrow region of 656-724 K. For the second decalin
experiment the equivalence ratio was increased to 0.4. For this experiment CO was
produced between the temperature range of 651-726 K. However, even though
decalin had a narrow CO reactivity map, CO was produced at a high rate, at the start
of reaction. Since cycloparaffins represent approximately 20 % of the chemical
composition of this JP-8, the narrow CO reactivity map of JP-8 is expected (Agosta,
2002).
5.3.2 Petroleum JP-8, Coal Derived Jet Fuel, and Fischer-Tropsch Jet Fuel
Surrogate in the Single Cylinder Research Engine
The jet fuels were also tested in the single cylinder research engine. Figure
5.2 shows data from the autoignition regime of the engine cycle, the data portion
relevant for this study. The horizontal-axis refers to the crank angle degrees with
360° being top dead center for compression. The three fuel samples are the same as
those run in the PFR. A motored run with no fuel is also shown to display the in-
cylinder pressure rise due to compression of air. The results are an average of three

59runs. The onset of combustion is shown in Fig. 5.2 as the knee in the pressure trace.
For the Fischer-Tropsch jet fuel, the onset of combustion occurred at 339 CAD. The
onset of combustion for the petroleum JP-8 was 342 CAD. In both fuels, first stage
ignition reactivity is observed, as the fuels exhibit extended periods of increasing
pressure as CAD increases, from the onset of the combustion until peak pressure at
approximately 353 CAD. The coal jet fuel, however, showed different autoignition
behavior. The onset of combustion occurred at 349 CAD, 7 CAD later than the
petroleum JP-8. Additionally, the coal jet fuel did not reach peak pressure until
358 CAD, approximately 5 CAD later than the other fuels.
0
5
10
15
20
25
30
35
40
45
50
330 335 340 345 350 355 360
Crankshaft Position (CAD)
In-C
ylin
der P
ress
ure
(bar
)
Motored F-T POSF 4734 Petrol POSF 3773 Coal POSF 4765
Figure 5.2: Autoignition of natural gas, petroleum, and coal derived jet fuel in the single cylinder research engine.
Thus, the duration from onset of combustion to peak pressure, which can be
considered an indication of first stage ignition reactivity, was longer for the Fischer-

60Tropsch and petroleum jet fuels than for the coal jet fuel. The former two samples
had CAD durations of 14 CAD and 11 CAD, respectively, while the latter exhibited a
duration of 9 CAD. This preignition reactivity behavior is consistent with the PFR
results. In the PFR, the Fischer-Tropsch jet fuel produced the maximum CO at its
maximum level of reactivity in the low temperature regime, followed by the
petroleum JP-8 and lastly the coal jet fuel. These experiments show the importance
of low temperature chemistry in the autoignition process of engines.
Previously in Chapter 4, a surrogate was developed for natural gas-derived
Fischer-Tropsch jet fuel and tested it in the PFR. The surrogate is composed of
53.1% n-decane / 46.9% iso-octane (2,2,4-trimethylpentane) by liquid volume and
matched the average composition and low temperature reactivity of Fischer-Tropsch
jet fuel, POSF-4734, in the PFR. To further explore this surrogate, the surrogate was
tested in the single cylinder research engine and the results are presented in Fig. 5.3.
The surrogate matched the real fuel fairly well. The onset of combustion for the
former was 340 CAD, 1 CAD later than the JP-8. By 344 CAD and later, both the
surrogate and Fischer-Tropsch jet fuel showed matching behavior, and they both
reached peak pressure at 353 CAD.

61
0
5
10
15
20
25
30
35
40
45
50
330 335 340 345 350 355 360
Crankshaft Position (CAD)
In-C
ylin
der P
ress
ure
(bar
)
Motored F-T POSF 4734 Mixture
Figure 5.3: Autoignition of surrogate for Fischer-Tropsch jet fuel.
5.4 Closure
This chapter presented experimental results from the oxidation of petroleum
derived JP-8, natural gas derived Fischer-Tropsch jet fuel, coal derived jet fuel, and a
surrogate mixture for Fischer-Tropsch jet fuel in complementary facilities. The
reactivity behavior of these possible future fuels differs from that of traditional
petroleum derived JP-8. The feedstocks and processing methods of the alternative
fuels lead to differences in composition. At preignition and autoignition conditions,
such composition differences can have large effects. Future engine designs will have
to consider these differences. The order of reactivity in descending order was

62Fischer-Tropsch, petroleum, and coal. In the engine, the surrogate matched
autoignition behavior of Fischer-Tropsch jet fuel.

63CHAPTER 6: INTERMEDIATE SPECIES ANALYSIS OF N-DECANE AND
DECALIN 6.1 Introduction
The purpose of this phase of the study was to examine the intermediate
species produced during the low and intermediate temperature oxidation of neat n-
decane and decalin in the pressurized flow reactor facility, to identify the branching
pathways controlling auto-ignition. Section 6.2 discusses the experimental conditions
and Section 6.3 presents the results of the analysis. The closure of this chapter is
presented in Section 6.4.
As mentioned in Chapter 4, n-decane was selected as a component
representing the linear alkanes of Fischer-Tropsch jet fuel because it is one of the
more common high molecular weight alkanes, and it approximates the average
chemical formula for JP-8, C11H21. n-Decane and iso-octane are potential surrogate
components for the natural gas-derived Fischer-Tropsch jet fuel, which is almost
entirely n- and iso-paraffins. n-Decane is a major component of the fuel; iso-octane
is not because the branched paraffins found in the JP-8 are heavier and less branched
(Bruno et al., 2006). Nevertheless, iso-octane is more readily available than the iso-
paraffins found in the Fischer-Tropsch jet fuel and since iso-octane is the primary
reference fuel for gasoline, there have been extensive studies and experimental
validation of models pertaining to its oxidation. For instance, a detailed chemical
kinetic mechanism has been developed for the oxidation of iso-octane that ranges
from 550-1700 K and 0.1-4.5 MPa (Curran et al., 2002). However, while there are n-
decane models available (Lindstedt et al., 2000; Bikas et al., 2001; Zhao et al., 2005),

64more experimental data are needed for understanding the low and intermediate
temperature chemical kinetics. A chemical analysis found that the most prevalent
component of the coal-derived JP-900 POSF-4765 is trans-decahydronaphthalene
(trans-decalin), followed by cis-decalin (Smith et al., 2007). To study the
dicycloparaffin components in the coal-derived jet fuel, decalin (a mixture of both
cis-decalin and trans-decalin) was also oxidized in the PFR.
Ultimately, the branching pathways will be useful for the improvement and
advancement of the chemical mechanisms for these hydrocarbons in the low and
intermediate temperature regime at elevated pressure.
6.2 Experimental Conditions
For the PFR experiments, the controlled cool down methodology as described
in Section 3.4, was followed. During the CCD experiments, samples were stored in
the heated sample storage cart for offline analysis, as described in Section 3.7, with
the gas chromatograph with a flame ionization detector and coupled to the mass
spectrometer.
6.3 Results and Discussion
n-Decane and decalin were oxidized in the PFR to analyze intermediate
species produced and identify branching pathways. The n-decane results are
presented first, followed by the decalin results.
656.3.1 Detailed Speciation of Intermediates Produced during n-Decane Oxidation
in the PFR
Neat n-decane was more reactive in the low and intermediate temperature
regime, based on CO production, than Fischer-Tropsch jet fuel and the 53.1%
n-decane/46.9% iso-octane mixture, as shown in Figure 6.1. n-Decane produce a
maximum CO concentration of approximately 1800 ppm, while Fischer-Tropsch jet
fuel and the 53.1% n-decane/46.9% iso-octane mixture was half as reactive.
The n-decane reactivity map in Figure 6.2 shows the CO and CO2 production
and the sample extraction points for the off-line analysis. CO was produced at
significant levels at temperatures as low as 615 K. The maximum CO production was
approximately 1800 ppm at 700 K. Additionally, a negative temperature coefficient
(NTC) region is observed from 700-800 K. Reactivity ceased at approximately
795 K.

66
0
200
400
600
800
1000
1200
1400
1600
1800
2000
600 650 700 750 800
Temperature (K)
Prod
uctio
n (p
pm)
n-decane F-T POSF 4734 53.1% n-decane/46.9% iso-octane
Figure 6.1: Reactivity of n-decane, Fischer-Tropsch jet fuel, and n-decane/iso-
octane blend based on CO production.

67
0
200
400
600
800
1000
1200
1400
1600
1800
2000
600 650 700 750 800
Temperature (K)
Prod
uctio
n (p
pm)
CO CO2 Sample Point
Figure 6.2: CO and CO2 production during n-decane oxidation.
The collected samples were analyzed using the GC/MS/FID techniques described in
Chapter 3. Figure 6.3 is the flame ionization detector chromatogram for the sample
extracted at 700 K. Each sharp symmetrical peak is a component that was in the
sample. Several major intermediate species could be positively identified. Table 6.1
lists the species and their associated elution times. The aldehydes were propanal,
butanal, pentanal, hexanal, and heptanal. Formaldehyde is to be expected as a major
intermediate. However, it was not identified using the current GC/MS parameters.
The alkenes included ethene, propene, 1-butene, 1-pentene, and 1-hexene. The major
alkane was n-decane. Two decene isomers, 5-decene and 4-decene, were also
identified. Additionally, 2-butanone and 2-pentanone and several cyclic ethers were

68also identified. Figure 6.4 shows the chemical structure of species that were
produced during the oxidation of n-decane.
Table 6.1: Species identified by GC/MS/FID in n-decane oxidation samples.
Species Elution time (min) Ethene 9.89 Propene 11.02 Butene 13.67
Propanal 16.76 1-Pentene 17.18 Butanal 19.88
2-Butanone 20.13 1-Hexene 20.33
2-Pentanone 22.51 Pentanal 22.70 Hexanal 25.25 Heptanal 27.78 5-Decene 30.55 4-Decene 30.62 n-Decane 30.77
Figure 6.3: Chromatogram of the 700 K n-decane oxidation sample.

69
propanal
butanal pentanal
hexanal
heptanal ethene
propene
1-butene 1-pentene
1-hexene
5-decene 4-decene
2-butanone
2-pentanone tetrahydrofuran
Figure 6.4: Chemical structure of the identified species during n-decane
oxidation.
6.3.2 Detailed Speciation of Intermediates Produced during Decalin Oxidation in
the PFR
Figure 6.5 shows production of CO and CO2 from the oxidation of decalin in
the low and intermediate temperature regime. Significant reactivity was observed at
temperatures from 626 K to 731 K. Thus, decalin has a limited range of reactivity at
low temperatures compared to paraffins such as n-decane. Reactivity peaked with
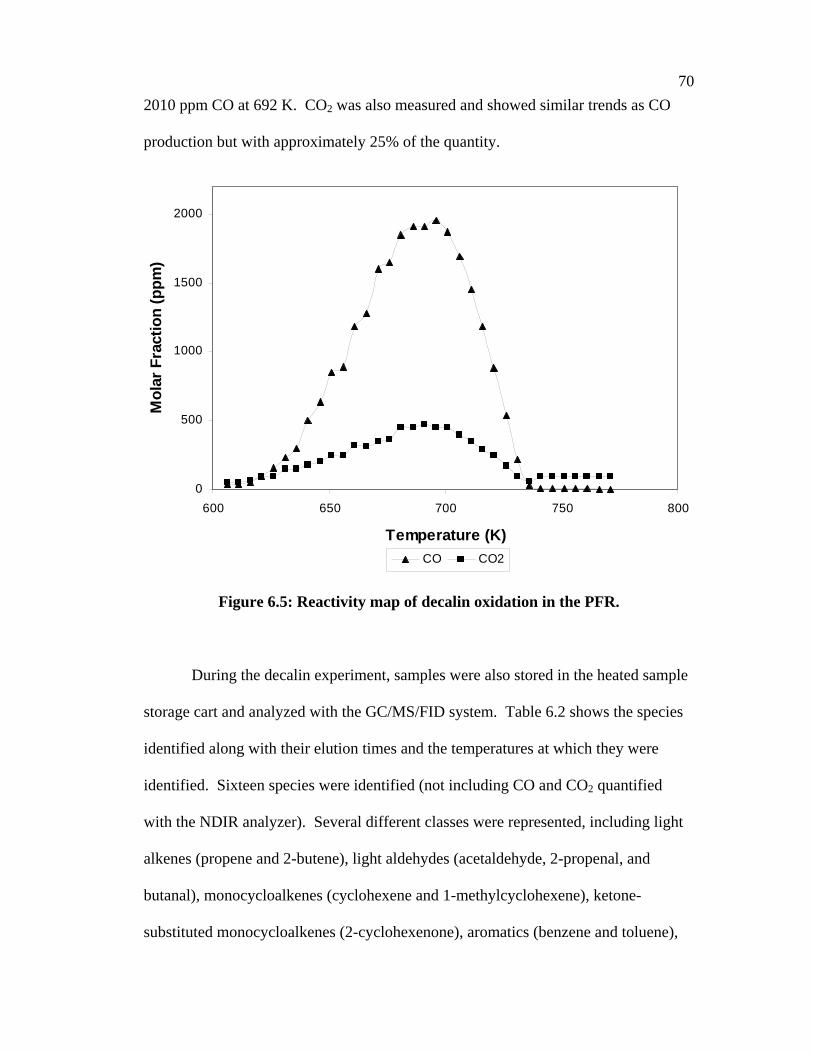
702010 ppm CO at 692 K. CO2 was also measured and showed similar trends as CO
production but with approximately 25% of the quantity.
0
500
1000
1500
2000
600 650 700 750 800
Temperature (K)
Mol
ar F
ract
ion
(ppm
)
CO CO2
Figure 6.5: Reactivity map of decalin oxidation in the PFR.
During the decalin experiment, samples were also stored in the heated sample
storage cart and analyzed with the GC/MS/FID system. Table 6.2 shows the species
identified along with their elution times and the temperatures at which they were
identified. Sixteen species were identified (not including CO and CO2 quantified
with the NDIR analyzer). Several different classes were represented, including light
alkenes (propene and 2-butene), light aldehydes (acetaldehyde, 2-propenal, and
butanal), monocycloalkenes (cyclohexene and 1-methylcyclohexene), ketone-
substituted monocycloalkenes (2-cyclohexenone), aromatics (benzene and toluene),

71monocycloalkanes (methylcyclohexane and ethylcyclohexane), ketone-substituted
monocycloalkanes (cyclopentanone and cyclohexanone), and dicycloparaffins (cis-
and trans-decalin). The decalin sample for the experiment was a mixture of cis- and
trans-decalin, as purchasing the individual isomers is much more expensive.
Nevertheless, the isomers were successfully separated and identified At 773 K, a
sample was collected with only the prevaporized nitrogen-fuel mixture and the
nitrogen component of the synthetic air flowing in the PFR. Small traces of
methylcyclohexane and ethylcyclohexane were identified at this point and may be
attributed to the fuel sample. Figure 6.6 shows the chemical structure of each species
that were identified.
Table 6.2: Species identified by GC/MS/FID in decalin oxidation samples.
Species Elution time (min)
648 K 690 K 726 K 773 K (no O2)
Propene 10.96 X X X Acetaldehyde 13.02 X X
2-Butene 13.63 X 2-Propenal 16.65 X X X
Butanal 19.98 X X X Benzene 22.09 X X X
Cyclohexene 22.78 X X X Methylcyclohexane 24.00 X X X X
Toluene 24.82 X X X Cyclopentanone 24.99 X X
1-Methylcyclohexene 25.11 X X Ethylcyclohexane 26.83 X X X X Cyclohexanone 27.71 X
2-Cyclohexenone 28.59 X trans-Deca-
hydronaphthalene 32.93 X X X X
cis-Deca-hydronaphthalene
34.16 X X X X
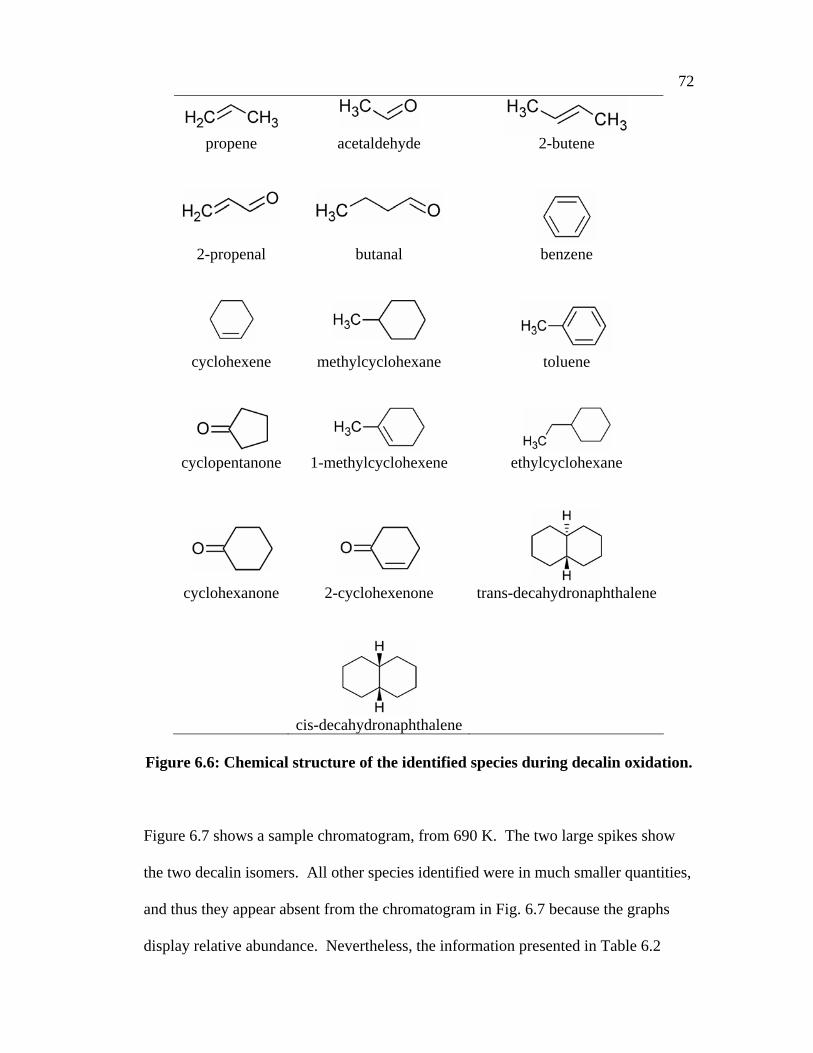
72
propene
acetaldehyde 2-butene
2-propenal
butanal benzene
cyclohexene
methylcyclohexane toluene
cyclopentanone
1-methylcyclohexene ethylcyclohexane
cyclohexanone
2-cyclohexenone trans-decahydronaphthalene
cis-decahydronaphthalene Figure 6.6: Chemical structure of the identified species during decalin oxidation. Figure 6.7 shows a sample chromatogram, from 690 K. The two large spikes show
the two decalin isomers. All other species identified were in much smaller quantities,
and thus they appear absent from the chromatogram in Fig. 6.7 because the graphs
display relative abundance. Nevertheless, the information presented in Table 6.2

73shows some interesting aspects of the low temperature oxidation of decalin. At the
lowest temperature at which a sample was taken, 648 K, two ketones were identified
that were not present at the higher temperatures. These species were cyclohexanone
and 2-cyclohexenone. Cyclohexanone has a molecular formula of C6H10O; it is
cyclohexane with one substituted ketone group. Ketones can be produced from
several reactions in the low and intermediate temperature regime. One possible
pathway is hydroxyl radical addition to an alkene that produces a hydroxyalkyl
radical, followed by isomerization and hydrogen abstraction to produce the ketone
(Touchard et al., 2005). 2-Cyclohexenone has a molecular formula of C6H8O; it is
cyclohexene with one substituted ketone group. Other cycloparaffins identified
included cyclohexene, cyclopentanone, and 1-methylcyclohexene. Of those, one is an
additional ketone-substituted cycloparaffin, cyclopentanone. This molecule was only
identified at the two lower temperatures, 648 K and 690 K. Thus, the presence of the
ketone-substituted cycloparaffins at the lower temperatures, and none at the higher
temperature of 726 K, shows that the pathway to ketone substitution is present only at
lower temperatures before the NTC region dominates.

74
Figure 6.7: MS (top) and FID (bottom) chromatograms produced from decalin
oxidation at 690 K. A number of C6 cycloparaffin components were identified. Clearly there was
cleavage of the two cyclohexane components of the parent fuel decalin.
Accompanying this, there were several C4 non-cyclic species – butanal and 2-butene.
No C4 cyclic species, such as cyclobutanone, were identified, suggesting that when
decalin decomposes to produce a C6 cyclic species, the other portion of the parent
fuel will not maintain the cyclic structure. Furthermore, the presence of
cyclopentanone, a C5 cycloparaffin, suggests the possibility that decalin
decomposition can lead to two C5 cyclic species. The other possible method of
cyclopentanone production, from C6 cycloparaffins, is less likely (Lenhert, 2004b).
The previous study of methylcyclohexane oxidation in the PFR facility did not
identify any C5 cyclic species.
Decalin has 10 carbon atoms, including 8 secondary and 2 tertiary. Tertiary
C-H bond types, those on carbon atoms that are bonded to three other carbons atoms,

75are weaker than secondary C-H bonds, which are on carbon atoms that are bonded to
two other carbon atoms. From the species identified in this study, it appears that the
tertiary bonds are more likely to break, even though they are outnumbered 4:1 by the
secondary bond types.
Additionally, two aromatic species - benzene and toluene – were identified.
As no C6 alkenes were identified, it is likely that these species were produced from
the C6 cyclic species through a direct dehydrogenation process.
6.4 Closure
This chapter presented detailed experimental results, including intermediate
species identification, from the oxidation of neat n-decane and decalin throughout the
low and intermediate temperature regime in the PFR. During the PFR experiments,
samples were extracted at various temperatures for GC/MS/FID analysis. Identifying
the branching pathways will be useful for the improvement and advancement of the
chemical mechanisms for these hydrocarbons.
n-Decane was selected as a component of Fischer-Tropsch jet fuel surrogate
because it is one of the more common high molecular weight alkanes, and it
approximates the average chemical formula for JP-8. Neat n-decane was more
reactive than Fischer-Tropsch jet fuel and the 53.1% n-decane/46.9% iso-octane
mixture. The major intermediate species that were identified included components of
the functional groups aldehydes and alkenes. Additionally, 2-butanone and 2-
pentanone and several cyclic ethers were also positively identified.
The most prevalent component of the coal-derived JP-900 POSF-4765 is
trans-decalin, followed by cis-decalin. To study the dicycloparaffin components in

76the coal-derived jet fuel, decalin was also oxidized in the PFR. Decalin reactivity
exhibited a limited range of reactivity at low temperatures compared to paraffins such
as n-decane. Alkenes and aldehydes were also present as products of combustion.
Additionally, many cyclic species were also identified.
With moderate and high molecular weight hydrocarbon fuels, identifying and
quantifying the large carbon number intermediates is a difficult problem that
generally leads to not all of the carbon being counted. Work is underway to examine
the possibility of condensation in the sampling system and reaction in the storage cart.

77CHAPTER 7: CONCLUSIONS AND RECOMMENDATIONS FOR FUTURE
WORK
7.1 Introduction
This study investigated the oxidation of alternatives for petroleum derived JP-
8 in a pressurized flow reactor and a single cylinder research engine. The alternative
fuels investigated were a natural gas derived Fischer-Tropsch jet fuel and a coal
derived jet fuel produced by a hydrotreating/hydrogenation process. In order to
identify the branching pathways controlling autoignition, intermediate species
produced during the low and intermediate temperature oxidation of neat n-decane and
decalin were also investigated.
The pressurized flow reactor was used to evaluate the oxidation characteristics
of the hydrocarbons under lean, dilute conditions at temperatures of 600-800 K and
8 atm pressure. Experiments were also conducted in a single cylinder research engine
to examine autoignition of the fuels. Dissimilarities in autoignition and measured
intermediates were observed between the petroleum and alternative jet fuels, which
are consistent with the known differences in chemical composition; therefore,
different surrogates need to be developed for each alternative fuel.
This research will aid in the overall development and use of chemical kinetic
models that are necessary to simulate combustion characteristics of gas turbines and
CI engines operating with these fuels. The simulations will aid in efforts to improve
fuel efficiency, emissions, and power output. The results of this research are
summarized in this chapter. Recommendations for future work are also discussed.
787.2 Conclusions
The initial component of this study was to investigate Fischer-Tropsch jet
fuel, compare its reactivity to petroleum JP-8, and propose surrogate components.
The alternative fuel was oxidized in the PFR facility at temperatures of 600-800 K
and 8 atm pressure. Fischer-Tropsch jet fuel was significantly more reactive than
petroleum-derived JP-8 before entering the NTC region. Due to the lack of aromatics
and cycloalkanes in Fischer-Tropsch jet fuel, surrogates for petroleum derived JP-8
research are not applicable for Fischer-Tropsch jet fuel when chemical composition
and low temperature reactivity are targets for the surrogate. Such a target may be
crucial for the optimization of advanced engine designs such as Premixed
Compression Ignition (PCI) engines, where ignition relies on the chemistry of the
fuel. In anticipation of the slightly higher cetane number of Fischer-Tropsch jet fuel
compared to petroleum derived JP-8, a mixture of 59.4% n-decane and 40.6% iso-
octane was investigated as a possible surrogate for Fischer-Tropsch jet fuel, with the
targets being chemical composition and reactivity in the low and intermediate
temperature regimes. Matching only cetane numbers between the mixture and
Fischer-Tropsch jet fuel is not sufficient in predicting the overall low and
intermediate temperature reactivity of the fuel.
The next phase of the study investigated the n-decane/iso-octane mixture in
the PFR facility at temperatures of 600-800 K and 8 atm pressure. Several
experiments were performed with the binary mixture to evaluate and appropriately
tune the mixture to represent the reactivity, based on CO production, throughout the
low and intermediate temperature regime. The binary mixture of 53.1% n-decane and

7946.9% iso-octane represented the CO production of Fischer-Tropsch jet fuel under
these conditions.
The study then explored the reactivity differences of alternative jet fuels
compared to petroleum jet fuel, and their surrogate components in two
complementary combustion facilities. Preignition experiments were conducted in the
pressurized flow reactor and autoignition experiments were conducted in the single
cylinder research engine. The alternative jet fuels were a coal-derived jet fuel and a
natural gas-derived Fischer-Tropsch jet fuel. In both facilities, the order of reactivity
in descending order was Fischer-Tropsch, petroleum, and coal. The reactivity
differences are attributed to composition differences.
Possible surrogates and their components were also tested in the facilities to
elucidate how compositional differences affect preignition and autoignition
chemistry. Neat n-decane, the dominant species in the Fischer-Tropsch jet fuel, and
neat decalin, which is the most prevalent component of the coal derived jet fuel
sample, were investigated in the PFR. Samples were extracted throughout the low
and intermediate temperature regime for GC/MS analysis, in order to identify the
branching pathways controlling auto-ignition. The major intermediate species that
were identified for n-decane oxidation included components of the functional groups
aldehydes and alkenes. The major intermediate species that were identified for
decalin oxidation included components of the functional groups aldehydes, alkenes,
cyclo-alkenes, cyclo-ketones, and one aromatic, benzene. The pathways will
ultimately be useful for the improvement and advancement of the chemical

80mechanism for n-decane and decalin in the low and intermediate temperature regime
at elevated pressure.
Overall, the research presented will aid in the development of chemical kinetic
models for non-petroleum derived jet fuel that will be employed for simulating
combustion characteristics of gas turbines and CI engines while improving such traits
as fuel efficiency, emissions, and power output.
7.3 Recommendations for Future Work
Significant work has been completed and presented about the understanding
of the oxidation of alternative fuels for petroleum derived JP-8. However, the
combustion chemistry that is occurring in the low and intermediate temperature
regime is not a straightforward and simple process. With high molecular weight
hydrocarbons, the oxidation chemistry is very complex. This study presents data to
aid in the understanding of the complex oxidation processes. Some selected
recommendations for future work are presented as follows.
(1) This research presented a qualitative analysis of species, other than CO
and CO2, produced during the oxidation of n-decane and decalin. To gain full
advantage and understanding of reaction pathways that are being produced, it is also
necessary to have a quantitative analysis as well. The quantitative analysis will aid in
determining the rates at which species are produced. However, the problem that
arises with trying to quantify some of these high molecular weight species is that a
known quantity has to be analyzed in the GC/MS/FID system to develop a calibration
curve. Once the calibration curve for a species is developed, the species can be
quantified. The difficulty is that some high molecular weight species can only be

81purchased in liquid phase samples. The liquid phase samples then have to be
vaporized to gas phase in a known concentration. To maintain the samples in the gas
phase with a known concentration has always been a difficult task.
Therefore, a method needs to be developed to provide a quantitative analysis
of the amount of species produced during the oxidation process. The method could
include a technique to preserve the high molecular weight species in gas phase to
establish a calibration curve or a procedure to correlate the response from the
GC/MS/FID of a known low molecular weight hydrocarbon to that of a high
molecular weight hydrocarbon.
(2) The ability to acquire oxygen measurements would be important because
several of the species that are produced in the low and intermediate temperature
regime contain oxygen. An oxygen production profile could be established and aid in
the understanding of reaction pathways that contain oxygen. Since the Ultramat 22P
CO and CO2 detector was experiencing operational problems, as mentioned in
Section 3.5, it is recommended that the Ultramat 22P be replaced with the Ultramat
23, which includes an electrochemical oxygen measurement cell.
(3) The present coal derived and Fischer-Tropsch jet fuels do not meet all of
the specifications to be designated as a JP-8 by the US military. However, coal
derived and Fischer-Tropsch jet fuels can be mixed with petroleum derived JP-8 to
satisfy current regulations and as a practical matter. For example, up to a maximum
50 % concentration of Fischer-Tropsch jet fuel can be mixed with petroleum JP-8 to
maintain the minimum specific gravity specification. Therefore, evaluation and

82testing of such blends to acquire preignition and autoignition data in our facilities is
appropriate.
7.4 Closure
This study presented current research regarding the preignition and
autoignition behavior of alternative jet fuels for petroleum derived JP-8 in a
pressurized flow reactor and a single cylinder research engine. The alternative jet
fuels studied were derived from natural gas and coal. Possible surrogates for the
alternative fuels and their components were also tested to explain how compositional
differences affect preignition and autoignition chemistry. Similarities and differences
in preignition and autoignition behavior were observed between the petroleum and
alternative jet fuels. The order of reactivity, based on CO production, in descending
order was Fischer-Tropsch, petroleum, and coal. The reactivity differences are
attributed to differences in chemical composition of the jet fuels. Therefore, different
surrogates need to be developed for alternative jet fuels as well.

83LIST OF REFERENCES
Agosta, A. (2002). Development of a Chemical Surrogate for JP-8 Aviation Fuel Using a Pressurized Flow Reactor. M.S. Thesis, Drexel University, Philadelphia, PA. Balster, L. M., E. Corporan, M. J. DeWitt, J. T. Edwards, J. S. Ervin, J. L. Graham, S. -Y., Lee, S. Pal, D. K. Phelps, L. R. Rudnick, R. J. Santoro, H. H. Schobert, L. M. Shafer, R. C. Striebich, Z. J. West, G. R. Wilson, R. Woodward, S. Zabarnick. (2008). Development of an Advanced, Thermally Stable, Coal-Based Jet Fuel. Fuel Processing Technology, Vol. 89, No. 4, 364-378. Bhat, R.K. (1998). The Effect of Nitric Oxide on the Oxidation of n-Pentane and Pressurized Flow Reactor Facility Upgrade, MS Thesis, Drexel University, Philadelphia, PA. Bikas, G., N. Peters. (2001). Kinetic Modeling of n-Decane Combustion and Autoignition. Combustion and Flame, Vol. 126, No. 1-2, 1456-1475. Bruno, T. J., B. L. Smith. (2006). Improvements in the Measurement of Distillation Curves. 2. Application to Aerospace/Aviation Fuels RP-1 and S-8. Industrial & Engineering Chemistry Research, Vol. 45, No. 12, 4381-4388. Buda, F., R. Bounaceur, V. Warth, P.A. Glaude, R. Fournet, F. Battin-Leclerc. (2005). Progress Toward a Unified Detailed Kinetic Model for the Autoignition of Alkanes from C4 to C10 Between 600 and 1200 K. Combustion and Flame, Vol. 142, No. 1-2, 170-186. Cavallotti, C., R. Rota, T. Faravelli, E. Ranzi. (2007). Ab Initio Evaluation of Primary cyclo-Hexane Oxidation Reaction Rates. Proceedings of the Combustion Institute, Vol. 31, No. 1, 201-209. Chaos, M., A. Kazakov, Z. Zhao, F. Dryer. (2007). A High-Temperature Chemical Kinetic Model for Primary Reference Fuels. International Journal of Chemical Kinetics, Vol. 39, No. 7, 399-414.

84Colket, M., T. Edwards, S. Williams, N. P. Cernansky, D. L. Miller, F. N. Egolfopoulos, P. Lindstedt, K. Seshadri, F. L. Dryer, C. K. Law, D. Friend, D. B. Lenhert, H. Pitsch, A. Sarofim, M. Smooke, W. Tsang. (2007). Development of an Experimental Database and Kinetic Models for Surrogate Jet Fuels. AIAA Paper No. 2007-0770, Reno, NV. Corporan, E., M. J. DeWitt, V. Belovich, R. Pawlik, A. C. Lynch, J. R. Gord, T. R. Meyer. (2007). Emission Characteristics of a Turbine Engine and Research Combustor Burning a Fischer-Tropsch Jet Fuel. Energy & Fuels, Vol. 21, No. 5, 2615-2626. Curran, H., J. P. Gaffuri, W. J. Pitz, C. K. Westbrook. (2002). A Comprehensive Modeling Study of iso-Octane Oxidation. Combustion and Flame, Vol. 129, No. 3, 253-280. Dagaut, P., M. Cathonnet, J. Boetiner, F. Gaillard. (1987). Kinetic Modeling of Propane Oxidation. Combustion Science and Technology, Vol. 56, No. 1-3, 23-63. Dagaut, P., M. Reuillon, M. Cathonnet. (1994). High Pressure Oxidation of Liquid Fuels from Low to High Temperature. 3.n-Decane. Combustion Science and Technology, Vol. 103, No. 1-6, 349-359. DeWitt, M., E. Corporan, J. Graham, D. Minus. (2008). Effects of Aromatic Type and Concentration in Fischer-Tropsch Fuel on Emissions Production and Material Compatibility. Energy & Fuels, Vol. 22, No. 4, 2411-2418. Edwards, T., L. Q. Maurice. (2001). Surrogate Mixtures to Represent Complex Aviation and Rocket Fuels. Journal of Propulsion and Power, Vol. 17, No. 2, 461-466. He, X., M. T. Donovan, B. T. Zigler, T. R. Palmer, S. M. Walton, M. S. Wooldridge, A. Atreya. (2005). An Experimental and Modeling Study of iso-Octane Ignition Delay Times under Homogeneous Charge Compression Ignition Conditions. Combustion and Flame, Vol. 142, No. 3, 266-275.

85Holley, A. T., Y. Dong, M. G. Andac, F. N. Egolfopoulos, T. Edwards. (2007). Ignition and Extinction of Non-Premixed Flames of Single-Component Liquid Hydrocarbons, Jet Fuels, and their Surrogates. Proceedings of the Combustion Institute, Vol. 31, No. 1, 1205-1213. Jia, M., M. Xie. (2006). A Chemical Kinetics Model of iso-Octane Oxidation for HCCI Engines. Fuel, Vol. 85, 2593-2604. Koert, D. N., N. P. Cernansky. (1992). A Flow Reactor for the Study of Homogeneous Gas-Phase Oxidation of Hydrocarbons at Pressures up to 20 atm (2 MPa). Measurement Science and Technology, Vol. 3, No. 6, 607-613. Koert, D. N., D. L. Miller, N. P. Cernansky. (1994). Experimental Studies of Propane Oxidation through the Negative Temperature Coefficient Region at 10 and 15 Atmospheres. Combustion and Flame, Vol. 96, No. 1-2, 34-49. Larson, E. D., R. Tingjin. (2003). Synthetic Fuel Production by Indirect Coal Liquefaction. Energy for Sustainable Development, Vol. 7, No. 4, 79-102. Law, C. K. (2006). Combustion Physics. Cambridge University Press, New York, NY. Lemaire, O., M. Ribaucour, M. Carlier, R. Minetti. (2001). The Production of Benzene in the Low-Temperature Oxidation of Cyclohexane, Cyclohexene, and Cyclohexa-1,3-diene. Combustion and Flame, Vol. 127, No. 1-2, 1971-1980. Lenhert, D. B. (2004a). The Oxidation of a Gasoline Fuel Surrogate in the Negative Temperature Coefficient Region. M.S. Thesis, Drexel University, Philadelphia, PA. Lenhert, D. B. (2004b). The Oxidation of JP-8 and its Surrogates in the Low and Intermediate Temperature Regime. Ph.D. Thesis, Drexel University, Philadelphia, PA. Lindstedt, R. P., L. Q. Maurice. (2000). Detailed Chemical-Kinetic Model for Aviation Fuels. Journal of Propulsion and Power, Vol. 16, No. 2, 187-195.

86Lumpkin, R. E. (1988). Recent Progress in the Direct Liquefaction of Coal. Science, Vol. 239, No. 4842, 873-877. McEnally, C. S., L. D. Pfefferle. (2005). Fuel Decomposition and Hydrocarbon Growth Processes for Substituted Cyclohexanes and for Alkenes in Nonpremixed Flames. Proceedings of the Combustion Institute, Vol. 30, No. 1, 1425-1432. Miller, J. A., M. J. Pilling, J. Troe. (2005). Unravelling Combustion Mechanisms Through a Quantitative Understanding of Elementary Reactions. Proceedings of the Combustion Institute, Vol. 30, No. 1, 43-88. Minetti, R., M. Ribaucour, M. Carlier, C. Fittschen, L.R. Sochet. (1994). Experimental and Modeling Study of Oxidation and Autoignition of Butane at High Pressure. Combustion and Flame, Vol. 96, No. 3, 201-211. Muzzell, P. A., E. R. Sattler, A. Terry, B. J. McKay, R. L. Freerks, L. L. Stavinoha, R. Wanker. (2006). Properties of Fischer-Tropsch (FT) Blends for Use in Military Equipment. SAE Paper No. 2006-01-0702, Detroit, MI. Natelson, R. H., R.O. Johnson, M. S. Kurman, N. P. Cernansky, D. L. Miller. (2007). Low Temperature Oxidation of Selected Jet Fuel and Diesel Fuel Components at Elevated Pressure. 5th U.S. Combustion Meeting, Paper No. D15, San Diego, CA. Natelson, R. H., M. S. Kurman, N. P. Cernansky, D. L. Miller. (2008). Experimental Investigation of Surrogates for Jet and Diesel Fuels. Fuel, Vol. 87, 2339-2342. Pitz, W. J., C. V. Naik, T. Ni Mhaolduin, C. K. Westbrook, H. J. Curran, J. P. Orme, J. M. Simmie. (2007). Modeling and Experimental Investigation of Methylcyclohexane Ignition in a Rapid Compression Machine. Proceedings of the Combustion Institute, Vol. 31, No. 1, 267-275. Ranzi, E., A. Frassoldati, S. Granata, T. Faravelli. (2005). Wide-Range Kinetic Modeling Study of the Pyrolysis, Partial Oxidation, and Combustion of Heavy n-Alkanes. Industrial & Chemical Engineering Research, Vol. 44, No. 14, 5170-5183.

87Shafer, L. M., R. C. Striebich, J. Gomach, T. Edwards. (2006). Chemical Class Composition of Commercial Jet Fuels and Other Specialty Kerosene Fuels. 14th AIAA/AHI Space Planes and Hypersonic Systems and Technologies Conference, Paper No. 2006-7972, Canberra, Australia, November 6-9. Silke, E. J., W. J. Pitz, C. K. Westbrook, M. Ribaucour. (2007). Detailed Chemical Kinetic Modeling of Cyclohexane Oxidation. Journal of Physical Chemistry A, Vol. 111, No. 19, 3761-3775. Sirjean, B., F. Buda, H. Hakka, P.A. Glaude, R. Fournet, V. Warth, F. Battin-Leclerc, M. Ruiz-Lopez. (2007). The Autoignition of Cyclopentane and Cyclohexane in a Shock Tube. Proceedings of the Combustion Institute, Vol. 31, No. 1, 277-284. Sirjean, B., E. Dames, D. A. Sheen, X.-Q. You, C. Sung, A. T. Holley, F. N. Egolfopoulos, H. Wang, S. S. Vasu, D. F. Davidson, R. K. Hanson, H. Pitsch, C. T. Bowman, A. Kelley, C. K. Law, W. Tsang, N. P. Cernansky, D. L. Miller, A. Violi, R. P. Lindstedt. (2008). A High-Temperature Chemical Kinetic Model of n-Alkane Oxidation, JetSurF version 0.2, September 08 (http://melchior.usc.edu/JetSurF/Version0_2/Index.html). Smith, B. L., T. J. Bruno. (2007). Composition-Explicit Distillation Curves of Aviation Fuel JP-8 and a Coal-Based Jet Fuel. Energy & Fuels, Vol. 21, No. 5, 2853-2862. Speight, J. G. (2006). The Chemistry and Technology of Petroleum. CRC Press, Taylor & Francis Group, Boca Raton, FL. Tanaka, S., F. Ayala, J. Keck. (2003). A Reduced Chemical Kinetic Model for HCCI Combustion of Primary Reference Fuels in a Rapid Compression Machine. Combustion and Flame, Vol. 133, No. 4, 467-481. TARDEC. (2001). U.S. Army Tank-Automotive and Armaments Command Research, Development, and Engineering Center (TARDEC) Report. JP-8: The Single Fuel Forward: An Information Compendium, Warren, MI. Touchard, S., R. Fournet, P. A. Glaude, V. Warth, F. Battin-Leclerc, G. Vanhove, M. Ribaucour, R. Minetti. (2005). Modeling of the Oxidation of Large Alkenes at Low Temperatures. Proceedings of the Combustion Institute, Vol. 30, No. 1, 1073-1081.

88Westbrook, C. K., W. J. Pitz, O. Herbinet, H. J. Curran, E. J. Silke. (2009). A Comprehensive Detailed Chemical Kinetic Reaction Mechanism for Combustion of n-Alkane Hydrocarbons from n-Octane to n-Hexadecane. Combustion and Flame, Vol. 156, No. 1, 181-199. Wilk, R. D., D. N. Koert, N. P. Cernansky. (1989). Low-Temperature Carbon Monoxide Formation as a Means of Assessing the Autoignition Tendency of Hydrocarbons and Hydrocarbon Blends. Energy & Fuels, Vol. 3, No. 3, 292-298. Williams, R. H., E. D. Larson. (2003). A Comparison of Direct and Indirect Liquefaction Technologies for Making Fluid Fuels from Coal. Energy for Sustainable Development, Vol. 7, No. 4, 103-129. Zhao, Z., J. Li, A. Kazakov, F. L. Dryer. (2005). Burning Velocities and a High-Temperature Skeletal Kinetic Model for n-Decane. Combustion Science and Technology, Vol. 177, No. 1, 89-106.

89APPENDIX A: GENERAL OPERATING PROCEDURE FOR THE
PRESSURIZED FLOW REACTOR DURING A CONTROLLED COOL DOWN EXPERIMENT
CAUTION!!!
Read through the entire operating procedure before operating the pressurized
flow reactor. Air flow needs to be flowing through the system any time a heater
is on.
Air Flow Control
1.) Make sure there is air pressure. Around 80 psi during entire experiment.
2.) Turn on power supply for the controls. 2 red switches. (See Figure A.1)
3.) Turn on mass flow controller. (See Figure A.2)
4.) Turn on SV-5 switch for the air mass flow controller.
5.) Turn on and adjust mass flow controller to 50.5.
Heating
Note: ALWAYS make sure there is flow before turning on any heater!!!
1.) Turn on all 3 breakers.
2.) Every 10-20 minutes increase the 10 kW controller 20 °C. Stop at desired
temperature or do not exceed 427 °C. To adjust temperature, press adjustment
button on controller. Note: If temperature does not increase on temperature

90controller, make sure the red limit light on the overtemp controller is not
illuminated. If it is, press the reset button on the controller.
3.) Every 40-50 minutes increase the 3 kW heater controller 5%. Do not
increase over 70%.
4.) Turn on the inlet, test, and outlet bead heaters at approximately 100 °C.
Note: Not all of the bead heaters need to be turned on at this time. The bead
heaters heat up very quickly. For example: Turn on one bead heater for each
inlet, test, and outlet area. Then turn that one off after some time has passed;
30 minutes. Turn on a different bead heater for the area being heated. Only
turn on bead heaters that are required to reach the sample probe thermocouple
temperature. Table A.1 is a sample detailed heater warm-up schedule.
5.) Open blue valve for the Pacesetter water supply.
6.) Turn on Pacesetter water heater at approximately 100 °C.
7.) Turn on heater for the transfer sample line elbow (Variac controller).
Increase slowly to 40% to reach desired temperature of approximately 200 °C.
8.) Turn on heater for the sample line (CIC Photonics controller) when the flow
reactor is at approximately 200 °C. Try to stabilize the sample line at around
120 °C or desired temperature. Note: If the temperature of the sample line
will not reach 120 °C, increase the percentage of the Variac controller.
The following can be done 1-2 hours before final temperature is reached.
9.) Connect the liquid nitrogen tanks (gas use) and oxygen bottles to the
manifold lines.

9110.) Open manifold and all necessary valves.
11.) Verify that the regulated pressures are adjusted properly. For the nitrogen
gas: 300 psi regulated/350 psi gauge. Nitrogen for the fuel mixing: 310 psi
regulated/350 psi gauge. Oxygen: 420 psi regulated/2400 psi gauge. Gauge
pressures are approximate and quoted for a new tank/bottle.
12.) Follow this heating procedure until desired temperature is reached 800 K.
Pre-Experiment
1.) Make sure the nitrogen and oxygen bottles are connected to the manifold
lines.
2.) Change reactor conditions temperature on the Experiment Design Excel
spreadsheet. This is the temperature that the sample tip thermocouple is at.
The following “set” values will be from the Experimental Design Excel
spreadsheet for the fuel calibration set point section.
3.) Read nitrogen set point.
4.) Turn on nitrogen flow controller red switch.
5.) Set proper flow for nitrogen.
6.) Turn air flow controller to off.
7.) Turn air flow controller red switch off.
8.) Read nitrogen fuel set from Experimental Design Excel spreadsheet.
9.) Set flow for nitrogen fuel.
10.) Turn on nitrogen fuel bead heaters.
11.) Pressurize the flow reactor to 8 atm.

92Note: At this point in time only nitrogen is flowing through the reactor.
Clean/Calibrate the CO-CO2 Detector
1.) Disconnect sample line here. (See Figure A.3, #1)
2.) Connect small nitrogen line to here. (See Figure A.3, #2)
3.) Open green valve on small nitrogen line. This will allow low pressure
nitrogen to enter the analyzer.
4.) Press this button in slightly until the flow meter ball rises and the numbers on
the display go to zero. (See Figure A.3, #3)
5.) Repeat this procedure 5 times.
6.) Turn green nitrogen small line valve off.
7.) Remove small nitrogen line.
8.) Reinstall sample line.
9.) Press this button in. (See Figure A.3, #4)
10.) Open air operated sample valve on the manifold by the FTIR. (See
Figure A.4)
11.) Adjust flow meter ball to 3 by turning the flow adjusting valve. (See
Figure A.3, #1)
Filling Syringe Pump with Fuel
1.) Find fuel flow rate. This is done by using the Total Hydrocarbon Analyzer or
theoretically with the Experimental Design Excel spreadsheet.

932.) Calculate how much fuel (approximately 100 ml) is needed for the
experiment. Possibly 2 hours worth.
3.) Attach funnel to syringe pump. Note: Funnel may be attached. (See
Figure A.5)
4.) Check to see if old fuel is in pump.
5.) If yes, remove old fuel. Disconnect fuel line and press run on pump to
remove fuel. Dispose of old fuel in an approved waste fuel container.
6.) Suck out remaining fuel with vacuum pump.
7.) Now perform the flush and suck method to clean syringe pump. Put fuel in
the funnel. Press refill on pump. Stop when funnel is empty. Press run to
empty fuel/flush. Suck remaining fuel/flush out with the vacuum pump.
Repeat this 2-3 times or until all of the old fuel is removed.
8.) Fill pump with the correct amount of fuel.
9.) Change flow rate to around 10 ml/min.
10.) Purge pump by removing fuel line and press run until fuel starts to exit the
pump.
11.) Connect fuel line to the pump.
12.) Make sure black outlet valve is opened on pump.
13.) Set the appropriate fuel flow rate.
14.) Open oxygen bottles and oxygen manifold valve. Note: 420 psi
regulated/2400 psi gauge (new bottle).
15.) Open SV-4 oxygen switch.

9416.) Adjust oxygen flow rate with flow controller. The appropriate value is from
the Experimental Design Excel spreadsheet.
17.) Readjust pressure of the flow reactor if necessary to 8 atm.
18.) Readjust the nitrogen flow rate to the experimental set value from the
Experimental Design Excel spreadsheet.
19.) Press run on the fuel syringe pump. Make sure the fuel flow rate is properly
set. Let the fuel flow enough time to clear the fuel line from any fuel that was
in it from previous experiments. Approx. 10 minutes. Make sure the reactor
pressure is set to 8 atm.
Software Preparation
1.) Make a new folder. Copy the old data from previous experiment and paste
into new folder.
2.) Open PFR control. This is a LabView program.
3.) Click on Initialize System tab. Click run. No errors should be present.
4.) Click Probe Control tab. Move bar to on. Click run. Note: Green online
light should illuminate.
5.) Move probe into design point. First notice the temperature of the sample
probe. It should be around 800 K. Type this temperature into the
Experimental Design Excel spreadsheet’s reactor conditions. Then note the
probe position’s experimental set point. The initial position of the probe
should be greater than this set point. For example, if the spreadsheet
calculates the position to be 31.275, put the probe at 32.0. To move the probe,

95set slider bar to move, in, adjust how much to move, then click run. Note:
Wait until probe stops moving; i.e. this is when the numbers on the Daedel
positioning controller stops changing.
6.) Click Probe Automove tab. Enter the residence time (from the reactor
conditions), total flow rate (make sure this is total flow rate), and the
maximum allowed position change (set to 2 at this time). Click “check mark”
to enter values.
7.) Click on the Flow Controller Setpoints tab. Adjust flow controller setpoints.
Click “check mark” to enter values.
8.) Go under Operate menu. Check “log data at completion” is selected.
9.) Go under Operate menu. Data logging. Log. If nothing shows up, clear the
log file binding. Then repeat 9.
10.) Click rawlog.txt. Make sure you are in the right folder. Then delete. Keep
this name, then save.
11.) Click Probe Automove tab.
12.) Make sure syringe pump is injecting fuel into the reactor and that sufficient
time has passed to allow old fuel to be removed from the line.
13.) Before continuing, make sure the PFR sample probe temperature has
stabilized. Also, make sure the nitrogen fuel bead heaters are up to
temperature (approximately 400 °C or desired temperature).
14.) Click continuous run in LabView PFR Auto Control.

9615.) Change the maximum allowed position change to .2, once the position
change fluctuation decreases (this may take 10 seconds or so.) Click “check
mark” to enter the number.
16.) Turn off the 10 kW and 3 kW heaters. Also, make sure the inlet, test and
outlet bead heaters are off. Note: Leave the nitrogen fuel heater and
breaker on.
17.) Control the pressure of the reactor around 8 atm during the controlled cool
down experiment.
Data Collection After Controlled Cool Down
1.) Stop the fuel flow.
2.) Turn off nitrogen fuel heater and nitrogen fuel flow.
3.) Turn off oxygen flow controller, then SV-4 oxygen switch.
4.) Stop PFR Auto Control.
5.) Open PFR Datalogger. (Currently on the desktop) Click run. Click
convertedlog.csv (make sure this is the right file and folder! This is the file
that was copied in step 1 of the Software Preparation.) Delete this file. Use
name. Click OK. Click large red Done button to finish.
6.) Open convertedlog.csv. Select all of the data. Copy.
7.) Open CCD Data Analysis X.xls. Go to log on the lower tab in Excel. Paste
this data over the old. Click save as, save.
8.) Close PFR Data Logger.

97Shut Down Procedure
1.) Move probe back to the home position. Click Probe Control in PFR auto
control program. Move slider to off, click run. Move slider to on, click run.
Make sure probe positioning table has stopped. The Daedel controller should
read zero. Move to off, click run.
2.) Close valve for fuel on the syringe pump.
3.) Turn off transfer sample line heater.
4.) Turn off the heater for the probe/transfer sample line, grey Variac.
5.) At about 250 °C, lower the pressure to 1 atm. Do this gradually!
6.) Turn off Pacesetter at less than 100 °C. The Pacesetter can be left on for
several hours, if needed. Make sure the blue water supply valve is turned off.
7.) Switch nitrogen SV-2 switch off. Turn nitrogen flow controller setpoint to
zero. Turn SV-5 air switch on. Adjust air with the flow controller and set to
40.
8.) Make sure the date and name are changed on the Experimental Design Excel
spreadsheet. Click save as, save.
9.) Turn pressure building valve off on the nitrogen tanks.
10.) Turn the nitrogen tanks and manifold off.
11.) Turn the oxygen tanks and manifold off.
12.) Once the reactor cools down to around room temperature 24 °C, turn off the
airflow SV-5 switch.

98A.1 Typical PFR Heater Set-Point Schedule
Table A.1 is a typical 10 kW and 3 kW heater schedule. At the start of each
PFR experiment the 10 kW is set to 40 °C and the 3 kW set to 6 %. The 10 kW
heater is increased by 20 °C every 15-20 minutes and the 3 kW increased every 40-50
minutes. Having the warm-up phase follow this schedule, both heaters will reach
their safe maximum operating temperature at approximately the same time. The
maximum safe operating parameter of the 10 kW heater is 427 °C and the 3 kW
heater is 70 %. Each of the bead heaters are turned on separately throughout the
warm up phase. The Pacesetter sample probe water temperature controller can be
turned on when the temperature of the PFR is at 100 °C. The Pacesetter is turned on
at 100 °C to prevent the water inside the sample probe from boiling. The nitrogen is
introduced into the PFR at around 800 K and the nitrogen bead heaters are turned on.
When the nitrogen is first introduced, the sample probe temperature will drop.
However, after a few minutes from when the bead heaters are turned on, the
temperature will start to increase. It is necessary to follow this schedule as closely as
possible so that isothermal conditions are met.

99Table A.1: Typical set-points for PFR heaters during warm-up phase.
Time 10 kW (°C) 3 kW (%) Sample Temp (°C) Notes
8:08 am 40 6 17.9 8:28 60 --- 26.5 8:45 80 11 28.2 9:03 100 --- 37.0 9:24 120 14 42.3 Inlet 1 on 9:44 140 --- 82.9 Pacesetter on 9:58 160 18 104.4 Pacesetter set to 50°C 10:14 180 25 126.2 10:41 200 --- 156.0 11:11 220 32 179.4 Test 1 on 11:28 --- 38 202.0 11:52 240 --- 232.0 Inlet 2 on
12:14 pm 260 44 286.7 Outlet 1 on 12:39 280 50 340.0 1:00 300 --- 373.8 Test 2 on 1:15 320 55 410.5 Inlet 3 on 1:40 340 --- 435.2 2:02 360 60 455.2 Pacesetter set to 90°C 2:20 380 61 473.6 2:42 400 62 494.1 3:03 410 --- 509.9 3:19 --- 68 515.4 3:25 415 69 533.4 Nitrogen on & heaters3:52 --- 70 536.5 4:45 --- --- 557.6 Fuel sample stored 5:00 410 66 562.9

100A.2 Pictures of Selected PFR Facility Components
Figure A.1: Picture of PFR controllers with arrows identifying main power supply control switches.

101
Figure A.2: Picture of PFR computer with the arrow identifying the PFR mass flow controller.

102
Figure A.3: Picture of sample connections to the CO and CO2 detector, and calibration controls.

103
Figure A.4: Picture of air operated sample valve identified with arrow.
Figure A.5: Picture of the ISCO Model 500D fuel syringe pump.