Employee found guilty of habitual absenteeism and tardiness not entitled to economic assistance.docx

International Journal of Research in Social Sciences
Vol. 7 Issue 10, October 2017,
ISSN: 2249-2496 Impact Factor: 7.081
Journal Homepage: http://www.ijmra.us, Email: [email protected]
Double-Blind Peer Reviewed Refereed Open Access International Journal - Included in the International Serial
Directories Indexed & Listed at: Ulrich's Periodicals Directory ©, U.S.A., Open J-Gage as well as in Cabell’s
Directories of Publishing Opportunities, U.S.A
7 International Journal of Research in Social Sciences
http://www.ijmra.us, Email: [email protected]
EMPLOYEE ABSENTEEISM – A CASE STUDY OF
LEATHER FIRM IN VELLORE
Dr.S.Poongavanam*
ABSTRACT
Absenteeism is the most important problems in leather firms. The main objective of the study
was to find the reasons for absenteeism; however, there are many factors that determine
absenteeism, apart from satisfaction. The researcher conducted a research of 180 employees from
the Leather firms. The research concluded that absenteeism was largely present in leather firms it
may be due to their health problems caused due to leather and of those workers with low job
satisfaction.
Key Words: Time taken, transport, Satisfaction & Condition
* Assistant Professor, AMET Business School, AMET University, Chennai
ISSN: 2249-2496 Impact Factor: 7.081
8 International Journal of Research in Social Sciences
http://www.ijmra.us, Email: [email protected]
Introduction and Reviews
Muchinsky stated that the conflicting and contradictory findings reported in studies on
absenteeism are attributable to the ill-defined concept of absenteeism (Muchinsky 1977).
Defining absenteeism should be simple. "A person either is or is not at work." However, there is
not universal agreement on its meaning (Rhodes & Steers, 1990)[7]. Many studies argue that job
satisfaction and absenteeism are related among employees, but the connection is inconsistent.
Most absence research has concentrated on two main themes: the association of personal
characteristics with absence and the association of job satisfaction with absence. Some studies
organize absenteeism into two main types: "voluntary and involuntary". While voluntary
absenteeism implies a conscious decision by the worker about whether to attend work on any
given day, involuntary absence implies that it is beyond the immediate control of the worker, e.g
Transportation problems, sickness or family funeral (Hackett & Guion, 1985).
“Absenteeism is a serious problem for a management because it involves heavy additional
expenses. Reserves and understudies are kept in readiness to take the place of the absentees,
failing which the overhead cost of idle equipment has to be faced. Industrial employees do not
usually ask for leave of absence in advance or even give notice during their absence as to how
long they would be away. The management is generally uncertain about probable duration of an
employee’s absence and cannot take appropriate measures to fill the gap. As regards measures to
be adopted to be remedy the situation, the Labor investigation Committee, 1946, was of the
opinion that “Proper conditions of work in the factory, adequate wages, protection from
accidents and sickness, and facilities for obtaining leave for rest and reaction constitute the most
effective means of reducing Absenteeism.
The Encyclopedia of Social Sciences suggests the following measures to reduce the rate
of absenteeism.
I. The personnel management should encourage notification, especially in cases of sickness
when the duration of absences is likely to be long.

ISSN: 2249-2496 Impact Factor: 7.081
9 International Journal of Research in Social Sciences
http://www.ijmra.us, Email: [email protected]
II. In case of personal and family; circumstances, e.g... Illness of children in the case of
married women employees, which make absences unavoidable, leave, should be granted
liberally.
III. To reduce unavoidable absence due to sickness and industrial accidents, programmers of
industrial hygiene and safety should be strengthened.
IV. Regularity in attendance can be encouraged to some extent by the offer of a bonus and
other pecuniary inducement.
V. Absenteeism is probably a natural human reaction to the routine of modern factory life.
There is maladjustment between man’s instincts and desires and the regular working habits that
are imposed upon him this routine can be relaxed or modified by grant of leave with pay, by
shortening or redistributing scheduled hours, by having employees living nearer to their places of
work, and by adjusting the physical condition of the plant, especially noise and ventilation. It
should be noted no single measure can be effective in controlling Absenteeism but a skillful
combination of various measures would definitely lead to the desired results.
Methodology
Survey method was followed to conduct the study & data were collected through convenieve
sampling technique method. Convenient sampling is a non-probability sampling. The technique
was chosen as convenient and saves time. Respondents who were easily available for survey
were selected. The sample size included respondents of various departments of the leather firms.
The sample size for employees was chosen to be 180 this was considered sufficient to analyze
and interpret the data easily. After scrutiny of field data, the processing was done.
OBJECTIVES OF THE STUDY
To study the various personal factors of the employees that influences absenteeism.
To study the impact of absteesim on the personal factors
To suggest various remedial measures to effective control absenteeism of the employees.
SOURCES OF DATA COLLECTION
Both primary and secondary data collection have been taken for this research study.
Primary Data:

ISSN: 2249-2496 Impact Factor: 7.081
10 International Journal of Research in Social Sciences
http://www.ijmra.us, Email: [email protected]
The primary data are those, which are collected afresh and for the first time, and thus happen to
be original in character. The primary data is collected using a well – designed questionnaire both
in English and Tamil language. The primary data is collected by direct interview with the
workers. The questions included were:
Dichotomous questions
Open ended questions
Closed ended questions
Secondary Data:
Secondary data means data that are already available. The secondary data is collected
with the help of company records, company manual, internet etc.,
LIMITATIONS OF THE STUDY
a) There is chance of bias in response due to - Respondents mental state and attitude,
Lack of sufficient time to interact
b) Respondents answered the questions while they were working,
STATISTICAL TOOLS USED
1. CHI Square
2. Percentage
DATA ANALYSIS AND INTERPRETATION
TABLE NO .1
AGE OF THE RESPONDENTS
S. No Particulars No. Respondents Percentage
1 Below 30 years 110 61.1%
2 30 - 35years 36 20%
3 Above 35 years 34 18.9%
Total 180 100%

ISSN: 2249-2496 Impact Factor: 7.081
11 International Journal of Research in Social Sciences
http://www.ijmra.us, Email: [email protected]
INFERENCE
From the above table it is clear that 61.1% of the respondents belong to the age group of
below the age of 30, 20% to the age group of 30-35 and 18.9% to the group of respondents above
35 ages.
TABLE NO 2
EDUCATIONAL QUALIFICATION
S. No Particulars No. Respondents Percentage
1 Below 10th
std 14 7.8%
2 12th
std 38 21.2%
3 ITI Holder 52 28.8%
4 Diploma 62 34.4%
5 Graduate 4 2.2%
6 Post graduate 10 5.6
Total 180 100%
INFERENCE
From the above table it is clear that 7.8% of the respondents are below 10th
std 21.2%, are
12th
std, 28.8% are ITI Holder, 34.4% are diploma holders, only 2.2% of the respondents are
Graduate, 5.6% of the respondents in post graduate.
TABLE NO. 3
WORKING EXPERIENCE
S. No Particulars No. Respondents Percentage
1 Below 1 years 26 14.5%
2 2 - 4years 98 54.5%
3 5 - 7 years 48 26.6%
4 Above 7 years 8 4.4%
Total 180 100%

ISSN: 2249-2496 Impact Factor: 7.081
12 International Journal of Research in Social Sciences
http://www.ijmra.us, Email: [email protected]
INFERENCE:
From the above table it is clear that 54.5% of the respondents have service of 2 - 4 years 26.6%
of the respondents service of 5 – 7 years and then 14.5%of respondents have service of below 1
year and 4.4% of respondents have 7 years service.
TABLE NO. 4
MARITAL STATUS OF THE RESPONDENTS
S. No Particulars No. Respondents Percentage
1 Married 121 67.2%
2 Unmarried 159 32.8%
Total 180 100%
INFERENCE:
From the above table it is 67.2% of the respondent is married and then 32.8% of the
respondents are Unmarried.
TABLE NO. 5
NUMBER OF CHLIDERNS THE RESPONDENTS HAVE
S. NO No. of Respondents Children’s Percentage
1 42 None 23.3%
2 86 One 47.7%
3 34 Two 19.8%
4 18 Three and above 10.2%
180 100%
INFERENCE
From the above table it is 47.7% of the respondents having 1 children, 23.3% of the respondents
having none children’s, and 19.80% of the respondents having 2 children’s, and 10.2% of
respondents having above 3 children’s.
ISSN: 2249-2496 Impact Factor: 7.081
13 International Journal of Research in Social Sciences
http://www.ijmra.us, Email: [email protected]
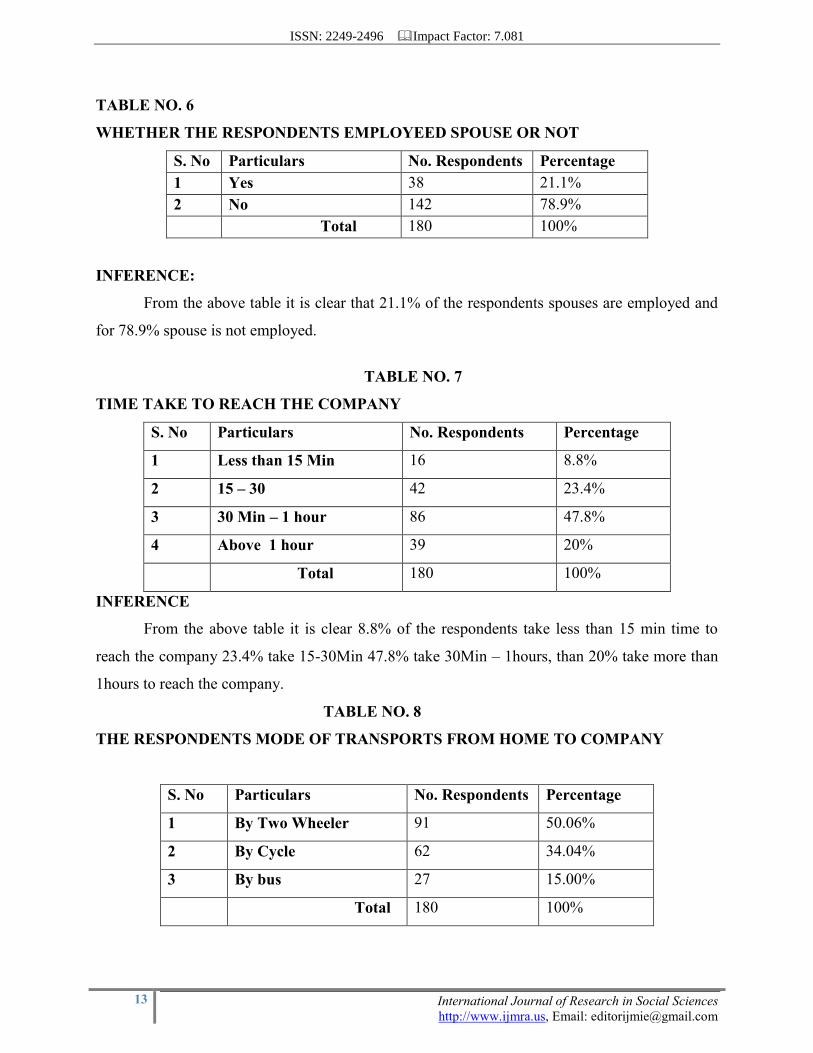
TABLE NO. 6
WHETHER THE RESPONDENTS EMPLOYEED SPOUSE OR NOT
S. No Particulars No. Respondents Percentage
1 Yes 38 21.1%
2 No 142 78.9%
Total 180 100%
INFERENCE:
From the above table it is clear that 21.1% of the respondents spouses are employed and
for 78.9% spouse is not employed.
TABLE NO. 7
TIME TAKE TO REACH THE COMPANY
S. No Particulars No. Respondents Percentage
1 Less than 15 Min 16 8.8%
2 15 – 30 42 23.4%
3 30 Min – 1 hour 86 47.8%
4 Above 1 hour 39 20%
Total 180 100%
INFERENCE
From the above table it is clear 8.8% of the respondents take less than 15 min time to
reach the company 23.4% take 15-30Min 47.8% take 30Min – 1hours, than 20% take more than
1hours to reach the company.
TABLE NO. 8
THE RESPONDENTS MODE OF TRANSPORTS FROM HOME TO COMPANY
S. No Particulars No. Respondents Percentage
1 By Two Wheeler 91 50.06%
2 By Cycle 62 34.04%
3 By bus 27 15.00%
Total 180 100%
ISSN: 2249-2496 Impact Factor: 7.081
14 International Journal of Research in Social Sciences
http://www.ijmra.us, Email: [email protected]
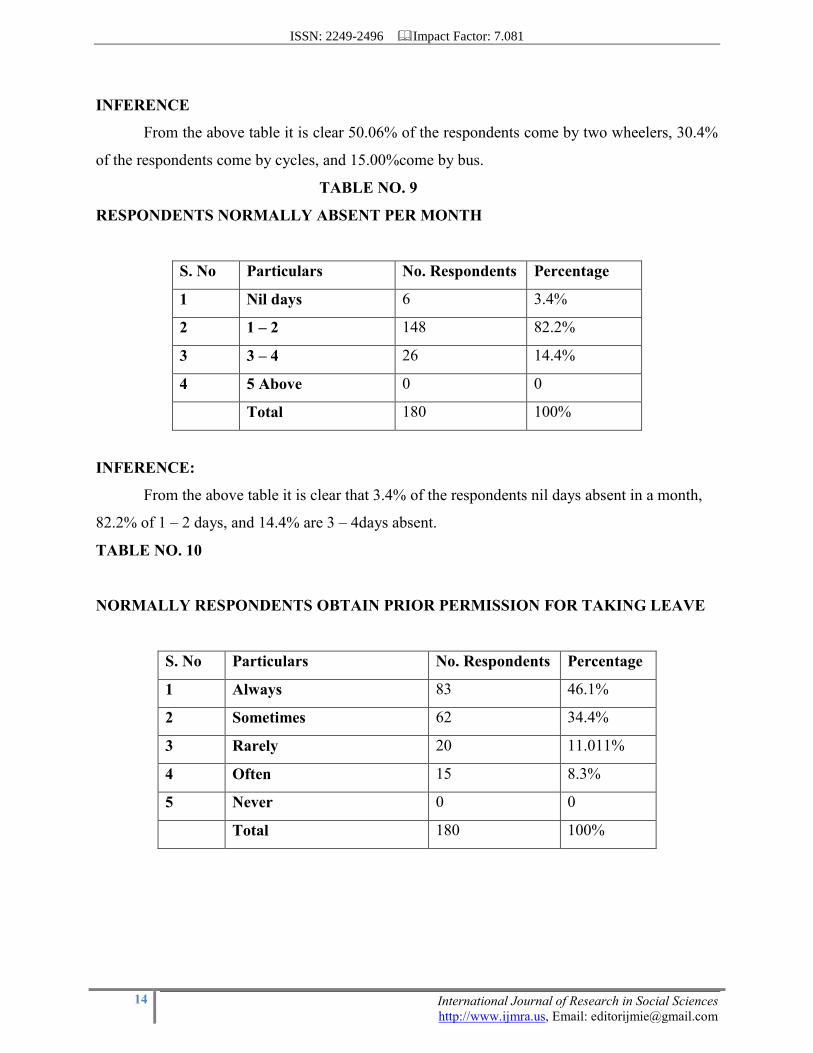
INFERENCE
From the above table it is clear 50.06% of the respondents come by two wheelers, 30.4%
of the respondents come by cycles, and 15.00%come by bus.
TABLE NO. 9
RESPONDENTS NORMALLY ABSENT PER MONTH
S. No Particulars No. Respondents Percentage
1 Nil days 6 3.4%
2 1 – 2 148 82.2%
3 3 – 4 26 14.4%
4 5 Above 0 0
Total 180 100%
INFERENCE:
From the above table it is clear that 3.4% of the respondents nil days absent in a month,
82.2% of 1 – 2 days, and 14.4% are 3 – 4days absent.
TABLE NO. 10
NORMALLY RESPONDENTS OBTAIN PRIOR PERMISSION FOR TAKING LEAVE
S. No Particulars No. Respondents Percentage
1 Always 83 46.1%
2 Sometimes 62 34.4%
3 Rarely 20 11.011%
4 Often 15 8.3%
5 Never 0 0
Total 180 100%
ISSN: 2249-2496 Impact Factor: 7.081
15 International Journal of Research in Social Sciences
http://www.ijmra.us, Email: [email protected]
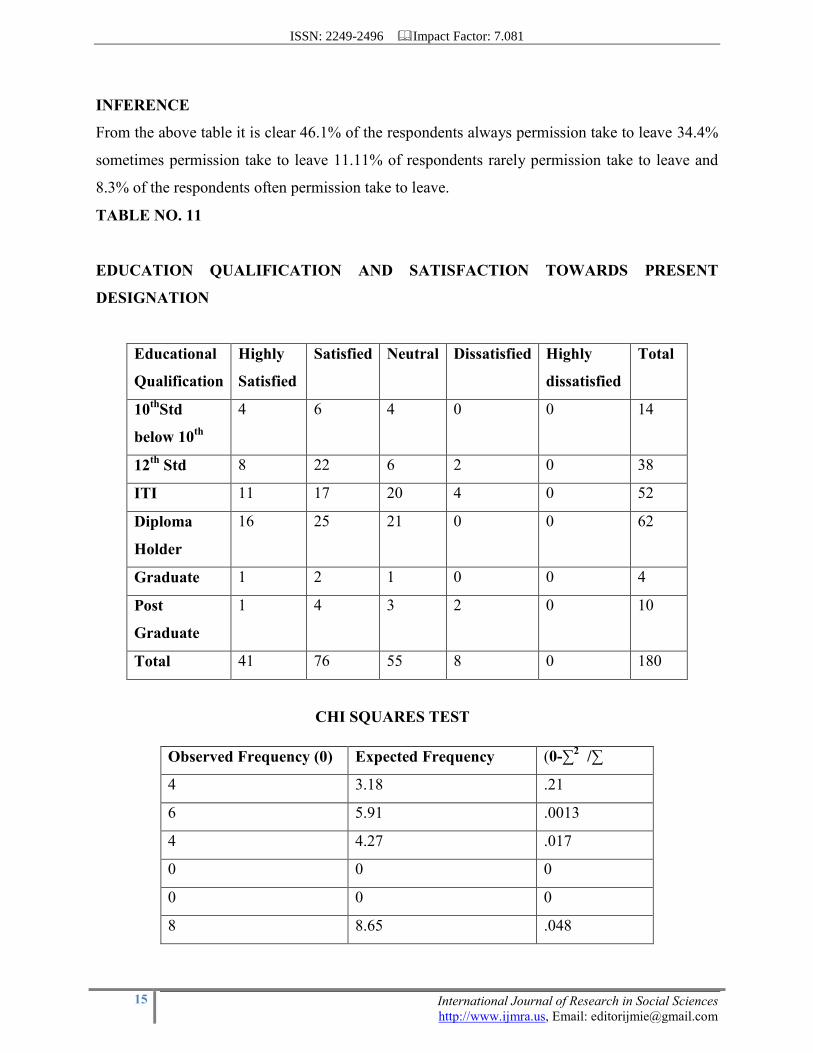
INFERENCE
From the above table it is clear 46.1% of the respondents always permission take to leave 34.4%
sometimes permission take to leave 11.11% of respondents rarely permission take to leave and
8.3% of the respondents often permission take to leave.
TABLE NO. 11
EDUCATION QUALIFICATION AND SATISFACTION TOWARDS PRESENT
DESIGNATION
Educational
Qualification
Highly
Satisfied
Satisfied Neutral Dissatisfied Highly
dissatisfied
Total
10th
Std
below 10th
4 6 4 0 0 14
12th
Std 8 22 6 2 0 38
ITI 11 17 20 4 0 52
Diploma
Holder
16 25 21 0 0 62
Graduate 1 2 1 0 0 4
Post
Graduate
1 4 3 2 0 10
Total 41 76 55 8 0 180
CHI SQUARES TEST
Observed Frequency (0) Expected Frequency (0-∑2 /∑
4 3.18 .21
6 5.91 .0013
4 4.27 .017
0 0 0
0 0 0
8 8.65 .048

ISSN: 2249-2496 Impact Factor: 7.081
16 International Journal of Research in Social Sciences
http://www.ijmra.us, Email: [email protected]
22 16 2.25
6 11.61 2.71
2 1.68 0.06
0 0 0
11 11.84 .059
17 22 1.13
20 15.88 1.06
4 2.31 1.23
0 0 0
16 14.12 .25
25 26.17 .052
21 19 .21
0 0 0
0 0 0
1 .91 .008
2 1.68 0.06
1 1.22 0.039
0 0 0
0 0 0
1 2.27 0.71
4 4.22 0.011
3 3.05 .008
2 .44 5.53
0 0 0
Total 15.21
Calculated values : 15.21
Table value : 10.67
Calculated value > Table Value
Rejected the Hypotheses

ISSN: 2249-2496 Impact Factor: 7.081
17 International Journal of Research in Social Sciences
http://www.ijmra.us, Email: [email protected]
Conclusion:
Education qualification wise satisfaction towards present designation is not independent.
CHART NO 2.16
INFERENCE
The above table shows that the educational qualification and satisfaction level of the employee in
the organization. Most of the employees are satisfied to their job.
TABLE NO. 12
AGE WISE SATISFACTION TOWARDS FREEDOM TO WORK IN THE COMPANY
Satisfaction
Level
Age
wise
Strongly
agree
Agree Neutral Disagree Strongly
disagree
Total
Below 30
years
30
44
32
4
0
110
EDUCATION QUALIFICATION WISE SATISFACTION TOWARDS PRESENT DESIGNATION
0
5
10
15
20
25
30
10thStd below 10th
12th STD ITI Diploma Holder
UG PG
Educational Qualification
Responden
ts
Highly Satisfied
Neutral Dissatisfied Highly
Dissatisfied
Satisfied

ISSN: 2249-2496 Impact Factor: 7.081
18 International Journal of Research in Social Sciences
http://www.ijmra.us, Email: [email protected]
30 – 35
years
4
21
9
2
0
36
Above 35
years
12
14
7
1
0
34
Total
46
79
48
7
0
180
CHI SQUARE TEST
Observed Frequency (0) Expected Frequency (0-∑2 /∑
30 28.1 0.010
44 48.27 0.37
32 29.33 0.24
4 4.27 0.017
0 0 0
4 9.2 2.93
21 15.8 1.71
9 9.6 0.03
2 1.4 0.25
0 0 0
2 8.68 1.26
14 14.92 0.05
7 9.06 0.46
1 1.32 0.077
0 0 0
Total 8.097
Calculated Value : 8.097

ISSN: 2249-2496 Impact Factor: 7.081
19 International Journal of Research in Social Sciences
http://www.ijmra.us, Email: [email protected]
Table Value : 10.67
Calculated value < Table value
Hence the hypothesis is accepted.
Conclusion:
Age wise satisfaction towards freely working in the company.
CHART NO 2.17
INFERENCE
The above table shows that the employees age wise satisfaction towards freely working in the
company. Most of the employees are belonging below 30 years age group.
FINDINGS
The study reveals that 61.1%of the respondents below 30years of the age.
It has been found that 34.4% of the respondents diploma qualified completed.
It has been found that 54.5%of the respondents got 2to4years experience in TVS Brakes
India.
0
5
10
15
20
25
30
35
40
45
Responden
ts
Below 25 years 25 – 30 years Above 30 years
Age
AGE WISE SATISFACTION TOWARDS FREELY WORKING IN THE COMPANY
Strongly agree
Agree
Neutral
Disagree
Strongly disagree

ISSN: 2249-2496 Impact Factor: 7.081
20 International Journal of Research in Social Sciences
http://www.ijmra.us, Email: [email protected]
It has been found that 67.2%of the respondents married people.
It has been found that 47.7% of the respondents have one child.
It has been found that 78.9%of the respondents spouse not employed.
It has been found that 47.8%of the respondents minimum 30min to 1hours time take to
reach the company.
It has been found that 47.78% of the two wheeler transports from home to company.
It has been found that 82.2%of the respondents normally 1to 2days absent per month.
It has been found that 46.1%of the respondents always permission take to leave.
It has been found that existing rules and regulation of the condition level of employees to
be more satisfied.
It has been found that general absence is mainlydue to some other personal or family
problems.
It has been found that 48 of the respondents following my habit is occasionally smoking.
It has been found that maximum no of the respondents know that my absent result
loosing absents yearly increment.
SUGGESSTIONS & RECOMMENDAITIONS
Company may take necessary steps to give work freely to reduce overtime of work, heat
and pollution inside the company, which help to maintain high morale and that will lead to better
productivity.
Management can take initiative steps for recreation facilities like family tour for the
employees.
Redesigning jobs to give employees more responsibility, more meaningful work and
increased feedback can reduce absenteeism because these factors give the employees greater
control of the absenteeism.
Employees may be given the voice in the decision-making to improve in work and reduce
absence.
CONCULUSION
The management must first have a positive attitude towards absenteeism. Even though it possible
to eliminate absenteeism completely. The provision of various facilities to reduce absenteeism

ISSN: 2249-2496 Impact Factor: 7.081
21 International Journal of Research in Social Sciences
http://www.ijmra.us, Email: [email protected]
bound to involve substantial financial commitment for the management. The major causes for
absenteeism in the organization are the activities and policies of the organization. Though
absenteeism is invisible but proves fatal for the industry. So reduction in absenteeism will help in
improving the productivity. From this study, it is obvious that the most of the employees are
satisfied with the time of work.
References
Allen, P. “Size of Workforce, Morale and Absenteeism: a Reexamination” British Journal of
Industrial Relations, (1982)
2. Avery, R. and Holtz, V. Statistical Models for Analyzing Absentee Behavior, in Goodman, P,
Atkin, R. and Associates eds, New Approaches to Understanding, Measuring and Managing
Employee Absence, London: Jossey-Bass Ltd. (1984).
3. Barmby, T. and Treble, J Absenteeism in a Medium-Sized Manufacturing Plant, Applied
Economics, (1991).
4. Bhatti, K., & Qureshi, T. Impact of employee participation on job satisfaction, employee
commitment and employee productivity. International Review of Business Research Papers
(2007).
5. Bajpai, N., & Srivastava, D. Sectorial comparison of factors influencing job satisfaction in
Indian banking sector. Singapore Management Review (2004).
6. Grasso and Malka. Is there a relationship between job satisfaction and absenteeism? Journal
of Advanced Nursing (1989)
7. Rhodes, S.R., & Steers, R.M. Managing employee absenteeism Addison: Wesley Publishing
Company. (1990).
8. Spector, P.E. Job satisfaction: Application, assessment, causes and consequences, Thousand
Oaks, CA, Sage Publications, Inc (1997).
9. Scott, K.D. & Taylor, G.S. An examination of conflicting findings on the relationship between
job satisfaction and absenteeism, Academy of Management Journal, (1985).
10. Yianiv, G. Burnout, absenteeism, and the overtime decision, Journal of Economic
Psychology(1995)