Emergency Interventions in African Children: What Next? - Kathryn Maitland
55
Who needs oxygen: the case for a trial Professor Kathryn Maitland
-
Upload
smacc-conference -
Category
Health & Medicine
-
view
212 -
download
0
Transcript of Emergency Interventions in African Children: What Next? - Kathryn Maitland

Whoneedsoxygen:thecaseforatrial
ProfessorKathrynMaitland
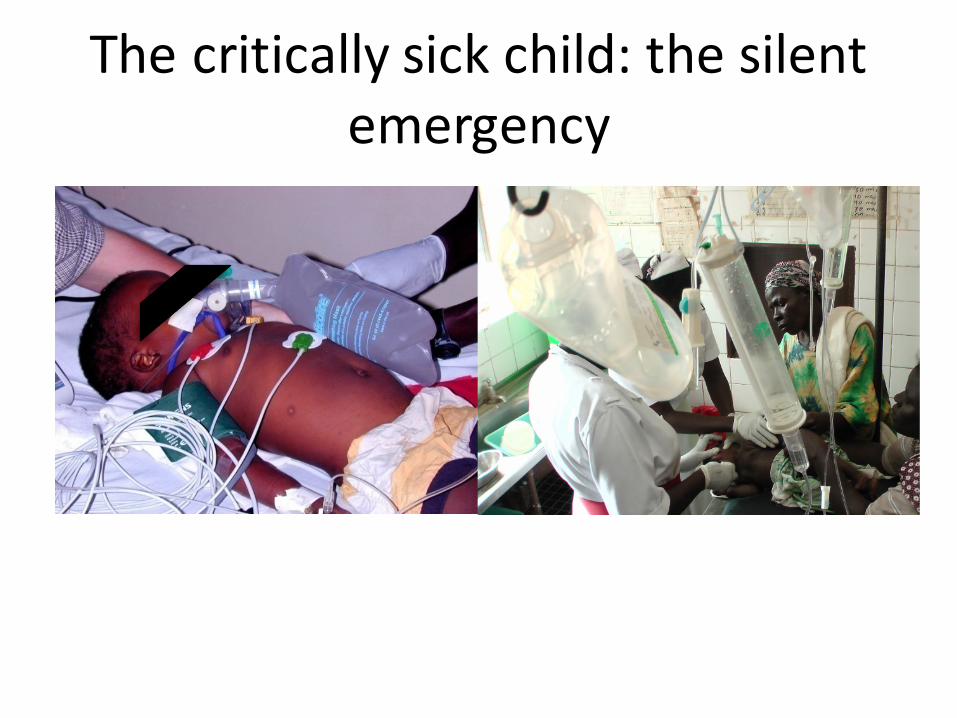
Thecriticallysickchild:thesilentemergency
It has been suggested that fluid resuscita-
tion would be a low cost option for saving
lives. The WHO has developed guidelines
for identification and management of
shock (including children with malaria and
septicaemia). These recommendations
however only apply to children with the
most severe form of shock (WHO defini-
tion) owing to concerns about the safety
of fluid resuscitation. Few African hospitals
have the backup of intensive care equip-
ment (such as ventilators) to support
children if they receive too much fluid.
What is the evidence that fluid resuscitation works for treatment of infections associated with shock?
Randomised trials are the best form of
evidence. Prior to the FEAST trial, no
randomised controlled trials in children
or adults have looked at whether fluid
resuscitation helps in shock. The current
guidelines in high-income countries, which
have been in place for many years, are
largely based on observational studies. The
trials which have been undertaken in adults
with sepsis and children with dengue fever
and malaria only examined which type of
fluid was better and not whether giving
fluid boluses was better than no bolus
(control). In malaria, previous small trials
suggested a beneficial outcome with albu-
min compared to any other type of fluid.
The FEAST trial
The FEAST (Fluid Expansion As Sup-
portive Therapy) trial tested the safety
and effectiveness of giving rapid fluid
resuscitation in the first hour to children
in Africa with febrile illness and shock
compared with maintenance fluids only.
The trial was carried out in 6 hospi-
tals in Kenya, Tanzania and Uganda.
Children were divided randomly into
three arms. Two arms were to receive
emergency boluses of fluid, between
20-40 mls per kg of bodyweight, in the
first hour of arriving in hospital; one arm
albumin boluses and the other normal
saline boluses; children in the third arm, or
control arm, were given maintenance fluids
(3-4ml/kg) but no bolus. After this all chil-
dren received maintenance fluids until they
were able to drink. The maintenance fluids
given were those that were routinely avail-
able, which was generally dextrose saline.
When children present to hospital with
a severe life threatening illness, front-
line doctors do not have time to make
a specific diagnosis before they initiate
emergency treatments. The FEAST trial
was therefore designed as a practical
trial that represented the realities of
emergency care and therefore included
a range of infectious diseases.
The main outcome was how many children
survived after forty-eight hours in hospital.
Children were then followed up for the
next month to check there were not more
deaths or long term effects on the quality
of life, especially neurological disability.
What were the results?
Who were the children
enrolled in the FEAST trial?
3141 children took part in the FEAST trial.
They were aged between 60 days and 12
years (average age 24 months). All had
fever and one or more features of poor
perfusion (half had 2 or more), with either
impaired consciousness or respiratory
distress, or both. Severe acidosis (Ph <7.2
and/or lactate levels >5mmol per litre)
was present in over half the children.
57% of the children had malaria parasites;
12% had a blood infection (bacteraemia);
32% had severe anaemia; 3% had men-
ingitis; 42% had respiratory conditions
Photo courtesy of Harry Lewis
MRC CTU Briefing Paper, March 2012, Issue 3 | pg. 2


ManagingcriticalillnessinsubSaharanAfrica
ResearchFocus:• Mosthospitalshavenoaccess
toICUs• Managementguidelines
shouldbegeneralisabletohospitalswithlimitedinfrastructure
• Algorithms:simple,clearandpragmatic
• Ideally,basedonevidence

Whoneedsoxygen/respiratorysupport?

Deepbreathing:clinicalmarkerofacidosis

Deepbreathing:clinicalmarkerofacidosis

Globalburdenofdisease
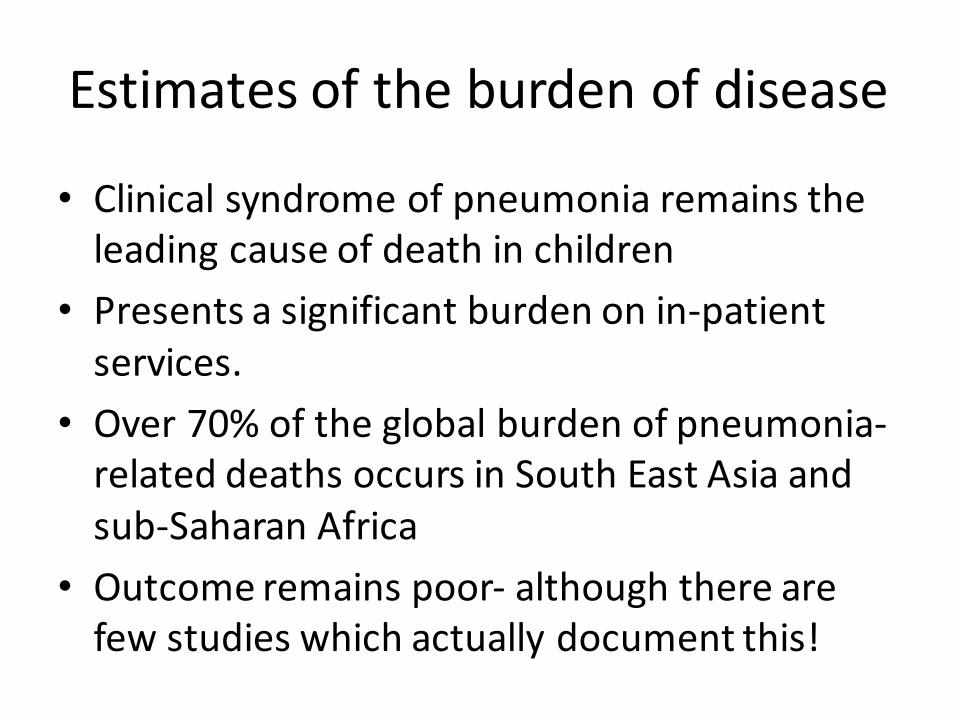
Estimatesoftheburdenofdisease
• Clinicalsyndromeofpneumoniaremainstheleadingcauseofdeathinchildren
• Presentsasignificantburdenonin-patientservices.
• Over70%oftheglobalburdenofpneumonia-relateddeathsoccursinSouthEastAsiaandsub-SaharanAfrica
• Outcomeremainspoor- althoughtherearefewstudieswhichactuallydocumentthis!
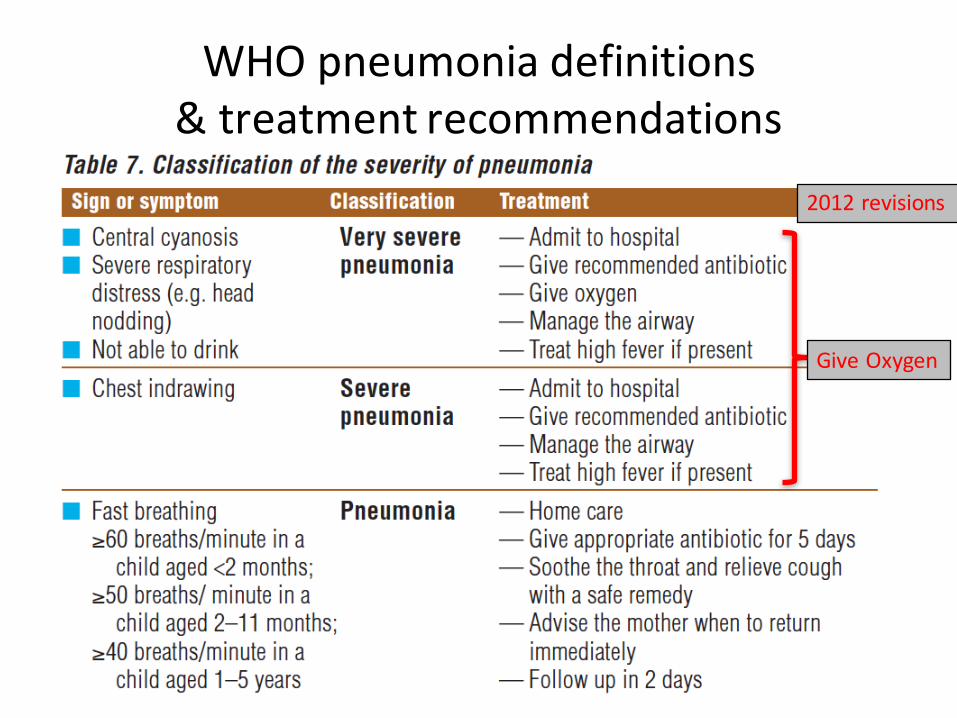
WHOpneumoniadefinitions&treatmentrecommendations
GiveOxygen
2012revisions

408 Bulletin of the World Health Organization | May 2008, 86 (5)
Epidemiology and etiology of childhood pneumoniaIgor Rudan,a Cynthia Boschi-Pinto,b Zrinka Biloglav,c Kim Mulholland d & Harry Campbell e
Abstract Childhood pneumonia is the leading single cause of mortality in children aged less than 5 years. The incidence in this age group is estimated to be 0.29 episodes per child-year in developing and 0.05 episodes per child-year in developed countries. This translates into about 156 million new episodes each year worldwide, of which 151 million episodes are in the developing world. Most cases occur in India (43 million), China (21 million) and Pakistan (10 million), with additional high numbers in Bangladesh, Indonesia and Nigeria (6 million each). Of all community cases, 7–13% are severe enough to be life-threatening and require hospitalization. Substantial evidence revealed that the leading risk factors contributing to pneumonia incidence are lack of exclusive breastfeeding, undernutrition, indoor air pollution, low birth weight, crowding and lack of measles immunization. Pneumonia is responsible for about 19% of all deaths in children aged less than 5 years, of which more than 70% take place in sub-Saharan Africa and south-east Asia. Although based on limited available evidence, recent studies have identified Streptococcus pneumoniae, Haemophilus influenzae and respiratory syncytial virus as the main pathogens associated with childhood pneumonia.
Bulletin of the World Health Organization 2008;86:408–416.
Une traduction en français de ce résumé figure à la fin de l’article. Al final del artículo se facilita una traducción al español. الرتجمة العربية لهذه الخالصة يف نهاية النص الكامل لهذه املقالة.
a Croatian Centre for Global Health, University of Split Medical School, Soltanska 2, 21000 Split, Croatia.b Child and Adolescent Health and Development, World Health Organization, Geneva, Switzerland.c Department of Epidemiology, Andrija Stampar School of Public Health, Zagreb, Croatia.d Department of Epidemiology and Population Health, London School of Hygiene and Tropical Medicine, London, England.e University of Edinburgh Medical School, Edinburgh, Scotland.Correspondence to Igor Rudan (e-mail: [email protected]).doi:10.2471/BLT.07.048769(Submitted: 18 October 2007 – Revised version received: 14 January 2008 – Accepted: 5 March 2008 )
IntroductionIn the early 1970s Cockburn & Assaad1 generated one of the earliest estimates of the worldwide burden of communi-cable diseases. In a subsequent review, Bulla & Hitze2 described the substantial burden of acute respiratory infections and, in the following decade, with data from 39 countries, Leowski3 estimated that acute respiratory infections caused 4 million child deaths each year – 2.6 million in infants (0–1 years) and 1.4 million in children aged 1–4 years. In the 1990s, also making use of available international data, Garenne et al.4 fur-ther refined these estimates by modelling the association between all-cause mortal-ity in children aged less than 5 years and the proportion of deaths attributable to acute respiratory infection. Results revealed that between one-fifth and one-third of deaths in preschool children were due to or associated with acute respiratory infection. The 1993 World Development Report5 produced figures showing that acute respiratory infection caused 30% of all childhood deaths.
The increasing focus on the reduc-tion of child mortality arising from the Millennium Declaration and from
the Millennium Development Goal (MDG) 4 of “reducing by two-thirds, between 1990 and 2015, the under-five mortality rate”,6 has generated renewed interest in the development of more accurate assessments of the number of deaths in children aged less than 5 years by cause. Moreover, the moni-toring of the coverage of interventions to control these deaths has become crucial if MDG 4 is to be achieved; thus a more accurate establishment of the causes of deaths in children aged less than 5 years becomes crucial. In 2001, WHO established the Child Health Epidemiology Reference Group (CHERG) – a group of independent technical experts, to systematically review and improve data collection, methods and assumptions underlying the estimates of the distribution of the main causes of death for the year 2000. In this paper, we summarize the findings of this group on the morbidity and mor-tality burden of childhood pneumonia. We also provide new regional and coun-try pneumonia morbidity estimates for the year 2000, and review the current understanding of the distribution of the main etiological agents of pneumonia among children aged less than 5 years.
Search strategy and selection criteriaMost of the morbidity and mortality estimates in this paper are based on work published by CHERG’s pneumo-nia working group.7,8 As a first step, the group reviewed publications on child-hood pneumonia and created a database including more than 2200 sources of information. Further details on the literature search strategies, inclusion criteria, methods and models used for estimating pneumonia burden were published elsewhere.7–9 However, the results of the distribution of global pneumonia episodes by regions and countries with the prevalence of expo-sure to main risk factors have not yet been published. Thus, we present the details on methods and models used for estimating these disaggregated figures in Appendix A (available at: http://www.who.int/bulletin/volumes/86/5/07-048769/en/index.html).10–27
Incidence of clinical pneumoniaRudan et al.8 calculated and published the first global estimate of the incidence of clinical pneumonia in children aged
S U P P L E M E N T A R T I C L E
A Preliminary Study of Pneumonia EtiologyAmong Hospitalized Children in Kenya
Laura L. Hammitt,1,2 Sidi Kazungu,2 Susan C. Morpeth,2,3 Dustin G. Gibson,1 Benedict Mvera,2 Andrew J. Brent,2,4Salim Mwarumba,2 Clayton O. Onyango,2 Anne Bett,2 Donald O. Akech,2 David R. Murdoch,6,7 D. James Nokes,2,5 andJ. Anthony G. Scott2,3
1Department of International Health, International Vaccine Access Center, Johns Hopkins Bloomberg School of Public Health, Baltimore, Maryland;2KEMRI-Wellcome Trust Research Programme, Centre for Geographic Medicine–Coast, Kilifi, Kenya; 3Nuffield Department of Clinical Medicine,University of Oxford, 4Wellcome Trust Centre for Tropical Medicine, Imperial College London, and 5School of Life Sciences, University of Warwick,Coventry, United Kingdom; 6Department of Pathology, University of Otago, and 7Canterbury Health Laboratories, Christchurch, New Zealand
Background. Pneumonia is the leading cause of childhood death in the developing world. Higher-qualityetiological data are required to reduce this mortality burden.
Methods. We conducted a case-control study of pneumonia etiology among children aged 1–59 months inrural Kenya. Case patients were hospitalized with World Health Organization–defined severe pneumonia (SP) orvery severe pneumonia (VSP); controls were outpatient children without pneumonia. We collected blood forculture, induced sputum for culture and multiplex polymerase chain reaction (PCR), and obtained oropharyngealswab specimens for multiplex PCR from case patients, and serum for serology and nasopharyngeal swab specimensfor multiplex PCR from case patients and controls.
Results. Of 984 eligible case patients, 810 (84%) were enrolled in the study; 232 (29%) had VSP. Blood cultureswere positive in 52 of 749 case patients (7%). A predominant potential pathogen was identified in sputum culturein 70 of 417 case patients (17%). A respiratory virus was detected by PCR from nasopharyngeal swab specimens in486 of 805 case patients (60%) and 172 of 369 controls (47%). Only respiratory syncytial virus (RSV) showeda statistically significant association between virus detection in the nasopharynx and pneumonia hospitalization(odds ratio, 12.5; 95% confidence interval, 3.1–51.5). Among 257 case patients in whom all specimens (excludingserum specimens) were collected, bacteria were identified in 24 (9%), viruses in 137 (53%), mixed viral and bacterialinfection in 39 (15%), and no pathogen in 57 (22%); bacterial causes outnumbered viral causes when the resultsof the case-control analysis were considered.
Conclusions. A potential etiology was detected in .75% of children admitted with SP or VSP. Except forRSV, the case-control analysis did not detect an association between viral detection in the nasopharynx andhospitalization for pneumonia.
Pneumonia is a leading cause of childhood death in
sub-Saharan Africa [1, 2]. In anticipation of partici-
pating in the Pneumonia Etiology Research for Child
Health (PERCH) study to comprehensively assess the
etiology of childhood pneumonia, we conducted
a pilot case-control study of methods to determine
the etiology among infants and children with severe
pneumonia admitted to a rural Kenyan district hos-
pital. Lessons from the study were applied to the de-
sign of the larger multisite PERCH study.
METHODS
LocationThe study was conducted in Kilifi District, a rural
community on the Kenyan coast. Malaria is endemic
in the area, although transmission has been declining
[3]. Haemophilus influenzae type b conjugate vaccine
was introduced in 2001, and the coverage for 3 doses
is 88% at 12 months of age [4, 5]; pneumococcal con-
jugate vaccine had not been introduced at the time of
the study.
Correspondence: Laura Hammitt, MD, Department of International Health, JohnsHopkins Bloomberg School of Public Health, 621 N Washington St, Baltimore, MD21205 ([email protected]).
Clinical Infectious Diseases 2012;54(S2):S190–9! The Author 2012. Published by Oxford University Press on behalf of theInfectious Diseases Society of America. All rights reserved. For Permissions,please e-mail: [email protected]: 10.1093/cid/cir1071
S190 d CID 2012:54 (Suppl 2) d Hammitt et al
by guest on June 16, 2012http://cid.oxfordjournals.org/
Dow
nloaded from
ClinInfectDis.(2012)54(suppl2):S190-S199
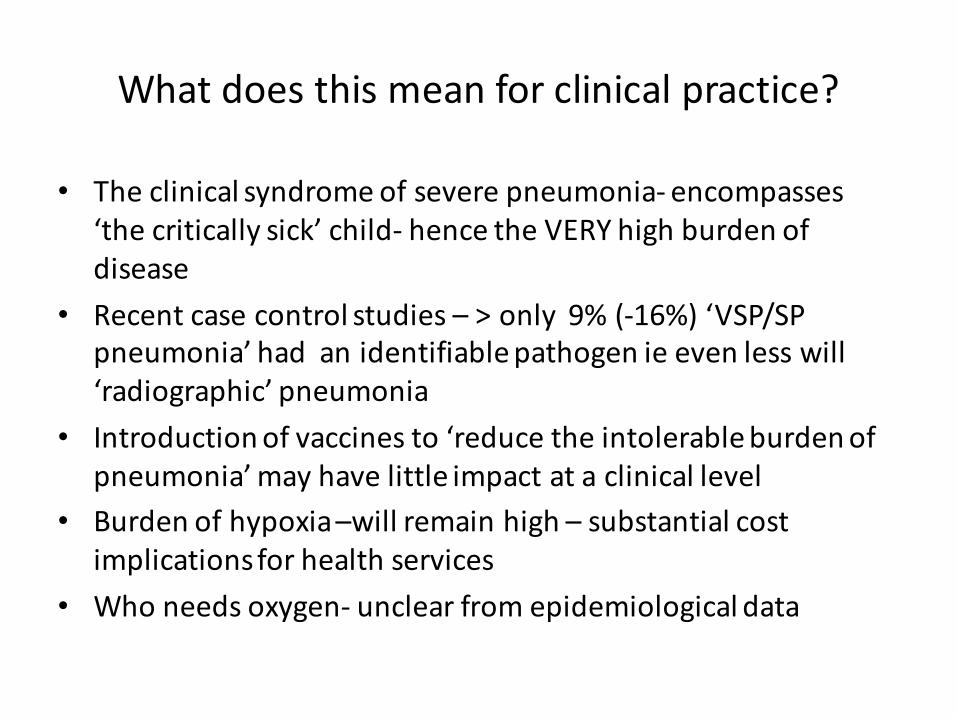
Whatdoesthismeanforclinicalpractice?
• Theclinicalsyndromeofseverepneumonia- encompasses‘thecriticallysick’child- hencetheVERYhighburdenofdisease
• Recentcasecontrolstudies– >only9%(-16%)‘VSP/SPpneumonia’hadanidentifiablepathogenieevenlesswill‘radiographic’pneumonia
• Introductionofvaccinesto‘reducetheintolerableburdenofpneumonia’mayhavelittleimpactataclinicallevel
• Burdenofhypoxia–willremainhigh– substantialcostimplicationsforhealthservices
• Whoneedsoxygen- unclearfromepidemiologicaldata

WHOworkinggroup

222 www.thelancet.com/infection Vol 9 April 2009
Review
Where studies classifi ed children as “severe or very severe pneumonia”, or used a defi nition equivalent to this severity classifi cation, these children were grouped as having very severe pneumonia. This meant that some children labelled as having very severe pneumonia for the purposes of this Review had less severe disease, leading to an underestimation of prevalence in this group. This was done to ensure that prevalence estimates are conservative and not overstated.
LimitationsWe made every eff ort to identify and exclude biased results, especially those that would over-estimate prevalence. We reduced publication bias (ie, bias towards publication of studies that report high prevalence) by systematically seeking unpublished data. The large amount of unpublished data is explained by the fact that, in recent years, many investigators have recorded SpO2 readings either as a component of composite secondary outcomes or as a baseline characteristic of populations studied. To standardise the populations between studies, we focused on studies employing WHO diagnostic criteria for pneumonia. We could not, however, control for diff erences in study design, data collection methodology, or, entirely, for case selection.
Heterogeneity was high between studies, and this made formal meta-analysis potentially misleading. The reasons for variations were several. Hypoxaemia prevalence was not the primary question of most of the published and unpublished studies. Also, the methodology of measuring oxygen saturation, the types of oximeters used, the setting in which oximetry was done (community or hospital-based measurements), and the level of training of health-care workers doing the measurements could not be standardised. Although we predefi ned SpO2 threshold of hypoxaemia, there remained variation in the threshold used in studies at high altitude. We made every eff ort to ensure that the quality criteria for published and unpublished data were similar, and although it is possible, we do not believe that publication bias was a major confounder.
ResultsFigure 1 shows the number of studies that were included and the reasons for exclusion. The search of the published literature yielded 27 papers comprising 26 cohort analyses and one systematic review, which was excluded. Another 14 studies did not fi t all of the selection or quality criteria and were excluded. Four of these used a high defi nition of hypoxaemia21–24 and another fi ve studies of hypoxaemia had a sample size of less than 100 children.25–29 For one study, there was a strong possibility of selection for a more severely ill subgroup of children with pneumonia seen by a consultant paediatrician.30 In total, four studies reported a pooled prevalence for multiple diagnoses. This included one study that systematically underestimated the prevalence of hypoxaemia by reporting a prevalence for a population that included a control group of children with fever and rhinorrhoea, but not other respiratory symptoms.31 One study reported a pooled prevalence for all acute respiratory infections, including upper respiratory infections.6 Two studies of young infants were also excluded: one reported a pooled prevalence for both infants and neonates with any condition,32 and the other used hypoxaemia to defi ne severe illness but did not report its prevalence.33
The search for unpublished data yielded 16 separate data sets, 12 of which contained suffi cient data and fulfi lled the study criteria. Four data sets were excluded for reasons outlined in fi gure 1.
Therefore, there were 12 published and 12 unpublished data sets included in this Review. Some studies reported prevalence in more than one condition and in diff erent age groups, such that four of the fi ve studies of prevalence in non-ALRI conditions and two of the four studies of prevalence in neonatal illness also looked at hypoxaemia in pneumonia or ALRI. The webappendix summarises the 21 data sets that reported prevalence in pneumonia and ALRI.
Meta-analysis by subgroups of pneumonia severity revealed a high degree of heterogeneity between studies (I²=79% for non-severe pneumonia, 95% for severe
Non-severeAshraf et al (b)*Basnet et al34
Brent et al35*Mwaniki et al*Nadjm et al*Nokes et al*Singhi et al36
SevereAshraf et al (a)*Ashraf et al (b)*Basnet et al34
Fu et al37
Mwaniki et al*Nadjm et al*Nokes et al*Singhi et al36
Very severeAshraf et al (a)*Ashraf et al (b)*Basnet et al34
Bose et al*Brent et al*Brooks et al*Djelantik et al38*Mwaniki et al*Nadjm et al*Nokes et al*Singhi et al36
Wandi et al14
01300
00000
00
130000000
00
130000000000
1600
BangladeshNepalKenyaTanzaniaKenyaKenyaIndia
BangladeshBangladeshNepalMulticountryKenyaTanzaniaKenyaIndia
BangladeshBangladeshNepalIndiaKenyaBangladeshIndonesiaKenyaTanzaniaKenyaIndiaPapua New Guinea
1·82 (0·05–9·72)17·14 (10·49–25·73)
0·69 (0·02–3·78)2·01 (1·10–3·35)0·44 (0·12–1·13)1·35 (0·62–2·54)3·56 (1·55–6·89)
11·11 (7·01–16·48)9·33 (6·29–13·21)
80·00 (59·30–93·17)9·49 (7·60–11·67)6·88 (5·87–8·00)8·11 (5·09–12·13)3·69 (1·92–6·36)
25·98 (21·34–31·06)
19·35 (10·42–31·37)58·33 (27·67–84–83
100·00 (83·16–100·00)18·67 (14·42–23·54)6·35 (2·78–12·13)
13·70 (9·84–18·39)37·53 (36·08–38·99)11·52 (10·30–12·83)
8·54 (6·11–11·53)13·33 (1·66–40·46)73·81 (65·23–81·24)54·50 (50·34–58·61)
Altitude (m) Location Prevalence (95% CI)
0 20 40 60 80 100
Figure 2: Hypoxaemia prevalence in WHO non-severe, severe, and very severe pneumoniaStudies which included children with severe or very severe pneumonia were groups as very severe to avoid over-estimation of prevalence. *Unpublished data. †Fu et al studied nine diff erent sites, seven of which were at sea level. ‡Wandi et al studied fi ve sites, but 90% of children were recruited from high altitude locations.
See Online for webappendixFrequencyofhypoxia– ‘pneumoniasyndromes’
Subhi LancetID2009
<5%
5-10%
10-40%

OperationalUtility:hypoxiaandWHOpneumoniadefinitions
265Bull World Health Organ 2009;87:263–270 | doi:10.2471/BLT.07.049148
ResearchEmergency triage for hypoxaemia in Kenyan childrenMichael K Mwaniki et al.
death (age-adjusted risk ratio, RR: 4.5; 95% confidence interval, CI: 3.8–5.3).
Very severe pneumonia syndromeOf the children admitted, 2525 (19%) satisfied the WHO criteria for very severe pneumonia: 291 (12%) of these children were hypoxaemic and 287 (11%) died. The final diagnoses in-cluded severe malaria (1268, or 50%), LRTI (514, or 20%), gastroenteritis (185, 7%), acute febrile convulsion of unknown cause (without malaria, meningitis or epilepsy) (181, or 7%), malnutrition (173, or 7%), meningitis (75, or 3%) and severe anaemia (56, or 2%). In 86 (3%) children, both malaria and LRTI were present. Of the 291 hypoxaemic children, 119 (41%) had a final diagnosis of malaria and 82 (28%), of LRTI. The case fatality rate among hypoxaemic children was 30% (89/291).
Severe pneumonia syndromeOf the children admitted, 2267 (17%) satisfied the WHO criteria for severe pneumonia, 156 (7%) were hypoxaemic and 107 (5%) died. The final diagnoses included LRTI (1654, or 73%), malaria (349, or 15%), malnutrition (180, or 8%), gastroenteritis (49, or 2%) and severe anaemia (43, or 2%). A further 155 (7%) children had both malaria and LRTI. Of the 156 hypoxaemic children, 113 (72%) had a final diagno-sis of LRTI and 18 (12%), of malaria. The case fatality rate was 16% (25/156) among children who were hypoxaemic.
Pneumonia syndromeOf the children admitted, 697 (5%) satisfied the WHO criteria for pneu-monia, and of this group, 14 (2%) were hypoxaemic and 33 (5%) died. Frequent final diagnoses among these children were malaria (245, or 35%), LRTI (197, or 28%), malnutrition (93, or 13%), gastroenteritis (76, or 11%) and severe anaemia (26, or 4%). Of the 14 hypoxaemic children, 8 (57%) had a final diagnosis of malaria and 4 (29%), of LRTI. The case fatality rate was 21% (3/14) among children who were hypoxaemic.
Overall, 461 of 693 (67%) hypox-aemic children who were admitted met the clinical criteria for one of the WHO pneumonia syndromes, and 215 of 693 (31%) of the hypoxaemic children admitted had a final discharge diagnosis of LRTI (Fig. 1).
Fig. 1. Distribution of LRTI and hypoxaemic cases across the WHO “pneumonia” syndromes
“very severe”2525
WHO“pneumonia syndromes”
Final dischargediagnosis
LRTI514
Admissions13 183
Others2011
Hypoxaemic82 (16%)
Hypoxaemic209 (10%)
“severe”2267
LRTI1654
Others613
Hypoxaemic113 (7%)
Hypoxaemic43 (7%)
“pneumonia”697
LRTI197
Others500
Hypoxaemic4 (2%)
Hypoxaemic10 (2%)
“no pneumonia”7694
LRTI480
Others7214
Hypoxaemic16 (3%)
Hypoxaemic216 (3%)
LRTI, lower respiratory tract infection.
Admissions aged 7–59 daysOf the 991 children aged 7–59 days who were admitted (57% males) 78 (8%) were hypoxaemic and 82 (8%) died. The main final diagnoses were neo-natal sepsis (497, or 50%); LRTI (301, or 30%) and neonatal jaundice (37, or 4%). Of the hypoxaemic children, 37 (47%) had a final diagnosis of LRTI and 25 (32%), of neonatal sepsis. Among 78 hypoxaemic children, 22 (28%) died. Hypoxaemic children had higher mortality (age-adjusted RR: 4.3; 95% CI: 2.8–6.6).
Admissions in the first week of lifeOf 1105 children (58% males) admit-ted during the first week of life, 206 (19%) were hypoxaemic on admission, and 336 (30%) died. Common final diagnoses were neonatal sepsis (600, or 54%); prematurity (216, or 20%); birth asphyxia (153, or 14%) and uncomplicated neonatal jaundice 98 (9%). Among those with hypoxaemia, neonatal sepsis (80, or 39%), birth asphyxia (62, or 30%), prematurity (49, or 24%) and neonatal jaundice (7, or 3%) were common. Among 206
children admitted with hypoxaemia, 118 (57%) died. This represented 35% of all deaths. Hypoxaemia was associated with inpatient death (age-adjusted RR: 2.4; 95% CI: 2.0–2.8).
Clinical indicators of hypoxaemiaAdmissions aged * 60 daysClinical signs that appeared predictive on univariate analysis (LR * 2.0 or ) 0.5) were lower chest wall indrawing, nasal flaring, central cyanosis, irregular breathing, deep breathing, stridor, auscultatory crackles, dullness on per-cussion, respiratory rate * 60 breaths per min, weak pulse volume, delayed capillary refill (* 3 s), heart rate < 80 beats per min, impaired conscious-ness with a Blantyre coma scale < 3, prostration, convulsion on admission, restlessness and hypothermia (Table A1 in Appendix A, available at: http://www.kemri-wellcome.org/images/appendixa.pdf ). On multivariate analysis within each group, central cyanosis, heart rate < 80 beats per min, irregular breathing, impaired consciousness with a Blantyre coma scale < 3, respiratory rate * 60 breaths per min, delayed capillary refill
Applying‘clinicaldefinitions’to~13,000unselectedpaediatricadmissions:ü36%ofalladmissionswereclassifiedaseitherVSP/SP
üNon-specificforpneumoniaüFinaldiagnosisagrees20%VSP&72%SP
üOnly195/2168(9%)VSP/SPhadhypoxia(<90%)
üHiddenburdenofhypoxia
Mwaniki/BerkleyCID2008

Canclinicalsignspredicthypoxia?
266 Bull World Health Organ 2009;87:263–270 | doi:10.2471/BLT.07.049148
ResearchEmergency triage for hypoxaemia in Kenyan children Michael K Mwaniki et al.
(* 3 s) and weak pulse volume remained predictive of hypoxaemia (Table A2 in Appendix A).
The overall sensitivity and specific-ity of these signs in the validation data set are shown in (Table 1). Although lower chest wall indrawing did not meet our criteria as a useful predictor when included with other signs in the respira-tory group, we re-tested it with the final list of predictive signs because it is easy to recognize clinically and WHO rec-ommends it as an indication for oxygen therapy when severe. Although includ-ing lower chest wall indrawing improved sensitivity, significant specificity was lost (Table 1). The area under the ROC curve of these signs in the validation set was 0.80 (95% CI: 0.77–0.84) overall, 0.77 (95% CI: 0.73–0.82) among chil-dren who fulfilled the clinical criteria for a pneumonia syndrome, and 0.81 (95% CI: 0.75–0.89) among children who did not fulfil them.
Admissions aged 7–59 daysThe clinical signs that appeared predic-tive on univariate analysis were cya-nosis, irregular breathing, nasal flaring, crackles on auscultation, respiratory rate > 80 per min, weak pulse, delayed capillary refill (* 3 s), heart rate < 100 beats per min, absent cry, unrespon-siveness to painful stimuli, convulsions
Table 1. Performance of clinical predictors of hypoxaemia in children * 60 days of agea admitted to Kilifi District Hospital, Kenya
Clinical signs No. with sign
No. without sign
True positives
False positives
True negatives
False negatives
Sensitiv-ity, %
Specific-ity, %
PPV, % NPV, %
Cyanosis, heart rate < 80 beats/min or irregular breathing
110 3733 30 80 3583 148 17 98 27 96
Capillary refill * 3 seconds, weak pulse, or any of the signs listed above in this column
413 3430 62 351 3314 116 35 90 15 97
Respiratory rate > 60 breaths/min or any of the signs listed above in this column
643 3200 89 554 3111 89 50 85 14 97
Impaired consciousness (BCS < 3), or any of the signs listed above in this column
772 3071 113 659 3006 65 64 82 15 98
Lower chest wall indrawing, or any of the signs listed above in this column
1410 2433 151 1259 2406 27 89 67 11 99
BCS, Blantyre coma scale; NPV, negative predictive value; PPV, positive predictive value.a n = 3843; 178 (4.6%) of the children admitted were hypoxaemic.
present on admission, restlessness, a bulging fontanelle and axillary tempera-ture < 36°C (Table A3 in Appendix A). Cyanosis, heart rate < 100 beats per min, respiratory rate > 80 breaths per min, irregular breathing, unresponsive-ness to painful stimuli, restlessness, in-ability to breastfeed and delayed capillary refill (* 3 s) remained predictive after controlling for other signs (Table A4 in Appendix A). For the reasons given above, we also re-tested lower chest wall indrawing in the final list of signs. The sensitivity and specificity of the signs are shown in Table 2. The area under the ROC curve for the prospective validation data set was 0.77 (95% CI: 0.71–0.84).
Admissions the first week of lifeIn this group of children, predictive signs on univariate analysis were cyano-sis, irregular breathing, deep breathing, respiratory rate > 80 breaths per min, auscultatory crackles, indrawing, nasal flaring, heart rate < 100 beats per min, weak pulse, delayed capillary refill (* 3 s), absent cry, unresponsiveness to painful stimuli, history of birth asphyxia and birth trauma (Table A5 in Appendix A). Signs that remained significantly associated on multivariate analysis were cyanosis, heart rate < 100 beats per min, irregular breathing,
absent cry, unresponsiveness to painful stimuli, respiratory rate > 80 breaths per min, history of birth asphyxia, de-layed capillary refill (* 3 s) and inability to breastfeed (Table A6 in Appendix A). The sensitivity and specificity of the signs are shown in (Table 3). For these signs, the area under the ROC in the validation set was 0.76 (95% CI: 0.72–0.81).
DiscussionMost studies of the prevalence and clini-cal signs of hypoxaemia have focused on children with LRTI. We therefore chose to examine unselected paediatric admissions. Hypoxaemia was present in 5%–19% of all children admitted to a Kenyan district hospital, depending on age, and this concurs with recent data from the Gambia.19 Although two-thirds of hypoxaemic children aged * 60 days presented with one of the clinical syndromes of pneumonia, only one-third had a final diagnosis of LRTI. Most children meeting the WHO criteria for very severe pneumonia were finally diagnosed with severe illnesses other than LRTI, most commonly severe malaria or shock. Children who have metabolic acidosis in severe ma-laria may present with respiratory dis-tress (Kussmaul’s respiration) and could thus overlap with the syndrome of very
ü Mostclinicalsigns- non-specificforpneumoniao Impairedconsciousnesso Shock
ü PPVforhypoxiaverypoor


Practicalitiesofdeliveringoxygen

Intheory
20
MODULE TWO - AIRWAY AND BREATHING
GIVE OXYGEN
For all children who have any problem with their airwayor breathing, always give oxygen first, while you continueto assess for other problems. Central cyanosis is a sign ofdeficient oxygenation (desaturation) and these childrenneed oxygen urgently; however, children who are anaemicand desaturated may not show cyanosis, but also needoxygen. Many children with severe respiratory distress andwith shock are also desaturated or not delivering enoughoxygen to the brain and other vital organs and will benefitfrom oxygen treatment.
Sources of oxygen to treat hypoxaemia
There are two possible sources of oxygen: oxygenconcentrators (see Figure 16) and oxygen-filled cylinders(see Figure 17):
Oxygen concentrators work by pumping roomair through a zeolite canister to remove nitrogen,thus concentrating the oxygen. The device is ofmoderate cost, requires little maintenance, and,once purchased, produces oxygen continuously atlow cost. A continuous electrical supply isrequired, however, to operate the pump.
Oxygen cylinders are easy to use, requiring onlya flow meter and appropriate tubing, and canoperate even when there is no electrical supply.The oxygen in cylinders is, however, relativelyexpensive and maintaining a constant supply isoften difficult, especially at peripheral hospitalsand health centres.
Depending on the availability or possibility of introductionat your health facility, you will be demonstrated one orboth during the course.
Figure 16
Oxygen concentrator
Figure 17
Oxygen cylinder
Figure 15
Inserting an oropharyngeal airway in an older child
concave side up turning it around
ETATlearnersguide….
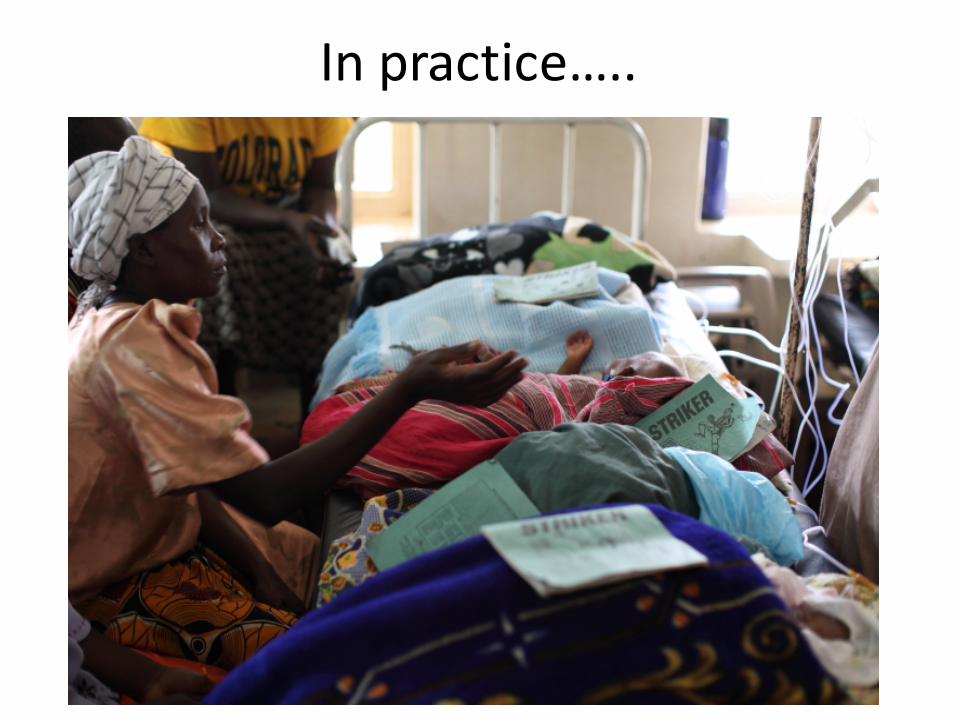
Inpractice…..

Intheory….
• Costprohibitive• Singlesourcewithina
country• Stockouts• Cylinders/gaugesoftenleak

Intheory……..
• Oftentheonlysource• Usuallydonorfunded• Longevity• Problemsinsuitainabledeliveryduetounreliableelectricity

Oxygen concentrator Oxygen Octopus

“ButProf…theyareallstillalive!’’

CurrentstateofequipoiseonOxygenTherapy:criticalcare

UCH,LondonXtremeEverest2Group


FromGrocottandMartin

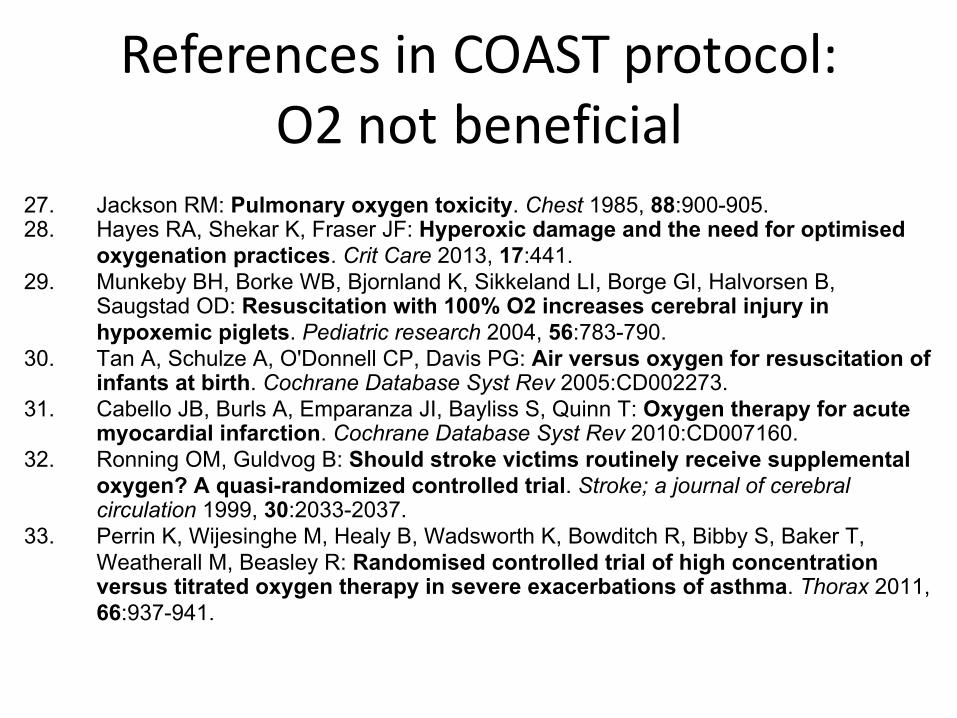
27. Jackson RM: Pulmonary oxygen toxicity. Chest 1985, 88:900-905. 28. Hayes RA, Shekar K, Fraser JF: Hyperoxic damage and the need for optimised
oxygenation practices. Crit Care 2013, 17:441. 29. Munkeby BH, Borke WB, Bjornland K, Sikkeland LI, Borge GI, Halvorsen B,
Saugstad OD: Resuscitation with 100% O2 increases cerebral injury in hypoxemic piglets. Pediatric research 2004, 56:783-790.
30. Tan A, Schulze A, O'Donnell CP, Davis PG: Air versus oxygen for resuscitation of infants at birth. Cochrane Database Syst Rev 2005:CD002273.
31. Cabello JB, Burls A, Emparanza JI, Bayliss S, Quinn T: Oxygen therapy for acute myocardial infarction. Cochrane Database Syst Rev 2010:CD007160.
32. Ronning OM, Guldvog B: Should stroke victims routinely receive supplemental oxygen? A quasi-randomized controlled trial. Stroke; a journal of cerebral circulation 1999, 30:2033-2037.
33. Perrin K, Wijesinghe M, Healy B, Wadsworth K, Bowditch R, Bibby S, Baker T, Weatherall M, Beasley R: Randomised controlled trial of high concentration versus titrated oxygen therapy in severe exacerbations of asthma. Thorax 2011, 66:937-941.
ReferencesinCOASTprotocol:O2notbeneficial

Recenttrials

Trialflow:treatmentfailure

AccompanyingEditorial
Shann,Lancet2015

DMC: decisiontostoptheFEASTtrial
Toddetal,WhenenoughisenoughTrials2013
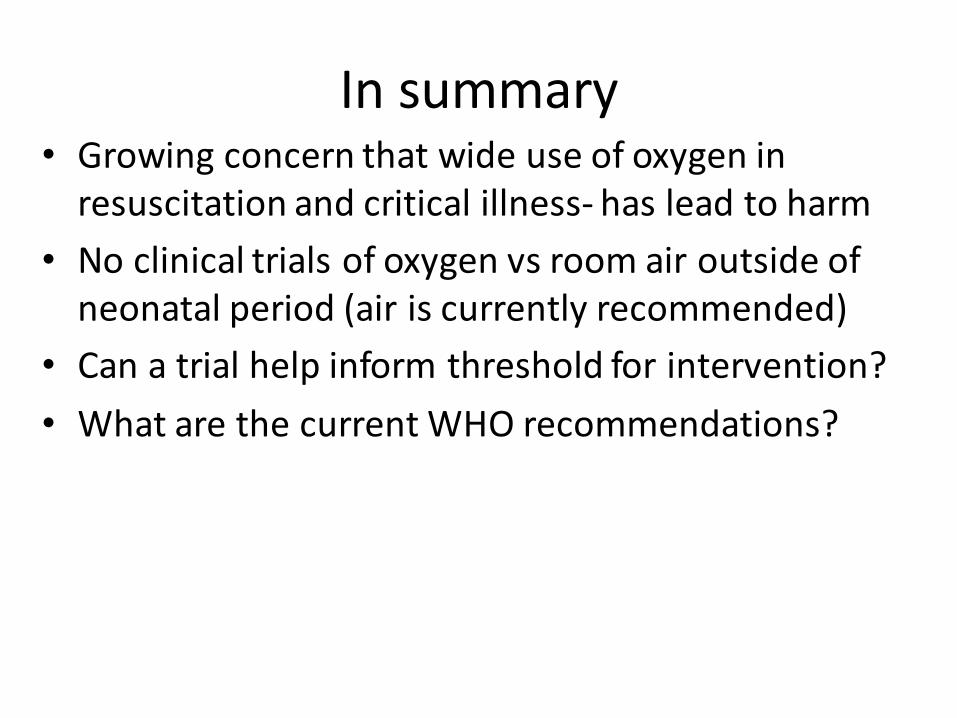
Insummary• Growingconcernthatwideuseofoxygeninresuscitationandcriticalillness- hasleadtoharm
• Noclinicaltrialsofoxygenvsroomairoutsideofneonatalperiod(airiscurrentlyrecommended)
• Canatrialhelpinformthresholdforintervention?• WhatarethecurrentWHOrecommendations?
Evidencefortechnicalupdateofpocketbookrecommendations
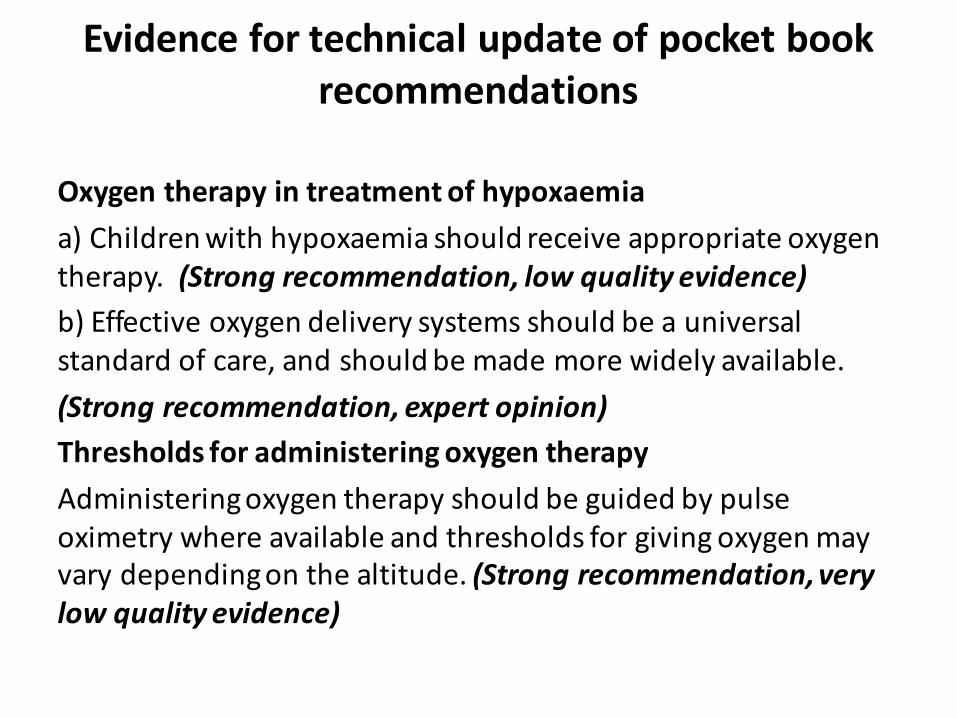
Oxygentherapyintreatmentofhypoxaemiaa)Childrenwithhypoxaemiashouldreceiveappropriateoxygentherapy. (Strongrecommendation,lowqualityevidence)b)Effectiveoxygendeliverysystemsshouldbeauniversalstandardofcare,andshouldbemademorewidelyavailable.(Strongrecommendation,expertopinion)ThresholdsforadministeringoxygentherapyAdministeringoxygentherapyshouldbeguidedbypulseoximetrywhereavailableandthresholdsforgivingoxygenmayvarydependingonthealtitude.(Strongrecommendation,verylowqualityevidence)

Whatarethekeyissues?
• Provisionofoxygen- notpriorisitised• Poorlytargeted- usuallyclinicalcriteria• Pneumoniadefinitions:verynon- specific• Useofpulseoximetersnotimplemented• O2 alonewontprevent‘ventilatory’ failurewherethisisnoICU
• Oxygenis‘adrug’:emergingdataofharmfuleffects• Clinicalpathophysiologicaldata• Numberoftrials– nolongerrecommendoxygen

ResearchAgenda
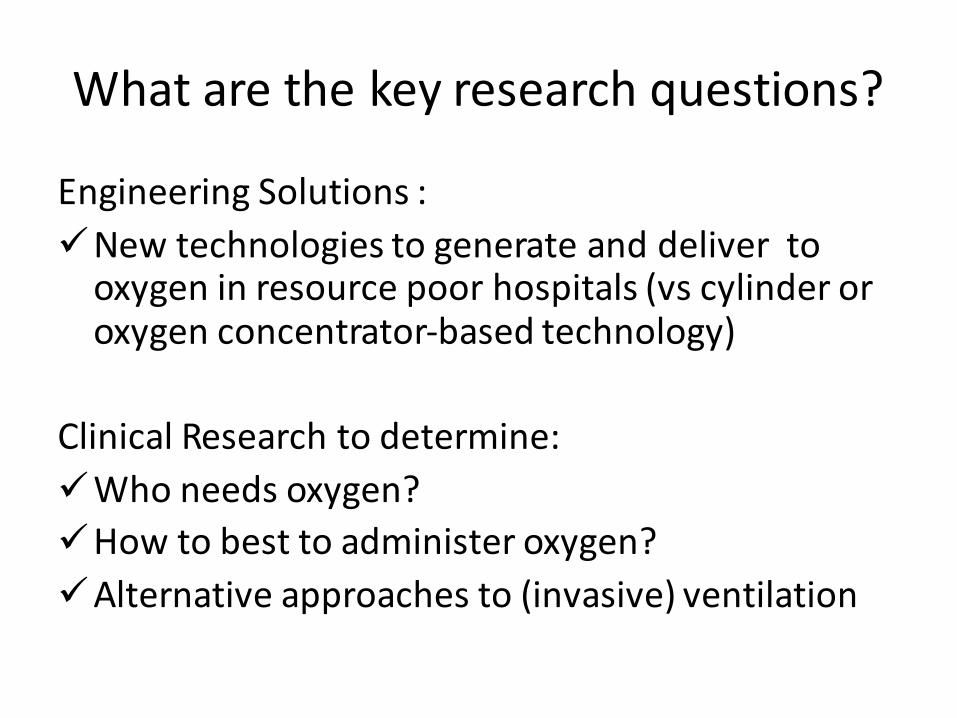
Whatarethekeyresearchquestions?
EngineeringSolutions:üNewtechnologiestogenerateanddelivertooxygeninresourcepoorhospitals(vs cylinderoroxygenconcentrator-basedtechnology)
ClinicalResearchtodetermine:üWhoneedsoxygen?üHowtobesttoadministeroxygen?üAlternativeapproachesto(invasive)ventilation

Children’sOxygenAdministrationStrategiesTrial
!
!
!
Executive!Committee!Call!–!June! !Monday!18!June!2012,!7:00<8:00!am!BST! !! !!AGENDA!!
!
1) Minutes!from!previous!call!and!action!points!2) Update!3) Update!on!Annecy!–!final!agenda!4) EU!update!post!Amsterdam!meeting!5) Website!and!membership!policy!6) Other!governance!documents!7) Feedback!from!WGs!regarding!overlap!of!
work!to!feed!into!strategy!!
< Jeremy!or!Gail!< Jeremy!< Gail!and!Kajsa!< Menno/Reg.Eu.!< Gail!and!Kajsa!< Gail!and!Kajsa!< Gail!
! !Teleconference!call!numbers:!!
!
Australia! 1!800!256!758!Canada! 1!866!220!6419!France! 0800!945186!Germany! 0800!101!2079!Hong!Kong! 800!901!858!Mexico! 00!1!866!966!2951!Netherlands! 0!800!022!9107!Spain! 900!801394!UK! 0808!109!5625!US! 1!877!420!0272!Bangladesh,!Kenya!&!Vietnam! +44!208!322!2629!!Participant!PIN:!
!1504051� !
!
! !
5sites4300children2countriesKenyaUgandaDRCongo
JohnFraser,Brisbane
KathyRowan

Whatistheneedforatrial?• OxygenshouldanessentialcomponentoflifesupportinAfricanhospital
• Oxygendelivery– costly– andasaresultmanychildrendonotreceiveit
• Optimaloxygensaturationthresholdresultinginbenefit- yettobetestedinadequatelypoweredcontrolledtrials.
• Targeted non-invasiverespiratorysupportmaybeahighlycosteffectivemeansofimprovingoutcome

Predictingmortality:riskofdeathbySaO2 atadmission(n=36,036)Kilifiadmissiondatabase
E. George Graphs of oxygen saturation and mortality Sept 12 Page 3 of 3
The probability at different levels of mortality can also be estimated in the Kilifi Admissions dataset as oxygen saturation was recorded at admission. Due to missing data on time of discharge, only date of discharge will be used and 48 hour mortality estimated by using two calendar days from admission which will be a small over-estimate of 48 hours. The same model was used to estimate the predicted probability of death in this dataset but as there are much larger numbers the 95% confidence intervals are smaller. Figure 4: Overall predicted probably of mortality by level of oxygen saturation at admission for all children in the Kilifi Admissions dataset (n=36036)
0.0
5.1
.15
.2.2
5.3
.35
.4.4
5.5
.55
.6.6
5.7
.75
.8P
roba
bili
ty o
f de
ath
50 55 60 65 70 75 80 85 90 95 100Oxygen saturation (%)
Predicted probability of mortality 95% CI for predicted probability
Inflectionof risk~80%
WHOthreshold

FEASTcontrolarm:criticallysickchildren
E. George Graphs of oxygen saturation and mortality Sept 12 Page 1 of 3
Probability of mortality with varying levels of Oxygen Saturation.
The relationship between oxygen saturation at admission and mortality by 48 hours was examined using a fractional polynomial Logistic model restricted to those in the control arm of the FEAST trial and that had a baseline oxygen saturation measurement. As the oxygen saturation distribution has a large negative skew and as the fractional polynomial method can be influenced by large outliers, only values within the 1st to the 99th percentile of the oxygen saturation distribution were used. Values outside of the range 48 – 100 were excluded and so 30 measurements <48% were not used. Using Logistic regression on control arm data from FEAST to calculate the probability of mortality over the continuous exposure of oxygen saturation, the fractional polynomial method identified that oxygen saturation did not need to be transformed within the linear predictor The logistic univariate model includes oxygen saturation centred around its mean and uses 1007 observations. The 95% confidence intervals are very wide for lower values of oxygen saturation due to the low numbers of patients with these values recorded. Figure 1: Overall predicted probability of mortality by level of oxygen saturation at admission for those in the control arm of the FEAST trial.
0.0
5.1
.15
.2.2
5.3
.35
.4.4
5.5
.55
.6.6
5.7
.75
.8P
roba
bilit
y of
dea
th
50 55 60 65 70 75 80 85 90 95 100Oxygen saturation (%)
Predicted probability of mortality 95% CI for predicted probability

Arechildrenwithsevereanemiaathigherrisk?
E. George Graphs of oxygen saturation and mortality Sept 12 Page 2 of 3
Also of interest was the relationship between oxygen saturation and mortality at different levels of haemoglobin and whether the child was malaria positive. Thus a model was created including an interaction between oxygen saturation (modelled as described above) and the binary variable of anaemia (haemoglobin<5g/ml)/ no anaemia (haemoglobin≥5g/ml) or malaria (analysis plan definition) / no malaria. Figure 2: Predicted probability of mortality by level of oxygen saturation at admission and Anaemia status for those in the control arm of the FEAST trial (n=980)
0.0
5.1
.15
.2.2
5.3
.35
.4.4
5.5
.55
.6.6
5.7
.75
.8.8
5P
roba
bilit
y of
dea
th
50 55 60 65 70 75 80 85 90 95 100Oxygen saturation (%)
Predicted probability of death-Anaemia Predicted probability of death-No Anaemia
95% CI for Anaemia 95% CI for No Anaemia
Figure 3: Predicted probability of mortality by level of oxygen saturation at admission and Malaria status for those in the control arm of the FEAST trial (n=1003)
0.0
5.1
.15
.2.2
5.3
.35
.4.4
5.5
.55
.6.6
5.7
.75
.8.8
5P
roba
bilit
y of
dea
th
50 55 60 65 70 75 80 85 90 95 100Oxygen saturation (%)
Predicted probability of death-Malaria Predicted probability of death-No Malaria
95% CI for Malaria 95% CI for No Malaria
=Hb<5g/dl
=Hb>5g/dl

CantheHighflownasalcannula(HFNC)oxygendelivery avert
respiratoryfailure?
FischerPaykelAirVo2technology

POST:Paediatric OxygenationSTrategies study
• Pilotanddose-findingstudy-non-invasiverespiratorysupportstrategies
• Highflowair/oxygen:providephysiologicalandmechanisticdatatosupporttherationalforusingthisstrategy
• Efficacyatcorrectinghypoxia,improvingworkofbreathing(EITtechnology),
ElectricalImpedanceTomography

Hypothesestobetested
In4200 children>2monthswithrespiratorydistressandhypoxia(putativepneumonia)in5centreswhether:
•LiberaloxygenationforSaO2≥80%willdecreasemortality(at48hours&28days)Vsastrategythatincludespermissivehypoxia(routinecare);
•Useofhighflowoxygendeliverywilldecreasemortalityvslowflowoxygendelivery(routinecare).

Studystrata
Stratum1SevereHypoxia (saturations<80%)allocateparticipantstooneoftwomethodsofoxygendelivery:•highflowoxygendelivery•lowflow(usualpractice)oxygendelivery
Stratum2controlledtrial:(80-92%)willbeallocatedto:•permissivehypoxia(noimmediateoxygen):control•highflowoxygendelivery•lowflowoxygendelivery

SaO2
Stratum 2 N=2800
Permissive hypoxia
N=1400
Liberal oxygenation Low flow N=700
Stratum 1 N=1400
<80%
Children aged >2 months and <12 years with SaO2<92% and
respiratory distress
Primary outcome: 48 hour mortality
Follow-up to 28 days ̂
SaO2 assessed
after 10 mins
80-<92%
SaO2 ever <80%
No
≥92%
<92%
Yes
High flow*
N=700
Low flow
N=700
Low flow
<80%
Initial assessment
≥92%
Exclude
Liberal oxygenation High flow*
N=700
*Maximum of 48 hours
^Follow-up to 90 days for those with evidence of neurological sequelae at 28 days
80-<92%
Reassess up to 24 hours
post hospital admission
Childrencontinuallymonitoredand‘rescued’

Outcomes
• Primary: 48-hour mortality
• Secondary– 28-day mortality;timetohypoxiaresolution(SaO2≥92%)
– durationofrespiratorysupport(highflow/lowflow);
– respiratoryfailure
– neurocognitivesequelaeat28days.

Acceptabletoparents?

Timelines
• Approvals– ImperialCollege– Uganda– DRCpending– Kenya- CSCre-reviewJuly2016
• StartdateJanuary2017– Training,training,training– CRFanddatabasesetupOct2016
• FirstDCMinterimanalysisafter300patients


Technology:Localchallenges