
EMERGENCY DEPARTMENT DENTAL CARE IN ILLINOIS · PDF fileNTDC in Illinois EDs in the study...
32
Critical Analysis of Utilization of Emergency Departments for Non- Traumatic Dental Care in Illinois – Fiscal Years 2010 to 2014. University of Illinois School of Public Health Division of Community Health Sciences M. Van Kanegan
Transcript of EMERGENCY DEPARTMENT DENTAL CARE IN ILLINOIS · PDF fileNTDC in Illinois EDs in the study...

Critical Analysis of Utilization of Emergency Departments for Non-
Traumatic Dental Care in Illinois – Fiscal Years 2010 to 2014.
University of Illinois
School of Public Health
Division of Community Health Sciences
M. Van Kanegan

EMERGENCY DEPARTMENT DENTAL CARE IN ILLINOIS- 2010 to 2014. 2
Table of Contents
Abstract ........................................................................................................................... 3
Specific Aim .................................................................................................................... 4
Background and Significance .......................................................................................... 4
Methods .......................................................................................................................... 8
Findings ........................................................................................................................... 9
Utilization and Trends - Overall .................................................................................. 10
Utilization and Trends - Age Groups .......................................................................... 12
Utilization and Trends - Race/Ethnicity ...................................................................... 14
Utilization and Trends - Impact of SMART Act ........................................................... 14
Utilization and Trends - Primary Payer ...................................................................... 17
Financial Impact Analysis .............................................................................................. 19
Discussion ..................................................................................................................... 20
Limitations ..................................................................................................................... 27
References .................................................................................................................... 28

EMERGENCY DEPARTMENT DENTAL CARE IN ILLINOIS- 2010 to 2014. 3
Abstract
The use of emergency departments (ED) for preventable dental related health
conditions is a growing problem in the US. It leads to overcrowding in the ED, delay in
patient care, and adds cost to the health care system. For a five year period, 2010 to
2014, the author examined trends in age, race, ethnicity, and charges submitted to
primary payers such as Medicaid by Illinois emergency departments for non-traumatic
dental care (NTDC). Also examined was the impact on ED use during a two-year
period when Illinois SMART Act cuts severely curtailed access to basic dental services
for adult Medicaid enrollees. The FY2010 to FY2014 age-adjusted visit trend showed
year-to-year increases for the age groups 25 to 34, 35 to 49, 50 to 64 and 65 and older.
During the same years, the average NTDC ED visit charge increased from $795
FY2010 to $1215 FY2014 and total charges to primary payers increased from $54.5
million in 2010 to $93.2 million. The majority of the people who sought treatment for
NTDC in Illinois EDs in the study period were uninsured, or Medicaid enrollees and 18-
49 years of age. They accounted for 76.3% of the total $ 362,064,501 ED dental
charges, and 85.2% of total 362,245 ED dental visits. There was a statistically
significant impact of the SMART Act cuts on use of ED for NTDC. During the two year
period of SMART Act cuts (FY2013 and FY2014), the age-adjusted visits increased
from an annual average of 745 to 791 per 100,000 and the annual ED visit charges
increased from $62.3 million to $86.8 million. Analysis presented here illustrates that in
Illinois, a substantial amount of emergency department resources are utilized for the
care of non-traumatic dental visits and this has been a steadily increasing trend.

EMERGENCY DEPARTMENT DENTAL CARE IN ILLINOIS- 2010 to 2014. 4
Specific Aim
This brief seeks to characterize the types of services and groups that utilized the
emergency department (ED) as an access point for non-traumatic dental care (NTDC)
in Illinois. The author analyzed data reported in discharge summaries by all Illinois EDs
that provided a NTDC visit in the time period of July 1, 2009 to June 30, 2014. Trends
in ED visit, associated charges to the health care system and the impact on these
variables of a two-year cut to the basic oral health benefit under Medicaid were also
examined. These analyses can be used to understand the public health impact as a
result of current limitations in community based dental care. Additionally, this evaluation
can be used to plan state-level cost savings strategies that include instituting an
effective ED diversion program.
Background and Significance
Public health attention to oral health status remains inadequate as evidenced by
increasing use of emergency departments for dental conditions better suited to
treatment in dental office settings. Dental caries and periodontal disease are common
oral infections yet, are almost completely preventable with education, routine, effective
self-care and timely access to professional dental intervention. Key findings from the
2011-2012 National Health and Nutrition Examination Survey report that nearly 91% of
adults (ages 20 to 64) have had dental caries experience and 27% of adults 20 to 64
have untreated dental caries (Dye, Thornton-Evans, & Iafolla, 2015). Additionally, the
Centers for Disease Control and Prevention report 47.2% of adults age 30 and over
have active periodontal disease with prevalence increasing with age to 70.1% of adults
65 years and older with active periodontal disease (Eke, 2012).

EMERGENCY DEPARTMENT DENTAL CARE IN ILLINOIS- 2010 to 2014. 5
Important health disparities are evident by race, ethnicity and income. In general
low-income adults have a higher percentage of carious teeth and oral health disparities
exist for non-Hispanic blacks and Hispanics that further compound poor oral health
status of these groups (Oral Health in America: A Report of the Surgeon General,
2000). Adults ages 20-44 are the largest at-risk group for inadequate access to the
routine oral health care that can prevent and treat these common oral infections. Many
and varied reasons explain the low utilization for basic dental health services including
transitioning out of state mandated Medicaid benefits, new entry into workforce with
limited dental care benefits, and limited out-of-pocket funds (Yarbrough, Nasseh, &
Vujicic, 2014). Additionally, lack of conveniently located community dental clinics, lower
priority for oral health, and lack of understanding of disease processes are causing
simple and easily treatable conditions to progress to urgent issues (Davis, Deinard, &
Maiga, 2010). These problems compel many to seek dental treatment at their local
hospital emergency department.
EDs are a significant access point for services for those with limited health and
dental insurance or financial ability to pay for services in a community setting (National
Center for Health Statistics, 2013). Although ED visits for NTDC represent a small
percent of total ED visits (Okunseri, Okunseri, Xiang, Thorpe, & Szabo, 2012), several
recent reports chronicle a surge in numbers of ED visits, hospitalizations and deaths
where the root cause is of a dental origin (Florida Institute for Health Innovation;
National Center for Health Statistics, 2013; Seu, 2012). In their 2000-2008 retrospective
study, Shah et al report a 4.6% annual increase in hospitalizations where the primary
diagnosis was a preventable periapical abscess. In the 9 year study period, a total of
61,439 cases, primarily attributed to dental abscesses resulted in hospitalization, where

EMERGENCY DEPARTMENT DENTAL CARE IN ILLINOIS- 2010 to 2014. 6
the mean length of hospital stay was 2.96 days; the mean inflation adjusted hospital in-
patient charge per visit was $14,245 and total inflation adjusted charge for the study
period was $858.9 million. Tragically, during this period 66 patients with the root cause
of dental infection died in hospitals (Shah, Leong, & Lee, 2013). The human and
financial cost to this inadequate system of care is disastrous.
In 2009, the most recent year of available data, the national rate of ED visits due
to a preventable dental condition was reported as 305 per 100,000 and the cost of this
care was estimated to approach 2 billion dollars (Seu, 2012). In the Chicago metro
area, 77,000 emergency department visits, with the root cause of a preventable dental
disease, occurred between 2008 and 2011 (Pew Center on the States, 2012).
Unfortunately for the patient and the health care system, the ED can provide only limited
and palliative care as ED health providers may not have the training or equipment to
provide definitive treatment for the presenting dental problem (Cohen, 2013). As a
result, many individuals may make multiple return visits for the same issue or set of
problems (Davis, Deinard, & Maiga, 2010) incurring thousands or tens of thousands of
dollars in ED costs. These may have been avoided if provided with preventive or
definitive treatment at an earlier point in time through suitable access in a community
setting.
Nationally and in Illinois, support for adequate access to basic dental care
through publically funded programs is unstable and is based on changing political,
social and financial interest. When states are fiscally challenged, they try to save
expenditures by cutting non-mandated programs. This has been the case with the
Medicaid adult oral benefit in many states and in Illinois (Center for Health Care
Strategies, Inc., 2015). When basic dental services to Medicaid enrollees are cut,

EMERGENCY DEPARTMENT DENTAL CARE IN ILLINOIS- 2010 to 2014. 7
people may seek care through the emergency room, a place that is more expensive and
less able to provide definitive care for the presenting problem.
During the period July 1, 2009 to June 30, 2012, Illinois Medicaid covered basic
dental services for eligible adults including: comprehensive and urgent oral exam,
emergency treatment, dental fillings, full dentures, limited root canal treatment and other
essential services. Illinois experienced Medicaid oral health benefit cuts in 1995 and
again for a two year period beginning July 1, 2012 to June 30, 2014 when Illinois
implemented the Save Medicaid Access and Resources Together (SMART) Act. The
SMART Act, eliminated all but emergency dental services such as tooth extraction
(Illinois Department of Healthcare and Family Services, 2014).
A few states have recognized the complexities of this growing problem and the
need for definitive care solutions. Since emergency room physicians lack the resources
and the expertise to effectively manage dental conditions (Davis, Deinard, & Maiga,
2010), states are beginning to pilot innovative programs that direct referrals of selected
ED cases to dental school clinics, community clinics, foundation funded dental
residency programs, volunteer dental clinics, hospital oral and maxillofacial surgery
programs, and public-private programs. These pilot coordination programs are reported
to be very successful in connecting patients to care usually within hours, efficiently and
at a much reduced cost (American Dental Association, 2014; Aston, G, 2013; Kansans
Health Institute, 2013; McCormick, Abubaker, Laskin, & Gonzales, & Garland, 2013).
This study seeks to understand the use of Illinois EDs for preventable non-
traumatic dental concerns to ascertain ways to re-orient care for better individual and
community health outcomes.

EMERGENCY DEPARTMENT DENTAL CARE IN ILLINOIS- 2010 to 2014. 8
Methods
After the completion of a data user agreement with Illinois Department of Public
Health, Division of Patient Safety and Quality, existing state-wide hospital discharge
data for the period July 1, 2009 to June 30, 2014 were provided through a secure data
link. All Illinois hospitals except for Veteran’s Administration facilities report discharge
data to the Illinois Department of Public Health. The objectives of the study,
safeguarding of data and methods used were explained in detail in a proposal to the
University of Illinois - Chicago, Institutional Review Board. Approval of project was
obtained.
The data were tabulated in 12 month periods and described in fiscal years (FY)
so for example, FY 2010 is defined from July 1, 2009 to June 30th 2010, with each FY
defined in the same manner. The total emergency departments treat and release visits
[out-patient] were identified by: Visit for oral care is any visit having a non-traumatic oral
condition diagnoses and with the International Classifications of Diseases, Ninth Edition,
Clinical Modification code: 521, 522, 523, 525, 526.4, 526.5, 528, 529. Description of
these diagnostic codes is detailed in Table 1.
Data were analyzed for time trends with Data Analysis ToolPak in Microsoft
Excel 2010. Regression statistics and one-way analysis of variance (ANOVA) and
calculation of mean charges with standard error measurement were used examined to
trends in visits, by age group, primary payer, visit charges, race, ethnicity and changes
due to SMART Act. Statistical significance was set to p<0.05 and at 95% confidence
interval. Because the population of Illinois varies across age groups and may differ by
year, the visit data were age-adjusted. This way the rates are based on the same age
distribution in the time period of study and can be compared to each other without age

EMERGENCY DEPARTMENT DENTAL CARE IN ILLINOIS- 2010 to 2014. 9
confounding. The age adjustment calculation is done by multiplying the age-specific rate
by the age-specific weight using the 2000 US population as standard and adjusting to
18-24, 25-34, 35-49, 50-64 and 65+ age groups (Klein & Schoenborn, 2001).
Table 1. ICD-9 Codes used as definition of NTDC and General Description of Diagnosis
ICD-9 Codes Code Description 521 Diseases of hard tissues of teeth, including dental caries, erosion, and
unspecified disease
522 Diseases of pulp and periapical tissues
523 Gingival and Periodontal Diseases
525 Other diseases and conditions of the teeth and supporting structures
526.4 Inflammatory conditions of jaw
526.5 Alveolitis of Jaw
528 Diseases of the oral soft tissues, excluding lesions for gingiva
529 Disease of the tongue
For the financial impact analysis, the author used $224, the 2012 Medical
Expenditure Panel Survey national median cost for general dental visit for an adult
person <65 years of age with private dental insurance (Agency for Healthcare Research
and Quality, 2012). This was adjusted this to 2014 dollars using the BLS 2012 calculator
(Bureau of Labor Statistics).
Findings
In this brief the author analyzed ED data for FY 2010-2014 by age, payer, and
charges to understand use of the hospital ED as an access point for non-traumatic
dental care and to consider its public health implications. The figures and table
presented in this section will illustrate characteristics and trends of ED use and
associated costs to the health care system. An estimation of how much the state of
Illinois can save in charges by instituting an effective ED diversion system that relocates

EMERGENCY DEPARTMENT DENTAL CARE IN ILLINOIS- 2010 to 2014. 10
patients to definitive, cost-effective services in the community setting was also
calculated. All but one statistical calculation was significant at the 0.05 probability level
or better.
Utilization and Trends - Overall
The overall emergency department utilization and ED visit charge trend over the
five year period beginning FY 2010 are illustrated in Figures 1, 2 and 3. Taken
together, they demonstrate the statistically significant increase in total age-adjusted
visits, total outpatient charges, and the average charge per outpatient emergency
department visit. In the five fiscal years of data, both total charges and charge per visit
show an approximate 10% year over year increases and in FY 2014 alone, total
treatment charges for NTDC in the ED were $ 93,179,433.
Age-adjustment calculation utilized the direct method, adjusted to 2000 US standardized population for 18-24, 25-34, 35-49, 50-64 and 65+ age groups. Figure 1 shows that in 2010, there were 724 age-adjusted adult (>18 years of age) ED treat and release visits per 100,000 in population. This rate increased to age-adjusted 807visits per 100,000 in 2014. The R2 of the age-adjusted visit trend was 0.960; the analysis of variance (ANOVA) was a statistically significant for age-adjusted visit rate by year [F(1, 3), Fstat = 72.8, p<.05].
724
740
772 775
807
680
700
720
740
760
780
800
820
Nu
mb
er
of
Vis
tis
pe
r 1
00
,00
0
Year
Figure 1. Illinois Overall Age-Adjusted Adult ED Visit per 100,000 by Year, 2010-2014.
2010
2011
2012
2013
2014

EMERGENCY DEPARTMENT DENTAL CARE IN ILLINOIS- 2010 to 2014. 11
Figure 2 is the total outpatient ED charges for NTDC visits, which steadily increased from FY 2010 to 2014 rising from $54.5 million to $93.2 million in FY2014. The R2 of the charge trend was 0.991 and the analysis of variance (ANOVA) was a statistically significant [F(1, 3), Fstat = 353, p<.05].
Figure 3 shows that the average Illinois ED per visit charge also increased from $795 to $1,215 for FY 2010 to FY 2014 respectively. The R2 of the charge trend was 0.994 and the analysis of variance (ANOVA) was a statistically significant [F(1, 3), Fstat = 523, p<.05. Inflation adjusted to 2014 dollars, this represents a charge increase from $856 to $1215 per visit, a 41.9% increase in ED charges over the five year period.
2010 2011 2012 2013 2014
Total Charges $54,523,764 $62,495,768 $71,446,717 $80,418,820 $93,179,433
$0
$10,000,000
$20,000,000
$30,000,000
$40,000,000
$50,000,000
$60,000,000
$70,000,000
$80,000,000
$90,000,000
$100,000,000
Tota
l Ch
arn
ges
to P
rim
ary
Pay
er
Figure 2. Total Outpatient Dental Emergency Department Charges in Illinois Fiscal Years 2010-2014.
$795 $890
$975 $1,094
$1,215
$0
$200
$400
$600
$800
$1,000
$1,200
$1,400
2010 2011 2012 2013 2014
Ave
rage
Ch
arge
er
Vis
it
Year
Figure 3. Average Charge per Outpatient Dental Emergency Department visits in Illinois Fiscal Years 2010-
2014.

EMERGENCY DEPARTMENT DENTAL CARE IN ILLINOIS- 2010 to 2014. 12
Utilization and Trends - Age Groups
The five-year trends by age-group and by average charge per age group are
illustrated in Figures 4, 5 and 6. For age groups 25-34, 35-49, 50-64 and 65+, there is a
statistically significant increase in ED visits (p<0.05) in the time period under
investigation. Figures 4 and 5 also illustrate a sharp increase in ED utilization in the 25
to 34 year old age group in FY2014. There is a much lower but significant increase in
ED visit trends for the 50-64 age group (p<0.05) and 65 years and older age group
(p<0.05). For NTDC ED patients 65 and over, although they have the lowest visit rate,
Figure 6 shows that they have the highest average charge per visit.
Figure 4 shows the age adjusted ED visit trend by age group. The highest overall visit rates are for adults between the ages of 25 and 34 years [R2 = 0.76; F(1, 3), Fstat = 9.6, p<.05] followed very closely by adults between the ages of 35 and 49 [R2 = 0.955; F(1, 3), Fstat = 63.7, p<.05]. The figure also shows fewer overall ED visits for adults between the ages of 18 and 24, but the trend is not significant [R2 = 0.74; F(1, 3), Fstat = 8.6, p=0.06].
0
50
100
150
200
250
300
350
18-24Y0 25-34Y0 35-49Y0 50-64Y0 65Y0 +
Age
Ad
just
ed
rat
e p
er
10
0,0
00
Age Group
Figure 4. Illinois Age Adjusted ED Visit Rate per 100,000 by Age Group, 2010-2014.
20102011201220132014

EMERGENCY DEPARTMENT DENTAL CARE IN ILLINOIS- 2010 to 2014. 13
Figure 5 shows ED utilization by age group, by year. Note the surge in visit rate in 2014, in the 25 to 34 age group. Of the five years of data presented, 2014 shows the highest age-adjusted utilization for every age group except 18-24 year olds. The analysis of variance by ANOVA was a statistically significant for visit rate by age group by year [F(4, 20), Fstat = 199, p<.05].
Figure 6 depicts the average charge per visit by age group steadily increasing by fiscal year. In 2014, the highest ED charge per visit was in the 65 YO and older age group ($2,826) and lowest in the 18-25 YO ($946).
0
50
100
150
200
250
300
350
2010 2011 2012 2013 2014
Age
Ad
just
ed
rat
e p
er
10
0,0
00
Year
Figure 5. Illinois Age Adjusted Adult ED Visit Rate per 100,000 by Year and Age Group, 2010-2014.
18-24Y0
25-34Y0
35-49Y0
50-64Y0
65Y0 +
$0
$500
$1,000
$1,500
$2,000
$2,500
2010 2011 2012 2013 2014
Ave
rage
Ch
arge
pe
r V
isit
Figure 6. Average Charge per Illinois ED Visit per Age Group 2010 to 2014.
18-24 years
25-34 years
35-49 years
50-64 years
65 y and older
EMERGENCY DEPARTMENT DENTAL CARE IN ILLINOIS- 2010 to 2014. 14
Utilization and Trends - Race/Ethnicity
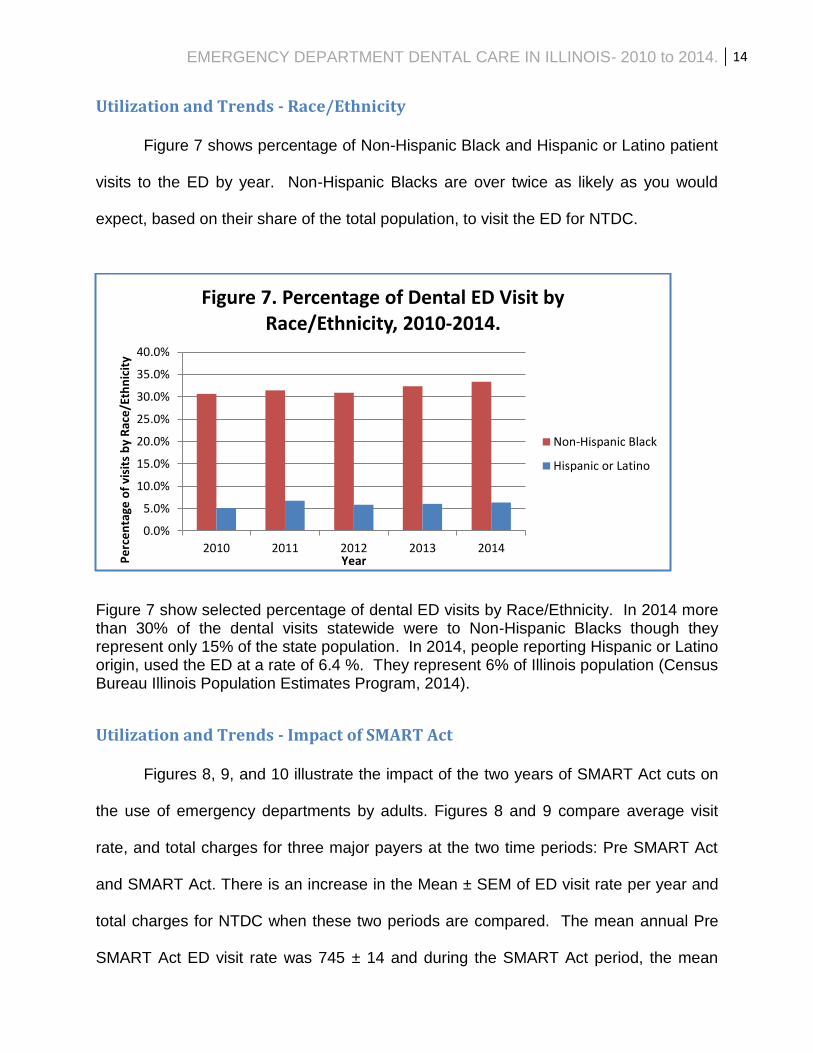
Figure 7 shows percentage of Non-Hispanic Black and Hispanic or Latino patient
visits to the ED by year. Non-Hispanic Blacks are over twice as likely as you would
expect, based on their share of the total population, to visit the ED for NTDC.
Figure 7 show selected percentage of dental ED visits by Race/Ethnicity. In 2014 more than 30% of the dental visits statewide were to Non-Hispanic Blacks though they represent only 15% of the state population. In 2014, people reporting Hispanic or Latino origin, used the ED at a rate of 6.4 %. They represent 6% of Illinois population (Census Bureau Illinois Population Estimates Program, 2014).
Utilization and Trends - Impact of SMART Act
Figures 8, 9, and 10 illustrate the impact of the two years of SMART Act cuts on
the use of emergency departments by adults. Figures 8 and 9 compare average visit
rate, and total charges for three major payers at the two time periods: Pre SMART Act
and SMART Act. There is an increase in the Mean ± SEM of ED visit rate per year and
total charges for NTDC when these two periods are compared. The mean annual Pre
SMART Act ED visit rate was 745 ± 14 and during the SMART Act period, the mean
0.0%
5.0%
10.0%
15.0%
20.0%
25.0%
30.0%
35.0%
40.0%
2010 2011 2012 2013 2014
Pe
rce
nta
ge o
f vi
sits
by
Rac
e/E
thn
icit
y
Year
Figure 7. Percentage of Dental ED Visit by Race/Ethnicity, 2010-2014.
Non-Hispanic Black
Hispanic or Latino

EMERGENCY DEPARTMENT DENTAL CARE IN ILLINOIS- 2010 to 2014. 15
annual visit rate was 791 ± 16. The Pre SMART Act ED mean annual charges were
$62.8M ± 4.8M and mean annual charge for the SMART Act period was $86.8M ± 6.4M.
Figure 10 shows the Mean ± SEM increase in each of the three major primary payers
(Medicare, Medicaid and Uninsured) as a result of SMART Act cuts.
Figure 8 is the age-adjusted visit rate before and during the cuts to the adult dental program under the SMART Act. The mean Pre SMART Act ED visit rate was 745 ± 14/per year and during the SMART Act period, the mean visit rate was 791 ± 16 per year. As can be seen in plot above (Mean ± SEM), there is an increase in the average visit per year in ED utilization during the SMART Act period.
745
791
680
700
720
740
760
780
800
820
Pre SMART Act - SMART Act
Age
-Ad
just
ed
Vis
its
pe
r 1
00
,00
0
Figure 8. Illinois Age-Adjusted Average Annual Visits/ 100,000 Pre and SMART Act Implementation, 2009-2012
and 2013-2014.
Pre SMART Act Visits
SMART Act Visits

EMERGENCY DEPARTMENT DENTAL CARE IN ILLINOIS- 2010 to 2014. 16
Figure 9 is the total annual ED visit charges Pre SMART Act and during the cuts to the adult dental program - SMART Act. The Pre SMART Act ED mean annual charges were $62.8M ± 4.8M and mean annual charge for the SMART Act period was $86.8M ± 6.4M.
Figure 10 is plot of Mean ± SEM in annual ED charges to the three major primary payers: Medicare, Medicaid and Uninsured for the two comparison time periods: Pre SMART Act and during the SMART Act.
$62,822,083
$86,799,127
$0
$10,000,000
$20,000,000
$30,000,000
$40,000,000
$50,000,000
$60,000,000
$70,000,000
$80,000,000
$90,000,000
$100,000,000
Pre SMART - SMART Act Time Period
Tota
l ED
Vis
it C
har
ges
Figure 9. Illinois Annual ED Visit Charges Pre SMART Act
2010-2012 and SMART Act Implementation 2013-2014.
Pre SMART Act ED Visit Charges
SMART Act ED Visit Charges
$0
$5,000,000
$10,000,000
$15,000,000
$20,000,000
$25,000,000
$30,000,000
$35,000,000
1
Tota
l ED
Vis
it C
har
ges
Figure 10. Illinois Pre SMART Act (2010-2012) and SMART Act (2013-2014) Average Annual ED Charges by Primary
Payer.
Pre SMART Medicare
SMART Medicare
Pre SMART Medicaid
SMART Medicaid
Pre SMART Uninsured
SMART Uninsured
Medicare Medicaid Uninsured

EMERGENCY DEPARTMENT DENTAL CARE IN ILLINOIS- 2010 to 2014. 17
Utilization and Trends - Primary Payer
Figure 11 shows the swings in primary payer for the five year study period. The
proportion of charges to each of the primary payer is stable for the first three years (pre-
SMART Act) and begins to show shifts from Medicaid to uninsured in FY2013, the first
year of SMART Act cuts. In 2014, the second year of the SMART Act cuts there was a
sharp increase in Medicaid as the primary payer with a corresponding sharp decrease
in the uninsured payer category. 2014 was the first year of Illinois Medicaid expansion
under the Affordable Care Act, for the last six months of the state fiscal year; more
uninsured patients were now covered under Medicaid, thus shifting primary payer from
uninsured to Medicaid. Figure 12 and Table 1 show the range of five year average per
visit charges by primary payer. The five-year overall average charge for treatment of
NTDC in the ED was $1,000 per visit.
Figure 11 describes the proportion of emergency department charges by primary payer for each of the year of the study. The potential payments from Medicaid and un-insured are two primary sources of charges to EDs and account for over 60% of the ED charges overall.
19.9%
20.4%
20.7%
18.6%
21.5%
34.1%
33.6%
32.2%
31.2%
35.7%
11.4%
12.3%
13.1%
14.7%
15.3%
4.1%
4.6%
3.7%
4.8%
3.3%
30.5%
29.2%
30.3%
30.8%
24.2%
2010
2011
2012
2013
2014
0% 20% 40% 60% 80% 100%
Ye
ar
Figure 11. Proportion of Dental Emergency Department Charges by Primary Payer in Illinois, 2010-2014.
Commercial
Medicaid
Medicare
Other
Uninsured

EMERGENCY DEPARTMENT DENTAL CARE IN ILLINOIS- 2010 to 2014. 18
Figure 12 shows the average charge by primary payer, per visit in the ED over the five year period. There a large range in average charges to each of the primary payers; they range from $881 for un-insured visits to $1,570 where the primary payer is Medicare.
Table 2. Average Charge per Capita in Outpatient Emergency Department Dental Charge by Primary Payer/Enrollee Type in Illinois
for Fiscal Year Time Period 2010-2014.
Primary Payer Total Charges 2010 to 2014 # of Visits in 2010 to 2014 Average Charge per Visit
2010 to 2014
Medicare $49,320,506 31,418 $1,570
Medicaid $120,857,731 144,120 $839
Commercial + HMO $76,093,531 56,344 $1,351
Un-insured $103,909,178 117,977 $881
Other $10,624,759 11,528 $922
Self-Administered $1,258,796 858 $1,467
Total $362,064,501 362,245 $1,000
Table 1 lists the five year charges, visits and average outpatient ED charges by Primary Payer/ Enrollee Type. During this period, a total of $362,064,501 was charged out for preventable, non-traumatic oral disease conditions attended to in the hospital ED with an overall average charge per visit of $1,000.
$1,570
$839
$1,351
$881 $922
$0
$200
$400
$600
$800
$1,000
$1,200
$1,400
$1,600
$1,800
Ave
rage
Ch
arge
pe
r vi
sit
20
10
to
20
13
.
Medicare Medicaid Commercial + HMO Un-insured Other
Figure 12. Average Charge per Visit in Outpatient Dental Emergency Department by Primary Payer/Enrollee Type in
Illinois, 2010-2014.

EMERGENCY DEPARTMENT DENTAL CARE IN ILLINOIS- 2010 to 2014. 19
Financial Impact Analysis Based on data from the 2012 Medical Expenditure Panel Survey (MEPS), the
national median cost of a general dental visit for a person with private dental insurance
was $224 (Agency for Healthcare Research and Quality, 2012). Adjusting to 2014
dollars, the median national cost of a general dental visit would be $230.97 (Bureau of
Labor Statistics). In just FY 2014, 32,859 Medicaid visits for preventable, non-traumatic
dental related conditions were provided in Illinois ED settings, where the visit average
charge for Medicaid enrollee was $1,011 and the total charge to Illinois Medicaid was
$33,256,845.
In an effort to understand the true nature and severity of NTDC visits presenting
to the ED and if any can be re-routed, Wall (2014) analyzed characteristics of ED visits
of a national data set by triage category, time of arrival for the patient facing an urgent
dental visit and community dental provider workforce schedule. These variables were
used to calculate percent of ED visits that are likely to divert, have potential to divert and
not likely to divert. Wall estimates that nationally, up to 78.6 percent of dental ED visits
can be diverted to a local dental office. Using this calculation, 25,827 of the FY2014
outpatient dental ED visits could have been diverted to community dental care
providers. With the average FY2014 ED charge to the Illinois Medicaid program of
$1,011, these “divertible” 25,827 dental ED visits charged Medicaid $26.11 million.
Using the national median 2014 cost of general dental visit in a community setting as
$230.97 (calculation above); these diverted patients would cost approximately $5.97
million if the dental care was provided in a community clinic setting. Through an
effective statewide ED diversion program, dental care provided outside of the

EMERGENCY DEPARTMENT DENTAL CARE IN ILLINOIS- 2010 to 2014. 20
emergency department setting has the potential to save the State of Illinois
approximately $20.14 million per year, just in the Medicaid program alone.
In FY 2013, the total number of uninsured visits was 25,407. It is estimated that
through Medicaid expansion approximately 45 percent of uninsured adults would qualify
for Medicaid in 2014 (Health Reform Interactive: A State-by-State Look at the ACA,
2015). Taking this into account 11,433 visits would have qualified for Medicaid services
and these costs could have been 100 percent reimbursed by federal Medicaid
expansion funding (Affordable Care Act: Provisions: Financing). In fact, when
comparing FY 2013 and FY2014, the data does show a greater reliance on Medicaid as
a primary payer in 2014, because uninsured patients were enrolling in Medicaid through
the Affordable Care Act’s Medicaid expansion provision.
Cost savings to the Illinois health care system would be further amplified if cost
effectiveness calculations were extended to charges borne by all payers. In 2014, the
total ED charges for NTDC for all payers were $93,179,433 through 76,664 visits.
Using the calculated 2014 national median cost of a general dental visit in a community
setting again as $ 230.97 (Agency for Healthcare Research and Quality, 2012) and that
78.6 percent of dental ED visits can be diverted to a local dental office (Wall, 2014); a
total of 60,258 visits could be provided in a community setting and with a projected cost
of $13.9 million dollars. In FY 2014 alone, the charge savings to the system as a whole
would exceed $79.2 million.
Discussion
The use of emergency departments for preventable dental health conditions is a
growing problem in the US and as described here, in Illinois (National Center for Health

EMERGENCY DEPARTMENT DENTAL CARE IN ILLINOIS- 2010 to 2014. 21
Statistics, 2013). These preventable health care charges are adding to the existing
financial burdens of hospitals and the state budgets. This brief describes, in detail,
charges to the Illinois health care system for non-traumatic dental related conditions
(Table 1) when they are treated medically in the emergency department. The analysis
presented here is limited to the “treat and release” portion of the patients that come in to
the ED. Studies elsewhere detail the cost to the system when patients become
hospitalized for a complication whose root cause was a dental concern (Shah et al,
2013).
The majority of the people who sought care for a non-traumatic dental concern in
Illinois EDs between FY2010 and FY 2014 were uninsured, or insured by Medicaid and
in the age groups of 18-49 years of age. They accounted for 76.3% of the total $
362,064,501 ED dental charges and 85.2% of total 362,245 ED dental visits. When
visits were analyzed by Race/Ethnicity, Non-Hispanic Blacks are over twice as likely as
expected, based on their share of the total population, to use the ED for dental
concerns. There was a statistically significant impact of the SMART Act cuts on use of
ED for NTDC. Age-adjusted visits increased from an average of 745 to 791 per
100,000. Total ED visit charges increased from $62.3 million to $86.8 million. It was
estimated that the Medicaid dental program SMART Act savings was $32 million
(Chicago Dental Society, 2014).
The ED visits increased by 11.8% from 2010 to 2014, and ED visit charges
increased by 70.9%. Similar trends in ED visits and charges have been reported in
other states over this time period (Catalanotto, personal communication). One
explanation for the multifold increase in charges as compared to visits is the upward
trend of 50 year and older Illinoisans seeking care through ED (Figure 4). Chronic co-

EMERGENCY DEPARTMENT DENTAL CARE IN ILLINOIS- 2010 to 2014. 22
morbid conditions are more likely to be present in older adults and these can further
exacerbate poor oral health status adding to urgency of disease and ED financial
burden. It is likely that by the time the dental concern reaches the ED setting, more
complicated and invasive treatment is indicated. This charge may even be higher as
there may be additional costs in other settings such as prescriptions related to the
original ED visit (Davis, Deinard, & Maiga, 2010). The five year average charge in an
Illinois ED was $1,000. Unarguably, the cost of treating a routine dental concern is
higher in an emergency care setting as compared to a dental office in the community.
Interestingly, the data presented here indicate that the average ED visit charge
varies with type of primary payer (Table 2). The least costly groups are: Medicaid
($839) and un-insured/other ($881) relative to better funded or privately insured visits:
commercial/HMO & self-administered insurance plans ($1351 - $1467), and highest
charges were for Medicare enrolled patients ($1570). The charges represented in this
report are amounts billed by hospitals for providing care and may include nursing care,
diagnostic tests, treatment procedures, medications provided in the EDs and other
services.
The year over year increase in numbers of patients seeking care for urgent
dental issues in emergency rooms indicate that these patients have limited resources
and other barriers to obtaining routine dental in their communities. When adults who
stated that they do not intend to visit the dentist in the next 12 months were asked the
reason for this plan, in addition to cost, other top reported reasons included not needing
dental care, not being able to easily travel to a dentist, lack of time to get to a dentist
and anxiety over visiting the dentist (Yarbrough, et al, 2014). It is likely that there will be
some percent of patients will be recalcitrant and will continue to forgo care in the

EMERGENCY DEPARTMENT DENTAL CARE IN ILLINOIS- 2010 to 2014. 23
community and will seek care through ED, even if offered other options. Many factors
result in the outcome of high NTDC ED use for Medicaid enrollees: dental insurance
coverage under Illinois’ Medicaid plan (some services such as treatments for
periodontal disease are not covered by Medicaid) or that the community they reside in
has limited capacity to provide routine dental care services covered by Medicaid. It is
reasonable that under these conditions, patients may wait longer to seek care even
when they know there is a problem, resulting in them seeking resolution in the ED
setting at a more advanced disease state (Shah et al, 2013). This and other reports
suggest that for high-risk groups – Medicaid and un-insured adults 18-49 years of age,
better coordination and access to basic preventive and restorative services may be a
cost-effective solution to reducing hospital and overall healthcare spending (Florida
Institute for Health Innovation, 2014; Manski, Moeller, & Chen, 2011).
One can also reason that most dental concerns can be treated in the general
community setting if attended to earlier in the course of disease (Shah, Leong, & Lee,
2013). Manski, Moeller, & Chen in 2011 report on the use and costs for 10,582
Medicare beneficiaries over a 1-year period. Although the subjects with preventive care
coverage visited the dentist more often in the year, their total costs for dental care for
the year was less, on average $560 vs. $822. Their findings support that preventive
care utilization protected the patient from more costly dental treatment.
Passage of the Patient Protection and Affordable Care Act (PPACA) in 2010 has
increased the number of persons with medical insurance and thus greatly impacted their
access to health care services (U.S.Department of Health and Human Services, 2014).
The PPACA provisions may affect adult oral health insurance status by allowing adults
to purchase stand-alone dental plans, extend insurance to age 26 by remaining on

EMERGENCY DEPARTMENT DENTAL CARE IN ILLINOIS- 2010 to 2014. 24
parent plans and allow more low-income adults to become eligible through Medicaid
expansion (Discepolo & Kaplan, 2011). It is estimated that nationally about 1.1 million
adults obtained dental coverage through state marketplace plans (U.S.Department of
Health and Human Services, 2014) and up to 8.3 million adults can obtain coverage for
dental care through Medicaid expansion. This is particularly important in Illinois where
the state’s Medicaid program covers some level of adult dental benefits. With this
expansion of coverage, Illinois’ cost for care will continue to shift from un-
insured/uncompensated to Medicaid, but will be supported by the federal government
which assumes 100% of Medicaid expansion costs in 2014 and gradually decreases to
90% by the year 2020 (Affordable Care Act: Provisions: Financing). It is estimated that
more than 600,000 low income Illinois adults will gain dental benefits as a result of
Medicaid expansion under the PPACA (Vujicic, 2015).
From July 1, 2012 to June 30, 2014, Illinois enacted the SMART Act. This cost
saving measure drastically curtailed basic dental services covered under Medicaid. In
addition, during part of this time of cuts, Affordable Care Act Medicaid expansion and
dental plans through the Health Insurance Marketplace became available. These
complicating factors were operating during part of the SMART Act ED visit trend under
study in this report. For a six month SMART Act period in 2014, Medicaid was
expanded to additional enrollees mainly through reaching into the previously uninsured
market. These newly insured Medicaid recipients, theoretically with years of un-met
dental needs visited the ED for care thus possibly adding to the NTDC ED trend.
Comparison of utilization and charges during this time of flux in insurance and covered
services show an interesting outcome. In the period of SMART Act cuts, after Medicaid
expansion (FY2014) NTDC ED visits show a greater reliance on Medicaid as a primary

EMERGENCY DEPARTMENT DENTAL CARE IN ILLINOIS- 2010 to 2014. 25
payer: total charges to Medicaid increased to 35.7% (FY2014) from 31.2% (FY2013)
and the proportion of total visits for Medicaid enrollees also increased to 42.9%
(FY2014) from 37.6% (FY2013).
As described in the Financial Analysis section, on a per visit basis the financial
burden in providing dental care through an Illinois ED far exceeds the total cost of
providing basic dental care in the community setting. As calculated earlier, the FY2014
charge savings to the system as a whole would exceed $79.2 million. This is a startling
amount of savings, for just one twelve month period. The author believes these savings
can realistically come to fruition by creating better, definitive, community based service
delivery models. These conserved resources can be better used in coordination of
access points in the community, improving oral health literacy, providing prevention
education, and encouraging timely action to care. These and other cost-effective earlier
interventions can improve not only the systems of care, reduce wasteful health care
spending and provide cost efficiencies but more importantly improve health outcomes
for all Illinoisans.
The problem of using the ED for individual health issues is best addressed when
looked in the context of whole strata of health determinants that created the problem.
The data presented here are point in time, individual interactions with the ED system
with many linkages and interactions between these factors. Understanding and
intervening at individual, family, community and policy levels can result in better cost-
effective outcomes: the right care, at the right time, in the right setting.
Individual and family level strategies must be pervasive and widespread. This
level of intervention includes understandable messages that target: individual disease
risk, oral health literacy, behavior change, improved self-efficacy practices, health

EMERGENCY DEPARTMENT DENTAL CARE IN ILLINOIS- 2010 to 2014. 26
promotion, and knowledge about where to go for timely care (Wall, 2014). Community
level interventions should include efforts to better understand barriers to care through
improved data collection efforts at EDs, community needs assessments and other
community surveillance activities. In addition, improving information about where to
access care and expanding capacity to care for adults in the community settings will re-
orient care back into the community. EDs must develop community care coordination
resources so that follow up appointments can be made in the community clinic, and to
track if patient received care. Policy level improvements must include eliminating
restrictions to care, alleviating institutional and eligibility barriers, expanding policies that
value prevention, access to timely care, and the efficient use of resources dedicated to
low-income and uninsured persons.
Intervention can lead to definitive care models and alleviate the stresses on
Illinois EDs. Alternative community centered public-private partnerships have been
successful in several states and are discussed above. Illinois should review this
pioneering work in fashioning alternative solutions. The proposals listed here do not
represent the universe of possible solutions on this issue; these do however provide a
starting point for conversation that can develop into options for cost efficient community
centered care.
This brief is produced for the use of policy makers, researchers, program
developers, community organizations, healthcare providers and the public health
community in their search for data driven improvements to the currently fragmented
system of care. The focus here is to concentrate program efforts on foundational
principles articulated by the Institute for Health Improvement’s Triple Aim: “improving

EMERGENCY DEPARTMENT DENTAL CARE IN ILLINOIS- 2010 to 2014. 27
the patient experience of care, improving the health of populations, and reducing the per
capita cost of health care” (Berwick, Nolan, & Whittington, 2008).
Limitations
Hospital charges are not actual costs or reimbursements. What each hospital
receives in reimbursement for each ED visit is based on a negotiated discount on
charges which can vary both by payer and by hospital. Information on what is ultimately
collected on these charges or individual hospital cost to charge ratio is not available.
This poses a limitation in our understanding of the state-wide cost for treating
preventable dental concerns in the emergency department setting. The author
recommends a more detailed and purposeful collection of ED data using a system
designed specifically to gather this information.

EMERGENCY DEPARTMENT DENTAL CARE IN ILLINOIS- 2010 to 2014. 28
References
Affordable Care Act: Provisions: Financing. (n.d.). Retrieved March 23, 2015, from
Medicaid.gov: http://medicaid.gov/affordablecareact/provisions/financing.html
Agency for Healthcare Research and Quality. (2012). Dental Services-Mean and
Median Expenses per Person With Expense and Distribution of Expenses by
Source of Payment: United States, 2012. Retrieved April 1, 2015, from Medical
Expenditure Panel Survey Household Component Data.:
http://meps.ahrq.gov/data_stats/tables_compendia_hh_interactive.jsp?_SERVIC
E=MEPSSocket0&_PROGRAM=MEPSPGM.TC.SAS&File=HCFY2012&Table=H
CFY2012_PLEXP_B&VAR1=AGE&VAR2=SEX&VAR3=RACETH5C&VAR4=INS
URCOV&VAR5=POVCAT12&VAR6=MSA&VAR7=REGION&VAR8=HEALTH&V
ARO1=4+17+4
American Dental Association. (2014). Action for Dental Health. Retrieved March 23,
2015, from American Dental Association:
http://www.ada.org/~/media/ADA/Public%20Programs/Files/ER_Referral_Models
_Summary_Flyer.ashx
Aston, G. (2013, September 1). Clinical management: Easing the Bite on the ED.
Retrieved June 28, 2015, from American Hopsital Association:
http://www.hhnmag.com/Magazine/2013/Sept/0913HHN_Feature_clinicalmanag
ement
Berwick, D. M., Nolan, T. W., & Whittington, J. (2008). The Triple AIm: Care, Health and
Cost. Health Affairs, 759-769.

EMERGENCY DEPARTMENT DENTAL CARE IN ILLINOIS- 2010 to 2014. 29
Bloom B, S. C. (2012). Oral Health Status and Access to Oral Health Care for U.S.
Adults Aged 18–64: National Health Interview Survey, 2008. National Center for
Health Statistics. Vital Health Stat 10(253).
Bureau of Labor Statistics. (n.d.). Databases, Tables & Calculators by Subject.
Retrieved March 23, 2015, from United States Department of Labor:
http://www.bls.gov/data/inflation_calculator.htm
Center for Health Care Strategies, Inc. (2015, June). Medicaid Adult Dental Benefits: an
overview. Retrieved June 28, 2015, from Center for Health Care Strategies, Inc.:
http://www.chcs.org/media/Adult-Oral-Health-Fact-Sheet_6-9-15.pdf
Cohen, L. A. (2013). Expanding the Physician's Role in Addressing the Oral Health of
Adults. American Journal of Public Health, 408-412.
Davis, E. E., Deinard, A. S., & Maiga, W. (2010). Doctor, my tooth hurts: the costs of
incomplete dental care in the emergency room. Journal of Public Health
Dentistry, 205-210.
Discepolo, K., & Kaplan, A. (2011). The Patient Protection and Affordable Care Act:
Effects on Dental Care. New York State Dental Journal, 34-38.
Dye, B., Thornton-Evans, G. L., & Iafolla, T. (2015). Dental caries and tooth loss in
adults in the United States, 2011–2012. NCHS data brief, no 197. Hyattsville,
MD: National Center for Health Statistics.
Florida Institute for Health Innovation. (2014). Hospital Emergency Department Use for
Preventable Dental Conditions: 2010 & 2012. Retrieved March 27, 2015, from
Florida Institute for Health Innovation: http://flhealthinnovation.org/wp-
content/uploads/2014/06/FLORIDA-2011-2012-Statewide-worksheet-1.pdf

EMERGENCY DEPARTMENT DENTAL CARE IN ILLINOIS- 2010 to 2014. 30
Health Reform Interactive: A State-by-State Look at the ACA. (2015). Retrieved March
13, 2015, from The Hentry J. Kaiser Family Foundation:
http://kff.org/interactive/uninsured-gap/
Illinois Department of Healthcare and Family Services. (2014, June 27). Update in Adult
Dental Program. Retrieved March 29, 2015, from Illinois Department of
Healthcare and Family Services:
http://www2.illinois.gov/hfs/SiteCollectionDocuments/2011dorm.pdf
Illinois.gov. (2015, June 20). Retrieved from Illinois.gov:
https://www2.illinois.gov/hfs/SiteCollectionDocuments/0970689.pdf
Kansas Health Institute. (2013, December 20). KCMO pilot program seeks to divert
dental cases from ER - See more at: http://www.khi.org/news/article/kcmo-pilot-
program-seeks-divert-dental-cases-er/#sthash.95QfHTLa.dpuf. Retrieved June
28, 2015, from Kansans Health Institute: http://www.khi.org/news/article/kcmo-
pilot-program-seeks-divert-dental-cases-er/
Klein, R., & Schoenborn, C. (2001). Age Adjustment Using the 2000 Projected U.S.
Population. Rockville, MD: US Department of Health and Human Services
Centers for Disease Control and Prevention National Center for Health Statistics.
Manski, R. J., Moeller, J., & Chen, H. (2011). Preventive Dental Care Saves Money on
Total Dental Care for Medicare Beneficiaries. Rockville, MD: AHRQ Publications
Clearinghouse.
McCormick, A., Abubaker, A., Laskin, D., Gonzales, M., & Garland, S. (2013).
Reducing the burden of dental patients on the busy hospital emergency
department. J Oral Haxillofac Surg, 475-478.
EMERGENCY DEPARTMENT DENTAL CARE IN ILLINOIS- 2010 to 2014. 31
National Center for Health Statistics. (2013). Health, United States, 2012: With Special
Feature on Emergency Care. Hyattsville, MD.
National Institute of Dental and Craniofacial Research. (n.d.). Dental Caries (Tooth
Decay) in Adults (Age 20 to 64). Retrieved 8 31, 2013, from National Institute of
Dental and Craniofacial Research:
http://www.nidcr.nih.gov/DataStatistics/FindDataByTopic/DentalCaries/DentalCar
iesAdults20to64.htm.
Oral Health in America: A Report of the Surgeon General. (2000). Rockville, MD:
National Institute of Dental and Craniofacial Research.
P.I. Eke, B. D.-E. (2012). Prevalence of Periodontitis in Adults in the United States:
2009 and 2010. Journal of Dental Research.
Pew Center on the States. (2012, February). A Costly Destination. Retrieved September
5, 2013, from www.pewcenteronthestates.org
Seu K, H. K. (2012). Emergency Department Visits for Dental-Related Conditions, 2009.
HCUP Statistical Brief #143. Rockville, MD: Agency for Healthcare Research and
Quality.
Shah, A. C., Leong, K. K., & Lee, M. K. (2013). Outcomes of Hospitializations Attributed
to Periapical Abcess from 200 to 2008: a Longitudinal Trend Analysis. Journal of
Endodontics, 1104-1110.
Stangroom, J. (2015). P Value from Pearson (R) Calculator. Retrieved June 28, 2015,
from Social Science Statistics:
http://www.socscistatistics.com/pvalues/pearsondistribution.aspx
U.S. Census Bureau’s Population Estimates. (n.d.). Annual Estimates of the Resident
Population for Selected Age Groups by Sex for the United States, States,

EMERGENCY DEPARTMENT DENTAL CARE IN ILLINOIS- 2010 to 2014. 32
Counties, and Puerto Rico Commonwealth and Municipios:April 1, 2010 to July
1, 2013.
U.S.Department of Health and Human Services. (2014, May 1). Addendum to the
Health Insurance Marketplace Summary Enrollment Report for the Initial Annual
Open Enrollment Period. Retrieved March 23, 2015, from Office of the Assistant
Secretary for Planning and Evaluation:
http://aspe.hhs.gov/health/reports/2014/MarketPlaceEnrollment/Apr2014/ib_2014
Apr_enrollAddendum.pdf
Vujicic, M. (2015). Health Policy Perspectives: The booming Medicaid market. JADA,
136.
Wall T, N. K. (2014). Majority of Dental-Related Emergency Department Visits Lack
Urgency and Can be Diverted to Dental Offices. Chicago, Illinois: American
Dental Association Health Policy Institute.
Yarbrough, C., Nasseh, K., & Vujicic, M. (2014, November). Why Adults Forgo Dental
Care: Evidence from a New National Survey. Retrieved March 23, 2015, from
American Dental Association: Health Policy Institute:
http://www.ada.org/~/media/ADA/Science%20and%20Research/HPI/Files/HPIBri
ef_1114_1.ashx


