Elementary School TVAAS Composites: A Comparison Between ...
103
East Tennessee State University Digital Commons @ East Tennessee State University Electronic eses and Dissertations Student Works 12-2016 Elementary School TVAAS Composites: A Comparison Between Title I Elementary Schools and Non-Title I Elementary Schools in Tennessee Anthony W. Padelski East Tennessee State University Follow this and additional works at: hps://dc.etsu.edu/etd Part of the Educational Administration and Supervision Commons , Educational Assessment, Evaluation, and Research Commons , Educational Leadership Commons , and the Educational Methods Commons is Dissertation - Open Access is brought to you for free and open access by the Student Works at Digital Commons @ East Tennessee State University. It has been accepted for inclusion in Electronic eses and Dissertations by an authorized administrator of Digital Commons @ East Tennessee State University. For more information, please contact [email protected]. Recommended Citation Padelski, Anthony W., "Elementary School TVAAS Composites: A Comparison Between Title I Elementary Schools and Non-Title I Elementary Schools in Tennessee" (2016). Electronic eses and Dissertations. Paper 3134. hps://dc.etsu.edu/etd/3134
Transcript of Elementary School TVAAS Composites: A Comparison Between ...

East Tennessee State UniversityDigital Commons @ East
Tennessee State University
Electronic Theses and Dissertations Student Works
12-2016
Elementary School TVAAS Composites: AComparison Between Title I Elementary Schoolsand Non-Title I Elementary Schools in TennesseeAnthony W. PadelskiEast Tennessee State University
Follow this and additional works at: https://dc.etsu.edu/etd
Part of the Educational Administration and Supervision Commons, Educational Assessment,Evaluation, and Research Commons, Educational Leadership Commons, and the EducationalMethods Commons
This Dissertation - Open Access is brought to you for free and open access by the Student Works at Digital Commons @ East Tennessee StateUniversity. It has been accepted for inclusion in Electronic Theses and Dissertations by an authorized administrator of Digital Commons @ EastTennessee State University. For more information, please contact [email protected].
Recommended CitationPadelski, Anthony W., "Elementary School TVAAS Composites: A Comparison Between Title I Elementary Schools and Non-Title IElementary Schools in Tennessee" (2016). Electronic Theses and Dissertations. Paper 3134. https://dc.etsu.edu/etd/3134

Elementary School TVAAS Composites: A Comparison Between Title I Elementary Schools
and Non-Title I Elementary Schools in Tennessee
_____________________
A dissertation
presented to
the faculty of the Department of Educational Leadership and Policy Analysis
East Tennessee State University
in partial fulfillment
of the requirements for the degree
Doctor of Education in Educational Leadership
_____________________
by
Anthony W. Padelski
December 2016
_____________________
Dr. James Lampley, Chair
Dr. Virginia Foley
Dr. Donald W. Good
Dr. George Poole
Keywords: TVAAS, Title I schools, state report cards, value added assessment
2
ABSTRACT
Elementary School TVAAS Composites: A Comparison Between Title I Elementary Schools
and Non-Title I Elementary Schools in Tennessee
by
Anthony W. Padelski
The goal of Title I is to provide extra instructional services and activities that support students
identified as failing or most at risk of failing the state’s challenging performance standards in
mathematics, reading, and writing. Low-income schools or Title I schools are the primary target
of Title I funds. A school is eligible for Title I status when 40% of the school’s students are from
low income families; these students are identified by their eligibility to receive free and reduced
priced meals.
The purpose of this study was to determine whether there is a significant difference in
elementary schools’ TVAAS Composite scores between Title I and Non-Title I schools.
Specifically, this researcher examined the relationship of Title I funding with student academic
growth at the elementary level. The schools were located in rural Tennessee. Data were gathered
from the 2012-2013 and 2013-2014 Tennessee State Report Cards and the Tennessee
Department of Education to determine if there was a statistically significant difference between
the 2 types of schools. Research indicated mixed reviews on the impact Title I funds have on
lower socioeconomic schools.

3
The researcher performed 5 paired t test and 8 Pearson correlation coefficients. There was a
significant difference in the schools’ composite scores between Title I and Non-Title I
elementary schools in Tennessee. Non-Title I elementary schools in Tennessee had higher
composite scores than those of the Title I elementary schools. Results from the Pearson
correlations indicated no significant relationships for mean years of teaching experience with
school composite scores.

4
Copyright 2016 by Anthony W. Padelski
All Rights Reserved

5
DEDICATION
This dissertation is dedicated to my wife Brandi and our children Maddie, Mason, and
Maddox. This has been a tremendous journey filled with many memories that will last a
lifetime. Maddie, you are a determined and compassionate young lady whose fearless spirit
inspires everyone around you. You are so persistent in everything that you do. Because of this
gift, our family will never become complacent. Mason, your captivating personality has been
crucial to our family in many difficult times. Your thirst for life has inspired our family to live
life to the fullest. Maddox, you are our self-reliant and unique glue that holds our family
together. You have challenged me to become a better father and teacher. Brandi, you are one of
the most caring and hardest working women I’ve ever known. I’m such a blessed man. Thank
you for your love, patience, and support throughout this journey. I wouldn’t have achieved this
milestone without my best friend by my side.
Further, this work is dedicated to my parents Keith and Jenny Turner. You believed in
me when no one else did. For that I am so thankful. Your guidance and advice through this
journey will always be remembered and cherished. Your hard work and dedication to others has
provided me with many opportunities to witness great leadership. I applaud you for those
experiences.

6
ACKNOWLEDGEMENTS
First and foremost, I would like to thank God for blessing me with such a wonderful
family that has supported and encouraged me to follow my dreams. My faith has played an
important part of who I am and how determined I was to achieve this milestone.
I would like to acknowledge the many people who have supported me in the completion
of my dissertation. I would like to express a special thank you to Dr. Lampley, the chairperson
of my committee, for guidance and advice throughout this entire process. I appreciate your
words of encouragement and your knowledge on the research process. Dr. Good, your
knowledge of statistics has gotten me through many tough times. Dr. Foley, thank you for your
expertise on school achievement and the research process. Dr. George Poole, thank you for the
encouragement, great conversations, as well as articles on TVAAS. It is appreciated and will
never be forgotten.
I would also like to thank the leadership team of Johnson City Schools. Your
encouragement and belief in me as a future leader has been a humbling experience. I can’t wait
to inspire and encourage students, teachers, and staff in Johnson City. Finally, I would like to
thank the students, faculty, and parents of Lake Ridge Elementary. It is an honor to serve the
students and families of this great community.

7
TABLE OF CONTENTS
Page
ABSTRACT .....................................................................................................................................2
DEDICATION .................................................................................................................................5
ACKNOWLEDGEMENTS .............................................................................................................6
LIST OF FIGURES .......................................................................................................................10
Chapter
1. INTRODUCTION ............................................................................................................11
Statement of the Problem ...................................................................................................15
Research Questions ............................................................................................................16
Definition of Terms............................................................................................................18
Significance of the Study ...................................................................................................20
Limitations and Delimitations ............................................................................................21
Overview of the Study .......................................................................................................22
2. REVIEW OF LITERATURE ............................................................................................23
History of School Accountability ......................................................................................24
Race to the Top ..................................................................................................................33
Common Core Standards ...................................................................................................36
Value Added System..........................................................................................................38
Tennessee Value Added System ........................................................................................39
Tennessee State Report Card .............................................................................................41
Socioeconomic Status and Achievement ...........................................................................42
Title I Schools ....................................................................................................................43

8
3. RESEARCH METHODOLOGY.......................................................................................50
Research Questions and Null Hypotheses .........................................................................50
Instrumentation ..................................................................................................................53
Population ..........................................................................................................................55
Data Collection ..................................................................................................................56
Data Analysis .....................................................................................................................56
4. FINDINGS .........................................................................................................................58
Research Question 1 ..........................................................................................................58
Research Question 2 ..........................................................................................................59
Research Question 3 ..........................................................................................................61
Research Question 4 ..........................................................................................................62
Research Question 5 ..........................................................................................................64
Research Question 6 ..........................................................................................................65
Research Question 7 ..........................................................................................................67
Research Question 8 ..........................................................................................................69
Research Question 9 ..........................................................................................................70
Research Question 10 ........................................................................................................72
Research Question 11 ........................................................................................................73
Research Question 12 ........................................................................................................75
Research Question 13 ........................................................................................................76
5. SUMMARY, CONCLUSION, AND RECOMMENDATIONS .......................................78
Summary ............................................................................................................................78
Conclusion .........................................................................................................................83
9
Recommendations for Practice ..........................................................................................84
Recommendations for Further Research ............................................................................87
REFERENCES .............................................................................................................................89
APPENDICES ...............................................................................................................................99
Appendix A. Participating Schools ................................................................................................99
Appendix B. IRB Approval Letter ...............................................................................................101
VITA ............................................................................................................................................102

10
LIST OF FIGURES
Figure Page
1: The schools’ overall composite scores: 2012-2013 and 2013-2014 school years……………59
2: The schools’ numeracy composite scores: 2012-2013 and 2013-2014………………………60
3: The schools’ literacy composite scores: 2012-2013 and 2013-2014 school years…………...62
4: The schools’ combined numeracy and literacy composite scores: 2012-2013 and 2013-
2014 school years………………………………………………………………………..64
5: Mean years of teaching experience: 2012-2013 and 2013-2014 school years……………….65
6: The relationship between the schools’ overall composite scores and the mean years of
teaching experience in Title I schools…………………………………………………...66
7: The relationship between schools’ overall composite scores and the mean years of
teaching experience in Non-Title I schools……………………………………………...67
8: The relationship between the schools’ numeracy composite scores and the mean years
of teaching experience in Title I schools………………………………………………...69
9: The relationship between the schools’ numeracy composite scores and the mean years
of teaching experience in Non-Title I schools…………………………………………...70
10: The relationship between the schools’ literacy composite scores and the mean years
of teaching experience in Title I schools………………………………………………...72
11: The relationship between the schools’ literacy composite scores and the mean years
of teaching experience in Non-Title I schools…………………………………………...74
12: The relationship between the schools’ combined numeracy and literacy composite
scores and the mean years of teaching experience in Title I schools…………………….75
13: The relationship between combined numeracy and literacy composite scores and the
mean years of teaching experience in Non-Title I schools………………………………77

11
CHAPTER 1
INTRODUCTION
Coleman et al. (1966) in their report entitled Equality of Educational Opportunity
revealed that students with a lower socioeconomic status (SES) lacked the same educational
opportunities as those with a higher SES. The National Center for Educational Statistics (NCES,
2012) defined SES as a student’s access to social, financial, cultural, and human capital
resources. According to Ravitch (1985) the Colman Report of 1966 contributed to the notion that
schools as such do not make a difference in the achievement of their lower socioeconomic
students—rather, it is the socioeconomic status of a family that does. However, evidence from
the 1981 updated Coleman Report suggested otherwise. In contrast to the 1966 report, the
updated Coleman Report showed that schools do indeed make a difference regardless of
students’ SES.
In 1983 the National Commission on Excellence in Education (1983b) published A
Nation at Risk, The Imperative for Educational Reform (ANAR), a report that publicly criticized
American public education shortly after the launch of Sputnik by the U.S.S.R. before the
Americans had any satellites. Bracey (2008) characterized the report as “a golden treasury of
spun statistics” (p. 80). According to Bracey the commissioners of the report focused on a single
trend that supported their criticism of the United States’s educational system. They based their
criticism on the decline in science achievement of 17-year-olds as measured by national
assessments but neglected to mention that the other two age groups tested did not show any such
declines. Schwartz and Robinson (2000) noted that by releasing this report President Reagan
acknowledged the impact that American public education has on the U.S. economy and that the
problem does not reside with the federal government but with the individual states. They also

12
stated in response to the criticism the states created more than 250 educational task forces whose
roles were to develop initiatives to improve educational outcomes.
Ten years later President Clinton and his administration submitted their school reform
proposal to congress. Goals 2000: Educate America Act was signed into law in 1994. According
to Ravitch (2010) the proposal called for the states to develop their own standards, tests, and
accountability for achievement. During this time elected officials of both political parties
supported the idea that testing and accountability would lead to better schools. Two years later
the President Clinton and his administration reauthorized the Elementary and Secondary
Education Act (ESEA) (Domina, 2005). This reauthorization presented a new provision that was
designed to bring families and schools closer together by requiring the nation’s poorest schools
to spend at least 1% of their Title I funds on programs that would increase parental involvement.
Schwartz and Robinson (2000) recognized that Goals 2000 provided an opportunity for the
Clinton administration to reauthorize the ESEA that was later entitled the Improving America’s
School Act of 1994 (IASA).
IASA was designed to direct the schools’ and educators’ attention to developing
standards and tests that would influence Title I funding. According to Rudalevige (2003) the
1994 reauthorization emphasized the importance of schools’ accountability in regards to
measurable gains in student performance. As depicted in the legislative expectations by Wong
and Meyer (1998), schools should work to improve the achievement of lower SES students, and
their expectations of these students should be equal to that of the entire student population.
As President George W. Bush signed the No Child Left Behind Act of 2001 (NCLB),
“The scene was a civics text come to life. Flanked by jubilant members of Congress, cheered on
by a young crowd, President Bush declared the start of a new era in American public education”

13
(Rudalevige, 2003, p. 23). This new act from the Congress represented the latest reauthorization
of the Elementary and Secondary Education Act of 1994 (ESEA), first authorized in 1964. As
noted by Linn, Baker, and Betebenner (2002), NCLB reinforced many state policies aimed at
improving student achievement as well as accountability. According to Ravitch (2010) the
accountability feature of NCLB required all states to participate in a federal achievement test
called the National Assessment of Educational Progress (NAEP). NAEP scores were collected
and analyzed to monitor progress throughout the states without resulting in any punitive
measures for schools or districts. NCLB called for the release of state report cards that would
display students’ performance in Grades 3 through 8. Data representing schools were
disaggregated by ethnic and economic subgroups (NCLB, 2002).
In January of 2010 President Obama announced his administration’s first step in
educational reform–Race to the Top (RTT). The RTT program was a competitive 4-year grant
program that challenged and rewarded states for innovation and reform (Obama, 2011). In his
state of the union address President Obama emphasized the importance of the family, school, and
community contribution to a child’s education:
Our schools share this responsibility. When a child walks into a classroom, it should be a
place of high expectations and high performance. But too many schools don’t meet this
test. That’s why instead of just pouring money into a system that’s not working, we
launched a competition called Race to the Top. To all 50 states, we said, “If you show us
the most innovative plans to improve teacher quality and student achievement, we’ll
show you the money.” (para. 36)
Tennessee was one of two states that created an innovative plan to improve teacher
quality and student achievement. According to Smith and Partners (2013) the U.S. Secretary of
Education Duncan announced that Tennessee was one of two states to win the RTT grant, with
$501 million to spend over 4 years. Tennessee promised to use the data from its value added

14
system as a significant part of school and teacher’s evaluations and to implement standards
aligned with the Common Core Standards (Derringer, 2010).
Value added models (VAM) are statistically adjusted gains in test scores achieved by
students (Braun, 2005). According to Eckert and Dabrowski (2010) in Tennessee the evaluation
of teachers, administrators, and schools based on value added data is becoming increasingly
popular among policy makers, politicians, business interests, and the public. Value added data
are designed to measure a student’s progress from one year to the next, beginning in the fourth
grade. A teacher’s contribution to the school can be measured by subtracting the achievement
scores of a teacher’s students at the beginning of the year from the score at the end of the year
and making statistical adjustments to account for SES (Glazerman et al., 2010). Developers of
VAMs, such as William Sanders who developed the Tennessee Value Added System (TVAAS),
claimed that the analysis of student test scores from one year to the next enables them to isolate
the effect that teachers and schools have on student learning (Braun, 2005).
Tennessee students in Grades 4 through 8 take achievement tests that are evaluated
according to the TVAAS. The TVAAS measures the impact schools and teachers have on their
students’ academic progress. In addition TVAAS is a system that is designed to measure a
student’s academic growth on an achievement test instead of comparing a student’s score to a
proficiency or cut score (Tennessee Department of Education [TNDOE], 2015b). The TNDOE
analyzes the results of the TVAAS and reports the scores as a component of the annual state
report card of every school in Tennessee. According to the TNDOE (2015a) the annual report
card is a comprehensive showcase of state, district, and school-level data for each school year.
The report card includes demographics, achievement results, accountability progress, value-
added data, attendance figures, graduation rates, and more. The report card organizes and

15
compiles data by district and school, and its categories include school TVAAS composite scores
such as numeracy, literacy, combined numeracy and literacy, and overall scores. Other data of
note consist of student ethnicity, student enrollment, percentage of economically disadvantaged
students, and per pupil expenditure.
Statement of the Problem
The present study was aimed at comparing Title I schools and Non-Title I schools in
regards to elementary school TVAAS composite results. The schools were located in rural
Tennessee. Data were gathered from the 2012-2013 and 2013-2014 Tennessee State Report
Cards to determine if there was a statistically significant difference between the two types of
schools. The report cards are shared with local school systems and parents; report cards reflect
the notion of labeling schools based on their TVAAS composite scores.
According to the TNDOE (2014b) Tennessee’s new accountability system was designed
through the state’s waiver from NCLB and designated Reward, Priority, and Focus schools.
Reward schools comprise the top 5% of schools in the state for performance—as measured by
overall student achievement levels—and the top 5% for year-over-year progress—as measured
by school-wide value-added data. These schools received recognition for their success under the
accountability system during the 2012-2013 school year. Priority schools are the lowest-
performing 5% of schools in Tennessee in terms of academic achievement. During the 2012-
2013 school year, 83 schools were eligible for inclusion in the Achievement School District
(ASD) or in District Innovation Zones and could plan and adopt turnaround models for school
improvement. Focus schools are the 10% of schools in Tennessee with the largest achievement
gaps between groups of students such as racial and ethnic groups, students from economically
disadvantaged backgrounds, students with disabilities, and English-language learners. The state

16
named 167 schools as Focus schools during the 2012-2013 school year; the state attributed this
type of label to schools as a result of evaluating schools based on value added scores (TNDOE,
2014b).
Title I funding represents an average of between 8% and 10% of a school’s operating
budget. This helps put them on par with other Non-Title I schools. Therefore, closing the
achievement gap will rely heavily on federal funding from the Title I program, and the financial
support would depend on a school’s Title I school status. Research is still needed to determine if
Title I funded schools are at an advantage due to the amount of financial support received from
the federal government. Therefore, the purpose of this study was to determine whether there is a
significant difference in elementary school’s TVAAS Composite scores between Title I and
Non-Title I schools.
Research Questions
This nonexperimental quantitative design study was guided by the following research questions.
Research Question 1: Is there a significant difference in schools’ overall composite scores
between Title I and Non-Title I elementary schools in Tennessee?
Research Question 2: Is there a significant difference in schools’ numeracy composite scores
between Title I and Non-Title I elementary schools in Tennessee?
Research Question 3: Is there a significant difference in schools’ literacy composite scores
between Title I and Non-Title I elementary schools in Tennessee?
Research Question 4: Is there a significant difference in schools’ combined numeracy and
literacy composite scores between Title I and Non-Title I elementary schools in
Tennessee?

17
Research Question 5: Is there a significant difference in the mean years of teaching experience
between teachers in Title I and Non-Title I elementary schools in Tennessee?
Research Question 6: Is there a significant relationship between schools’ overall composite
scores and the mean years of teaching experience of teachers in Title I schools?
Research Question 7: Is there a significant relationship between schools’ overall composite
scores and the mean years of teaching experience of teachers in Non-Title I schools?
Research Question 8: Is there a significant relationship between schools’ numeracy composite
scores and the mean years of teaching experience of teachers in Title I schools?
Research Question 9: Is there a significant relationship between schools’ numeracy composite
scores and the mean years of teaching experience of teachers in Non-Title I elementary
schools?
Research Question 10: Is there a significant relationship between schools’ literacy composite
scores and the mean years of teaching experience for teachers in Title I elementary
schools?
Research Question 11: Is there a significant relationship between schools’ literacy composite
scores and the mean years of teaching experience for teachers in Non-Title I elementary
schools?
Research Question 12: Is there a significant relationship between combined numeracy and
literacy composite scores and the mean years of teaching experience for teachers in Title
I elementary schools?
Research Question 13: Is there a significant relationship between combined numeracy and
literacy composite scores and the mean years of teaching experience for teachers in Non-
Title I elementary schools?

18
Definitions of Terms
The definitions of the principal terms used in this study are provided below.
Adequate Yearly Progress (AYP). States must establish a definition of adequate yearly
progress (AYP) that each school and district is expected to meet. States must identify
yearly objectives to measure the progress of schools and districts to ensure that all groups
and subgroups of students reach proficiency within 12 years. States must also provide
additional performance indicators for all students; in elementary and middle schools this
indicator is attendance, and in high schools it is graduation rate. In order to show AYP
schools must test at least 95% of the following groups: low-income students, students
from major racial and ethnic groups, students with disabilities, and students with limited
English proficiency. In calculating AYP for subgroups 45 or more students must be
included to satisfy high levels of reliability (USDOE, 2009a).
No Child Left Behind Act of 2001 (NCLB). NCLB is a federally mandated bill that requires all
states to establish an accountability system that holds all schools and districts accountable
for students’ performance (Owens, 2010).
Race to the Top (RTT). RTT is a $4.35 billion competitive educational grant created by the
United States Department of Education (USDOE) to reward innovation and reforms in
state and local district k-12 education (USDOE, 2009b).
Socioeconomic Status (SES). SES is “the social standing or class of an individual or group. It is
often measured as a combination of education, income and occupation” (American
Psychological Association, 2015, para. 1).

19
State Report Card. State report cards must be produced yearly and must provide information
regarding academic achievement scores as well as information disaggregated by race,
ethnicity, gender, English proficiency, disability, and lower SES (USDOE, 2013b).
Title I. Title I is a federal program that is intended to help ensure that all children, especially
disadvantaged students, have the opportunity to receive a high quality education and
reach proficiency on state achievement tests (USDOE, 2014).
Title I Schools. Title I schools are public schools with at least 40% of the students receiving free
and reduced priced lunches funded from the federal Title I program (USDOE, 2014).
Non-Title I Schools. Non-Title I Schools are public schools that do not receive Title I funding to
support lower SES students (USDOE, 2014).
TVAAS School Wide Composite Scores. Composite scores include the test scores of all tested
grades and subjects in the school (TNDOE, 2015a).
TVAAS School Wide Literacy Scores. Literacy scores include the test scores of all tested
grades but only subjects specifically associated with literacy. These subjects are SAT 10-
Reading and Language, T-CAP Reading, EOC – English I, II, and III (TNDOE, 2015a).
TVAAS School Wide Numeracy and Literacy Scores. Combined numeracy and literacy scores
include the test scores of all tested grades but only subjects specifically associated with
numeracy and literacy (TNDOE, 2015a).
TVAAS School Wide Numeracy Scores. Numeracy scores include the test scores of all tested
grades but only subjects specifically associated with numeracy. These subjects are SAT
10-Math, T-CAP Math, EOC – Algebra I and II (TNDOE, 2015a).
Value Added Models (VAM). VAM is a type of growth model based on changes in
achievement scores over time, usually from one year to the next. VAMs are statistical

20
models that are designed to take into account a student’s SES or school background
characteristics in order to calculate the amount of learning that was attributed to a specific
teacher or school. Teachers or schools that produce growth are considered to have added
value to a student’s knowledge base (UCLA IDEA, 2012).
Tennessee Value Added Assessment System (TVAAS). TVAAS measures the impact schools
and teachers have on student academic growth. It does not measure whether a student is
proficient on a state assessment; however, it helps educators identify best practices and
programs in order to make decisions regarding the use of resources so that every child
has an opportunity to grow academically (TNDOE, 2015b).
Significance of the Study
Math and literacy standards have become more rigorous in Tennessee due in part to
Common Core Standards that are aligned with other state standards. Under current law
Tennessee is not required to develop assessments that can measure individual student growth.
Many federal funding laws, such as Title I, exclude measures of individual growth as part of
AYP. The USDOE has allowed states to include the measures as part of their annual report card,
but they are not tied to federal funding. As Tennessee moves closer to fully implementing
Common Core Standards, so will the idea of measuring the individual student growth promised
by the Common Core Testing Consortia (Finn & Petrilli, 2011).
The results of this study may benefit legislators, policy makers, teachers, administrators,
school systems, and states that will participate in the Common Core Assessment Consortium. In
Tennessee the decision to adopt state Common Core Standards was made by the governor and
the State Board of Education. State Common Core standards adoption was passed unanimously
by the State Board of Education in 2010 (TNDOE, 2014a). Ravitch (2010) wrote that Common
21
Core Standards have never been field tested prior to state adoption and implementation. In the
absence of sound research states have struggled to understand and implement new standards.
This study will help determine whether a significant relationship exists between Title I schools
and Non-Title I schools in regards to TVAAS Composite scores in the fourth and fifth grades.
Vaughan (2002) challenged Sanders’s (1998) assumption that the greatest impact on
student academic gains is teacher effectiveness, not a child’s SES or per pupil expenditures. Title
I funds are provided by the federal government to each state to close the gap between lower SES
students and other students. These funds are provided to local school districts to help meet the
academic needs of at-risk or low SES students. Kupermintz, Shepard, and Linn (2001) pointed
out that despite their home environment lower socioeconomic students are frequently placed in
inadequate facilities and received their education from a less experienced teaching force and with
lackluster instructional resources. Non-Title I schools are at a disadvantage in states that use a
value added model to evaluate teachers and schools. If school districts, schools, and
administrators can determine the causes for these inconsistencies with TVAAS data, that
knowledge will potentially help them understand how they can improve student academic
growth. Perhaps Title I funds can be directed to programs that will improve students’ academic
growth rather than a proficiency level or state score.
Limitations and Delimitations
This research was conducted in school districts across the state of Tennessee. This study
was limited to schools that administered the Tennessee Comprehensive Assessment (TCAP)
during the 2012-2013 and 2013-2014 school years in the state of Tennessee. The data were
limited to only 2 years due to Common Core Standards Implementation in the state of Tennessee.
It was assumed that the school TVAAS data that were collected from the state report card were

22
valid and reliable. Tennessee state report cards publishes testing data in two different ways,
growth (TVAAS) and achievement. TVAAS data were used for this study to determine student
growth. Consideration of achievement data may result in different conclusions. Limitations of
this study include schools’ scores were averaged and not individual student scores. Teachers’
years of experience was also based on the mean years of experience and not individual years of
experience. A potential limitation of the study may be that school scores for social studies and
science were not published on the state report card but were used in the overall school score. In
addition the distribution of Title I funds to schools was limited by their percentage of lower
socioeconomic students. This study was delimited to those elementary schools whose grades
range from Pre-k-5 or K-5. This study was also delimited to schools’ scores and not individual
teacher’s scores. The results may not be generalizable to schools systems or other states.
Overview of the Study
In Chapter 1 the researcher introduces the statement of the problem, research questions,
definitions, significance of the study, and overview of the study. Chapter 2 contains a review of
the literature pertaining to the history of Title I and Non-Title I schools, standardized testing,
Title I funding, Goals 2000, NCLB, RTT Initiative, Value Added System, and the Tennessee
State Value Added System. The study’s research design and method are detailed in Chapter 3.
Chapter 3 also includes population, sample and selection procedures, instrumentation, data
collection methods, and data analysis planning. Chapter 4 presents the analyses of the data in the
form of narration and figures. This chapter also addresses the null hypothesis related to each of
the 13 research questions. Finally, Chapter 5 contains the summary of findings, the conclusions,
and recommendations for further study.

23
CHAPTER 2
REVIEW OF LITERATURE
Tracing the historical roots of accountability leads back to the 1983 A Nation at Risk
report (Ravitch, 2010). According to Rudalevige (2003) Goals 2000 and NCLB were the
cumulative result of the standards and testing movement that began with the release of the
Nation at Risk report during the Reagan administration. A Nation at Risk redirected the nation,
including the state of Tennessee, on the road to continuous school reform efforts. Ravitch (2010)
referred to the report as a recommendation and not a legal mandate. States and school districts
were free to implement the report’s recommendations or ignore them completely.
High-stakes testing was given the green light by the 1994 reauthorization of the ESEA,
the Improving America’s Schools Act (IASA), which required states to develop assessments in
reading and math aligned with state standards. IASA used the results of these assessments to
determine if lower SES students were making AYP, to punish underperforming Title I schools,
and to reward schools that were making progress in terms of their disadvantaged students (Webb,
2006).
Title I has achieved some notable success in reaching many goals associated with closing
the achievement gap as well as providing an equitable education for all students. “One need only
walk into almost any high-poverty school in the United States and observe the extra resources,
materials, programs, and personnel that Title I provides” (Borman, 2003, p. 49). The purpose of
Tennessee’s federally funded Title I Part A program is to support the local school district’s
ability to improve teaching and learning for students in high-poverty schools so that the students
meet the state’s content and performance standards (TNDOE, 2014b). According to the USDOE
(2014) students at a Title I school do not have to be from a low-income family in order to benefit

24
from Title I funds. In addition, it is not possible to establish a true cause-effect relationship
between closing gaps and the improvement in Title I students’ outcomes (Borman, 2003).
Borman asserted that: 1) a meta-analysis suggests that students served by Title I would certainly
have been worse off academically without the program, and 2) The NAEP demonstrated that
educational inequality can be overcome in a relatively short time when new policies and funding
sources are targeted toward improving education and other services for disadvantaged students.
History of School Accountability
The 1954 landmark school desegregation decision in Brown v. Board of Education
jumpstarted efforts to address public school inequities. The Supreme Court ruled that the
segregation of children by race in public schools was a violation of the 14th Amendment. This
ruling opened the door for not only to African-American students but also those students from a
lower SES who had other disadvantages regardless of their race (Tyack & Cuban, 1995).
According to Hanushek and Rivkin (2009) the amendment influenced a drastic change in school
characteristics while increasing funding to African-American students who were part of the
minority student population. Considering the Brown v. Board of Education decision to place all
schools on a level educational playing field, Ravitch (1985) argued that the difference in
resources at a predominantly White school versus a predominantly Black school was very
similar, and that the social composition of the students at a school had a greater impact on the
achievement of African-American students.
During the 1960s the nation discovered and recognized that poverty existed, and the
schools were the first to be criticized—what better place to start than where the nation’s
prejudices are said to reside (Ravitch, 2010). President Johnson signed the Civil Rights Act of
1964; Title IV of this act prohibited discrimination against anyone, including students, on the

25
basis of race, color, or national origin in any institution receiving federal funds. This
monumental piece of legislation authorized a survey to determine the availability of educational
opportunities for all students who attended a publicly funded institution in the United States.
This survey, conducted by Coleman et al. (1966), was directed on behalf of Johns Hopkins
University and was named Equality of Educational Opportunity (also known as the Coleman
Report).
Findings from the Coleman Report indicated a weak relationship between school
resources and student achievement (Coleman et al., 1966). As noted by Hanushek and Rivkin
(2009), the report did nothing to link students’ achievements to the schools; instead, it focused
on the SES of the families whose children attended the school. As maintained in the Coleman
Report, the two most important variables that influenced student achievement were the
educational background and social class background of the family, and the educational
background and social class background of the other students in the school (Webb, 2006).
Brogan (2009) considered SES a concept of social class. It measured the impact that the
social environment had on a student, family, community, and school. He stated that SES
classifications are put in place to locate and determine the changing variables of inequality in our
population. SES includes various components such as parental occupational status, parental
educational attainment, and family income. The Coleman Report generated considerable
discussion until it was challenged by the updated Coleman Report of 1981. As noted by Ravitch
(1985), the updated Coleman Report of 1981 (Stedman, Chilton, Jordan, & Library of Congress,
1981) disputed the idea of SES’s impact on schools and instead found that schools make a
difference regardless of a family’s SES.

26
President Johnson initiated The War on Poverty Act in 1965 as a means to use education
to eliminate poverty. In the 1960s the poverty rate of school-aged children was 14% (Kuttner &
Rapoport, 2007), compared to 21% in 2012, as reported by the NCES (2012). The cornerstone of
the education legislation enacted as part of the War on Poverty was ESEA of 1965. The ESEA
allocated over $1 billion in funds annually to education with no strings attached. The largest
portion–Title I–received about 80% of the funds and provided assistance to local school districts
for the education of children of lower SES (Webb, 2006). As described by Viteritti (2012), this
piece of legislation was one of the first carrot and stick policies from the federal government.
President Johnson provided school districts with billions of dollars in Title I funding as an
incentive to comply with the desegregation mandate. According to Spring (1994) ESEA
described lower SES children as children who were educationally deprived. In 1965 the Title I
Act specifically stated:
The Congress hereby declares it to be the policy of the United States to provide financial
assistance... to expand and improve their educational programs by various means
(including preschool programs) which contribute particularly to meeting the special
educational needs of educationally deprived children. (Elementary and Secondary School
Act, 1965, p. 27)
Title I of the ESEA was the manifestation of the United States commitment to help
educate all children regardless of their SES (Jennings, 2000). When the ESEA took effect, $1
billion in new federal dollars began flowing into schools and school districts throughout the
country. Mathis (2010) reported that lower SES students required up to 40% more funds per
pupil than their higher SES peers. Throughout the 1960s and 1970s Title I funds increased
drastically because of public policy and the American dream that all students could achieve
excellence if given an equitable education (Jennings, 2000). Baker, Sciarra, and Farrie (2010)
argued that funding should not be the only factor when evaluating academic performance for

27
students in high poverty schools. They reiterated that schools can achieve their desired outcomes
with funding that is used efficiently and effectively.
President Reagan called for the complete elimination of the U.S. DOE while he was
campaigning for president, and in 1981 he withdrew his support for Title I funding and other
federal programs because of their strict guidelines and regulations (Clabaugh, 2004). However,
in 1981 Secretary of Education Bell had been successful in forming a commission of cabinet
level members who would study available research and data on our nation’s public schools.
Because of his indignation with the US educational system, President Reagan approved the
NCEE (1983a), hoping it would open the door to school choice or school prayer. A Nation at
Risk: The Imperative for Educational Reform, released by the NCEE (1983b), criticized the
performance of America’s educational institution in regards to the declining economy (Webb,
2006).
Bell (1993), who was President Reagan’s Secretary of Education during his first term,
revealed that his first attempt to establish a National Commission on Education was rejected by
President Reagan. Bell was a strong advocate for federal influence in educational funding and
predicted that the report on the study of the condition of our educational system would inform
and incite our country to promote federal funding, therefore making it difficult for President
Reagan to eliminate or reduce the federal role in educational funding.
A Nation at Risk consisted of research papers and interviews with national scholars
regarding our educational system. The report, as explained by Ravitch (2010), reiterated the
importance of equity in terms of SES. This notion of equity was at risk in regards to students
with a lower SES and these students should be provided with the same education and tools for

28
developing and sustaining educational success. According to A Nation at Risk: The Imperative
for Educational Reform (NCEE, 1983a):
Part of what is at risk is the promise first made on this continent: All, regardless of race
or class or economic status, are entitled to a fair chance and to the tools for developing
their individual powers of mind and spirit to the utmost. (p. 115)
During President Reagan’s second term, Secretary of Education Bennett summed up the
President’s cuts in education spending by repeatedly asserting that “public education was not
going to be improved by ‘throwing money at it’” (Clabaugh, 2004, p. 258). Bennett also
challenged the notion of poverty having any impact on educational possibilities. As clarified by
Hewitt (2008) there isn’t anything in the U.S. Constitution that creates a path to a federal role in
education. A Nation at Risk kept the DOE alive and firmly established the role of federal
influence in educational matters. As argued by Ravitch (2010) A Nation at Risk is a report
contested by many academics, educators, and pundits over whether it was a truly accurate
depiction of the American education system. However, Hewitt (2008) stated that the report
actually ignited a continuous educational reform effort that is still present today.
President Regan’s criticism was directed at the laws and strict regulations of Title I
funding and the lack of accountability. At that time Title I funds did not have specific academic
performance objectives that lower SES students were expected to meet. President Reagan,
politicians, and business leaders argued that all public institutions receiving federal funds should
be accountable for student learning (Jennings, 2000).
The goal of Title I is to provide extra instructional services and activities that support
students identified as failing or most at risk of failing the state’s challenging performance
standards in mathematics, reading, and writing (USDOE, 2014). Low-income schools or Title I
schools are the primary target of Title I funds. A school is eligible for Title I status when 40% of
the school’s students are from low income families; these students are identified by their

29
eligibility to receive free and reduced priced meals (NCES, 2015). Title I was amended in 1988
to require states to define the level of academic achievement that lower SES students should
attain in schools receiving the funds (Jennings, 2000). This amendment also provided schools
with more flexibility in terms of how the funds could be used. As summarized by Farkas and
Hall (2000), schools with 75% or more of students in poverty no longer had to directly link Title
I funds to programs that served only the lower SES students, but they could be used to improve
the achievement of all students at the school, therefore qualifying the school for school wide
program status. Schools under this status would be allowed greater latitude on how Title I funds
are spent.
In 1993 President Clinton and his administration proposed a new initiative in educational
funding coined Goals 2000, which provided federal dollars for states to develop their own
standards and their own performance assessments aligned with the standards and defined levels
of student mastery. Schwartz and Robinson (2000) questioned whether the funds from Goals
2000 used by the states and districts to promote systematic reform would improve equity and
achievement because both were difficult to measure. As Goals 2000 directed federal dollars
toward standards and assessments, an unintended form of accountability began to take shape in
many states including Tennessee. These states and their school districts began to issue report
cards to their constituents and to the general public that graded schools on specific performance
indicators (Webb, 2006).
The ideas behind Goals 2000 did not begin in Washington, DC but rather in
Charlottesville, VA at the 1989 National Educational Summit. The meeting was considered by
many as a historic event because at no other time in history did the nation’s governors and the
President meet to establish a set of national educational goals. This gathering of leaders

30
ultimately resulted in Goals 2000 (Heise 1994; Schwartz & Robinson, 2000). According to Heise
(1994) the joining together of all 51 leaders at the summit sent a strong message to the nation
that the time had come for a national standards movement. As explained by Mathis (2010) this
message also endured criticism from those who were against the growing federal role in
education. Ravitch (2015) reiterated the importance of accepting the notion that testing and
accountability would lead to better performing schools.
Goals 2000 was considered successful in its mission to provide the states with flexibility
on the expenditure of funds and to have the desired impact on Title I funding (Schwartz &
Robinson, 2000). According to Jennings (2000) President Clinton and US Secretary of Education
Riley agreed that Title I was part of the problem because it lead to instruction that emphasized
low level skills for lower SES students. Goals 2000, however, changed the eligibility threshold
for lower SES students to at least 50% (Jennings, 2000). As clarified by Farkas and Hall (2000),
Title I provided a one-on-one personalized service to lower SES students prior to the 1994
reauthorization of the ESEA that increased the number of school-wide programs that spent funds
on goods and services such as computers and reading materials.
In 1999 the congressionally required National Assessment of Title I reported positive
gains in reading and math performance since the last reauthorization of Title I. According to
Jennings (2000) the notion that Title I was responsible for raising student achievement in reading
and math was a driving force for the Clinton Administration to submit its proposal to renew Title
I and related programs. The primary mission of Goals 2000, as stated by Schwartz and Robinson
(2000), was to provide an equitable educational environment with high levels of academic
achievement for all students regardless of SES.

31
In 2001 President Bush proposed one of the most sweeping educational reform
movements since the ESEA of 1965 by creating a much larger federal presence in educational
policy and funding (Lewis, 2002). The centerpiece of President Bush’s education program was
the 2001 reauthorization of the ESEA, entitled No Child Left Behind Act (NCLB, 2002). The
NCLB Act directed federal funds to promote higher achievement of lower SES students and hold
schools accountable for the progress of all students. As stated by Mathis (2010), lower SES
students received fewer resources than higher SES students even after Title I funds were taken
into account. According to Ravitch (2015) federal funding increased by almost 60% during the
early years of NCLB. The enactment of NCLB toughened the IASA testing and accountability
provisions (Webb, 2006). NCLB was designed to force local school districts and states to pay
attention to certain at-risk lower SES groups and to increase the resources that were available to
these groups (McDonnell, 2005). As noted by Domina (2005), NCLB funding also provided an
opportunity for Title I schools to increase parental involvement.
NCLB specifically required every state to develop AYP objectives that included
statewide measureable objectives for all students and specific subgroups (Linn et al., 2002). AYP
had to be based on state assessments and also had to include an additional academic indicator.
School AYP results would be reported by the state to its constituents and most importantly
would include any significant subgroups. Jennings and Rentner (2006) maintained that the
NCLB had a positive impact because it shone a light on the poor performance of students who
would have gone unnoticed if not for the disaggregation of test data. As indicated by Abedi
(2004), the intention of NCLB to improve the academic achievement of various subgroups of
students who had, for the most part, shown minimal progress might unintentionally place
pressure on schools with large numbers of targeted subgroups. As explained by Darling-

32
Hammond (2007), high levels of lower SES students within a school had been shown to decrease
achievement of all students regardless of their race or SES. Jennings (2000) depicted the
argument of whether Title I alone could be attributed to raising student test scores among all SES
students, or whether it to blame for not closing the achievement gap between the lower and
higher SES students.
As emphasized by Manna and Ryan (2011), schools that received federal aid from the
NCLB Title I program were required to obtain or surpass AYP objectives. Otherwise, they would
be subjected to defined school improvement measures based on the years the funding was
received. Meanwhile, Darling-Hammond (2007) pointed out that higher SES schools spent much
more than lower SES schools. Viteritti (2012) argued that the data component of AYP, which
required test results to be disaggregated by subgroups, brought to the forefront great disparities
in student achievement based on income and race. McCluskey (2010) concluded that NCLB gave
states the power to lower their standards or proficiency levels in order to stay out of trouble and
continue receiving federal funding.
NCLB required each state to participate biennially in the National Assessment of
Educational Progress (NAEP) in reading and mathematics at grades 4 and 8. An expert panel at
NAEP (NCES, 2012) determined the three major components of SES: family income, parental
educational attainment, and parental occupational status. They also concluded that home
neighborhood and school SES could be used to justify the impact of SES in NAEP scores. NAEP
continued to serve as a consistent benchmark for comparing state tests and monitoring state
achievement trends (Linn et al., 2002). According to the USDOE (2005),
The results from the newest Report Card are in and the news is outstanding. Three years
ago, our country made a commitment that no child would be left behind. The 2004
National Assessment of Educational Progress (NAEP) Long-Term Trends in Academic
Progress, also known as the Nation’s Report Card, has been administered using the same

33
exact test in reading and mathematics for over 30 years. The 2004 Report Card is
evidence that No Child Left Behind is working and is helping to raise the achievement of
young students of every race and from every type of family background. And the
achievement gap that has persisted for decades in the younger years between minorities
and whites has shrunk to its smallest size in history. (p. 1)
NCLB was set to expire on September 30, 2007, but it stayed intact until a new law was
passed (USDOE, 2014). In 2008 presidential candidate Barack Obama campaigned on the
promise that his administration would oversee the rewriting of the expired NCLB Act. In 2010
President Obama and Secretary of Education Duncan put forward a revision of NCLB entitled A
Blueprint for Reform (Higham, 2013). Because NCLB was not reauthorized, the Obama
administration in 2011 provided State Educational Agencies (SEAs) with waivers from specific
parts of NCLB in exchange for certain criteria. The criteria included college and career ready
expectations for all populations of students, differentiated accountability, and including targeting
the lowest performing schools, schools with the largest achievement gaps, and other schools with
performance challenges for subgroups (USDOE, 2014).
Race to the Top
On February 17, 2009, President Obama signed the American Recovery and
Reinvestment Act (ARRA). The purpose of this act was to jumpstart the economy through
strategic investment. A key educational component of this law was Race to the Top (RTTT), an
initiative to invest in the country’s educational system and stimulate efforts to reform schools
(Boser, 2012). RTTT was a $4.5 billion competitive grant program designed to close
achievement gaps and prepare more students for college. According to Weiss (2013) some of the
key reform strategies included adopting more rigorous standards and assessments, turning around
low-performing schools, and building data systems that measured student success.
The interdependence of the NCLB and RTTT is indicated by Manna and Ryan (2011), as
President Obama and Secretary Duncan critiqued NCLB in two ways. First, NCLB aided states

34
in excusing their lower standards and proficiency levels. Second, NCLB encouraged a
collaborative approach for measuring student learning and evaluating school performance. These
critiques framed the landscape in which RTTT emerged. According to Spring (2014) RTTT is
the Obama administration’s way of achieving its political aspiration of reducing poverty and
income inequalities. Mathis (2010) considered the Obama administration’s blueprint document
as a way of stressing the importance of common standards that encourage high expectations in
contrast to earlier reform efforts that required students to achieve minimum basic skills. Viteritti
(2012) implied that the Obama administration and its use of power and resources were moving
states to national standards by guiding the states to design the standards collectively, which
allowed ownership by the states and not the federal government.
As speculated by Weiss (2013), the major provision of RTT that enables Tennessee to
identify struggling schools and provide them with the means to succeed is flawed. As stated by
Mathis (2010), the RTT grant mandates specific turnaround strategies for schools that do not
perform. These strategies include firing the principal, firing some or most of the staff, converting
the school to a charter school, or closing the school. Schools are currently labeled by their
TVAAS composite scores, which could hinder their enrollment, reputation, or existence, but this
label does not necessarily limit the amount of financial support a school receives from the federal
government. Weiss (2013) argued that none of the components of the RTT grant were designed
to support Title I schools; instead, it only exacerbates the gaps federal funding should close.
To apply for the RTTT grant states had to submit a detailed application that met certain
criteria and policies approved by the USDOE. In 2010, with support from Governor Bredesen,
the Tennessee General Assembly, and the TDOE, Tennessee passed the First to the Top (FTTT)
Act. Among other provisions FTTT removed a restriction on the use of value-added data for

35
promotion, retention, tenure, and compensation decisions (USDOE, 2013a). According to
Camera (2014) Governor Bredesen promised to use the implementation of the FTTT in
Tennessee’s favor when striving to meet the requirements of the RTTT; this legislative bill
promised to turn around its lower SES schools and initiate common standards, otherwise known
as Common Core Standards, throughout the state. In regards to data systems that measured
student success, Governor Bredesen said that Tennessee had the upper hand in the competition
because it had already had its own value added system (VAS) for the past 20 years.
Three months after Tennessee passed FTTT Tennessee and Delaware were the only
recipients of the RTTT grant to implement extensive educational reform over the next 4 years;
Delaware received approximately $100 million and Tennessee received approximately $500
million. The grant was provided in part because of Tennessee’s effort to establish FTTT
(USDOE, 2013a). According to Camera (2014) Tennessee used $44 million from the grant to
instruct more than 70,000 teachers on the comprehensive Common Core Standards. Derringer
(2010) insisted that using the Tennessee Value Added System to improve lower SES schools was
one of the components that ultimately lead Tennessee to win the RTTT grant.
In 2012 the TDOE reworked its accountability structure to align with its approved ESEA
flexibility request. The aim of this new accountability structure was based on a blending of
achievement and gap closure targets and identification of schools based on achievement scores
and value added data. Weiss (2013) noted that the advancement of the RTTT components did not
promote the economic and racial integration that would ultimately close achievement gaps.
According to the TNDOE (2015b) Tennessee’s lowest achieving schools would be categorized
as Focus and Priority schools, while schools with the highest proficiency scores and rate of
growth would be categorized as Reward schools.

36
Common Core Standards
In April 2009 representatives from 41 states, including Tennessee, met with the Council
of Chief State School Officers (CCSSO) and the National Governors Association (NGA) to
create a common set of standards for education (Mathis, 2010). NGA and CCSSO were given
the opportunity to draft the new Common Core Standards in reading and math. According to
McClusky (2010) the Common Core Standards Initiative (CCSI) was the first time that progress
was made toward developing national standards. Mathis (2010) stated that 65 people, including
one classroom teacher, were involved in the review and design. This group did not include any
administrators “because they were determined to draft standards based on the best available
research about effective math and reading curricula, rather than the opinion of any single person
or organization” (p. 2).
The mere idea of a national curriculum as it relates to the Common Core Standards
confused many educators, parents, and politicians (Spring, 2014). In a blog post entitled “Why I
cannot support the Common Core Standards,” Diane Ravitch (2013) criticized the lack of field-
testing prior to rolling out the Common Core Standards. At the same time, Ravitch was known to
support the idea of national standards as reflected in “National Standards in American Education:
A Citizens Guide.” She argued that national standards would eradicate unfair expectations for
students based on socioeconomic status or race. Mathis (2010), stated that “common standards
are an essential step toward ensuring equity and high quality learning for all children
everywhere” (p. 2).
President Obama emphasized the importance of the Common Core Standards in
preventing states from lowering expectations as they did with the NCLB (Manna, 2010).
McCluskey (2010) argued that all schools and school districts would be evaluated on the same
37
standard, instead of altering proficiency scores allowed by NCLB. In their defense of national
standards, many advocates argued that national standards would eliminate a proficiency or cut
score based on the state the student resided in, but not what knowledge they possessed. The
Common Core Standards instead designated a list of skills that students are expected to master
by the end of each grade. The Common Core Standards implementation will move classroom
instruction toward an engaging curriculum that will promote a variety of instructional techniques
that develop cognitive strategies instead of the traditional focus on worksheets, and drill and
practice (Conley, 2011).
Beginning in 2011-2012 school year Tennessee, one of the states that adopted the
Common Core Standards, was able to incorporate the standards within its curriculum in grades
K-2. During the 2012-2013 school year school districts in Tennessee partially implemented the
standards in math in grades 3-8. By 2014-2015 every school district in the state was
incorporating the Common Core Standards into its curriculum. According to President Obama’s
blueprint documents, the Common Core Standards are essential in providing students of all
socioeconomic classes with the opportunity to achieve at high levels (Mathis, 2010).
To test student performance on the Common Core Standards and state content standards,
Tennessee used the TCAP (Tennessee Comprehensive Assessment Program) Achievement Test
during the 2012-2013, 2013-2014, and 2014-2015 school years. This test is a multiple-choice
test designed to measure student achievement in four content areas: Reading/Language Arts
(Literacy), Mathematics (Numeracy), Science, and Social Studies. According to the TNDOE
(2016) a new and improved assessment program in ELA and math was adopted in 2014 to
replace the old TCAP tests. The new Assessment program is called Tennessee Ready (TN
Ready) and was administered in the 2015-2106 school year. Tennessee’s Education

38
Commissioner Candice McQueen stated, “Tennessee’s new TN Ready assessment was designed
to be nimble to allow for changes as needed in anticipation of revised standards” (Aldrich, 2016,
p. 1).
In Tennessee the Common Core State Standards are currently under review due to public
backlash and heated political debates. The Tennessee State legislature is considering a bill that
would repeal the CCSS. According to Bidwell (2015) Tennessee Governor Bill Haslam signed a
bill that would ultimately replace the Common Core Standards with “Tennessee Academic
Standards” after a thorough review process. The bill requires the state board of education to
create two committees, one of which is represented by higher education officials and the other
represented by K-12 schools. The committees would be required to recommend new English
language arts and math standards to be implemented during the 2017-2018 school year.
Newman (2015) pointed out the possibility that the Common Core Standards would be reinstated
under a new name. Instead of repealing and eliminating the standards, the legislation allows for
rebranding after the review.
Value Added System
Vaughan (2002) stated that accountability systems were unlikely to survive unless
teachers, parents, and other taxpayers believed that the criteria and processes employed in state
accountability systems were legitimate, fair, consistent, and understandable. There is evidence to
demonstrate that all students, even those from a lower SES, can succeed in the right educational
setting. At the same time it is much more challenging to raise the achievement level of lower
SES students to new standards (Ballou, Sanders, & Wright, 2004). According to Ballou et al. a
VAM would achieve the desired accountability system. The VAM is based on a students’
academic progress rather than the percentage of students able to meet an absolute standard.

39
Ballou et al., stated that the VAM measures gain from an individual student’s starting point and,
as such, it inherently controls for SES and other environmental factors.
Ravitch (2015) criticized the VAM as being technology driven in that every aspect of a
child’s learning can be identified through certain variables being computed from a certain
algorithm. Schools and teachers would be evaluated based on data regardless of the curriculum
or the real life experiences of their students. However, NCLB was frequently criticized for not
having a VAM component. Mathis (2010) disputed this criticism, saying that the idea of growth
scores having an impact on NCLB and being the answer to comparing very different groups of
students had many fundamental flaws. Subject matter content and state-created tests must be
vertically equated from grade to grade. Heck (2006) defined VAM as a growth model that tracks
student’s experiences at a particular school throughout several years rather than 1 year with a
particular teacher.
Tennessee Value Added System
In 1992, Governor McWherter signed the Education Improvement Act. This piece of
legislation provided a considerable increase in funding and an accountability system by which
the public could hold educators accountable for student academic achievement. The state
adopted a model called the Tennessee Value Added Assessment System (TVAAS) or the
Sanders Model. This VAM, developed by Sanders of the University of Tennessee, was directed
at student academic growth or gains within the district, school, and classroom levels (Baker &
Xu, 1995). According to Sanders (1998) TVAAS is a statistical method of determining the
effectiveness of school systems, schools, and teachers in continuous academic growth for student
populations. Although TVAAS was developed for Tennessee, it is frequently criticized by other

40
parts of the nation for not doing enough to control for SES and demographic factors (Ballou et
al., 2004).
The main concept of the Sanders Model is that in regards to learning outcomes the
school, school system, and teachers should be held accountable for the amount of academic gains
earned as a result of their students’ schooling. If a student enters fourth grade at a certain level of
achievement on a prior state assessment, the teacher, school, and school system are responsible
for raising the student’s average achievement level by a criterion set forth by the State
Department of Education (Bock, Wolfe, & Fisher, 1996). The idea of adding demographic and
SES variables to the TVAAS model to see if it makes any significant difference has been
suggested by many critics of the TVAAS. In response to this criticism, Ballou et al. (2004)
noted:
This solution is not, however, as straightforward as it may first appear. Students are not
assigned at random to teachers and schools. If better teachers are able to obtain jobs in
schools serving an affluent student population, or if more affluent parents seek the best
schools and teachers for their children (say, by residential location, or pressuring school
administrators to place their children in desired classes), demographic and SES variables
become proxies for teacher and school quality. Because they are correlated with
otherwise unmeasured variation in school and teacher quality, the coefficients on these
variables will capture part of what researchers are trying to measure with residuals.
Predictors of school and teacher effectiveness will accordingly be biased toward zero.
(pp. 38-39)
In this way, when state data demonstrate that students with lower SES do not gain as much from
one year to the next as their higher SES peers, it is debatable whether to attribute that to SES or
their quality of school (Ballou et al., 2004).
TVVAS is designed to follow students from Grades 4 through 8 as they transition from
school to school or school district to school district throughout Tennessee, while taking into
account the student’s community and home background. The TVAAS model overcomes this

41
predicament by directing the measurement of the student’s test performance year after year
(Bock et al., 1996).
Sanders (1998) asserted that for Grades 3 through 8 the gains for schools in Tennessee
were found to be inapplicable regarding the ethnicity of a school, the percentage of students
receiving free and reduced price lunches, and the mean achievement level of the school. These
findings confirm the idea of a student’s control of his or her achievement (the longitudinal
component of TVAAS) eliminates any variables that are not necessary. Sanders stated that
schools that perform consistently better on the TVAAS are schools that provide academic growth
opportunities for all SES students. The data have shown that these schools have successfully
identified the school’s needs and have the ability to show academic progress for all students
(Sanders, 1998). However, Heck (2006) defined school equity as the notion that school scores
are free from any factors that can introduce bias in school comparisons.
Tennessee State Report Card
According to the TNDOE (2015a) Tennessee is one of four states providing a web based
report card that provides information to all school districts. The annual report card is a
comprehensive showcase of state-, district-, and school-level data for each school year. The
TNDOE analyzes results of the TVAAS and issues these results as a component of the annual
state report card to every school in Tennessee. The report card includes subgroups such as
economically disadvantaged students, English-language learners, students with disabilities, as
well as TVAAS composite scores for individual schools.
Composite scores are based on growth for one year from the previous academic year. The
scores are given on a Likert-type scale of 1 to 5, with 1 being the lowest and 5 being the highest
score. The overall composite score includes all available data in math, reading/language arts,

42
science, and social studies. The numeracy score includes all available data in math. The literacy
score includes all available data in reading/language arts. The combined literacy and numeracy
score includes math and reading/language arts scores but excludes science and social studies
(TNDOE, 2015b).
Socioeconomic Status and Achievement
Weiss (2013) described the National Assessment of Educational Progress (NAEP) as a
rigorous and reliable sample test of reading and mathematics that is given every 2 years to a
representative sample of students in Tennessee in grades 4, 8, and 12. The NAEP is a federally
funded testing program established to measure the performance of American students in
mathematics, science, reading, and other key subjects (Kober, 2001). According to Weiss (2013)
Tennessee State Achievement tests are not as rigorous as the NAEP because of the way
Tennessee set its standards to appease or to meet the proficiencies set by NCLB. Giroux and
Schmidt (2004) noted that state accountability systems have shown evidence of increased
achievement of lower socioeconomic students.
Welner and Mathis (2015) argued that current education policy has failed our lower
socioeconomic students by ignoring the many obstacles those children face outside schools that
adversely affect their school performance. The authors also claimed that schools with an
abundance of resources can make a difference in the lives of their students of lower
socioeconomic status: “But it is not realistic to expect schools to be the nation’s primary anti-
poverty program” (p. 3). Bracey (2003) viewed the concept of summer loss as one of the
phenomena that have an effect on the achievement of students with lower socioeconomic status.
Students of higher socioeconomic status, on the other hand, show considerable gains in
mathematics and reading during the summer months. Therefore, schools that actually make

43
adequate yearly progress (AYP) will be labeled by USDOE as failing due to the decline in
achievement during the summer.
Bracey (2003) stated that the background of families and the socioeconomic mix of
students in the school have a strong influence on the academic achievement of the student
population. Kupermintz et al. (2001) further contended that factors such as “school culture and
climate, teacher qualifications, curriculum frameworks and instructional approaches all interact
jointly to produce measurable growth in student achievement skills and knowledge” (p.24).
Malecki and Demaray (2006) insisted also that evidence of student poverty is a strong indicator
of low academic performance, which places the student at risk of failing in school.
Title I Schools
In 1965 President Lyndon B. Johnson placed the importance of funding higher poverty
schools in the hands of the federal government, and many of these schools became known as
Title I schools. A Title I School is any school receiving Title I funds (Kirby, 2003). As revealed
by the National Assessment of Title I (2006), these funds may be used to pay teachers and other
instructional staff, purchase instructional materials and equipment, support parent involvement,
and fund after school programs and other programs that could raise student achievement. Every
school has a certain level of poverty measured by the percentage of students eligible for the free
and reduced priced lunch program. According to the National Assessment of Title I (2006)
schools with at least 75% of their students eligible for free and reduced price lunches are
considered high poverty schools. Low poverty schools are where fewer than 35% of the students
are eligible for free and reduced lunches. As indicated by Mathis (2010), research studies on
funding schools has shown that higher poverty schools require 20% to 40% more funds per pupil
than lower poverty schools.
44
According to Van der Klaauw (2008) Title I is the largest federal program to date. In
2005 it exceeded $12 billion and impacted more than 12.5 million students. As depicted in the
National Assessment of Title I (2006), nearly all (93%) of the nation’s school districts were
allocated Title I funding. It was first authorized for 5 years, and has been reauthorized eight
times since 1965. As reported by Farkas and Hall (2000), for many critics Title I is nothing more
than a revenue sharing program that provides funds to local school districts to assist the needs of
their lower SES students. Van der Klauuw (2008) found the allocation of Title I funding to
schools is first dispersed to the county, then school districts, and then the individual schools.
Whether the school will use Title I funds to serve individual students or the entire school as a
whole ultimately depends on the type of educational services that the individual school provides.
A school district’s poverty level determines its Title I allocation (Gordon, 2004). The
assessment of Title I allocation to districts based on poverty can be difficult, as has been reported
by previous empirical studies (Gordon, 2004). Title I funding is based on the poverty of children
from the decennial censuses of population and is updated at 10-year intervals. Thus, though the
poverty of districts can change on a continuous basis, changes to Title I allocations to a school
district only happens every 10 years.
Farkas and Hall (2000) explained how these census statistics regarding low SES children
ages 5 to 17 are the force behind Title I funding allocations at the county level. The funds are
then suballocated to school districts by state education agencies based on the number of children
from lower SES families. School districts are then able to allocate funds to individual schools
based on the number of lower SES students in each school; these schools are labeled as Title I
Schools. As implied by Lyons (2006), Title I funds do not necessary reach all the lower
socioeconomic students. Title I allocation by school districts deflects funding away from lower

45
SES students in non-Title I Schools who have academic needs similar to those students in Title I
Schools.
According to Van der Klaauw (2008) poverty in schools may be measured in one of two
ways: the number of children from families receiving welfare benefits or the number of children
eligible for free and reduced lunch under the national school lunch program. According to Lyons
(2006) school districts must evaluate all schools above a 75% poverty level for Title I funding
before they identify any other schools for funding. Schools with greater or equal to 75% poverty
are considered “highest poverty schools.” Schools with greater or equal to 50% poverty are
considered “high poverty schools.” Schools with poverty levels between 35% and 49.99% are
considered “low to medium poverty schools.” Schools with poverty levels less than 35% are
considered “low poverty schools.” As indicated by Lyons (2006) elementary schools are given
priority by school district officials. This is because elementary schools, compared to middle and
high schools, are more effective in implementing programs, activities, and remediation due to
school curriculum and schedule.
Title I funds were intended to provide additional educational services to the lower SES
students. However, Fullerton and Hochman (2011) revealed that congress discovered many
school districts were not using their Title I allocation for their lower SES students. As a result,
the federal government instituted three fiscal requirements that had a tremendous impact on Title
I allocation. According to the USDOE (2008) a school district was required to have a
Maintenance of Effort (MOE) or a comparability provision that stated its Title I schools were
comparable in services to non-Title I schools, and that the Title I funds were going to
supplement, not supplant, regular nonfederal funds. In regards to these three fiscal requirements,
McClure (2008) discovered a great deal of confusion on part of local and state school officials.

46
Part of the confusion stemmed from the absence of any published guidance or federal monitoring
concerning the fiscal requirements.
As stated by USDOE (2015), the MOE required every school district to maintain its
expenditures from state and local funds from one year to the next, thus a school district cannot
reduce spending and substitute those funds with federal funds. As stated by Wiener (2008), the
MOE provision places accountability on school districts to spend at least 90% of funding toward
the education of its students in the current year, as it has in the past. If a school district does not
met this accountability requirement and reduces its expenditures by more than 10%, the state in
turn will reduce its Title I allocation to the school district by the same amount and redistribute
the funds to other school districts.
According to Title I of ESEA of 1965 schools receiving funds under Title I must be
comparable in the services to schools that do not receive Title I funds. This requirement of
“comparability” was summed up by McClure (2008) as intended to fix certain issues such as
school districts’ placing their least qualified and least paid teachers in their lower SES schools.
As emphasized by Lyons (2006), the highest poverty schools were more likely to have more
inexperienced teachers and a higher rate of teacher attrition than lower poverty schools. As
discovered by Luebchow (2009), the more experienced teachers with advanced credentials
within a school district had seniority; therefore, they tended to transfer to low poverty schools
with more favorable conditions. There was also a greater disparity in the applicant pool of a
lower poverty school versus a higher poverty school, as more experienced applicants tended to
apply for lower poverty schools. According to Luebchow (2009) research has shown the
continued hiring of applicants with little to no experience has a negative effect on student
achievement. In conclusion, the Title I comparability provision was intended to prevent any of

47
these disparities by requiring school districts to use state and local funds to provide the same
services to both non-Title I Schools and Title I Schools. Then, once all schools in the district
were comparable in services, the district would use Title I funds to provide additional services to
meet the needs of their SES or high poverty schools.
As emphasized by Lyons (2006), the comparability provision at best encourages districts
to demonstrate in one of two ways that they are providing comparable services to Title I and
non-Title I schools. One option, which the majority of schools adopt, is a written assurance of
comparability filed with the state. This assurance is evidence or proof that a school district has
implemented salary schedules, curricular materials, and instructional programs. The second
option involves comparing the actual resources that a district provides to its Title I and non-Title
I schools. Lyons (2006) asserted that the comparability provision has watered down regulations,
inadequate enforcement, and a statutory loophole. Roza and Hill (2006) also determined that
whether a school receives adequate funding depends ultimately on the district’s allocation
practices. The average expenditure at the district level is not as important as equitable
distribution of funds among the schools. McClure (2008) stated the comparability provision is
the only current education law that stands a chance in correcting inequities in intra-district school
spending. Roza (2008) points out the importance of the comparability provision in regards to
high poverty schools. This provision is the current tool used by federal officials to hold all
school districts accountable for disbursement of funds in an equitable way.
The third provision was the supplement not supplant provision. This provision,
according to McClure (2008), began to take shape due to school districts that were using federal
money on the general needs of the school as well as paying for services that had been previously
purchased with state and local funds. Wiener (2008) emphasized the importance of this

48
provision, as it provides lower SES students with additional funds separate from state and local
funds. If state and local funds are allocated to lower SES students on an equitable basis, Title I
funds would serve their purpose and provide extra support services. Roza (2008) concluded that
federal officials began realizing that in order for Title I funds to have an impact on lower SES
students, federal funding would have to be supplementary to what state and local funds were
providing across schools.
The types of educational services provided by Title I funds are left up to the school
district and individual schools. The two most commonly used programs are the “targeted
assistance program” and the “school wide program.” Van der Klaauw (2008) pointed out that
the targeted assistance program has been the most commonly used educational service that is
financed by Title I funds. The targeted assistance program increased in popularity due to the
release of the comparability provision and the supplement, not supplant provision.
According to Van der Klaauw (2008) the most effective way for school districts to
comply with these provisions is to have a targeted assistance program in all their schools. Every
school adopted a pull-out program in which lower SES students are pulled out of their regular
classrooms to receive remedial instruction by reading specialists or a Title I teacher who was
paid entirely from Title I funds. Wang and Wong (1997) acknowledged the targeted assistance
program as a program that chose to focus Title I resources on early intervention strategies that
served lower SES students through pull out arrangements. This meant that students who were not
considered lower SES students were unable to receive any assistance from a Title I teacher, or
for example, were not allowed to use any computer equipment that was purchased with Title I
funds.

49
However, Title I schools with a school-wide program have more flexibility. The concept
of improving the entire educational program is considered a “school wide program.” Schools that
operate as school-wide programs are also referred to as School Wide Schools. These schools are
allowed to use Title I funds for all students regardless of SES status (Wang & Wong, 1997).
Under the ESEA 1994 reauthorization, “high poverty schools” were allowed to use Title I funds
to improve the entire school for all students rather than the targeted lower SES students (Kirby,
2003). “A Title I school wide program is a comprehensive reform strategy designed to upgrade
the entire educational program in a Title I school with a poverty percentage of 40 percent or
more in order to improve the achievement of the lowest achieving students” (USDOE, 2015,
para. 6). According to the National Assessment of Title I (2006) in the 2004-2005 school year,
87% of Title I students were accounted for through a school-wide program as well as 67% of all
Title I funds.
Sunderman (2006) stated that school-wide programs removed many of the major issues
schools had with integrating Title I funds into the school curriculum. However, Farkas and Hall
(2006) insisted that school-wide programs gave administrators too much freedom with how they
spent Title I funds. The possibility that an administrator could spend funds on goods and
services that the district would have paid for using state and local funds was completely ignored
by many educational reformers. As inferred by McClure (2008), all students are eligible for Title
I funds in a School Wide School. Therefore, Title I funds become general aid in high poverty
schools and did not have to target specific students or services. The USDOE (2015) has been
instrumental in persuading and advocating fund consolidation in order to promote more
flexibility in schools.

50
CHAPTER 3
METHODOLOGY
The purpose of this study was to determine whether there is a significant difference in
elementary schools’ TVAAS Composite scores between Title I and Non-Title I schools. As
Sanders (1998) revealed, aggregated data on the TVAAS has continually shown that students at
the lowest levels of achievement display more growth year to year than their peers. Specifically,
this researcher examines the impact of Title I funding on student academic growth at the
elementary level. This chapter includes a description of the research design, selection of the
population, data collection procedure, research questions, null hypotheses, data analysis
procedures, and a summary of the chapter.
Research Questions and Null Hypotheses
This nonexperimental quantitative design includes the following research questions and
null hypotheses.
Research Question 1: Is there a significant difference in schools’ overall composite
scores between Title I and Non-Title I elementary schools in Tennessee?
Ho1: There is no significant difference in schools’ overall composite scores between Title I
and Non-Title I elementary schools in Tennessee.
Research Question 2: Is there a significant difference in schools’ numeracy composite
scores between Title I and Non-Title I elementary schools in Tennessee?
Ho2: There is no significant difference in schools’ numeracy composite scores between Title I
and Non-Title I elementary schools in Tennessee.

51
Research Question 3: Is there a significant difference in schools’ literacy composite
scores between Title I and Non-Title I elementary schools in Tennessee?
Ho3: There is no significant difference in schools’ literacy composite scores between Title I
and Non-Title I elementary schools in Tennessee.
Research Question 4: Is there a significant difference in schools’ combined numeracy
and literacy composite scores between Title I and Non-Title I elementary schools in Tennessee?
Ho4: There is no significant difference in schools’ combined numeracy and literacy composite
scores combined between Title I and Non-Title I elementary schools in Tennessee.
Research Question 5: Is there a significant difference in the mean years of teaching
experience between Title I and Non-Title I elementary schools in Tennessee?
Ho5: There is no significant difference in the mean years of teaching experience between Title
I and Non-Title I elementary schools in Tennessee.
Research Question 6: Is there a significant relationship between schools’ overall
composite scores and the mean years of teaching experience for teachers in Title I
elementary schools?
Ho6: There is no significant relationship between schools’ overall composite scores and the
mean years of teaching experience for teachers in Title I elementary schools.
Research Question 7: Is there a significant relationship between schools’ overall
composite scores and the mean years of teaching experience for teachers in Non-

52
Title I elementary schools?
Ho7: There is no significant relationship between schools’ overall composite scores and the
mean years of teaching experience for teachers in Non-Title I elementary schools.
Research Question 8: Is there a significant relationship between schools’ numeracy
composite scores and the mean years of teaching experience of teachers in Title I Schools?
Ho8: There is no significant relationship between schools’ numeracy composite scores and the
mean years of teaching experience of teachers in Title I elementary schools.
Research Question 9: Is there a significant relationship between schools’ numeracy
composite scores and the mean years of teaching experience of teachers in Non- Title I
elementary schools?
Ho9: There is no significant relationship between schools’ numeracy composite scores and the
mean years of teaching experience of teachers in Non-Title I elementary schools.
Research Question 10: Is there a significant relationship between schools’ literacy
composite scores and the mean years of teaching experience for teachers in Title I elementary
schools?
Ho10: There is no significant relationship between schools’ literacy composite scores and the
mean years of teaching experience of teachers in Title I elementary schools.

53
Research Question 11: Is there a significant relationship between schools’ literacy
composite scores and the mean years of teaching experience for teachers in Non-Title I
elementary schools?
Ho11: There is no significant relationship between schools’ literacy composite scores and the
mean years of teaching experience of teachers in Non-Title I elementary schools.
Research Question 12: Is there a significant relationship between combined numeracy
and literacy composite scores and the average years of teaching experience for teachers in Title I
elementary schools?
Ho12: There is no significant relationship between combined numeracy and literacy composite
scores and the average years of teaching experience for teachers in Title I elementary
schools.
Research Question 13: Is there a significant relationship between combined numeracy
and literacy composite scores and the mean years of teaching experience for teachers in Non-
Title I elementary schools?
Ho13: There is no significant relationship between combined numeracy and literacy composite
scores and the mean years of teaching experience for teachers in Non-Title I elementary
schools.
Instrumentation
The TVAAS data for this study were collected from TNDOE state report card. According
to the TNDOE (2015) school-level TVAAS are scores that assess growth at the school level.
Scores are reported on a 1-5 scale and consist of literacy, numeracy, combined literacy and

54
numeracy, and a composite score. Each elementary school with Grades 4 and 5 receives a score
for each of these subjects. These scores are based on the Tennessee Comprehensive
Achievement Test (TCAP), a criterion referenced achievement test given in Grades 3-8. It
measures student achievement in reading/language arts, also known as literacy; math, also
known as numeracy; science; and social studies. The state of Tennessee uses the TVAAS to
analyze the increase in T-CAP scores from year to year.
The TVAAS score on the state report card is based on Sanders’s (1998) mathematical
formula that is used to calculate academic growth from one year to the next. Each grade level
and subject area has a norm target gain of 0.00, which is considered one year of growth. Because
TVAAS scores measure the amount of growth, one year of data are needed as a baseline to
calculate the gain score.
The TVAAS is a statistical analysis used to measure the impact of districts, schools, and
teachers on the academic progress of groups of students from year to year (TNDOE, 2015b).
TVAAS composites are 1-year scores reported on a scale of level 1 to level 5, whereby level 1 or
level 2 scores indicate that a school is achieving less than the expected growth, a level 3 score
indicates that a school is achieving the expected growth, and a level 4 or level 5 score indicates
that a school is exceeding the expected growth.
Each school included in the study was coded as a Title I school or non-Title I school. For
the purpose of this study, any school with an economically disadvantaged population, defined as
having greater than or equal to 75% were coded as a Title I school. Any school with an
economically disadvantaged population, defined as having less than 35% of its students eligible
for a free or reduced meal, was coded as a non-Title I school. The data for the SES were obtained
from the 2012-2013 and 2013-2014 state report cards for each school.

55
Population
The population involved in this study consisted of students in Grades 4 and 5 in the
participating county public schools. Out of all Tennessee elementary schools, 48 elementary
schools within nine school systems were selected, based on a PreK-5, K-5, or 3-5 school model,
school wide school status, and on the percent of free and reduced priced meals. These schools
had valid TVAAS scores for students in Grades 4 and 5 for the 2012-2013 and 2013-2014 school
years. The researcher chose Title I schools with an economically disadvantaged population
greater than or equal to 75% and Non-Title I schools with an economically disadvantaged
population equal to or less than 35%. The researcher collected school-wide data from the
National Center for Education Statistics and the TDOE. Each school in the state of Tennessee is
placed in its database. This database stores certain school characteristics such as number of
students, teacher to student ratio, Title I status or Non-Title I status, and per pupil expenditures.
To increase the validity of this study and provide consistent political and geographic
influences on the results, the researcher only considered schools from Tennessee. Two years of
report card data were compared independently of each other by subject area to account for any
major discrepancies that may occur from using one year of report card data. In order to account
for the gap between lower and higher SES schools, Title I schools having a SES population of
75% or greater and non-title I schools having a SES population of equal to or less than 35% were
used in this study. The school systems in this study included those from two cities (Kingsport,
and Tullahoma) and seven counties (Bradley, Hamilton, Knox, Montgomery, Rutherford,
Sullivan, and Sumner). All the elementary schools chosen to participate in this study included
grades 4 and 5. All participating schools were also on a traditional schedule, which means they

56
had a long summer break, a short winter break, and a short spring break. The selected schools
shared a similar grading scale for communicating student progress to parents.
Data Collection
For this study all schools and school systems were coded to ensure the privacy and
confidentiality of all parties involved. Schools’ TVAAS scores were retrieved from the TNDOE
using the electronic report card, which populates all data by school year. Teachers’ years of
experience was retrieved by the TNDOE and sent to researcher.
The researched obtained data for this study by using electronic reporting from the years
2012-2013 and 2013-2014 for fourth and fifth grade students through the TNDOE. To be
considered for this study schools must have had all the required data on the 2012-2013 and 2013-
2014 state report cards; elementary schools without Grades 4 and 5 or those having incomplete
data on the state report card could not become a part of this study. All elementary schools
included in this study operated on a traditional school year calendar (August-May) and were
located in Tennessee.
Tennessee publishes an electronic report card for each school system and for each school
in the district. Electronic report card information is available on the state website where a filter
can be used to review the school system and school’s report card; the website presents TVAAS
composite scores in each school profile (TNDOE, 2015a).
Data Analysis
In this quantitative nonexperimental study, the researcher compared relationships among
Title I and non-Title I elementary schools in regards to their TVAAS literacy composite scores,
numeracy composite scores, combined literacy and numeracy composite scores, and overall
composite scores. The school-wide TVAAS scores comprise some of the components on the

57
Tennessee state report card. Only schools that used Title I funds as a school-wide program were
considered for this study. This study included 2 years of interval data.
The statistical program IBM-SPSS was used to analyze data. Research Questions 1
through 5 were conducted using a series of paired t-tests to determine if there were differences in
the TVAAS score between Title I and non-Title I elementary schools for the 2012-2013 and
2013-2014 school years. Pearson correlations were used to determine if a relationship exists
between the mean years of teaching experience of teachers in Title I and Non-Title I schools and
the relationships between mean years of experience and TVAAS literacy composite scores,
numeracy composite scores, combined literacy and numeracy composite scores, and overall
composite scores. All data were analyzed at the .05 level of significance.

58
CHAPTER 4
FINDINGS
The purpose of this study was to compare Title I schools and Non-Title I schools in
regards to elementary school TVAAS composite results. All the schools were located in
Tennessee. The researcher chose 48 elementary schools within nine school systems, based on a
Pre-K-5, K-5, or 3-5 school model, school wide school status, and on the percent of free and
reduced priced meals. Data were gathered from the 2012-2013 and 2013-2014 school years.
In this chapter the data were analyzed to answer 13 research questions and 13 null
hypotheses. To provide those answers, the researcher analyzed a compilation of school-specific
data using the statistical program IBM-SPSS.
Research Question 1
Research Question 1: Is there a significant difference in the schools’ overall composite
scores between Title I and Non-Title I elementary schools in Tennessee?
Ho1: There is no significant difference in schools’ overall composite scores between
Title I and Non-Title I elementary schools in Tennessee.
A paired sample t-test was conducted to evaluate whether there was a significant
difference in the schools’ overall composite scores between Title I and Non-Title I elementary
schools for 2 consecutive years (2012-2013 and 2013-2014 school years). The results indicated
that the mean Title I school score (M = 2.83, SD = 1.23) was significantly less than the mean
Non-Title I score (M = 4.23, SD = 0.93), t(23) = 4.0, p < .001. Therefore, Ho1 was rejected.
Non-Title I elementary schools in Tennessee had a higher overall composite score than Title I
elementary schools in Tennessee. The effect size was medium (= .41).The 95% confidence
interval for the difference in means was -2.11 to -.68.

59
Figure 1 shows the distribution of Title I and Non-Title I school’s overall composite scores in the
2012-2013 and 2013-2014 school years.
Figure 1. The schools’ overall composite scores: 2012-2013 and 2013-2014 school years.
Research Question 2
Research Question 2: Is there a significant difference in the schools’ numeracy
composite scores between Title I and Non-Title I elementary schools in Tennessee?
Ho2: There is no significant difference in the schools’ numeracy composite scores between
Title I and Non-Title I elementary schools in Tennessee.

60
A paired sample t-test was conducted to evaluate whether there was a significant
difference in school’s numeracy composite scores between Title I and Non-Title I elementary
schools for 2 consecutive years (2012-2013 and 2013-2014 school years). The results indicated
that the mean Title I school score (M = 3.58, SD = 1.3) was significantly lower than the mean
Non-Title I score (M = 4.31, SD = 0.80), t(23) = 2.57, p < .001. Therefore, Ho2 was rejected.
Non-Title I elementary schools in Tennessee had a higher numeracy composite score than Title I
elementary schools in Tennessee. The effect size was small (= .22).The 95% confidence
interval for the difference in means was -1.32 to -0.142. Figure 2 illustrates the distribution of
Title I and Non-Title I schools’ numeracy composite scores in the 2012-2013 and 2013-2014
school years.

61
Figure 2. The schools’ numeracy composite scores: 2012-2013 and 2013-2014.
Research Question 3
Research Question 3: Is there a significant difference in the schools’ literacy composite
scores between Title I and Non-Title I elementary schools in Tennessee?
Ho3: There is no significant difference in the schools’ literacy composite scores between Title
I and Non-Title I elementary schools in Tennessee.
A paired sample t-test was conducted to evaluate whether there was a significant
difference in the schools’ composite literacy scores between Title I and Non-Title I elementary
schools for 2 consecutive years (2012-2013 and 2013-2014 school years). The results indicated
that the mean Title I school score (M = 2.47, SD = 1.18) was significantly lower than the mean

62
Non-Title I score (M = 3.90, SD = 0.75), t(23) = 4.81, p < .001. Therefore, Ho3 was rejected.
Non-Title I elementary schools in Tennessee had a higher literacy composite score than Title I
elementary schools in Tennessee. The effect size was medium (= .50).The 95% confidence
interval for the difference in means was -2.03 to -.81. Figure 3 shows the distribution of Title I
and Non-Title I the schools’ literacy composite scores in the 2012-2013 and 2013-2014 school
years.
Figure 3. The schools’ literacy composite scores: 2012-2013 and 2013-2014 school years.
Research Question 4
Research Question 4: Is there a significant difference in the schools’ combined

63
numeracy and literacy composite scores between Title I and Non-Title I elementary schools in
Tennessee?
Ho4: There is no significant difference in the schools’ combined numeracy and literacy
composite scores between Title I and Non-Title I elementary schools in Tennessee.
A paired sample t-test was conducted to evaluate whether there was a significant
difference in the schools’ combined numeracy and literacy composite scores between Title I and
Non-Title I elementary schools for 2 consecutive years (2012-2013 and 2013-2014 school years).
The results indicated that the mean Title I school score (M = 3.0, SD = 1.16) was significantly
lower than the mean Non-Title I score (M = 4.27, SD = .68), t(23) = 4.1, p < .001. Therefore,
Ho4 was rejected. Non-Title I elementary schools in Tennessee had a higher combined
numeracy and literacy composite score than Title I elementary schools in Tennessee. The effect
size was medium (= .42).The 95% confidence interval for the difference in means was -1.91
to -0.63. Figure 4 shows the distribution of Title I and Non-Title I schools’ combined numeracy
and literacy composite scores in the 2012-2013 and 2013-2014 school years.

64
Figure 4. The schools’ combined numeracy and literacy composite scores: 2012-2013 and 2013-
2014 school years.
Research Question 5
Research Question 5: Is there a significant difference in the mean years of teaching
experience between teachers at Title I and Non-Title I elementary schools in Tennessee?
Ho5: There is no significant difference in the mean years of teaching experience between
teachers at Title I and Non-Title I elementary schools in Tennessee.
A paired sample t-test was conducted to evaluate whether there was a significant
difference in the mean years of teaching experience between teachers at Title I and Non-Title I
elementary schools for 2 consecutive years (2012-2013 and 2013-2014 school years). The

65
results indicated that the mean Title I school score (M = 10.55, SD = 2.52) was significantly
lower than the mean Non-Title I score (M = 12.25, SD = 2.55), t(23) = 2.41, p < .001. Therefore,
Ho5 was rejected. Non-Title I elementary schools in Tennessee had a higher mean years of
teaching experience than Title I elementary schools in Tennessee. The effect size was small (=
.20).The 95% confidence interval for the difference in means was -3.16 to -.24. Figure 5
provides data for the Title I and Non-Title I schools’ mean years of teaching experience in the
2012-2013 and 2013-2014 school years.
Figure 5. Mean years of teaching experience: 2012-2013 and 2013-2014 school years.
Research Question 6
Research Question 6: Is there a significant relationship between the schools’ overall

66
composite scores and the mean years of teaching experience for teachers in Title I
elementary schools?
Ho6: There is no significant relationship between the schools’ overall composite scores and the
mean years of teaching experience for teachers in Title I elementary schools.
A Pearson correlation coefficient was computed to assess the relationship between
the schools’ overall composite scores and the mean years of teaching experience for teachers in
Title I schools. The test showed a weak positive correlation between the two variables, r (24) =
.09, p = .687. Therefore the researcher failed to reject the null hypothesis. Figure 6 summarizes
the results: there was a weak positive correlation between the schools’ overall composite scores
and the mean years of teaching experience in Title I schools.

67
Figure 6. Overall composite scores and mean years of teaching experience in Title I schools.
Research Question 7
Research Question 7: Is there a significant relationship between the schools’ overall
composite scores and the mean years of teaching experience for teachers in Non-Title I
elementary schools?
Ho7: There is no significant relationship between the schools’ overall composite scores and the
mean years of teaching experience for teachers in Non-Title I elementary schools.
A Pearson correlation coefficient was used to assess the relationship between

68
the schools’ overall composite scores and the mean years of teaching experience for teachers in
Non-Title I schools. There was a weak negative correlation between the two variables, r(24) = -
.13, p = .552. Therefore the researcher failed to reject the null hypothesis. Figure 7 summarizes
the results, showing a weak negative correlation between the schools’ overall composite scores
and the mean years of teaching experience in Non-Title I schools.
Figure 7. Overall composite scores and mean years of teaching experience in Non-Title I
schools.

69
Researching Question 8
Research Question 8: Is there a significant relationship between the schools’ numeracy
composite scores and the mean years of teaching experience of teachers in Title I Schools?
Ho8: There is no significant relationship between the schools’ numeracy composite scores and
the mean years of teaching experience of teachers in Title I elementary schools.
A Pearson correlation coefficient was computed to assess the relationship between
the Title I schools’ numeracy composite scores and the mean years of teaching experience for
their teachers. There was a weak negative correlation between the two variables, r(24) = -.11, p
= .625. Therefore the researcher failed to reject the null hypothesis. Figure 8 summarizes the
results and shows a weak negative correlation between the schools’ numeracy composite scores
and the mean years of teaching experience in Title I schools.

70
Figure 8. Numeracy composite scores and mean years of teaching experience in Title I schools.
Research Question 9
Research Question 9: Is there a significant relationship between the schools’ numeracy
composite scores and the mean years of teaching experience of teachers in Non-Title I
elementary schools?
Ho9: There is no significant relationship between the schools’ numeracy composite scores and
the mean years of teaching experience of teachers in Non-Title I elementary schools.
A Pearson correlation coefficient was computed to assess the relationship between

71
the schools’ numeracy composite scores and the mean years of teaching experience for teachers
in Non-Title I schools. The results showed there was a weak positive correlation between the
two variables, r(24) = .06, p = .797. Therefore the researcher failed to reject the null hypothesis.
Figure 9 summarizes the results, there was a weak positive correlation between the schools’
numeracy composite scores and the mean years of teaching experience in Non-Title I schools.
Figure 9. Numeracy composite scores and mean years of teaching experience in Non-Title I
schools.

72
Research Question 10
Research Question 10: Is there a significant relationship between the schools’ literacy
composite scores and the mean years of teaching experience for teachers in Title I elementary
schools?
Ho10: There is no significant relationship between the schools’ literacy composite scores and
the mean years of teaching experience of teachers in Title I elementary schools.
A Pearson correlation coefficient was computed to assess the relationship between
the schools’ literacy composite scores and the mean years of teaching experience for teachers in
Title I schools. There was a weak positive correlation between the two variables, r(24) = .10, p =
.642. Therefore the researcher failed to reject the null hypothesis. Figure 10 summarizes the
results: there was a weak positive correlation between school’s literacy composite scores and the
mean years of teaching experience in Title I schools.

73
Figure 10. Literacy composite scores and mean years of teaching experience in Title I schools.
Research Question 11
Research Question 11: Is there a significant relationship between the schools’ literacy
composite scores and the mean years of teaching experience for teachers in Non-Title I
elementary schools?
Ho11: There is no significant relationship between the schools’ literacy composite scores
and the mean years of teaching experience of teachers in Non-Title I elementary schools.
A Pearson correlation coefficient was computed to assess the relationship between
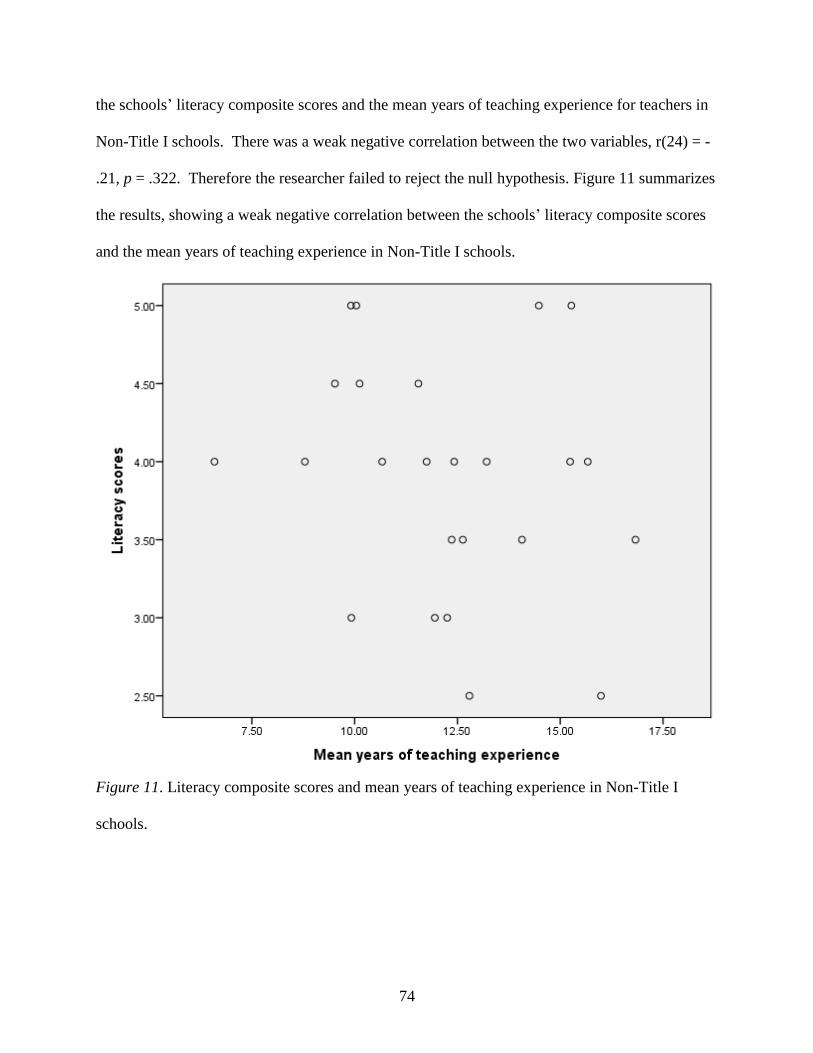
74
the schools’ literacy composite scores and the mean years of teaching experience for teachers in
Non-Title I schools. There was a weak negative correlation between the two variables, r(24) = -
.21, p = .322. Therefore the researcher failed to reject the null hypothesis. Figure 11 summarizes
the results, showing a weak negative correlation between the schools’ literacy composite scores
and the mean years of teaching experience in Non-Title I schools.
Figure 11. Literacy composite scores and mean years of teaching experience in Non-Title I
schools.

75
Research Question 12
Research Question 12: Is there a significant relationship between combined numeracy
and literacy composite scores and the average years of teaching experience for teachers in Title I
elementary schools?
Ho12: There is no significant relationship between combined numeracy and literacy composite
scores and the average years of teaching experience for teachers in Title I elementary
schools.
A Pearson correlation coefficient was computed to assess the relationship between
combined numeracy and literacy composite scores and the mean years of teaching experience for
teachers in Title I schools. There was a weak negative correlation between the two variables,
r(24) = -.01, p = .954. Therefore the researcher failed to reject the null hypothesis. Figure 12
summarizes the results: there was a weak negative correlation between combined numeracy and
literacy composite scores and the mean years of teaching experience in Title I schools.
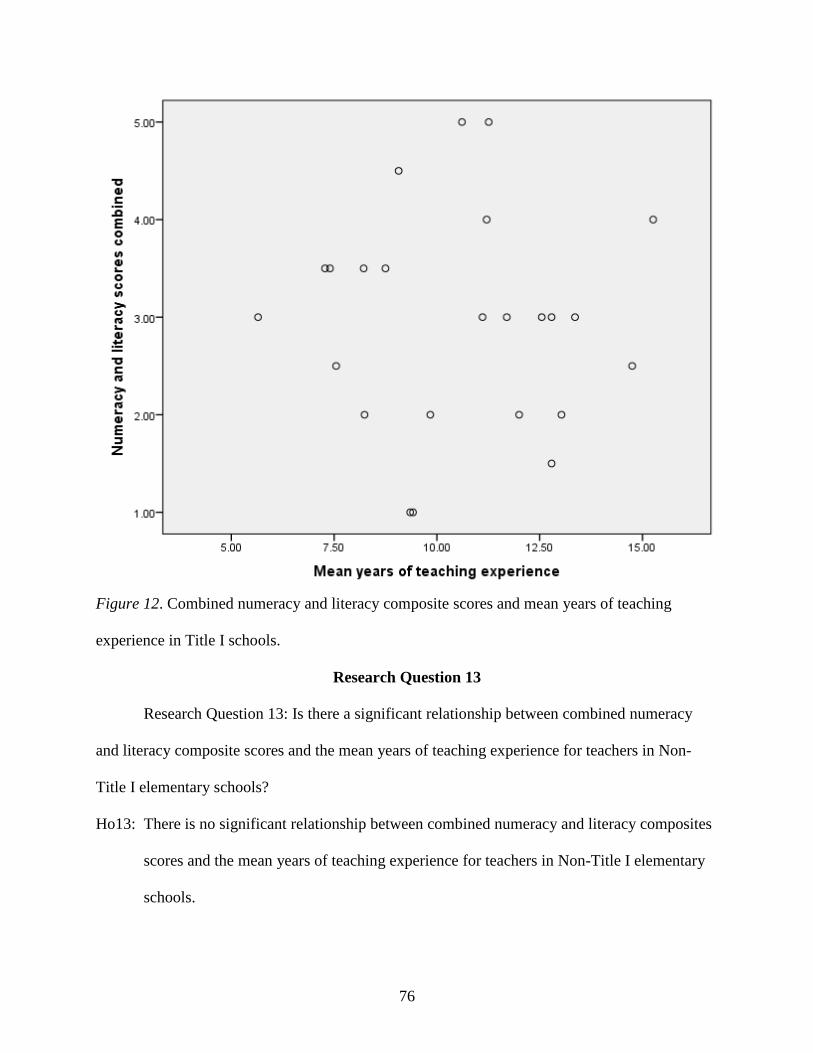
76
Figure 12. Combined numeracy and literacy composite scores and mean years of teaching
experience in Title I schools.
Research Question 13
Research Question 13: Is there a significant relationship between combined numeracy
and literacy composite scores and the mean years of teaching experience for teachers in Non-
Title I elementary schools?
Ho13: There is no significant relationship between combined numeracy and literacy composites
scores and the mean years of teaching experience for teachers in Non-Title I elementary
schools.

77
A Pearson correlation coefficient was computed to assess the relationship between
combined numeracy and literacy composite scores and the mean years of teaching experience for
teachers in Non-Title I schools. There was a weak negative correlation between the two
variables, r(24) = -.14, p = .503. Therefore the researcher failed to reject the null hypothesis.
Figure 13 summarizes the results: there was a weak negative correlation between combined
numeracy and literacy composite scores and the mean years of teaching experience in Non-Title
I schools.
Figure 13. Combined numeracy and literacy composite scores and mean years of teaching
experience in Non-Title I schools.
78
CHAPTER 5
SUMMARY, CONCLUSION, AND RECOMMENDATIONS
Chapter 5 contains the findings, conclusions, and recommendations for readers who may
use the results of this study to evaluate Title I funding and its relationship to achievement in their
school system. The purpose of this study was to compare Title I schools and Non-Title I schools
in regards to elementary school TVAAS composite results. The study was conducted using data
retrieved from the Tennessee State Report Card on school TVAAS composite scores as well as
data from TNDOE on the mean years of teaching experience in each elementary school in the
study.
Summary
The statistical analysis reported in the study was based on 13 research questions
presented in Chapters 1 and 3. Each research question had a corresponding null hypothesis. The
researcher used a paired t-test to answer research questions 1 through 5. Research questions 6
through 13 were analyzed using a Pearson correlation coefficient. The researcher selected 48
elementary schools within nine school systems, based on a Pre K-5, K-5, or 3-5 school model,
school wide school status, and the percent of free and reduced priced meals The schools were
located in Tennessee. Data were gathered for the 2012-2013 and 2013-2014 school years. To
make the study more specific, only schools that used Title I funds as a school-wide program
were considered for this study. To account for the gap between lower and higher SES schools,
Title I schools having a SES population of 75% or greater and Non-Title I schools having a SES
population equal to or less than 35% were used in this study. The purpose of the study was to
determine if there was a relationship between Title I funding and elementary school academic
growth in Tennessee.

79
As a result of the analyses, the researcher determined that non-Title I schools had a
significantly higher composite score than Title I schools. The results also supported the findings
of Welner and Mathis (2015), who argued that current education policy has failed our lower
socioeconomic students by ignoring the many obstacles those children face outside schools that
adversely affect their school performance. This study contributes to the growing body of
research that substantiates the impact of environmental factors that lead to school performance.
The 13 research questions and findings are summarized in the following section.
Research Question 1: Is there a significant difference in the schools’ overall composite
scores between Title I and Non-Title I elementary schools in Tennessee?
There was a significant difference (p < .001) in the schools’ overall composite scores
between Title I and Non-Title I elementary schools in Tennessee. The analysis revealed that the
mean overall composite score for Non-Title I elementary schools in Tennessee was greater than
the mean overall composite score for Title I elementary schools in Tennessee. Therefore, Non-
Title I elementary schools in Tennessee had a higher overall composite score.
Research Question 2: Is there a significant difference in the schools’ numeracy
composite scores between Title I and Non-Title I elementary schools in Tennessee?
There was a significant difference (p = .017) in the schools’ numeracy composite scores
between Title I and Non-Title I elementary schools in Tennessee. The analysis revealed that the
mean numeracy composite score for Non-Title I elementary schools in Tennessee was greater
than the mean numeracy composite score for Title I elementary schools in Tennessee. Therefore,
Non-Title I elementary schools in Tennessee had a higher numeracy composite score.

80
Research Question 3: Is there a significant difference in the schools’ literacy composite
scores between Title I and Non-Title I elementary schools in Tennessee?
There was a significant difference (p < .001) in the schools’ literacy composite scores
between Title I and Non-Title I elementary schools in Tennessee. The analysis revealed that the
mean literacy composite score for Non-Title I elementary schools in Tennessee was greater than
the mean literacy composite score for Title I elementary schools in Tennessee. Therefore, Non-
Title I elementary schools in Tennessee had a higher literacy composite score.
Research Question 4: Is there a significant difference in the schools’ combined numeracy
and literacy composite scores between Title I and Non-Title I elementary schools in Tennessee?
There was a significant difference (p < .001) in the schools’ combined numeracy and
literacy composite scores between Title I and Non-Title I elementary schools in Tennessee. The
analysis revealed that the mean combined numeracy and literacy composite score for Non-Title I
elementary schools in Tennessee was greater than the mean combined numeracy and literacy
composite score for Title I elementary schools in Tennessee. Therefore, Non-Title I elementary
schools in Tennessee had a higher combined numeracy and literacy composite score.
Research Question 5: Is there a significant difference in the mean years of teaching
experience between Title I and Non-Title I elementary schools in Tennessee?
There was a significant difference (p < .001) in the mean years of teaching experience
between Title I and Non-Title I elementary schools in Tennessee. The analysis revealed that the
number of mean years of teaching experience for Non-Title I elementary schools in Tennessee
was greater than that for Title I elementary schools in Tennessee. Therefore, Non-Title I
elementary schools in Tennessee had a greater number of years of teaching experience.

81
Research Question 6: Is there a significant relationship between the schools’ overall
composite scores and the mean years of teaching experience for teachers in Title I elementary
schools?
The Pearson correlation of .09 indicated a weak positive relationship between the
schools’ overall composite scores and the mean years of teaching experience for teachers in Title
I elementary schools.
Research Question 7: Is there a significant relationship between the schools’ overall
composite scores and the mean years of teaching experience for teachers in Non-Title I
elementary schools?
The Pearson correlation of -.13 indicated a weak negative relationship between the
schools’ overall composite scores and the mean years of teaching experience for teachers in Non-
Title I elementary schools.
Research Question 8: Is there a significant relationship between the schools’ numeracy
composite scores and the mean years of teaching experience of teachers in Title I Schools?
The Pearson correlation of -.11 indicated a weak negative relationship between the
schools’ numeracy composite scores and the mean years of teaching experience for teachers in
Title I elementary schools.
Research Question 9: Is there a significant relationship between the schools’ numeracy
composite scores and the mean years of teaching experience of teachers in Non-Title I
elementary schools?
The Pearson correlation of .06 indicated a weak positive relationship between the
schools’ numeracy composite scores and the mean years of teaching experience for teachers in
Non-Title I elementary schools.

82
Research Question 10: Is there a significant relationship between the schools’ literacy
composite scores and the mean years of teaching experience for teachers in Title I elementary
schools?
The Pearson correlation of .10 indicated a weak positive relationship between the
schools’ literacy composite scores and the mean years of teaching experience for teachers in
Title I elementary schools.
Research Question 11: Is there a significant relationship between the schools’ literacy
composite scores and the mean years of teaching experience for teachers in Non-Title I
elementary schools?
The Pearson correlation of -.21 indicated a weak negative relationship between the
schools’ literacy composite scores and the mean years of teaching experience for teachers in
Non-Title I elementary schools.
Research Question 12: Is there a significant relationship between combined numeracy
and literacy composite scores and the average years of teaching experience for teachers in Title I
elementary schools?
The Pearson correlation of -.01 indicated a weak negative relationship between combined
numeracy and literacy composite scores and the mean years of teaching experience for teachers
in Title I elementary schools.
Research Question 13: Is there a significant relationship between combined numeracy
and literacy composite scores and the mean years of teaching experience for teachers in Non-
Title I elementary schools?

83
The Pearson Correlation of -.14 indicated a weak negative relationship between
combined numeracy and literacy composite scores and the mean years of teaching experience for
teachers in Non-Title I elementary schools.
Conclusion
The purpose of this study was to investigate the relationship in elementary school
TVAAS Composite scores between Title I schools and Non-Title I schools. Specifically, this
research assessed the relationship of Title I funding on student academic growth at the
elementary level.
The following conclusions were based upon the findings from the data of this study:
1. There was a significant difference in the schools’ overall composite scores
between Title I and Non-Title I elementary schools in Tennessee. Non-Title I
elementary schools in Tennessee had a higher overall composite score. This
difference in schools composite scores did agree with research that
demonstrated the influence of socioeconomic status has on school
achievement. Bracey (2003) concluded that the background of families and
the socioeconomic mix of students in the school have a strong influence on
the academic achievement of the student population. With this difference in
mind, Farkas and Hall (2000) reported Title I is nothing more than a revenue
sharing program that provides funds to local school districts to assist the needs
of their SES students.
2. There was a significant difference in the mean years of teaching experience
between Title I and Non-Title I elementary schools in Tennessee. Non-Title I
elementary schools in Tennessee had a greater number of years of teaching

84
experience. This finding is the same as what is found in the literature. For
example, Lyons (2006) pointed out that Title I schools were more likely to
have more inexperienced teachers and a higher rate of teacher attrition than
low poverty schools. As discovered by Luebchow (2009), more experienced
teachers with advanced credentials within a school district had seniority;
therefore, they tended to transfer to low poverty schools with more favorable
conditions. Further study in this area would be recommended to determine if
there in fact was a significant difference in teachers’ advanced credentials
between Title I and Non-Title I elementary schools
3. There were no significant relationships between the schools’ composite scores
and the mean years of teaching experience for teachers in Title I and Non-
Title I elementary schools. This finding was contradictory for what was found
in other research. For example, Luebchow (2009) found the continued hiring
of applicants with little to no experience has a negative effect on student
achievement. According to Kirby (2003) Title I schools were more likely to
have a greater percentage of inexperienced teachers than non-Title I schools.
Baker, Sciarra, and Farrie (2010) argued that funding should not be the only
factor when evaluating academic performance for students in high poverty
schools. They reiterated that schools can achieve their desired outcomes with
funding that is used efficiently and effectively.
Recommendations for Practice
Title I funding in lower SES schools has increased throughout the years with each
legislative measure. Although there have been studies on Title I, school achievement, and school

85
assessments there have been limited studies on Title I funding’s true effect on school value
added growth. The fact that there was a significant difference in the schools’ composite scores
between Title I and Non-Title I elementary schools in Tennessee keeps alive the debate on
whether Title I funding alone has an impact on school’s academic growth. As Darling-
Hammond (2007) pointed out, schools with a higher level of lower SES students had been shown
to decrease in achievement of all students regardless of their race or SES. The present study
provides a tool with which the state of Tennessee can better use preexisting value-added data to
determine if Title I funding is being used to improve lower SES school performance.
McClure (2008) explained the requirement of comparability as a means to resolve the
issue with school districts placing their least qualified and least paid teachers in their lower SES
schools. The data revealed that the mean number of years of teaching experience for Non-Title I
elementary schools in Tennessee was greater than the same number for Title I elementary
schools in Tennessee. The fact that lower SES students had less experienced teachers than the
higher SES students raises the question of whether school districts are complying with the
requirement of comparability. According to Title I of ESEA of 1965, schools receiving funds
under Title I must be comparable in the services to schools that do not receive Title I funds. In
fact, the results of the analysis did not show a positive relationship between the schools’
composite scores and the mean years of teaching experience for teachers in Title I and Non-Title
I schools. In the review of literature most sources concluded that it is the obstacles students face
outside the school that affect their school performance as opposed to the level of funding at the
school level. Some implications for practice are the following:

86
1. Policymakers should undertake and make public an examination of where Title I
funds are being spent and how. This information is available online, it is not intuitive
for the average consumer of information to locate and disaggregate it.
2. The assignment and hiring of teachers to a particular school is an important variable
that research has shown to have the most impact on student achievement. Districts
have control over how they assign teachers. Title I schools need the most
experienced and best teachers. Districts should evaluate teachers’ years of experience
in each school to determine if any schools have an advantage or disadvantage.
3. Instead of using a school wide approach, Further research should be replicated using
Title I funds that is allocated for individual students and programs.
4. Parents and the public should become better consumers of data by studying the
patterns and trends of district Title I spending. As depicted in the National
Assessment of Title I (2006), nearly all (93%) of the nation’s school districts were
allocated Title I funding. Many have criticized the Title I program as nothing more
than a revenue sharing program that provides funds to local school districts to assist
the needs of their lower SES students.
5. School districts should implement a plan to use funds to influence students outside
the school rather than in the classroom. Lyons (2006) agreed that elementary schools
are given priority by school officials when distributing Title I funding. Elementary
schools, as compared to middle and high schools, are more effective in implementing
programs, activities, and remediation due to school curriculum and schedule. School
districts should host summer school or afterschool programs to assist lower SES
students to increase their academic growth. Bracey (2003) argued the growth in math

87
and reading of higher SES students during the summer months as an indication of
how important those summer months are for the lower SES population.
Recommendations for Further Research
This study has enabled the researcher to identify the following recommendations for
future research for those interested in the impact that Title I funding has on school growth scores.
1. This study should be replicated in other states that use value added scores to evaluate
their schools to further validate its results and strengthen the body of research
surrounding Title I funding and value added growth.
2. This study should be replicated by expanding the range of schools as this study only
included elementary schools. Studies that examine these relationships in middle
schools would provide more information for better decision-making.
3. This study should be replicated using data that include composite scores for
elementary schools in Tennessee during the schools years that required full
implementation of Common Core Standards.
4. This study should be replicated by further investigating the relationship of size
(number of students) and achievement. Other variables such as school size and class
size may also be significantly related to school value added growth.
5. This study should be replicated by conducting research on elementary schools that
use Title I funding for summer school and after school enrichment programs for
lower SES.

88
6. Additional research could be conducted on school districts in Tennessee using
qualitative research to further investigate factors outside the school that impact lower
SES school performance.
7. Further quantitative research may be conducted to expand research concerning value
added models in other states.
8. Further quantitative studies could be conducted on TVAAS composite scores for
individual grades in elementary schools in Tennessee.
9. Additional research could be conducted on rural school districts in Tennessee
regarding teachers’ years of experience.
10. Additional research could be conducted on urban school districts in Tennessee
regarding teachers’ years of experience.

89
REFERENCES
Abedi, J. (2004). The No Child Left Behind Act and English language learners: Assessment and
accountability issues. Educational Researcher, 33(1), 4-14. Retrieved January 25, 2014
from
http://web.stanford.edu/~hakuta/Courses/Ed205X%20Website/Resources/Abedi%20Ed%
20Researcher%202004.pdf
Aldrich, Marta W. (2016, January 26). After more than a year of review, here’s what’s being
recommended to revise Common Core in Tennessee. Chalkbeat Tennessee. Retrieved on
February 20, 2016 from http://tn.chalkbeat.org/2016/01/26/after-more-than-a-year-of-
review-in-tennessee-heres-whats-being-recommended-to-revise-common-
core/#.VtYj1ZwrLcu
American Psychological Association (APA). (2015). Socioeconomic status. Washington, DC:
Author. Retrieved July 17, 2015, from http://www.apa.org/topics/socioeconomic-status/
Baker, A. P., & Xu, D. (1995). The measure of education: A review of the Tennessee value
added assessment system. Nashville, TN: Office of Education Accountability.
(ED388697). Retrieved March 21, 2015 from
http://files.eric.ed.gov/fulltext/ED388697.pdf
Baker, B. D., Sciarra, D. G., & Farrie, D. (2010). Is school funding fair? A national report card.
Newark, NJ: Education Law Center. Retrieved February 5, 2015 from
http://www.schoolfundingfairness.org/National_Report_Card.pdf
Ballou, D., Sanders, W., & Wright, P. (2004). Controlling for student background in value-added
assessment of teachers. Journal of Educational and Behavioral Statistics, 29(1), 37-65.
Retrieved February 8, 2014 from
http://www.researchgate.net/publication/228724761_Controlling_for_Student_Backgrou
nd_in_Value-Added_Assessment_of_Teachers
Bell, T. H. (1993). Reflections one decade after a nation at risk. Phi Delta Kappan, 74(8), 592-
597. Retrieved November 3, 2013 from
http://search.proquest.com.iris.etsu.edu:2048/docview/218497645?OpenUrlRefId=info:xr
i/sid:primo&accountid=10771
Bidwell, A. (2015,May 12). Tennessee governor signs bill stripping Common Core. U.S News
and World Report. Retrieved February 24, 2016 from
http://www.usnews.com/news/articles/2015/05/12/tennessee-gov-bill-haslam-signs-bill-
removing-common-core-standards
Bock, R. D., Wolfe, R. G., & Fisher, T. H. (1996). A review and analysis of the Tennessee value-
added assessment system. Nashville, TN: Comptroller of the Treasury. Retrieved May,
20, 2014 from http://www.comptroller.tn.gov/Repository/RE/tvaascp1.pdf

90
Borman, G. D. (2003). How can Title I improve achievement? Educational Leadership, 60(4),
49-53. . Retrieved March 12, 2014 from http://eric.ed.gov/?id=EJ659153
Boser, U. (2012). Race to the top: What have we learned from states so far? A state-by-state
evaluation of race to the top performance. Washington, DC: Center for American
Progress. (ED535605). Retrieved February 7, 2014 from
http://files.eric.ed.gov/fulltext/ED535605.pdf
Bracey, G. W. (2003). Inequality from the get go. Phi Delta Kappan, 84(8), 635. Retrieved on
January 20, 2016 from
http://search.proquest.com/openview/9bb29fbc4ff35527a883309f71831dc1/1?pq-
origsite=gscholar&cbl=41842
Bracey, G. W. (2003). On the death of childhood and the destruction of public schools.
Portsmouth, NH: Heinemann. Retrieved on January 25, 2016 from
http://www.heinemann.com/shared/onlineresources/e00602/chapter1.pdf
Bracey, G. W. (2008). Disastrous legacy: Aftermath of a nation at risk. Dissent, 55(4), 80-83.
doi:10.1353/dss.2008.0011. retrieved January 10, 2015 from
https://muse.jhu.edu/article/441133/summary
Braun, H. I. (2005). Policy information perspective – Using student progress to evaluate
teachers: A primer on value-added models. Princeton, NJ: Educational Testing Service.
Retrieved February 25, 2015 from http://www.ets.org/Media/Research/pdf/PICVAM.pdf
Brogan, R. (2009). Socioeconomic status. Education.com. Retrieved February 11, 2015 from
http://www.chs.bismarckschools.org/uploads/resources/20661/socioeconomic-status-_-
education.com%5B1%5D.pdf
Camera, L. (2014). Tennessee on dogged path to race to top finish. Education Week, 33(36), 1,
28-30. Retrieved July 24, 2015 from
http://www.edweek.org/ew/articles/2014/07/09/36tennessee_ep.h33.html
Clabaugh, G. K. (2004). The educational legacy of Ronald Reagan: The cutting edge.
Educational Horizons, 82(4), 256-259. (EJ684842). Retrieved March 2, 2015 from
http://files.eric.ed.gov/fulltext/EJ684842.pdf
Coleman, J. S., Campbell, E. Q., Hobson, C. J., McPartland, J., Mood, A. M., Weinfeld, F. D., &
York, R. L. (1966). Equality of educational opportunity. Washington, DC: US
Department of Health, Education, and Welfare, Office of Education. (ED012275).
Retrieved February 9, 2015 from http://files.eric.ed.gov/fulltext/ED012275.pdf
Conley, D. T. (2011). Building on the common core. Educational Leadership, 68(6), 16-20.
Retrieved February 19, 2016 from http://www.rpdp.net/files/ccss/ELA/9-
12%20ELA%20Journal%20Articles/Building%20on%20Common%20Core-
ascd%20article.pdf

91
Darling-Hammond, L. (2007). Race, inequality and educational accountability: The irony of ‘No
Child Left Behind.’ Race Ethnicity and Education, 10(3), 245-260. Retrieved February
20, 2015 from http://www.tandfonline.com/doi/abs/10.1080/13613320701503207
Derringer, P. (2010). RTT in Tennessee: Assessment done right. Technology & Learning, 31(1),
40. Retrieved February 22, 2014 from http://www.techlearning.com/news/0002/rtt-in-
tennessee/58987
Domina, T. (2005). Leveling the home advantage: Assessing the effectiveness of parental
involvement in elementary school. Sociology of Education, 78(3), 233-249. Retrieved
February 11, 2015 from http://www.education.uci.edu/person/domina_t/docs/TD-
SOE.pdf
Eckert, J. M., & Dabrowski, J. (2010). Should value-added measures be used for performance
pay. Phi Delta Kappan, 91(8), 88-92. Retrieved January 12, 2015 from
http://166.78.18.218/sites/default/files/Eckert_Kappan_May2010.pdf
Elementary and Secondary School Act, 20 U.S.C. 239; PL 89-10; 79 STAT. SEC. 201. (1965).
Retrieved June 6, 2015 from http://www.gpo.gov/fdsys/pkg/STATUTE-
79/pdf/STATUTE-79-Pg27.pdf
Farkas, G., & Hall, L. S. (2000). Can Title I attain its goal? Brookings Papers on Education
Policy 2000, 3, 59-123. Retrieved March 17, 2015 from
http://muse.jhu.edu/journals/brookings_papers_on_education_policy/v2000/2000.1farkas.
Finn, C. E., & Petrilli, M. J. (2011). ESEA briefing book. Washington, DC: Thomas B. Fordham
Institute. (ED519170). Retrieved February 7, 2014 from
http://files.eric.ed.gov/fulltext/ED519170.pdf
Fullerton, J., Hochman, D., & Education, M. I. (2011). Title I fiscal requirements and school
district management: The consequences of intergovernmental distrust. Retrieved May
20, 2015 from https://www.americanprogress.org/wp-
content/uploads/events/2011/03/av/intergovernmental.pdf
Glazerman, S., Loeb, S., Goldhaber, D., Staiger, D., Raudenbush, S., & Whitehurst, G. (2010).
Evaluating teachers: The important role of value-added. Washington, DC: Brown Center
on Education Policy at Brookings. (ED512829). Retrieved January 25, 2014 from
http://www.brookings.edu/~/media/Files/rc/reports/2010/1117_evaluating_teachers/1117
_evaluating_teachers.pdf
Giroux, H. A., & Schmidt, M. (2004). Closing the achievement gap: A metaphor for children left
behind. Journal of Educational Change, 5(3), 213-228. Retrieved November 2, 2015
from http://www.sfu.ca/~dlaitsch/courses/962/giroux.pdf

92
Gordon, N. (2004). Do federal grants boost school spending? Evidence from Title I. Journal of
Public Economics, 88(9), 1771-1792. Retrieved June 2, 2014 from
http://escholarship.org/uc/item/88p0q4q4
Hanushek, E. A., & Rivkin, S. G. (2009). Harming the best: How schools affect the Black-White
achievement gap. Journal of Policy Analysis and Management, 28(3), 366-393. Retrieved
February 26, 2015 from http://onlinelibrary.wiley.com/doi/10.1002/pam.20437/abstract
Heck, R. H. (2006). Assessing school achievement progress: Comparing alternative approaches.
Educational Administration Quarterly, 42(5), 667-699. Retrieved Feb 7, 2015 from
http://www.ncaase.com/docs/Heck2006.pdf
Heise, M. M. (1994). Goals 2000: Educate America Act: The federalization and legislation of
educational policy. Fordham Law Review, 63(2), 345-381. Retrieved February 9, 2015
from http://ir.lawnet.fordham.edu/cgi/viewcontent.cgi?article=3133&context=flr
Hewitt, T. W. (2008). Speculations on a nation at risk: Illusions and realities. Phi Delta Kappan,
89(8), 575-579. Retrieved May 7, 2012 from
http://search.proquest.com/openview/faa6b2507ac4e94c9b7918ff4307f8f0/1?pq-
origsite=gscholar&cbl=41842
Higham, M. (2013). No Child Left Behind revisions not expected until 2015. San Diego, CA:
Independent Voter Network. Retrieved March 21, 2014, from
http://ivn.us/2013/02/12/no-child-left-behind-revisions-not-expected-until-2015/
Jennings, J., & Rentner, D.S. (2006). Ten big effects of the No Child Left Behind act on public
schools. Phi Delta Kappan, 88(2), 110-113. Retrieved February 25 , 2015 from
http://www.pdkmembers.org/members_online/publications/Archive/pdf/k0610jen.pdf
Jennings, J. F. (2000). Title I: Its legislative history and its promise. Phi Delta Kappan, 81(7),
516-522. Retrieved July 8th 2013 from
https://books.google.com/books?hl=en&lr=&id=UXuRAgAAQBAJ&oi=fnd&pg=PA1&
dq=Title+I:+Its+legislative+history+and+its+promise&ots=pOc7V6U62F&sig=cNkb4v
VHHHwYXwWcpFnK5ayulog#v=onepage&q=Title%20I%3A%20Its%20legislative%2
0history%20and%20its%20promise&f=false
Jimenez-Castellanos, O. (2010). Relationship between educational resources and school
achievement: A mixed method intra-district analysis. The Urban Review, 42(4), 351-371.
Retrieved March 11, 2014 from http://link.springer.com/article/10.1007/s11256-010-
0166-6#page-1
Kirby, S. N., McCombs, J. S., Naftel, S., & Murray, S. E. (2003). A snapshot of Title I Schools,
2000-01. Retrieved July 8, 2014 from http://files.eric.ed.gov/fulltext/ED483001.pdf
93
Kober, N. (2001). It takes more than testing: Closing the achievement gap. A Report of the
Center on Education Policy. Retrieved October 8, 2014 from
http://files.eric.ed.gov/fulltext/ED454358.pdf
Kupermintz, H., Shepard, L., & Linn, R. (2001). Teacher effects as a measure of teacher
effectiveness: Construct validity considerations in TVAAS (Tennessee Value Added
Assessment System). Retrieved February 18, 2016 from
http://files.eric.ed.gov/fulltext/ED458295.pdf
Kuttner, R., & Rapoport, M. (2007). Ending poverty in America. The American Prospect, 18(5),
A1. Retrieved November 20, 2014 from
http://www.lexisnexis.com.iris.etsu.edu:2048/hottopics/lnacademic/?verb=sr&csi=16134
1&sr=HEADLINE(Ending+poverty+in+America.)%2BAND%2BDATE%2BIS%2B200
7
Lewis, A. C. (2002). Washington commentary-new ESEA extends choice to school officials. Phi
Delta Kappan, 83(6), 423. Retrieved September 12, 2014 from
https://www.questia.com/library/journal/1G1-82782372/washington-commentary-new-
esea-extends-choice-to
Linn, R. L., Baker, E. L., & Betebenner, D. W. (2002). Accountability systems: Implications of
requirements of the No Child Left Behind Act of 2001. Educational Researcher, 31(6), 3-
16. Retrieved March 25, 2013 from
http://www.cse.ucla.edu/products/Reports/TR567.pdf
Luebchow, L. (2009). Equitable resources in low income schools: Teacher equity and the Federal
Title I comparability requirement. New America Foundation. Retrieved December 2,
2013 from http://files.eric.ed.gov/fulltext/ED544680.pdf
Lyons, J. E. (2006). Fiscal equity under Title I and Non-Title I schools in local school
districts. No Child Left Behind and Other Federal Programs for Urban School
Districts, 9, 1.
Malecki, C. K., & Demaray, M. K. (2006). Social support as a buffer in the relationship between
socioeconomic status and academic performance. School Psychology Quarterly, 21(4),
375. Retrieved on January 28, 2016 from http://psycnet.apa.org/journals/spq/21/4/375/
Manna, P., & Ryan, L. L. (2011). Competitive grants and educational federalism: President
Obama’s Race to the Top program in theory and practice. Publius: The Journal of
Federalism, 41(3), 522-546. Retrieved February 21, 2015 from
http://pmanna.people.wm.edu/research/Manna%26Ryan2011Publius.pdf
Mathis, W. J. (2010). The “common core” standards initiative: An effective reform tool? Boulder
and Tempe: Education and the Public Interest Center & Education Policy Research Unit.
Retrieved February 21, 2015 from http://epicpolicy.org/publication/common-core-
standards

94
McClure, P. (2008). The history of educational comparability in Title I of the Elementary and
Secondary Education Act of 1965. Ensuring Equal Opportunity in Public Education, 9.
Retrieved April 10, 2014 from https://cdn.americanprogress.org/wp-
content/uploads/issues/2008/06/pdf/comparability.pdf#page=15
McCluskey, N. (2010). Behind the curtain: Assessing the case for national curriculum standards.
Policy Analysis No. 661. Washington, DC: The Cato Institute. Retrieved February 22,
2015 from http://object.cato.org/sites/cato.org/files/pubs/pdf/pa661.pdf
McDonnell, L. M. (2005). No Child Left Behind and the federal role in education: Evolution or
revolution? Peabody Journal of Education, 80(2), 19-38.
National Center for Educational Statistics (NCES). (2012). Improving the measurement of
socioeconomic status for the national assessment of educational progress: A theoretical
foundation. Washington, DC: Author. Retrieved March 7, 2015 from
http://nces.ed.gov/nationsreportcard/pdf/researchcenter/Socioeconomic_Factors.pdf
National Center for Educational Statistics (NCES). (2015). Fast Facts: Title I. Washington, DC:
Author. Retrieved February 8, 2015 from http://nces.ed.gov/fastfacts/display.asp?id=158
National Commission on Excellence in Education (NCEE). (1983). A Nation at Risk: The
imperative for educational reform. Washington, DC: US Government Printing Office.
(ED226006). Retrieved February 7, 2015 from http://purl.access.gpo.gov/GPO/LPS3244
Newman, A. (2015, April 23). Tennessee to replace Common Core, but it will likely be back.
New American. Retrieved on February 26, 2016 from
http://www.thenewamerican.com/culture/education/item/20726-tennessee-to-replace-
common-core-but-it-will-likely-be-back
No Child Left Behind Act of 2001 (NCLB), 20 U.S.C. 6301; PL107-110; 115 STAT. 1425
(2002). Retrieved January 17, 2014 from
http://www2.ed.gov/policy/elsec/leg/esea02/107-110.pdf
Obama, B. (2011). Obama’s 2011 state of the union address. Washington, DC: The White
House. Retrieved March 11, 2015 from https://www.whitehouse.gov/the-press-
office/2011/01/25/remarks-president-state-union-address
Owens, D. E. (2010). Tennessee consolidated state application accountability workbook.
Nashville: Tennessee Department of Education. Retrieved March 22, 2014, from
http://www2.ed.gov/admins/lead/account/stateplans03/tncsa.pdf
Ravitch, D. (1985). The schools we deserve: Reflections on the educational crises of our time.
New York, NY: Basic.
Ravitch, D. (2010). The death and life of the great American school system: How testing and
choice are undermining education. New York, NY: Basic.
95
Ravitch, D. (2013). Why I cannot support the common core standards. Diane Ravitch’s blog, 26.
https://dianeravitch.net/2013/02/26/why-i-cannot-support-the-common-core-standards/
Ravitch, D. (2015). John Dewey lecture: Does evidence matter? Education and Culture, 31(1), 3-
15. Retrieved July 9, 2013 from https://muse.jhu.edu/article/581649/summary
Roza, M., & Hill, P. T. (2006). How can anyone say what’s adequate if nobody knows how
money is spent now? Courting Failure, 235. Retrieved July 23, 2014 from
http://media.hoover.org/sites/default/files/documents/0817947817_235.pdf
Roza, M. (2008). What if we closed the Title I comparability loophole? Ensuring Equal
Opportunity in public Education, 59. Retrieved January 20, 2013 from
https://www.americanprogress.org/issues/education/report/2008/06/10/4570/what-if-we-
closed-the-title-i-comparability-loophole/
Rudalevige, A. (2003). No child left behind: Forging a congressional compromise. In P.E.
Peterson, & M.R. West (Eds.), No Child Left Behind? The Politics and Practice of School
Accountability (pp. 23-54). Washington, DC: Brookings Institution.
Sanders, W. L. (1998). Value-added assessment. School Administrator, 55(11), 24-27.
(EJ577201). Retrieved March 15, 2012 from
http://search.proquest.com.iris.etsu.edu:2048/docview/219243518?accountid=10771&rfr
_id=info%3Axri%2Fsid%3Aprimo
Schwartz, R. B., & Robinson, M.A. (2000). Goals 2000 and the standards movement. Brookings
Papers on Education Policy 2000, (3), 173-214. Retrieved February 9, 2015 from
http://muse.jhu.edu/journals/brookings_papers_on_education_policy/v2000/2000.1schwa
rtz.pdf
Spring, J. (1994). The American school 1642-1993. New York, NY: McGraw Hill. (ED365766).
Spring, J. (2014). Political agendas for education: From race to the top to saving the planet (5th
ed.). New York, NY: Routledge.
Stedman, J. B., Chilton, S. P., Jordan, K. F., & Library of Congress. (1981). An analysis of
public and private schools: (The New Coleman Report). Washington, DC: Library of
Congress, Congressional Research Service. Retreived August 14, 2014 from
http://files.eric.ed.gov/fulltext/ED214314.pdf
Stullich, Stephanie, Elizabeth Eisner, and Joseph McCrary. National assessment of Title I final
report. Volume 1: Implementation of Title I(2007). Retrieved March 4, 2015 from
http://ies.ed.gov/ncee/pdf/20084012_rev.pdf

96
Sunderman, G. L. (2006). Do supplemental educational services increase opportunities for
minority students? Phi Delta Kappan, 88(2), 117. Retrieved January 3, 2013 from
http://www.pdkmembers.org/members_online/publications/archive/pdf/k0610sun.pdf
Tennessee Department of Education (TNDOE). (2014a). Mathematics: Tennessee’s state
standards. Nashville, TN: Author. Retrieved March 12, 2013 from
http://www.tn.gov/education/article/mathematics-standards
Tennessee Department of Education (TNDOE). (2014b). School accountability. Nashville, TN:
Author. Retrieved December 3, 2014, from
http://www.tn.gov/assets/entities/education/attachments/acct_info_sheet.pdf
Tennessee Department of Education (TNDOE). (2015a). State report card. Nashville, TN:
Author. Retrieved July 18, 2015 from http://www.tn.gov/education/topic/report-card
Tennessee Department of Education (TNDOE). (2015b). Tennessee value added system.
Nashville, TN: Author. Retrieved July 17, 2015 from
http://www.tn.gov/education/topic/tvaas
Tyack, D., & Cuban, L. (1995). Tinkering toward utopia: A century of public school reform.
Cambridge, MA: Harvard University Press.
UCLA IDEA (2012). Value added? Los Angeles, CA: Author. (ED532056). Retrieved June 7,
2014 from http://files.eric.ed.gov/fulltext/ED532056.pdf
U.S. Department of Education (USDOE). (2005). No Child Left Behind: New “nation’s report
card” shows NCLB is working for all students. Washington, DC: Author. (ED485837).
Retrieved January 27, 2015 from http://files.eric.ed.gov/fulltext/ED485837.pdf
U.S. Department of Education (USDOE). (2008). Non-regulatory guidance. Title I fiscal issues:
maintenance of effort, comparability, supplement not supplant, carryover, consolidating
funds in school wide programs, grant back requirements. Washington, DC: Author.
Retrieved November 28, 2015, from http://www2.ed.gov/programs/titleiparta/legislation.html#waiver
U.S. Department of Education (USDOE). (2009a). Guidance on standards, assessments, and
accountability: Adequate yearly progress. Washington, DC: Author. Retrieved
November 21, 2014, from
http://www2.ed.gov/policy/elsec/guid/standardsassessment/guidance_pg4.html
U.S. Department of Education (USDOE). (2009b). Race to the Top program: Executive
summary. Washington, DC: Author. Retrieved January 14, 2015, from
https://www2.ed.gov/programs/racetothetop/executive-summary.pdf

97
U.S. Department of Education (USDOE). (2013a). Race to the Top: Tennessee report – Year 2:
School year 2011-2012. Washington, DC: Author. Retrieved April 11, 2014, from
http://www2.ed.gov/programs/racetothetop/performance/tennessee-year-2.pdf
U.S. Department of Education (USDOE). (2013b). State and local report cards: Title I, part A of
the Elementary and Secondary Education Act of 1965, as amended – Non-regulatory
guidance. Washington, DC: Author. Retrieved July 18, 2015, from
http://www2.ed.gov/programs/titleiparta/state_local_report_card_guidance_2-08-
2013.pdf
U.S. Department of Education (USDOE). (2014). Improving basic programs operated by local
educational agencies (Title I, Part A). Washington, DC: Author. Retrieved October 8,
2014, from http://www2.ed.gov/programs/titleiparta/index.html
U.S. Department of Education (USDOE). (2015). Supporting school reform by leveraging
federal funds in a school wide program. Washington, DC: Author. Retrieved November
2, 2015, from http://www2.ed.gov/policy/elsec/guid/eseatitleiswguidance.pdf
Van der Klaauw, W. (2008). Breaking the link between poverty and low student achievement:
An evaluation of Title I. Journal of Econometrics, 142(2), 731-756. Retrieved December
3, 2013 from
http://faculty.smu.edu/millimet/classes/eco7377/papers/van%20der%20klaauw%2008b.p
df
Vaughan, A. C. (2002). Standards, accountability, and the determination of school success. The
Educational Forum, 66(3), 206-213.
Viteritti, J. P. (2012). The federal role in school reform: Obama’s Race to the Top. Notre Dame
Law Review, 87(5), 2087-2122. Retrieved February 21, 2015 from
http://scholarship.law.nd.edu/ndlr/vol87/iss5/10/
Wang, M. C., & Wong, K. K. (1997). Implementing school reform: Practice and policy
imperatives. Retrieved December 5, 2014 from
http://files.eric.ed.gov/fulltext/ED433391.pdf
Webb, L. D. (2006). The history of American education: A great American experiment. Upper
Saddle River, NJ: Pearson.
Weiss, E. (2013). Mismatches in race to the top limit educational improvement: Lack of time,
resources, and tools to address opportunity gaps puts lofty state goals out of reach.
Washington, DC: Broader, Bolder Approach to Education.
Welner, K. G., & Mathis, W. J. (2015). Reauthorization of the Elementary and Secondary
Education Act: Time to Move Beyond Test-Focused Policies. NEPC Policy Memo.
Reterieved June 8, 2013 from http://162.230.210.194/RandD/ESEA%20-%20Must-
Reads/NEPC%20ESEA%20Reauthorization%20Policy%20Memo.pdf

98
Wiener, R. (2008). Strengthening comparability: Advancing equity in public education. Phyllis
McClure and others, “Ensuring Equal Opportunity in Public Education.” Washington:
Center for American Progress.
Wong, K. K., & Meyer, S. J. (1998). Title I schoolwide programs: A synthesis of findings from
recent evaluation. Educational Evaluation and Policy Analysis, 20(2), 115-136.

99
APPENDICES
APPENDIX A
PARTICIPATING SCHOOLS
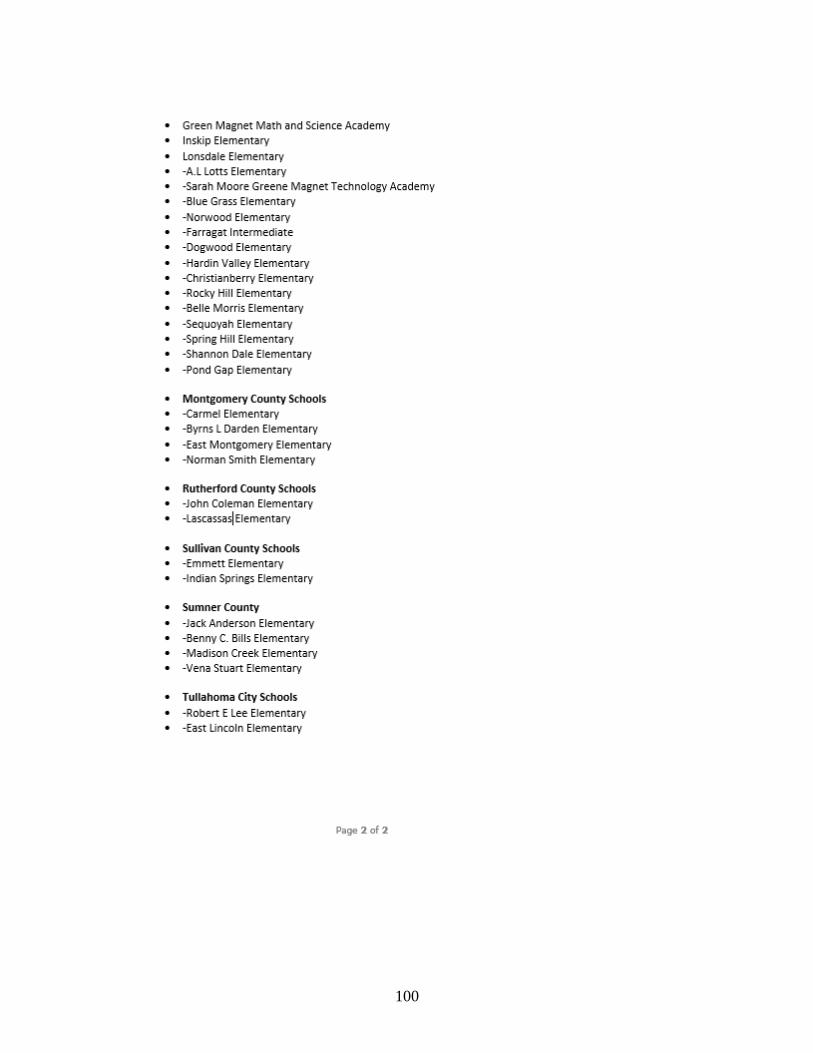
100

101
APPENDIX B
IRB APPROVAL LETTER

102
VITA
ANTHONY W. PADELSKI
Education: Doctor of Education, Educational Leadership,
East Tennessee State University
Johnson City, TN
December, 2016
Masters of Education, Administration and Policy
University of Georgia,
Athens, GA
May, 2007
Bachelor of Science, Interdisciplinary Studies
East Tennessee State University,
Johnson City, TN
May, 2004
Professional Experience: Elementary Teacher, Johnson City Schools
Johnson City, TN
2007-Present
Elementary Teacher, Clarke County Schools
Athens, GA
2005-2007
Elementary Teacher, Glynn County Schools
Brunswick, GA
2004-2005