Electrochemical Desalination - SAWEA · and fuel cells are not conducive to seawater desalting &...
17
By: John Kiernan, Senior Business Developer Electrochemical Desalination Water Technologies
Transcript of Electrochemical Desalination - SAWEA · and fuel cells are not conducive to seawater desalting &...
By: John Kiernan, Senior Business Developer
Electrochemical Desalination
Water Technologies

Slide 2 Water Technologies
The Challenge
In August, 2007, the Singapore Environment & Water Industry Development Council (EWI) offered a Challenge
They sought ideas to produce drinking water from seawater at an energy value of 1.5 kWh/m3 or less
Siemens Water Technologies R&D was announced the sole winner in June, 2008 from 35 proposal submissions
The Siemens Project officially commenced on 01 October 2008
The project is to culminate with 50 m3/d Demonstration Plant in Singapore, treating actual seawater, by October, 2011 2010

Slide 3 Water Technologies
The Pursuit of 1.5 kWh/m3
Minimum energy to desalt 35,000 ppm Total Dissolved Solids (TDS) to drinking water standards is ~ 1.0 kWh/m3 This value assumes 35%
recovery at 25 degrees Celsius The working range to optimize
inefficiencies is, therefore, only 0.5 kWh/m3
The challenge of achieving an energy value target of 1.5 kWh/m3 is enormous
Recovery Rate
0%
4.8
0
kWh/m3
20% 40% 60%
3.4
1.5
0.8
Best Av ailable Technology
Target
Thermodynamic Minimum

Slide 4 Water Technologies
Process Schematic
Value Proposition Low pressure pumps, piping, valves, fittings, etc. Low vibration, low noise levels Less Pretreatment, Less Post-treatment Less corrosion concerns with non-metal piping Chlorine tolerant components Improved finished water quality Improved safety (elimination of high pressure)
SeawaterPost
Treatment
Drinking Water
Pumping Pretreatment Electrodialysis(ED)
Continuous Electrodeionization
(CEDI)

Slide 5 Water Technologies
What does this mean for the customers?
New desal technology will be “best available”
Siemens Value Proposition
Lower Maintenance
Lower Civil Costs
Higher Quality
Easier Operation
Energy Savings
Improv ed Safety
• Lowest total cost of ownership • Ability to desalinate under residential
water pressures (40 psi)• Reduction in maintenance, • Lower construction and civil. • Improvement in Health & Safety work
conditions
• Energy costs have only been the “tip of the iceburg“ of conditions limiting desalination
• Customers also have signifincant concerns on operating costs, consistency of performance and high water pressure work environment.
The Customer’s Challenges of Desalination

Slide 6 Water Technologies
Electrochemical DesalinationThe Technology: ED, CEDI
Cathode (-)
Anode (+)
Cation Exchange Membrane
Anion Exchange Membrane
Product
Brine
Na+
Na+
Cl-Na+
Na+
Cl-Cl
Na+ Na+
Cl-Cl-
Cl-Cl-
Na+
Na+
Cl-Na+
Na+Na+
Na+
Cl-Cl-
- - - - -
Cl-
+ + + + +
Na+ Na+Na+
Cation Exchange Membrane
Seawater

Slide 7 Water Technologies
ED Testing Results; Predictive Model
Fractions of Ions Remaining vs. TDS in ED ProductStandard Membranes
Synthetic Seawater as Feed
0%
10%
20%
30%
40%
50%
60%
70%
80%
90%
100%
0 5000 10000 15000 20000 25000 30000 35000
TDS (ppm)
% Remaining
SO4-2
Mg+2
Ca+2
Na+1

Slide 8 Water Technologies
Advanced computer modeling (gPROMS) to simulate mass transfer
Investigating potential gradient at electrolyte-membrane interface
Expand to multi-component mixtures
Allow modeling of mixed-salt solutions
Mass Transfer, Boundary Layer Simulations (RWTH Aachen University, Prof. W. Marquardt)

Slide 9 Water Technologies
Prototype Testing
Initial lab tests confirmed feasibility of achieving 1.5 kWh/m3
Lab tests recycled water until 500 ppm TDS was achieved; voltage drops per cell pair were totaled
Prototype modules produced drinking water quality in a single pass
A prototype system yielded deionization energy of 1.7 kWh/m3; this value excluded pumping energy
Slide 10 Water Technologies
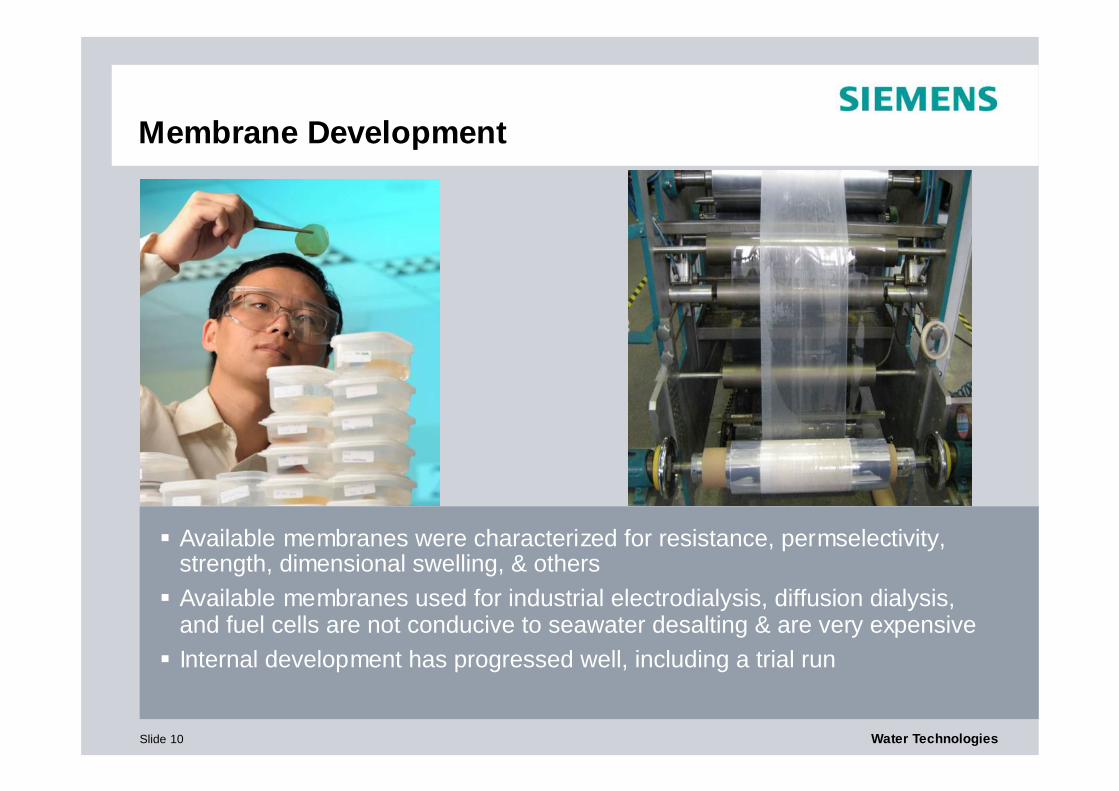
Membrane Development
Available membranes were characterized for resistance, permselectivity, strength, dimensional swelling, & others Available membranes used for industrial electrodialysis, diffusion dialysis,
and fuel cells are not conducive to seawater desalting & are very expensive Internal development has progressed well, including a trial run

Slide 11 Water Technologies
Transport Inefficiencies (Water Loss)
Other membrane properties were discovered which adversely affect deionization efficiency, including: Hydraulic Water Permeation
due to pressure gradient Osmotic Water Permeation due
to concentration gradient Electro-osmotic Water
Permeation due to ion hydration
Product TDS, ppm
0
10.0%
0%
Water Loss
10k 20k 30k
7.5%
5.0%
2.5%
40k
Electro-osmotic
Osmotic
Slide 12 Water Technologies
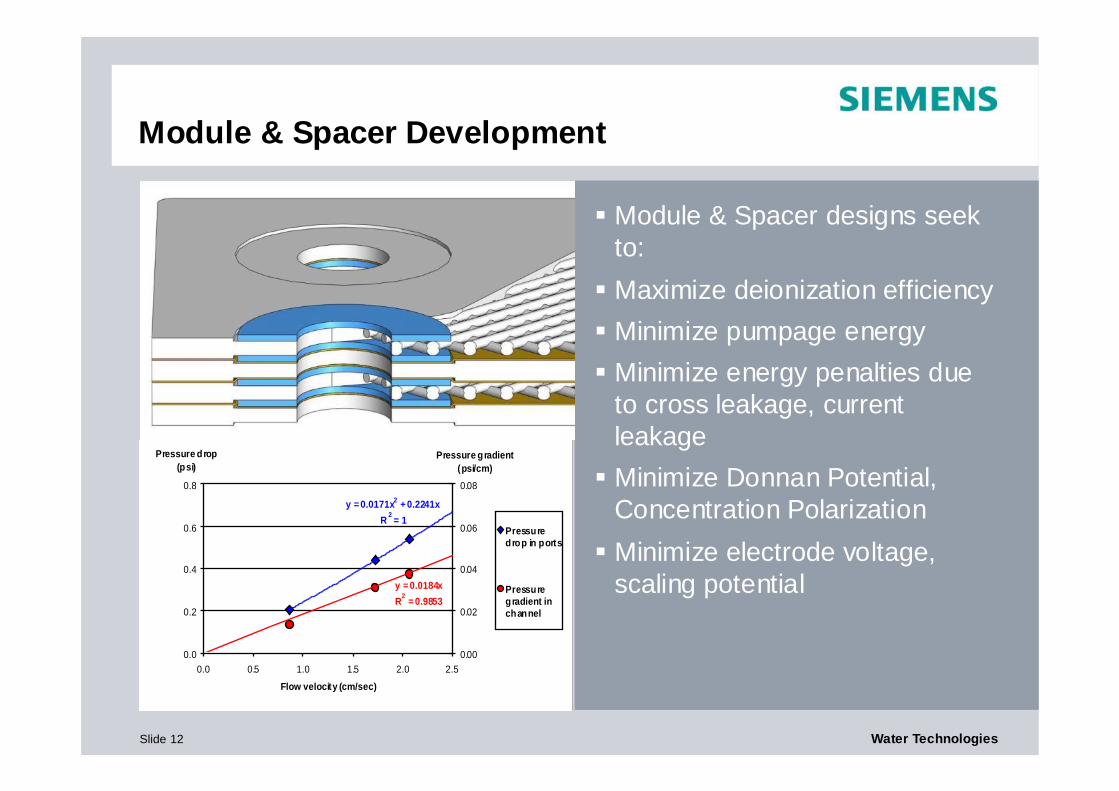
Module & Spacer Development
Module & Spacer designs seek to: Maximize deionization efficiency Minimize pumpage energy Minimize energy penalties due
to cross leakage, current leakage Minimize Donnan Potential,
Concentration Polarization Minimize electrode voltage,
scaling potentialy = 0.0184xR2 = 0.9853
y = 0.0171x2 + 0.2241xR 2 = 1
0.0
0.2
0.4
0.6
0.8
0.0 0.5 1.0 1.5 2.0 2.5
Flow velocity (cm/sec)
Pressure drop (psi)
0.00
0.02
0.04
0.06
0.08
Pressure gradient (psi/cm)
Pressuredrop in ports
Pressuregradient inchannel

Slide 13 Water Technologies
Power Contributing Processes
UF Pretreatment Pre-chlorination feed pump ED 1, 2, 3 Desalting energy (applied DC Current) ED 1, 2,3 conc, dilute pumping energy CEDI 1, 2, 3 Desalting energy (applied DC Current) CEDI 1, 2, 3 conc, dilute pumping energy ED, CEDI DC power supply efficiency factor ED, CEDI electrode solution pumps Boron Removal IEX column pumping energy

Slide 14 Water Technologies
EWI Project Deliverable
50 m3/d demonstration unit
Location: PUB Variable Salinity Plant, Pasir Ris, Singapore
Seawater storage tanks
Feed pumps & screens
UF pretreatment Desal ED + CEDI

Slide 15 Water Technologies
Demo Trailer – ED, CEDI

Slide 16 Water Technologies
Steps Towards Commercialization
A balance is needed, optimizing the combination of applied current & membrane area, e.g. Energy costs vs. Capital costs Alternate module
configurations are being explored The objective is to provide
Siemens customers with the lowest total cost of ownership The goal remains to transform
seawater to drinking water economically across the globeCurrent Density, A/m2
kWh/m3 m2/(m3/h)
Membrane Area Required
Energy Consumption

Slide 17 Water Technologies
Thank You