Electrochemical Characterization and Aging in PEM Fuel Cells
98
Project Number: RYD-FR80 Electrochemical Characterization and Aging in PEM Fuel Cells A Major Qualifying Project Report submitted to the faculty of WORCESTER POLYTECHNIC INSTITUTE in partial fulfillment of the requirements for the Degree of Bachelor of Science Submitted to: Professor Ravindra Datta By: Neal Dandekar Alison Mendonca February 29 th 2012 Co-Advised by: Botao Huang (ENSIC) Francois Lapique (ENSIC)
Transcript of Electrochemical Characterization and Aging in PEM Fuel Cells

Project Number RYD-FR80
Electrochemical Characterization and Aging in PEM Fuel Cells
A Major Qualifying Project Report
submitted to the faculty of
WORCESTER POLYTECHNIC INSTITUTE
in partial fulfillment of the requirements for the
Degree of Bachelor of Science
Submitted to
Professor Ravindra Datta
By
Neal Dandekar
Alison Mendonca
February 29th
2012
Co-Advised by
Botao Huang (ENSIC)
Francois Lapique (ENSIC)
ii
Abstract Fuel cell degradation and defects are factors that prohibit the commercialization of fuel
cells To understand how fuel cells may degrade they are tested with and without defects to
simulate real-world applications By analyzing degradation patterns of a fuel cell stack operating
conditions and geometry within a stack can be optimized Preliminary work analyzed a three-cell
stack of healthy polymer electrolyte membrane fuel cells (PEMFC) under steady state conditions
for four weeks The voltage resistance and water production of this stack were monitored each
day to characterize degradation and aging Further efforts utilized theoretical modeling to predict
fuel cell performance of a single cell
Experiments conducted on the healthy stack demonstrated that the mass transport and
charge transfer resistances increased over time while the ohmic resistance remained constant
The degradation of the catalyst and gas diffusion layers may have caused the increase in mass
transport and charge transfer resistances Due to the increase in resistance the overall potential
of the cell decreased over time Through the use of theoretical modeling potential drop was
predicted for data collected on a single cell and a stack Resistances extracted from EIS could not
be predicted from the model Overall experiments conducted at ENSIC in Nancy France
provide a basis for future research
iii
Acknowledgments We would like to express our gratitude to those who contributed and assisted in the completion
of our project We would like to acknowledge advisors in Nancy France at ENSIC as well as
those in Worcester at WPI Many thanks to
ENSIC
Botao Huang
Yohann Chatillon
Francois Lapicque
WPI
Professor Ravindra Datta
Professor Terri Camesano
The LRGP amp SysPol Teams
iv
Table of Contents Abstractii
Acknowledgementsiii
Table of Figuresv
Table of Tablesvi
Nomenclaturevii
10 Executive Summary 1
20 Background 5
21 Fuel Cell Overview 5
211 History 5
212 Fuel Cell Working Principle 7
213 Types of Fuel Cells 8
22 Proton Exchange Membrane Fuel Cells 9
221 Membrane Electrode Assembly (MEA) 9
222 The Gas Diffusion Layer (GDL) 15
223 Bipolar Plates and Flow Fields 16
23 Fuel Cell Degradation 17
231 Membrane Degradation 18
232 Catalyst Layer Degradation 25
233 Gas Diffusion Layer (GDL) Degradation 28
234 Bipolar Plate Degradation 28
24 Diagnostic Tools for Experimental Methodology 30
241 Electrochemical Impedance Spectroscopy (EIS) 30
242 Water Management 33
243 Polarization Curve 34
30 Methodology 40
31 Aging in a Healthy Three-Cell Stack 40
311 Equipment 40
312 Experimental Procedures 46
32 Aging in a Defective Stack 53
33 Theoretical Modeling 53
331Modeling Parameters 54
40 Results and Discussion 58
41 Aging in a Healthy Three-Cell Stack 58
411 Electrochemical Impedance Spectroscopy 58
412 Cell Voltages 63
v
413 Water Management 64
42 Aging in a Defective Stack 68
43 Theoretical Modeling 69
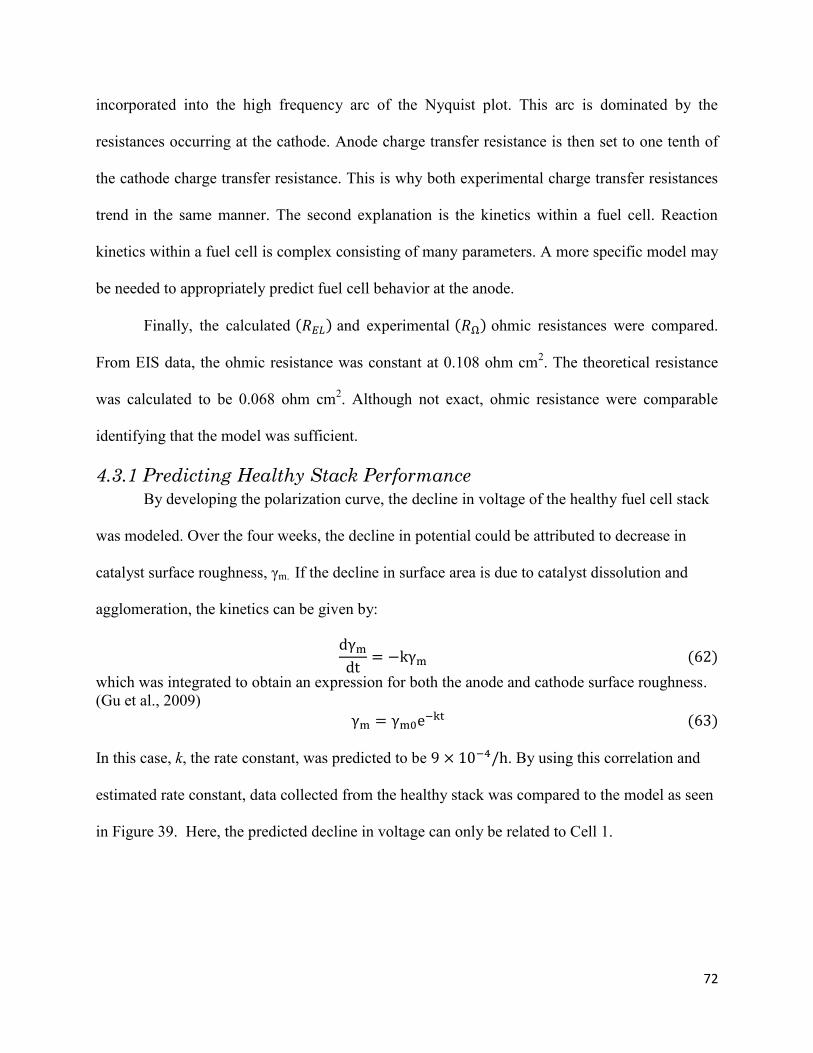
431 Predicting Healthy Stack Performance 72
50 Conclusion and Future Work 75
References 78
Appendix A Sample Calculations 82
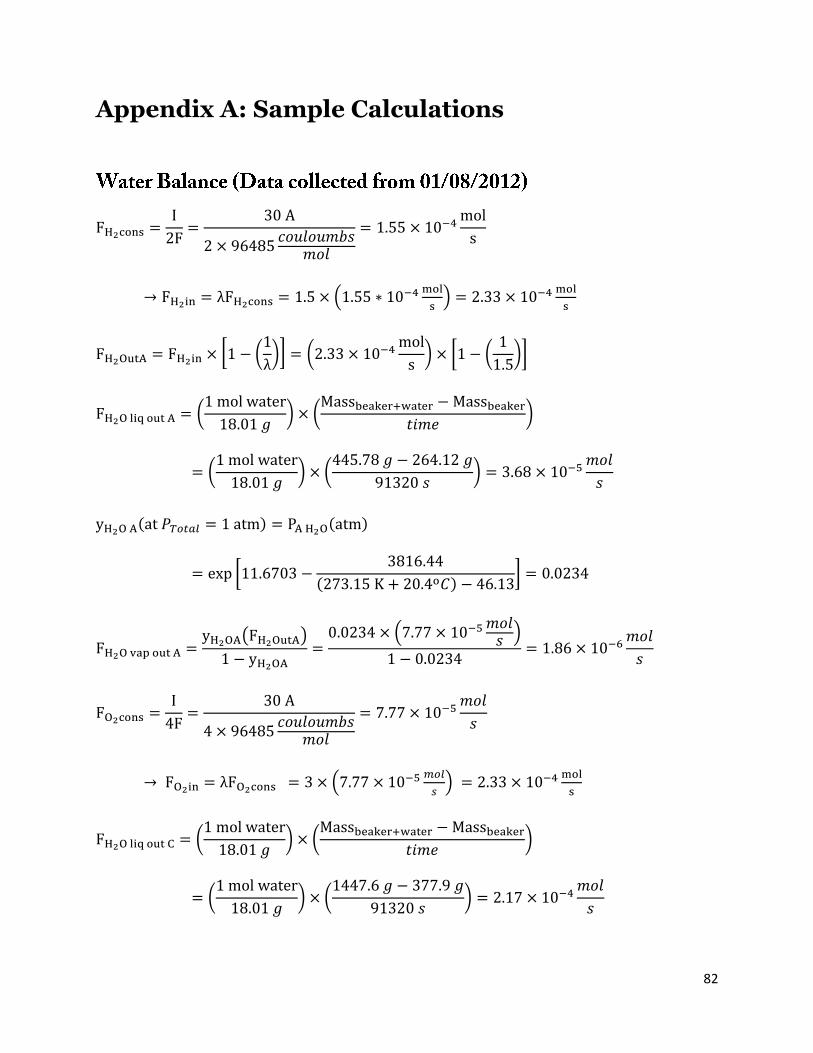
Water Balance (Data collected from 01082012) 82
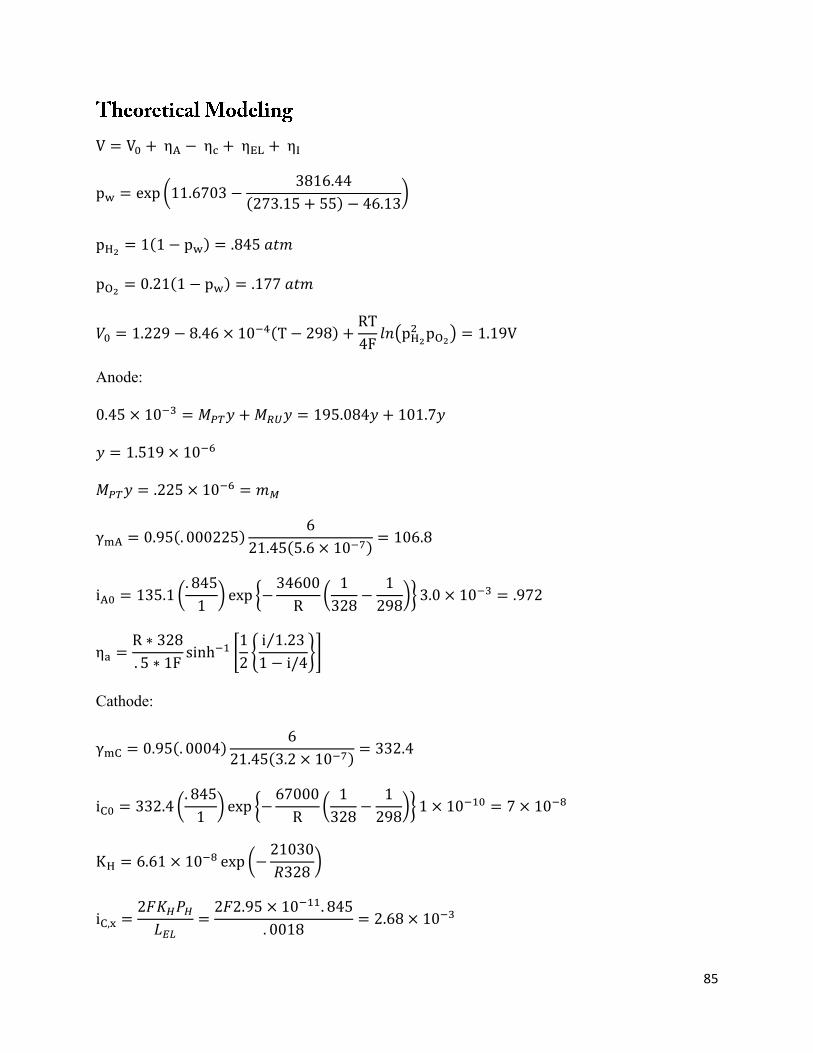
Theoretical Modeling 85
Appendix B Healthy Stack EIS Data 88
Stack 88
Cell 1 89
Cell 2 90
Cell 3 90
Table of Figures Figure 1 Experiment conducted by Grove 6
Figure 2 Basic construction of a fuel cell 8
Figure 3 An example of a MEA 10
Figure 4 Three Phase Contact) 11
Figure 5 Macro-scale Perfluorosulfonic Acid Membrane (PFSA) 12
Figure 6 Water flux between electrodes and membrane 14
Figure 7 SEM GDL cross-section micrographs 16
Figure 8 SEM image of a pinhole in an MEA 20
Figure 9 Structure of Nafion 22
Figure 10 Secondary degradation reaction via end group unzipping 23
Figure 11 Unzipping progression of product of secondary degradation reaction 24
Figure 12 Initiation of degradation via side chain cleavage 24
Figure 13 Platinum Catalyst Degradation 27
Figure 14 Equivalent circuit to PEM fuel cell 31
Figure 15 Nyquist plot 32
Figure 16 Polarization Curve 35
Figure 17 Electrical Circuit of a Fuel Cell 36
Figure 18 Experimental Schematic 41
Figure 19 Experimental Bench and Hood 41
Figure 20 WaterAir Heater Configuration 42
vi
Figure 21 MEA and Carbon Paper Layers 44
Figure 22 Bipolar Plate 44
Figure 23 Cell to cell connections in stack 45
Figure 24 Fuel Cell Stack Apparatus 46
Figure 25 Experimental Nyquist Plot 48
Figure 26 GEIS Fitting 49
Figure 27 Healthy Stack Rohm C 59
Figure 28 Healthy Stack Individual Cell Rd C 61
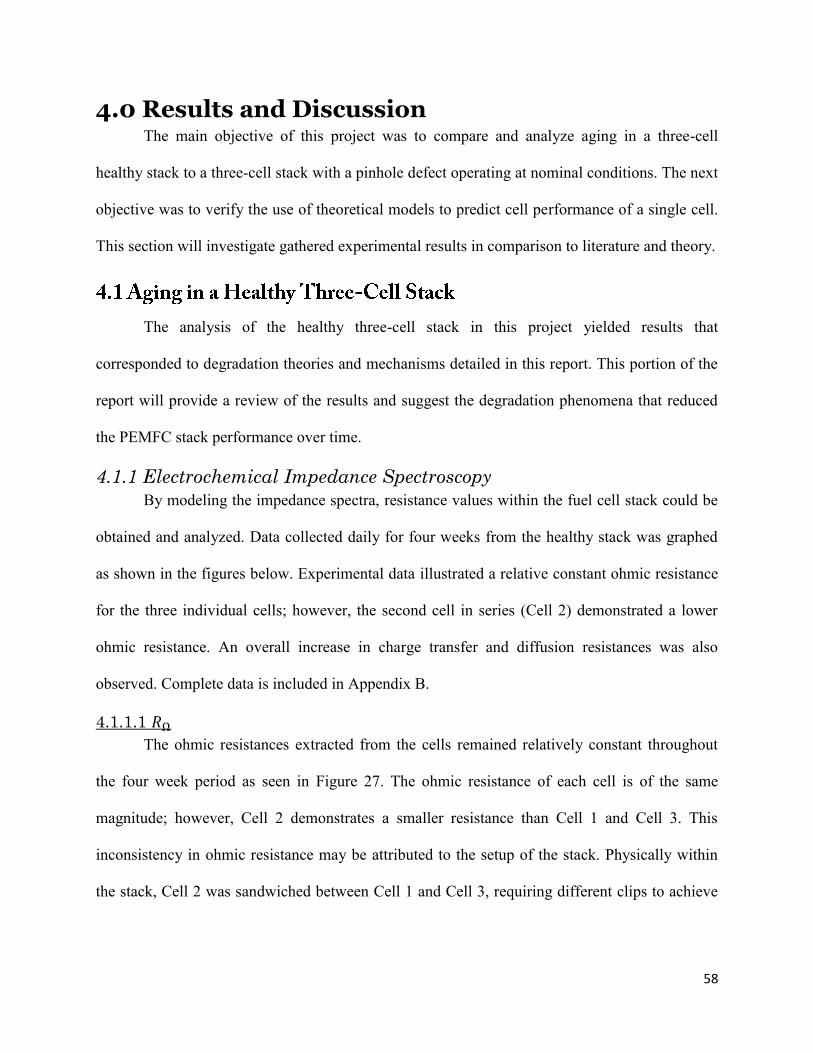
Figure 29 Healthy Stack Individual Cell Rct C 62
Figure 30 Healthy Stack Individual Cell Voltage 64
Figure 31 Healthy Stack Water Transport Coefficient 2 65
Figure 32 Healthy Stack Excess Reactant Coefficient Wa 66
Figure 33 Healthy Stack Excess Reactant Coefficient Wc over a run time 67
Figure 34 MEA with 16 pinholes 68
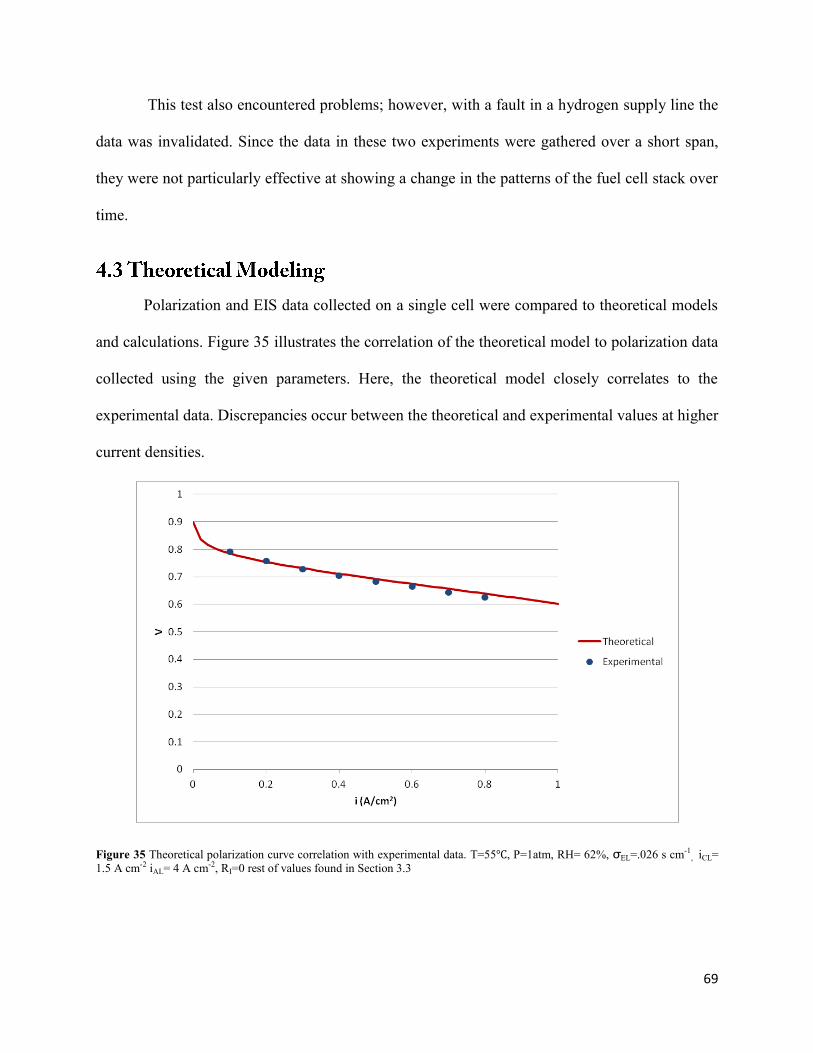
Figure 35 Theoretical polarization curve correlation with experimental data 69
Figure 36 Rc compared to model 70
Figure 37 RA compared to model 70
Figure 38 RA compared to model 71
Figure 39 Predicted decline of cell voltage 73
Figure 40 Predicted increase in cathode charge transfer resistance 74
Table of Tables
Table 1 Nominal Operating Conditions 45
Table 2 EIS Modeling Parameters 47
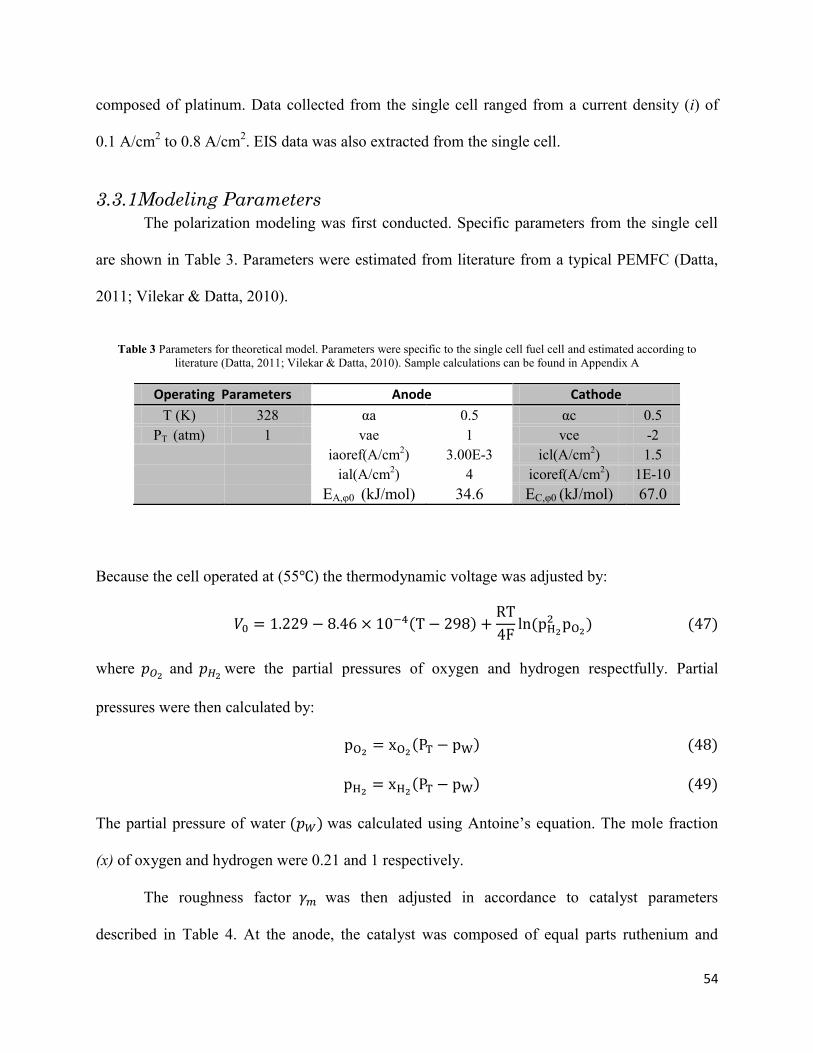
Table 3 Parameters for theoretical model 54
Table 4 Roughness parameters 55
vii
Nomenclature
CH2O water concentration
dM catalyst metal crystalline diameter
EAφ0 effective activation energy for HOR (346 kJ mol-1
)
ECφ0 effective activation energy for ORR (670 kJ mol-1
)
Eμ activation energy for water viscosity (14000 kJ mol-1
)
F faradayrsquos constant (96485 C eq-1
)
Fi molar flow rate (mol s-1
)
i fuel cell current density (A cm-2
)
ixc crossover current at the cathode
i0 exchange current density (A cm-2
)
i0ref exchange current density reference(A cm-2
)
iL limiting current density (A cm-2
)
KA equilibrium constant
kH2 permeability of hydrogen (mol bar-1
cm-1
s-1
)
LEL thickness of electrolyte
MPT platinum molar mass (195084 gmol)
MRU ruthenium molar mass (10107gmol)
mm catalyst loading (mg cm-2
)
pi partial pressure
R gas constant (J mol-1
K-1
)
Rct charge transfer resistance
Rdiff diffusion resistance
RΩ ohmic resistance
T temperature (K)
Tref reference temperature
V0 thermodynamic potential
V fuel cell voltage
W vapor content coefficient
viii
Greek Symbols
α water transport coefficient
α transfer coefficient
β degree of dissociation
δ ratio of mutual to matrix diffusion coefficients
ε0 Nafionreg
volume fraction
εE water volume fraction
γm roughness factor
λ number of molecules absorbed per ndashSO3H group
ρ density (g cm-3
)
η over potential
ϕI
available metal surface involved in electro catalysis in contact with
ionomer
νie- electron stoichiometric number
σEL protonic conductivity of the membrane
Χ percolation threshold
1
10 Executive Summary Fuel cells are an ever-expanding topic of research in academia and energy-based
industries They are electrochemical devices that have fuel entering the cell continuously and
differ from battery cells which have a fixed amount of reactants (Baker amp Zhang 2011) Interest
in fuel cells has grown over time as dependence on fossil fuels triggered a global effort to find
alternative sources of energy for electrical power generation and transportation applications
Although considered a new age energy source research on fuel cells can be dated back to
1838 In 1838 the fuel cell effect (electrolysis) or the decomposition of water into hydrogen and
oxygen was discovered It was not until approximately a year later that inverse electrolysis was
utilized to produce electricity by forming water from hydrogen and oxygen Although fuel cell
research has been conducted over many centuries much knowledge and research is still needed
to perfect this alternative source of energy
Worcester Polytechnic Institute has collaborated with Ecole Nationale Supeacuterieure des
Industries Chimiques (ENSIC) in Nancy France to perform research on fuel cell operation and
degradation The focus of LRGP at ENSIC has been the degradation of proton exchange
membrane fuel cells (PEMFC) Degradation and aging of PEMFC components have been a
major limiting factor in the implementations of PEMFCs for real-world applications In concept
and practice PEMFCs prove to be practical alternatives to batteries and engines in many
applications if the lifetime of the cells can be ensured and validated
Several past research projects have analyzed the degradation of single cell PEMFCs with
various analytical techniques (Choi amp Moss 2009) This project was split into two major
sections prolonged aging tests at nominal conditions and prediction of fuel cell performance by
theoretical modeling The first objective of this project was to observe aging of a PEM fuel cell
stack comprised of three healthy cells under steady state conditions This type of experiment
2
conducted over four weeks was considered as a control stack that would provide aging patterns
that could be compared to those of a defective stack Electrochemical impedance spectroscopy
and water management data were collected each day to monitor the resistance and aging within
the fuel cell stack Data could be analyzed from a cell to cell basis or as a stack
The setup of the experiment consisted of a fuel cell bench with a three-cell stack
temperature indicator flow meters and electrochemical data collectors To ensure steady state
conditions the operating parameters of the stack were held constant by flow and temperature
meters At the anode dry hydrogen gas entered the cell at 094 Lmin at 55 Humidified air at
55 and 62 relative humidity entered at the cathode at approximately 448 Lmin A constant
current of 30A was applied to the stack Through hot water heaters the stack was maintained at a
temperature of 55 and pressure of one atmosphere Data from the stack was collected and
analyzed each day
The general procedures for the experiment were as follows at the end of each day
effluent water from each electrode was collected and massed followed by the collection and
analysis of impedance spectroscopy Water management and dynamics within the stack could be
understood through the collection of the effluent water and temperature measurement at the
anode and cathode Through mass balances the water transport coefficient and excess reactant
coefficient of the stack were obtained The analysis of resistances within the stack was acquired
from Galvanostatic Electrochemical Impedance Spectroscopy (GEIS) Data exported from GEIS
was fitted to Nyquist and Bode plots to determine ohmic charge transfer and diffusion
resistances occurring within the stack as well as through each cell Cell and stack voltages were
also monitored and recorded each day
3
Under the same operating parameters and experimental procedures a defective stack was
analyzed The stack was comprised of three cells in series with a defect a pin hole in the first
cellrsquos MEA After operation for a week experiments on the defective stack were terminated due
to inconsistent hydrogen supply to the cell The first cell was then altered to incorporate sixteen
pinholes and was then tested to examine aging patterns Again due to inconsistent hydrogen
supply experiments were terminated
The second objective of this project was to verify the use of theoretical models with fuel
cells To enhance the fuel cell durability models have been made to predict how fuel cells
perform under different operating conditions One model used in this project is the polarization
curve model A polarization curve is standard electrochemical technique used to characterize the
performance of a fuel cell It is essentially a plot of cell voltage against current density under a
set of constant operating conditions By constructing a polarization curve the effects of changes
to operating conditions such as temperature composition and relative humidity can be
systematically analyzed In this project a theoretical polarization curve was used to model data
previously collected from a single cell PEM fuel cell Although the polarization curve correlated
to the data with little discrepancies theoretical or calculated resistances did not correlate to
resistances extracted from impedance data
This report provides a basic overview of the history and working principle of a typical
fuel and provides detailed information on the degradation and aging processes presented in
literature A description of diagnostic tools used to monitor aging and degradation within a fuel
cell is also presented in the background of this report The report also validates the use of
theoretical models to predict fuel cell performance In Chapter 3 a more detailed methodology of
experimental procedures is described Finally results and analysis obtained from data are
4
discussed in Chapter 4 The outcome of this project was twofold a polarization curve model for
single PEMFCs was validated and theorized mechanisms were utilized to describe chemical
phenomena occurring in a three-cell healthy PEMFC stack
5
20 Background Fuel cells are favorable alternatives to conventional energy sources They consume
hydrogen and hydrocarbon fuels that contain substantial chemical energy By utilizing hydrogen
as the reactant fuel cells have a potential to be more efficient environmentally clean and silent
compared to other means of energy production Typically used as energy generators for small-
scale applications fuel cells can provide energy to rural areas outside the public grid where a
huge cost of building an electrical network is required Despite their advantages there are some
limitations to the usage of fuel cells For example due to aging and degradation during
operation the lifespan of a typical fuel cell is shorter than is required to be marketed as practical
products Other challenges include limited durability and accessibility to consumers Regardless
of limitations fuel cells offer a promising source of alternative energy
211 History
The operation of a fuel cell is based on electrochemistry or the field of science that relates
electricity with chemical phenomena In 1791 Luigi Galvani discovered the field of
electrochemistry by placing the tip of a scalpel on the internal nerves of a dissected frog which
caused its muscles to contract (Srinivasan 2006) Several years later in 1800 it was discovered
that by sandwiching a membrane with zinc and silver plates and wetting it with salt water
electrical current would flow It was not until 1838 that the ldquofuel cell effectrdquo was discovered by
CF Schoenbein (Choi et al 2006) Schoebein demonstrated the ldquofuel cell effectrdquo (electrolysis)
by immersing two platinum wires connected to a battery in a dilute acid When submerged
bubbles of hydrogen and oxygen evolved on two electrodes A year later the invention of the
ldquofuel cellrdquo was made
6
During 1839-1845 WR Grove demonstrated Schoenbeinrsquos discovery by inventing the
ldquogas batteryrdquo shown in Figure 1 (Larminie amp Dicks 2003) The experiment illustrated water
being electrolyzed into hydrogen and oxygen by passing an electrical current on two externally
connected platinum electrodes Grove then showed that when the current was stopped an
electrical current could be generated when hydrogen and oxygen recombined on the platinum
electrodes In other words hydrogen fuel was being ldquoburntrdquo or combusted however instead of
releasing heat energy electrical energy was produced
In 1839 Grove demonstrated the basic principle of a fuel cell stimulating interest in the
field of electrochemistry In Groversquos model due to low contact area and large distances between
the electrode and electrolyte the currents produced were minuscule Throughout the years fuel
cells evolved to address these and other issues to become more efficient In 1889 L Mond and
C Langer utilized a three dimensional porous electrode and claimed the term ldquofuel cellrdquo (Choi et
al 2006) Later fuel cells took new forms and were used in variety of ways For example in
1965 United Technologies Corporation (UTC) produced an alkaline fuel cell to be used in the
Apollo Lunar Mission
Figure 1 Experiment conducted by Grove (a) Water is separated into hydrogen and oxygen (electrolysis) by the flow of
an electrical current (b) Reverse electrolysis Hydrogen and oxygen are combined to form water and electricity
(Larminie amp Dicks 2003)
7
Fuel cell science and technology embodies a variety of disciplines Currently researchers
are focused on better understanding all of the operating parameters that influence the fuel cell
especially its performance In many cases researchers have utilized mathematical models to help
develop relationships between the fuel cell and its components (Wu et al 2008a) Nevertheless
fuel cells are efficient environmentally-friendly alternative sources of energy with a few
limitations that are holding them back
212 Fuel Cell Working Principle
A fuel cell is an electrochemical device ie a cell composed of four parts anode
cathode electrolyte (membrane) and external circuit In a hydrogen fuel cell hydrogen and
oxygen combine to generate electricity and water as depicted in Equation (1)
The reaction is similar to a combustion reaction differing in that a fuel cell will produce
electricity and heat energy (Larminie amp Dicks 2003)
To understand how reverse electrolysis works reactions at each electrode are considered
Although these considerations vary for different types of fuel cells an acid electrolyte fuel cell
will be the base model as it is the simplest and most common (Figure 2) At the anode of an acid
electrolyte hydrogen gas enters the system and ionizes releasing electrons thereby creating
protons (H+) As protons permeate through the electrolyte electrons are forced through the
external circuit and to the cathode Oxygen entering at the cathode reacts with the electrons from
the anode side Hydrogen which has permeated through the electrolyte combines with oxygen at
the cathode to form the by-product water Reactions at the anode and cathode are summarized in
Equations (2) and (3)
8
Although the acid electrolyte fuel cell is used here as a model there exists many other
types of fuel cells Other types of fuel cells utilize different materials and mechanisms to
effectively produce electricity
213 Types of Fuel Cells
Fuel cells differ according to efficiency applications and cost (Mekhielf et al 2011)
They are characterized by the type of electrolyte and fuel used into six major areas
Alkaline Fuel Cell (AFC)
Proton Exchange Membrane Fuel Cell (PEMFC)
Phosphoric Acid Fuel Cell (PAFC)
Molten Carbonate Fuel Cell (MCFC)
Figure 2 Basic construction of a fuel cell For an acid electrolyte fuel cell protons move from the anode to the cathode
Electrons circulate through a load Water is produced at the cathode side (Larminie amp Dicks 2003)
9
Solid Oxide Fuel Cell (SOFC)
Direct Methanol Fuel Cell (DMFC)
Different types of fuels cells are designed to optimize the different strengths associated
with fuel cells (Larminie amp Dicks 2003) For example PEMFCs capitalize on specific operating
parameters and physical design The simple design incorporates a solid immobile polymer
electrolyte Due to its low operating temperature PEMFCs utilizes platinum-based catalysts to
address problems with slow reaction rates Fueled by hydrogen PEMFCs do not address the
issue of the reliability of available hydrogen or hydrocarbon fuel One solution to hydrogen
supply is to use methanol or other alcohols as a fuel For example methanol is used as a fuel in
DMFCs Although there are many types of fuel cells this project will focus on the PEMFCs
their properties and degradation
The proton exchange membrane fuel cell (PEMFC) also known as the solid polymer fuel
cell was originally created for use in the Gemini manned space missions through collaboration
between NASA and General Electric (Larminie amp Dicks 2003) Now PEMFCs are utilized for
electric production as portable electric generators for vehicles and power generation for electric
devices or local grids In this section the functionality of PEMFC components is described
221 Membrane Electrode Assembly (MEA)
PEM technology requires a very specific set of conditions and materials for the fuel to
operate effectively Similar to other fuel cells a PEMFC is composed of four main components
bipolar plates catalyst gas diffusion layer and electrolyte however it is the fusion of electrolyte
and catalyst that makes the PEMFC unique This unit of PEMFCs the membrane electrode
10
assembly (MEA) drives the electrochemical reaction (Figure 3) The MEA is composed of three
basic functional layers the anodecathode catalyst layers and the membrane
Figure 3 An example of a MEA The MEA is composed of two main components- the catalyst later and the
electrolyte Typically a membrane is 005 to 01mm thick the GDL is between 02 and 05 mm thick
(Larminie amp Dicks 2003)
One important aspect of the interaction between the PEMFC layers is the integration of
the catalyst layer with the membrane This interlock between the electrode and the membrane
produces a charge double layer with opposing static charge (Larminie amp Dicks 2003) This
charge double layer allows what is called three phase contact Three-phase contact occurs at the
boundary layer between the reactant gases membrane layer and catalyst as can be seen in Figure
4 This direct connection made by fusing the catalyst with electrolyte drastically increases the
efficiency of a PEMFC
11
Figure 4 Three Phase Contact Meshing the electrode and electrolyte promotes three-phase contact and hydrogen ion
diffusivity (Larminie amp Dicks 2003)
2211 The Membrane Layer (Electrolyte)
As the name proton exchange membrane indicates the technology is based on proton
transport through a membrane the electrolyte of a PEMFC Protons must be able to readily and
actively diffuse through the membrane but should not conduct electrons thereby allowing the
current to flow from the anode to the cathode and create a potential difference (Larminie amp
Dicks 2003) The membrane should also be as thin as possible to minimize the proton transport
resistance across the membrane by limiting hydrogen or oxygen crossover
The requirements of the fuel cell membrane do not allow for much flexibility with the
types of membranes that are presently available In conjunction with NASA DuPonttrade
developed a material named Nafionreg that is still the primary membrane implemented in
PEMFCs (Larminie amp Dicks 2003) Nafionreg a Teflon
reg (tetrafluroethylene or PTFE) derivative
is hydrophobic enabling it to drive water away from the electrodes The Nafionreg
network is
infused with sections of sulfonated side chains which in contrast to PTFE are hydrophilic and
draw water towards them This porous hydrophobic network with interspersed hydrophilic
regions allows for effective proton transport through a saturated membrane The sulfonated side
chains draw protons towards them (seen in Figure 5) but because of the network of hydrophobic
12
Teflon the weaker intermolecular attraction is overcome and protons are driven through the
membrane
Figure 5 Macro-scale Perfluorosulfonic Acid Membrane (PFSA) As water molecules travel through the PFSA membrane they
are attracted to the hydrophilic sulphonate side chains as depicted in the illustration (Larminie amp Dicks 2003)
Other perfluorosulfonic acid membranes have been developed under similar principles like Gore-
Selectreg and Primea
reg (made by Goretrade) Aciplex
reg and Flemion
reg (made by Asahitrade) (Wu et al
2008b)
Nafionreg is still widely used as an industry standard for PEMFCs because of its distinctive
properties Although new membranes have been developed they are mostly variants of the
Nafionreg membrane having similar properties due to the hydrophobic and hydrophilic
characteristics generated by perfluorination and sulfonation Other properties that make Nafionreg
and fluorosulfonate ionomers unique are that they are more durable and resistant to chemical
degradation and can be formed into thin membranes without jeopardizing mechanical integrity
(Wu et al 2008b)
In addition to membrane material water management and relative humidity are other
parameters vital to maintain operation of a PEMFC The water content of a PEMFC has a direct
13
relationship with the proton transport through the membrane so the more saturated the cell the
better the cell operates (Larminie amp Dicks 2003) However to have optimal conditions a water
balance must be maintained If there is too much water flooding will occur By flooding the cell
pores and sites at the three-phase interface are blocked hindering mass transfer of the reactant to
the electrode The result of limited mass transfer within the cell is a decrease in fuel cell
efficiency
In an ideal situation the water generated by the desirable redox reactions in the PEMFC
at the cathode would provide all the water that would be necessary to sustain operation by
keeping the membrane hydrated The membrane would be thin enough for the water to diffuse
back through the membrane towards the anode Water at the cathode that would come in contact
with the air would evaporate readily and the fuel cell would be able to run at steady state without
any supplementary procedures There are a number of complications that do not permit this sort
of idealization to occur like the divergent theories on low or high humidification strategies
14
Figure 6 Water flux between electrodes and membrane (Larminie amp Dicks 2003)
When hydrated protons travel through the membrane from the anode side to the cathode
they ldquodragrdquo water molecules along through the membrane For each proton up to five water
molecules can be transferred This phenomenon is known as electro-osmotic drag (Larminie amp
Dicks 2003) Electro-osmotic drag can lead to the anode side drying out even though the cathode
side is well saturated The water distribution across the membrane also may not be uniform with
some regions receiving less water than other regions An excess of water can cause localized
flooding at the electrodes All of these setbacks are predictable and can be combated with
solutions Water drag and water generation are directly proportional to current and back diffusion
changes with the thickness of the membrane so water saturation can be predicted across the
membrane and solved by adding humidity to the reactant gases
15
2212 The Catalyst Layer
The development of catalysts and catalyst efficiency has vastly improved in the last
century In history of the PEMFC the most effective catalyst is platinum (Larminie amp Dicks
2003) Platinum is a precious expensive metal but does not substantially contribute to the cost of
a fuel cell because only a small amount of platinum is needed For example in the 1960s 28 mg
of catalyst were required per square centimeter of electrode now the electrodes are plated with
02 mg-cm-2
or less
Carbon powder is used as a support platform for the platinum particles Dispersing these
platinum particles across the carbon powder increases the surface contact area of the catalyst
layer increasing the effectiveness of the redox reactions that take place (Schiraldi 2006)
222 The Gas Diffusion Layer (GDL)
The essential function of the gas diffusion layer (GDL) is to disperse the reactant gases
evenly to the corresponding electrode (Schiraldi 2006) It is in place to facilitate water
management within the cell by 1) expelling water from fuel cell to avoid catalyst flooding and 2)
maintaining water within the cell to optimize proton transport (Larminie amp Dicks 2003)
The appropriate material selection is crucial to achieve and maintain high efficiency
especially when size restrictions are imposed on the design Carbon paper or carbon cloth is
often used as the GDL as it has the ability to drive water out of the cell while providing a
conductive layer for electron flow Carbon paper is usually selected when the PEMFC must be
small and thin in size whereas carbon cloth is thicker (Larminie amp Dicks 2003) Carbon cloth
will absorb more water making PEMFC manufacturing easier due to fewer voids in the cell
compared to carbon paper However because carbon cloth is thicker and more absorbent it will
also expand more into the bipolar plate channels where reactant gas may be restricted
16
Some GDLs employ a stratified level of porosity that has been shown to deliver different
results than uniformly porous GDLs (SGL Technologies GmbH 2012) These GDLs can have
two layers with a microporous layer (MPL) on the catalyst side and a macroporous layer on the
opposing side adjacent to the bipolar plate seen in Figure 7 The difference in pore size
increases efficiency and durability of a fuel cell by limiting exposure of contaminants and
undesired reactants to the catalyst The diffusion characteristics of the macroporous layer can be
examined by Fickrsquos 1st and 2
nd laws of diffusion while the microporous layer generally exhibits
Knudsen diffusion
Figure 7 SEM GDL cross-section micrographs a) In the single layer GDL a macroporous layer is shown and b) in
the dual-layer GDL macroporous and microporous layers are shown (Han et al 2008)
223 Bipolar Plates and Flow Fields
The primary use of bipolar plates in PEM cells is to feed reactant gases to their
appropriate electrodes Plates are also used to connect multiple fuel cells in a stack to achieve
voltages essential for various applications Bipolar plates usually made of graphite or steel are
grooved to channel the reactant gases through them The use of graphite or steel facilitates the
passage of electrons to the current collectors (Baker amp Zhang 2011) The collections of
conduits on bipolar plates that channel the reactant gases of the fuel cell are better known as flow
17
field patterns There are many different patterns for flow fields and research has not brought one
unifying optimal design but has elucidated efficient options for flow field patterns (Larminie amp
Dicks 2003) One study has tested multiple parameters of the flow fields by changing heights and
widths of channels (Wang et al 2006) In this experiment the goal was to balance the
manufacturing costs and performance of the bipolar plates The geometry of five channels was
varied in shape to promote convection and exchange between the layers of the MEA The study
concluded that flow fields can be optimized with diverging tapered channels that change the
convection currents By optimizing the channels at the inlet and outlet of each cell the efficiency
of the cell could be increased
Another important characteristic of bipolar plates that is directly related to the resistance
of the plates is thickness Increasing thickness of the plates contributes to larger voltage drop so
the thickness of the plates should be minimized to improve the power to weight ratio The
optimization of these plates becomes more complicated when considering the high flow rates of
air that are necessary to provide the appropriate amount of oxygen at the cathode for the oxygen
reduction reaction (ORR) Ultimately there is a trade-off between electrical conductivity and
reactant flow rate that must be balanced in the design of these plates and the overall design of the
fuel cells The bipolar plates can be integrated within a PEMFC with individual cells connected
with one bipolar plate thus reducing the number of interconnects
PEMFCs are remarkable energy conversion devices that have high energy densities in
comparison to cells of similar size For the technology to be effective PEMFCs need to be able
to withstand the stresses of the environments and loads that are imposed on them The durability
of PEMFCs is necessary for them to be viable products In the mid-1990s the PEMFC was
18
expected to be commercially viable for stationary applications by 2001 and viable for
transportation applications by 2003 but even today there are hurdles that are still present (Wu et
al 2008b)
The DOE established a target for the cost of $61-per-kilowatt in 2009 ($51 per kilowatt
in 2002 USD) to make fuel cells a competitive alternative in the market of portable cells for all
types of power applications (Spendelow amp Marcinkoski 2009) Since fuel cells are required to
have lifetimes that vary from 5000 to 40000 hours there are various methods to test the cells to
simulate the operating conditions of their applications (Wu et al 2008b) Real-time testing for
the lifespans of fuel cells would cost exorbitant amounts of capital but similar stressed
conditions can be reproduced by using accelerated testing techniques at much lower costs
Further the results of steady state tests for fuel cells presented a much lesser change in average
voltage drop per hour (when run for significantly less than 40000 h) than accelerated stress tests
(ASTs) (Wu et al 2008b)
The components of PEMFCs degrade in different manners and the mechanisms involved
in this degradation are not completely understood The various mechanisms are related so one
degradation mechanism may trigger or exacerbate another Noteworthy research has been
performed in this realm with the purpose of uncovering the mechanisms involved in the
degradation of PEMFCs In this section detailed degradation mechanisms of PEMFC
components are presented
231 Membrane Degradation
Membrane or electrolyte degradation is a severe form of deterioration that hinders
PEMFC performance over time PEMFCs degrade in manners mechanical thermal and
chemical or electrochemical in nature (Wu et al 2008b) These degradation phenomena could be
19
due to failures and defects in manufacturing processes of the MEAs including the introduction
of voids or foreign objects into the assembly tears pinholes perforations or cracks (Wu et al
2008b) Thermal degradation can occur outside the cellrsquos optimal operating range (60-80oC) in
extreme temperatures that the fuel cell could be subjected to in real world applications Chemical
and electrochemical degradation of PEMFC membranes can occur when an undesirable side
reaction takes place in direct relation to hydrogen and oxygen crossover
2311 Mechanical Degradation Mechanical degradation of membranes can specifically occur at the interfaces at which
the channels formed in the flow field are pressed causing tears In addition humidity plays a big
role in the dimensional shrinking or swelling of the membrane which adds to the pressure at
these interfaces (Wang 2009) With increasing humidity the membrane and gas diffusion layers
take up more water and expand increasing the overall dimensions of the PEMFC The opposite
occurs with decreasing humidity Non-humidification low humidification and humidity cycling
particularly impart intense mechanical stress upon the membrane and accelerate mechanical
degradation Also when crossover occurs at pinholes near electrodes a highly exothermic
reaction can occur that may slowly spread through the membrane and cause catastrophic failure
20
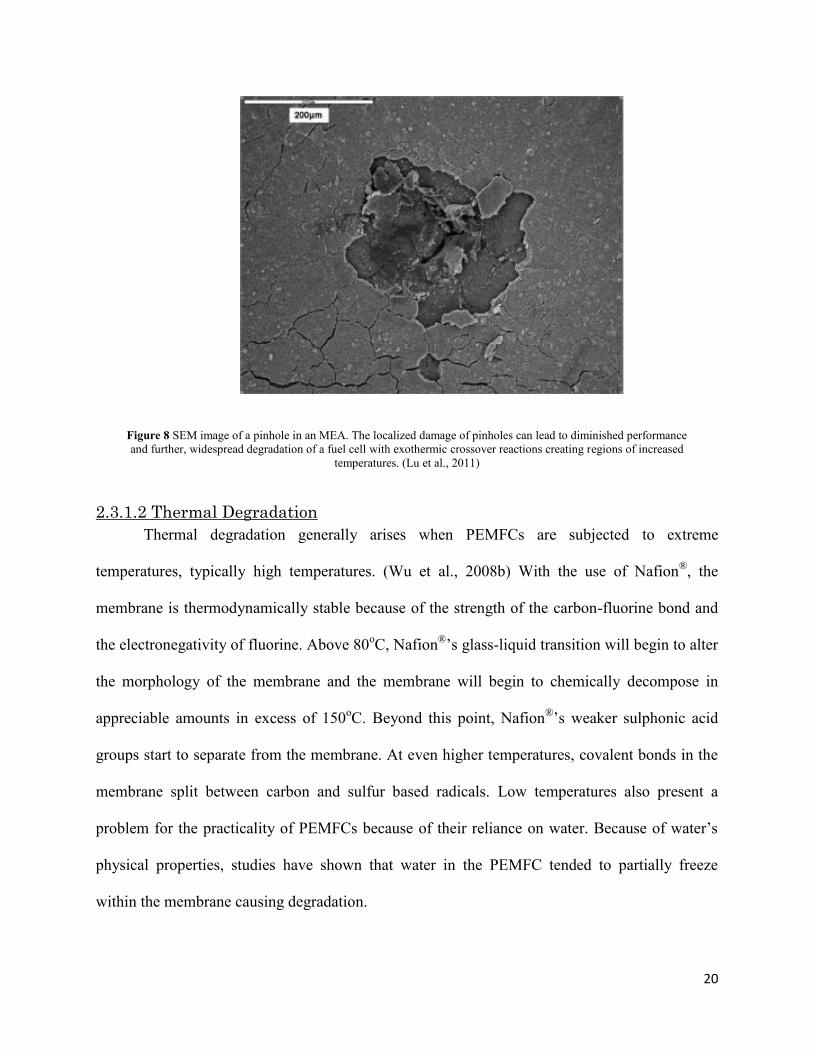
Figure 8 SEM image of a pinhole in an MEA The localized damage of pinholes can lead to diminished performance
and further widespread degradation of a fuel cell with exothermic crossover reactions creating regions of increased
temperatures (Lu et al 2011)
2312 Thermal Degradation
Thermal degradation generally arises when PEMFCs are subjected to extreme
temperatures typically high temperatures (Wu et al 2008b) With the use of Nafionreg
the
membrane is thermodynamically stable because of the strength of the carbon-fluorine bond and
the electronegativity of fluorine Above 80oC Nafion
regrsquos glass-liquid transition will begin to alter
the morphology of the membrane and the membrane will begin to chemically decompose in
appreciable amounts in excess of 150oC Beyond this point Nafion
regrsquos weaker sulphonic acid
groups start to separate from the membrane At even higher temperatures covalent bonds in the
membrane split between carbon and sulfur based radicals Low temperatures also present a
problem for the practicality of PEMFCs because of their reliance on water Because of waterrsquos
physical properties studies have shown that water in the PEMFC tended to partially freeze
within the membrane causing degradation
21
Cycling between low and high temperatures proves to result in considerable degradation
(Wu et al 2008b) A study evaluating thermal cycling on a PEMFC was performed by Giner Inc
and General Motors In this study repeated cycling was performed 385 times between -40oC and
80oC for two hour stints at each extreme over the course of three months (McDonald amp
Mittelsteadt 2004) Severe changes in ionic conductivity gas impermeability and impaired
mechanical strength of the membranes were observed however no catastrophic failures
occurred
2313 Chemical Degradation
Chemical and electrochemical degradation occur when a perfluorosulfonic acid
membrane such as Nafionreg decomposes due to undesired side reactions Researchers have
sought out to solve the problem involved with the membrane by understanding the mechanisms
involved in degradation It is believed that hydroxide and hydroperoxide radicals (∙OH and
∙OOH) form at the cathode surface causing chemical attack on the membrane electrolyte and
catalyst The studies performed have indicated that radicals do indeed form but whether the
source of the free radicals is the cathode anode or both is still uncertain Chemical degradation
mechanisms detailed in this section are weak end group initiation carboxylic acid end group
unzipping and side chain cleavage
The following mechanism has been proposed for when metals from the electrodes or
bipolar plates corrode and enter the membrane (Wu et al 2008b) In this mechanism the iron
ion can be substituted with any divalent cation that could possibly contaminate the fuel cell
22
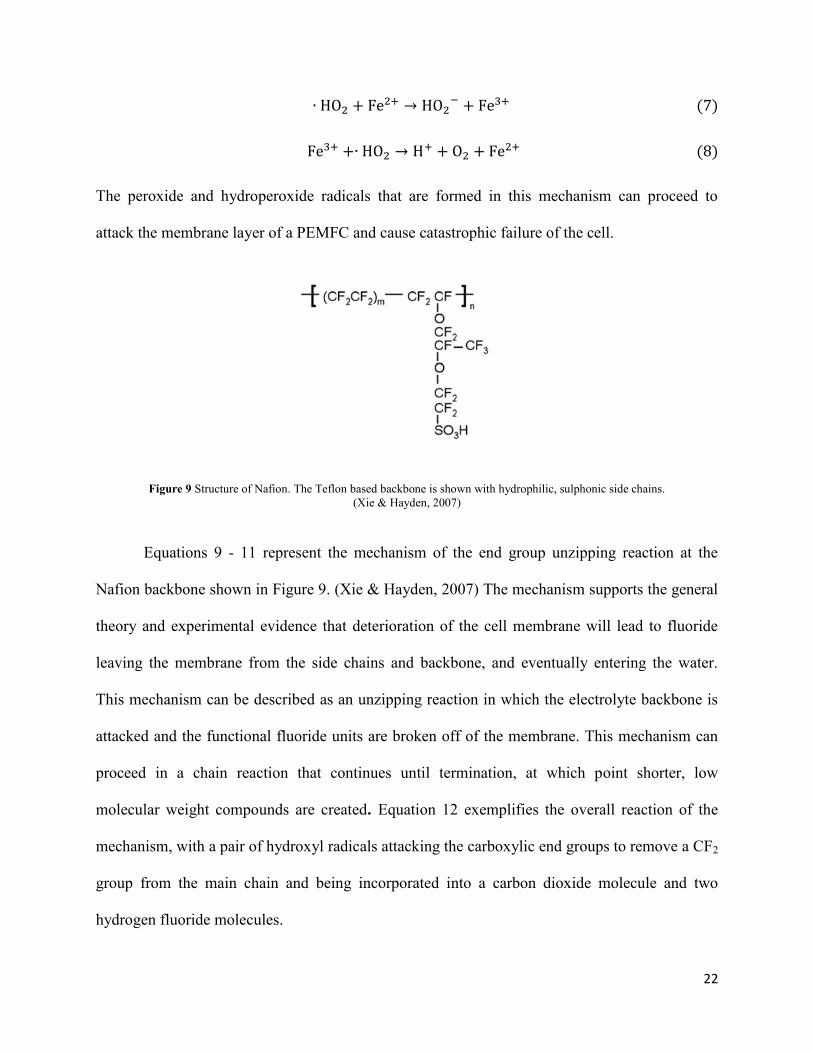
The peroxide and hydroperoxide radicals that are formed in this mechanism can proceed to
attack the membrane layer of a PEMFC and cause catastrophic failure of the cell
Figure 9 Structure of Nafion The Teflon based backbone is shown with hydrophilic sulphonic side chains
(Xie amp Hayden 2007)
Equations 9 - 11 represent the mechanism of the end group unzipping reaction at the
Nafion backbone shown in Figure 9 (Xie amp Hayden 2007) The mechanism supports the general
theory and experimental evidence that deterioration of the cell membrane will lead to fluoride
leaving the membrane from the side chains and backbone and eventually entering the water
This mechanism can be described as an unzipping reaction in which the electrolyte backbone is
attacked and the functional fluoride units are broken off of the membrane This mechanism can
proceed in a chain reaction that continues until termination at which point shorter low
molecular weight compounds are created Equation 12 exemplifies the overall reaction of the
mechanism with a pair of hydroxyl radicals attacking the carboxylic end groups to remove a CF2
group from the main chain and being incorporated into a carbon dioxide molecule and two
hydrogen fluoride molecules
23
In addition to the primary degradation mechanism via end group unzipping there is a
secondary reaction that is not negligible and must be accounted for (Wu et al 2008b) The
mechanism formulated for the secondary degradation is shown below in Figure 10 The figure
demonstrates how the mechanism cleaves along the main chain between the side chains of the
polymer backbone Once a portion of the main chain is cleaved the reaction continues according
to the primary mechanism outlined in Equation 9-12 until a termination reaction occurs
Figure 10 Secondary degradation reaction via end group unzipping (Xie amp Hayden 2007)
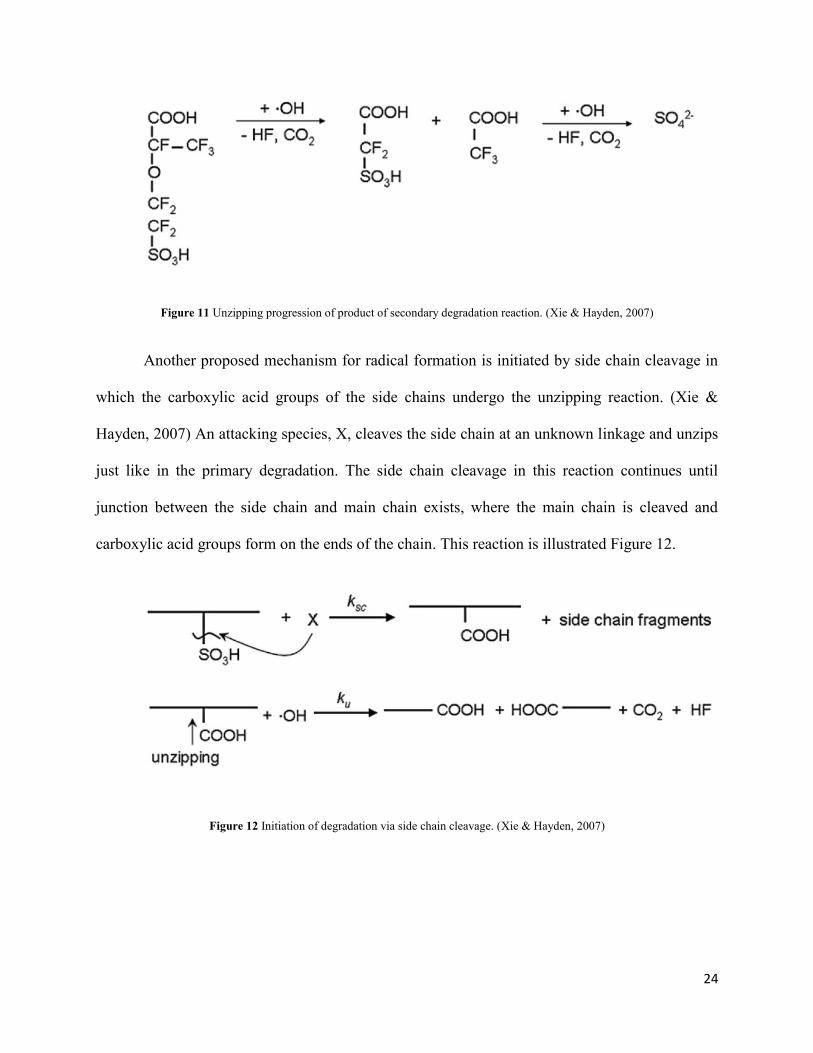
The molecular product HOOC-CF(CF3)-O-CF2CF2-SO3H of the reaction illustrated in
Figure 10 is small enough to diffuse through the polymer membrane and block sites for hydrogen
ions to flow through (Xie amp Hayden 2007) This molecule can undergo further unzipping as
shown in Figure 11 in which ultimately leads to the formation of carbon dioxide hydrogen
fluoride and sulfate ions
24
Figure 11 Unzipping progression of product of secondary degradation reaction (Xie amp Hayden 2007)
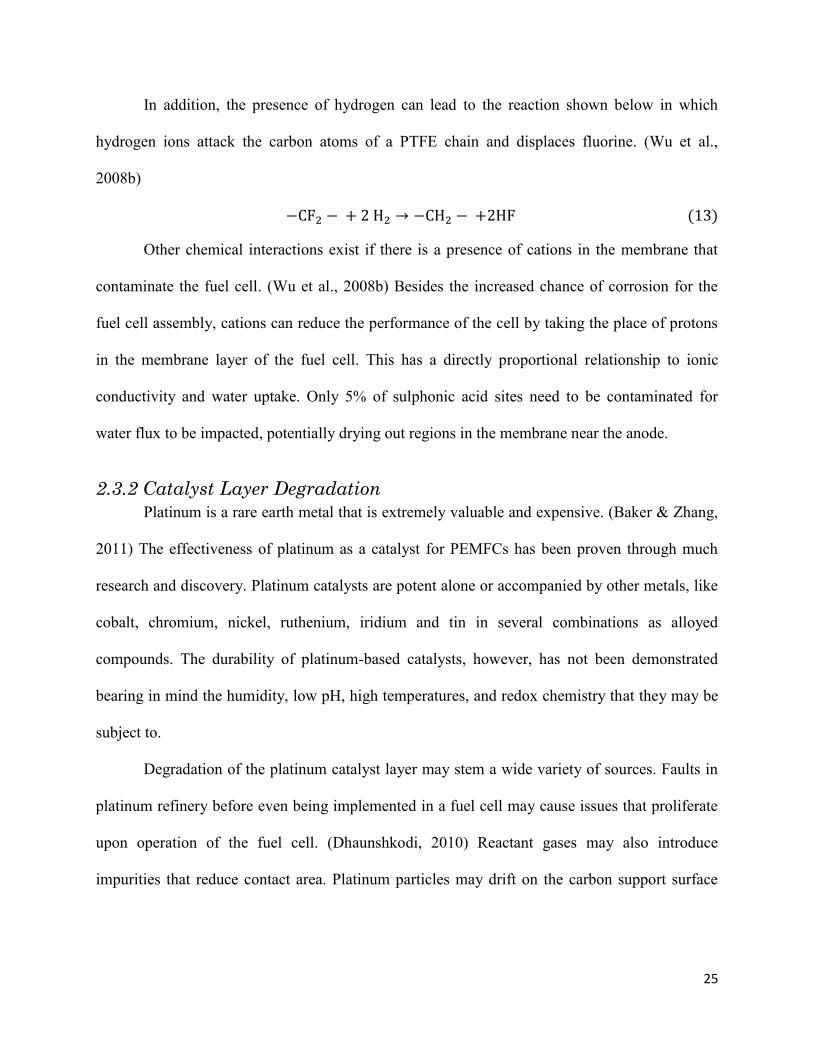
Another proposed mechanism for radical formation is initiated by side chain cleavage in
which the carboxylic acid groups of the side chains undergo the unzipping reaction (Xie amp
Hayden 2007) An attacking species X cleaves the side chain at an unknown linkage and unzips
just like in the primary degradation The side chain cleavage in this reaction continues until
junction between the side chain and main chain exists where the main chain is cleaved and
carboxylic acid groups form on the ends of the chain This reaction is illustrated Figure 12
Figure 12 Initiation of degradation via side chain cleavage (Xie amp Hayden 2007)
25
In addition the presence of hydrogen can lead to the reaction shown below in which
hydrogen ions attack the carbon atoms of a PTFE chain and displaces fluorine (Wu et al
2008b)
Other chemical interactions exist if there is a presence of cations in the membrane that
contaminate the fuel cell (Wu et al 2008b) Besides the increased chance of corrosion for the
fuel cell assembly cations can reduce the performance of the cell by taking the place of protons
in the membrane layer of the fuel cell This has a directly proportional relationship to ionic
conductivity and water uptake Only 5 of sulphonic acid sites need to be contaminated for
water flux to be impacted potentially drying out regions in the membrane near the anode
232 Catalyst Layer Degradation
Platinum is a rare earth metal that is extremely valuable and expensive (Baker amp Zhang
2011) The effectiveness of platinum as a catalyst for PEMFCs has been proven through much
research and discovery Platinum catalysts are potent alone or accompanied by other metals like
cobalt chromium nickel ruthenium iridium and tin in several combinations as alloyed
compounds The durability of platinum-based catalysts however has not been demonstrated
bearing in mind the humidity low pH high temperatures and redox chemistry that they may be
subject to
Degradation of the platinum catalyst layer may stem a wide variety of sources Faults in
platinum refinery before even being implemented in a fuel cell may cause issues that proliferate
upon operation of the fuel cell (Dhaunshkodi 2010) Reactant gases may also introduce
impurities that reduce contact area Platinum particles may drift on the carbon support surface
26
and aggregate or sinter to decrease surface area dissolve into the electrolyte or also lose activity
due to galvanic corrosion of the carbon support
There has been no unified agreement on the mechanisms that are involved in catalyst
layer degradation though several have been proposed A mechanism called Ostwald ripening
suggests that platinum particles dissolve into the ionomer phase and precipitate on larger
particles that lead to particle agglomeration (Wu et al 2008b) The dissolved platinum particles
could also flow into the membrane and precipitate within the membrane causing losses in
membrane proton conductivity Another suggested mechanism is that agglomeration occurs in a
normal-log distribution of particle size Based on particle collision kinetics the mechanism
suggests that even if platinum particles are uniformly distributed when initially manufactured
kinetics will drive particles together Eventually the distribution will have agglomeration regions
of platinum particles Another similar mechanism is also based on a normal distribution except it
is based on Gibbrsquos free energy minimization instead of kinetic energy
Oxide formation at the electrodes has also been attributed to increased platinum particle
size as well as reduces active surface area ultimately decreasing catalytic activity Carbon
corrosion has also been a major contributor to the gradual decline of PEMFC performance of the
lifespan of the fuel cell Power cycling and hydrogen fuel starvation due to pore blockage at the
anode in conjunction with voltage cycling are the two modes believed to contribute to carbon
27
corrosion
Figure 13 Platinum Catalyst Degradation a) A TEM micrograph of an original platinum catalyst (black) on carbon
support can be seen as well as b) a TEM micrograph degraded catalyst The operation of the PEMFC has caused
agglomeration of platinum particles a decrease in platinum content in addition to a morphological change in the
carbon support (Luo et al 2006)
Power cycling of a PEMFC or startup and shutdown cycling creates an uneven supply of
reactant gases with hydrogen at the anode and oxygen in air crossing over towards the anode
Fuel starvation may be the result of uneven sharing of react flow between the cells in a stack or
due to ice formation at freezing temperatures Carbon and water oxidation will occur when
hydrogen blocks the pores and its supply is exhausted from the local region of the catalyst layer
with the follow reactions
Thermodynamically feasible from 067 V carbon oxidation does not happen occur readily but
platinum and platinum-ruthenium catalysts on carbon support have been shown to reduce the
carbon oxidation potential from the usual 11 VRHE to 055 VRHE increasing the frequency of
oxidation
28
233 Gas Diffusion Layer (GDL) Degradation
Gas diffusion layers are critical components for mass transport within the fuel cell
(Zhang et al 2007) Although some studies have discussed the morphology of the GDL and the
influence of pore size distribution on mass transport only a limited amount of studies have
focused on degradation of the gas diffusion layer and its effect on fuel cell performance (Wu et
al 2008b) Through understanding GDL degradation fuel cell durability can be improved
Through each degradation mechanism the fuel cell will decrease in efficiency Some
studies demonstrated that GDLs are susceptible to chemical attack and electrochemical
oxidation (Wu et al 2008b) Such losses decrease GDL conductivity and hydrophobicity which
further lowers MEA performance Corrosion on the GDL will increase resistance and decrease
electrical output or conductivity Some other areas where GDLs are vulnerable are degradation
of baking material and decreased water management from mechanical stress In study conducted
by Borup a decrease in hydrophobicity can also be due to an increased operating temperature
and the use of sparing air instead of nitrogen (Wu et al 2008b)
Because each degrading point negatively affects the durability of the entire cell more
studies must be conducted on the GDL Quantitative correlations between performance loss and
changes in GDL properties will give better understanding on fuel cell durability
234 Bipolar Plate Degradation
The bipolar plates are used to connect PEM cells with one another keep reactant
gases and utility cooling or heating supplies apart conduct current and distribute reactant gases
across the MEA These multipurpose plates are susceptible to degradation primarily in the form
of corrosion Corrosion of bipolar plates can be largely detrimental to PEMFC function As
indicated by the mechanism in Equations 4-8 corrosion leading to foreign cations entering the
MEA will take up sites that water and protons will normally exist in
29
The manufacturing and production of the bipolar plates for PEMFCs is very important to
prevent contamination of the cells so the material selection and design of the flow fields must be
considered in a concerted effort The material implemented in bipolar plates must have excellent
electrical and heat conductivity while the gas permeability must be very low Strong corrosion
resistance and mechanical strength is required since the plates will be constantly exposed to
oxygen hydrogen water vapor and an acidic electrolyte (Larminie amp Dicks 2003) On top of
these conditions the weight volume and costs must also be minimized The two main classes of
materials that are used are metal and carbon Graphite based plates the meet the conductivity
requirements of PEMFCs but their advantages are counteracted by their porous and brittle nature
and vulnerability to shock and vibration which forces the plate designs to be thick and heavy
Metals can also be used for bipolar plates and are conductive and dense so they can be
very thin Common noble metals like platinum tantalum niobium and zirconium have great
properties for bipolar plate production except the raw material cost of these metals is very high
(Wu et al 2008b) Metals are not without disadvantages however understanding that the most
feasible metals used for production are either susceptible to oxidation or corrosion Titanium and
aluminum are also effective metals and metal alloys that are much cheaper than noble metals
Nevertheless these two metals are likely to form oxide layers between the plates and the gas
diffusion layer which significantly increases contact resistance Steel is another metal considered
in production however it is also susceptible to galvanic corrosion While coatings can be
applied to metals the production time and costs increase
It turns out that most of the bipolar plate manufacturers are split on these technologies as
both types of plates are produced for use in fuel cells Both metal and carbon based bipolar plates
are used and introduce various contaminants into the reactant streams as the metals and carbon
30
are oxidized These metal and carbon contaminants cause degradation at the catalyst and
membrane as stated in their respective sections
Due to their low emissions high efficiency and power density PEM fuel cells are a
promising alternative energy source however several challenges still remain To address these
challenges intensive research and development is needed To aid in RampD fuel cell testing and
diagnostic tools have become vital in performance optimization design validation and
development of a fundamental understanding of fuel cell operation (Yuan et al 2010) The
diagnostic tools used and discussed in this report are electrochemical impedance spectroscopy
(EIS) water management analysis and the polarization curve
241 Electrochemical Impedance Spectroscopy (EIS)
Regarded by scientists as a powerful technique electrochemical impedance spectroscopy
(EIS) is used to investigate physical phenomena and essential loss factors occurring within a fuel
cell By analyzing performance losses the influence of operating parameters on the overall
response can be determined (Zhang et al 2007) In PEM studies the uses of EIS technique
includes (a) to obtain electrochemical parameters through the development of an equivalent
circuit (EC) (b) to assist in determining problems within the fuel cell by differentiating
resistances at individual fuel cell components (c) to provide microscopic information about the
fuel cell to aid in structure optimization and selection of operating conditions Other uses in PEM
include the differentiation of components such as the GDL to overall fuel cell performance and
the identification of individual contribution to the total impedance such as charge transfer and
mass transfer (Zhang et al 2007)
31
In a fuel cell the electrochemical reactions consist of an electron transfer at the electrode
surface (Yuan et al 2010) Through the system these reactions cause resistances mainly
membrane resistance (ohmic resistance) and charge transfer and mass transfer resistance at the
electrode surface Ohmic resistance ( is an intrinsic characteristic and can increase due to
membrane drying contamination and thermal degradation It is mainly due to internal resistance
of the fuel cell including electrolyte catalyst and contact resistance The charge transfer
resistances ( for both the anode and cathode refer to the barrier through which the electron
passes across the electrode surface This resistance is then related to electrode potential or
overpotential Mass transfer by diffusion refers to the transfer of H2 and O2 to the electrode
surface Through EIS reaction resistances can be represented as an electrical circuit as seen in
Figure 14 The circuit includes electrolyte resistance or ohmic resistance charge transfer
resistance double layer capacitance and mass transfer or diffusion resistance at both the anode
and the cathode
Figure 14 Equivalent circuit to PEM fuel cell RΩ is ohmic resistance Rct is charge transfer resistance and Ws is
mass transfer or Warburg impedance CPE is the capacitance relative to double layer charge at the interface of the
fuel cell
The general PEM circuit depicts resistances involved at both the anode and the cathode
However due to the slow oxygen reduction reaction and the fast hydrogen reduction reaction
the diffusion resistance of the fuel cell nearly equals that of the cathode (Wu et al 2008a) The
32
anode side of the circuit of a PEM fuel cell is then reduced to only include the capacitance and
charge transfer resistance
In EIS a small AC current as a perturbation signal varying between 10 kHz to 100 mHz
is applied to the cell in addition to a steady current (Wu et al 2008a) When this is done a
measurement of the frequency dependence of fuel cell is obtained through the resulting potential
response With this technique known as Galvanostatic mode (GEIS) the current through the cell
is precisely controlled By using GEIS in combination with an interpretation of the spectra
resistances from each component in the electrical circuit can be extracted Conventionally
impedance spectra are plotted on both Bode and Nyquist plots (Wu et al 2008a) Impedance is
made up of both imaginary and real parts In the Bode plot the impedance is illustrated as the
amplitude and phase of impedance versus frequency In the Nyquist plot the opposite plot is
graphed against the real part of impedance (Zrsquo vs Zrdquo) Figure 15 illustrates a traditional Nyquist
plot with two arcs as frequency decreases from left to right
Figure 15 Nyquist plot A mathematical model is fitted to experimental data to obtain resistance values From the plot a
high frequency and low frequency arc are displayed The distance from the origin to where the spectra cross the x-axis is
the ohmic resistance
33
From the plot three areas where resistances occur can be identified high frequency
resistance (ohmic resistance) high frequency arc low frequency arc Each of these areas relate to
resistance due to the electrolyte (ohmic) charge transfer and mass transfer respectfully
In the Nyquist plot ohmic resistance is illustrated as the distance from the origin to the
point in which the spectra cross the x-axis as seen in Figure 15 Cathode resistance can be split
into two sections the high frequency arc and low frequency arc The high frequency arc is
related to the charge transfer resistance ( ) The low frequency arc is due to mass transfer or
diffusion resistance and can be expressed as Warburg impedance (Zhang et al 2007)
From data collected in the GEIS model fitting can be conducted to identify quantitative
parameters representing resistances as well as electrode capacitance The fitting process is
conducted by minimizing the difference between experimental data and the model By analyzing
resistance values over time information on operation conditions and agingdegradation can be
obtained
EIS provides detail information on operations within the fuel cell With EIS
measurements can be conducted under real-world conditions ie open circuit voltage or under
load (Scribner Associates 2011) From this single experiment multiple parameters can be
determined and analyzed with relatively simple measurements Other advantages to this
diagnostic tool are EIS measurements are high precision and non-invasive
242 Water Management
Analysis on the water produced by a fuel cell is used to understand dynamics and
degradation Water flow within the cell can be analyzed by the following parameter
34
where FA
is the molar flow rate of water in the anode and similarly for the cathode For all
experiments conducted no water was introduced at the anode or Equation 17 is then
simplified to
Typically is greater than zero meaning that the net flow of water is from cathode to
anode If the water transport coefficient is zero there is not net flow and the flow of electro-
osmosis is equal but opposite Finally if is less than zero water flow is from anode to cathode
This can occur when water is introduced into the anode side
243 Polarization Curve
The standard electrochemical technique used to characterize the performance of fuel cells
is the polarization curve Polarization signifies that an electrochemical reaction takes place as the
potential of the electrode surface shifts away from its equilibrium point (Yuan et al 2010) A
polarization curve is essentially a plot of cell voltage against current density under a set of
constant operating conditions (Wu et al 2008a) By constructing a polarization curve the effects
of varying operating conditions such as temperature composition and relative humidity can be
systematically analyzed
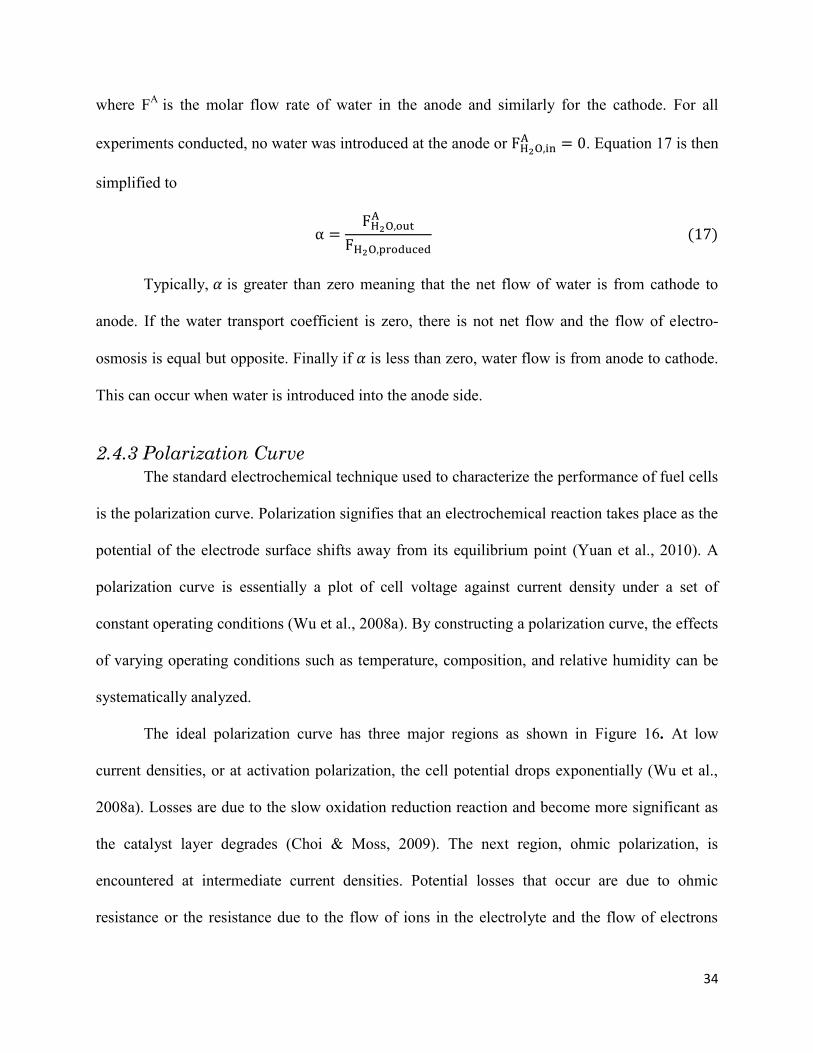
The ideal polarization curve has three major regions as shown in Figure 16 At low
current densities or at activation polarization the cell potential drops exponentially (Wu et al
2008a) Losses are due to the slow oxidation reduction reaction and become more significant as
the catalyst layer degrades (Choi amp Moss 2009) The next region ohmic polarization is
encountered at intermediate current densities Potential losses that occur are due to ohmic
resistance or the resistance due to the flow of ions in the electrolyte and the flow of electrons
35
through the electrode Here the ohmic resistance contributes the most to the potential drop which
is essentially linear Finally at high current densities concentration polarization occurs Due to
the limit of the reactant gas through the GDL and electrocatalyst layer cell performance drops
significantly Such losses can be amplified through improper water management or impure gas
feeds
Figure 16 Polarization Curve In the ideal curve three regions of resistance are shown (Dhaunshkodi 2010)
Not only can the polarization curve directly characterize the performance of fuel cells it
can also be used as a modeling tool to predict how a fuel cell will act Through modeling
theoretical performance can be compared to experimental results and analyzed
2431 Theoretical Modeling
Mathematical modeling is a useful tool used to predict the performance of a fuel cell By
utilizing theoretical models operating conditions can be optimized Although theoretical
modeling is a useful tool it can be challenging due to numerous design parameters and the
36
complexity of a fuel cell itself Through modeling the importance of each parameter and its
influence on fuel cell performance can be evaluated
First to understand correlations from the polarization curve to experimental data it is
vital to investigate the electrochemical parameters Two significant parameters indicated in the
polarization curve are overpotential and exchange current density (Yuan et al 2010)
Overpotential is the difference between the applied potential and the thermodynamic potential
typically 1229 V for a PEM fuel cell at 25 The relationship demonstrates that the higher the
current the higher the overpotential On the other hand exchange current density is a kinetic
parameter depending on the active electrode surface area that the electrochemical reaction occurs
on In general the magnitude of determines how easily the reaction occurs on the electrode
surface Exchange current density is related to overpotential in that the smaller is the higher
the overpotential
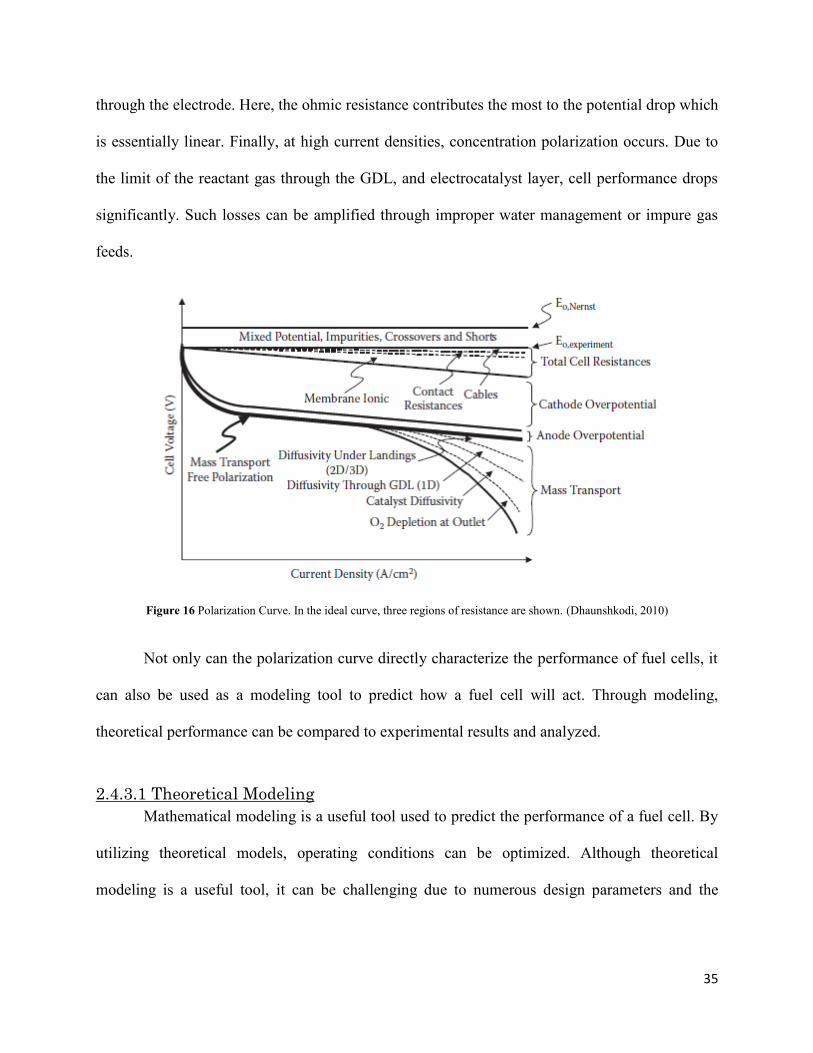
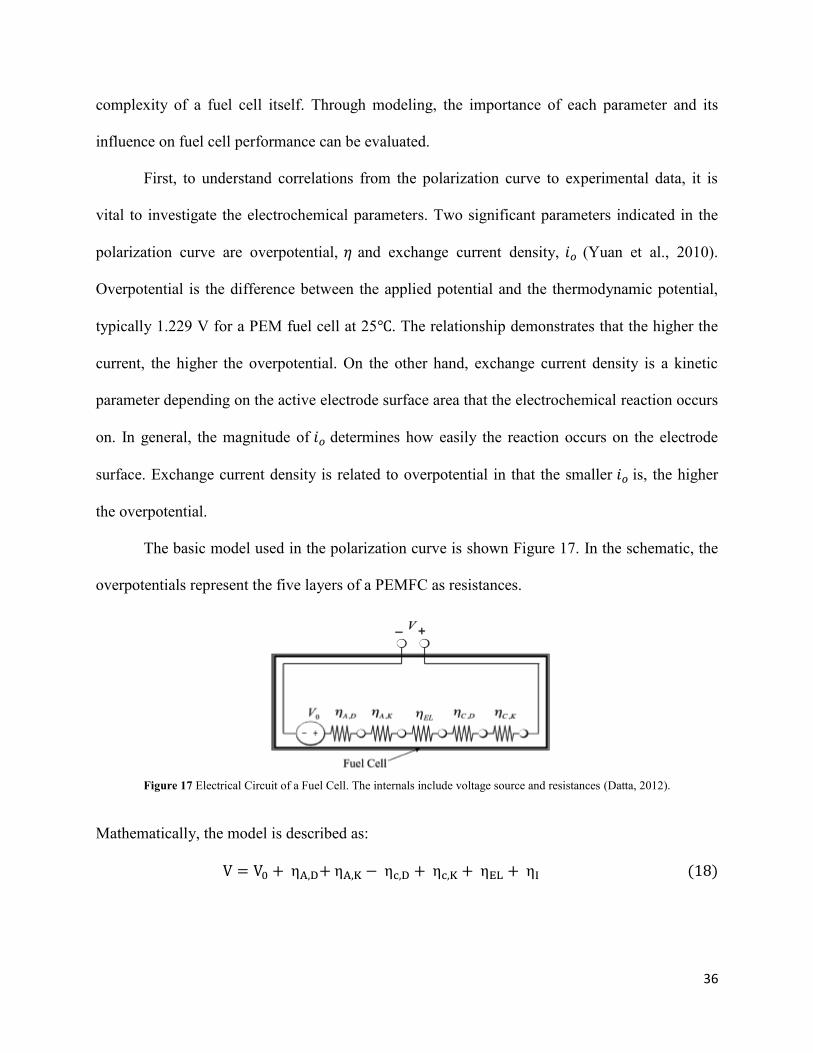
The basic model used in the polarization curve is shown Figure 17 In the schematic the
overpotentials represent the five layers of a PEMFC as resistances
Figure 17 Electrical Circuit of a Fuel Cell The internals include voltage source and resistances (Datta 2012)
Mathematically the model is described as
37
where is the thermodynamic voltage and is potential drop across each layer (Datta 2012)
Potential drop across the anode and cathode are characterized as diffusion ( and electrode
reaction over potential ( which can be summed Thus
The losses for the anode can then be written as
[
frasl
frasl]
Likewise the potential drop for the cathode is
[
frasl
frasl]
where is the transfer coefficient is the electron stoichiometric number and is the
limiting current density Unlike the anode overpotential at the cathode takes into account
potential drop due to hydrogen crossover (Vilekar amp Datta 2010) The cross over current
density due to hydrogen flux can be expressed as
where is the permeability of hydrogen and is the membrane or electrolyte thickness The
exchange current density for both the anode and cathode can be calculated as
(
)
(
)
where is the partial pressure of the species permeating at the electrode is the effective
activation energy and is the roughness factor The roughness factor is the ratio of
electrochemically active metal catalyst surface area to the geometric MEA area and is given in
terms of particle diameter by
38
where is the part of the metal diameter which is accessible for reaction is the catalyst
loading and the catalyst density From these relations by increasing the roughness factor
temperature or concentration of the species the exchange current density will be increased
Next over potential occurring at the electrolyte layer is calculated as
(
)
Here is the protonic conductivity of the membrane (Vilekar amp Datta 2001) By combining
the above equations the theoretical fuel cell performance can be calculated as
[
frasl
frasl]
[
frasl
frasl]
(
)
where is described as the interfacial resistance between layers This expression
yields the cell voltage V versus current density i Theoretically in the absence of current the
voltage of the cell should equal to the thermodynamic or ideal voltage however due to the
presence of side reactions the voltage at zero current density is not equal to the thermodynamic
potential (Vilekar amp Datta 2011) At zero current density hydrogen crossover exists at the
cathode therefore the cathode overpotential is not equal to zero at zero current density As
current is drawn the sum of potential drop across the fuel cell is registered By changing
characteristic parameters the exchange current densities roughness and limiting current
densities the effect on cell performance can be observed
Although the polarization curve model provides adequate information on mechanisms
within the cell it is also useful to model the resistances within the cell at different operating
39
conditions via impedance spectroscopy (Datta 2012) By differentiation of the overpotentials in
relation to current charge transfer resistances at the anode and cathode can be determined The
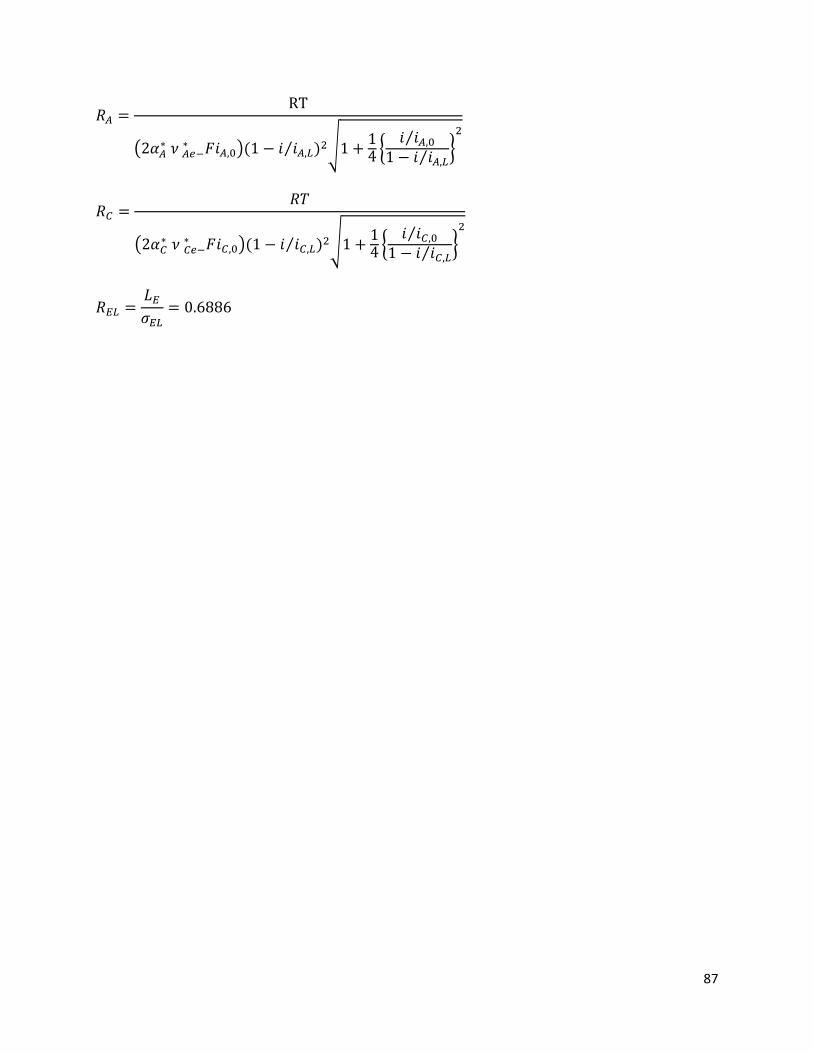
resistance at the anode and cathode are then
(
) frasl radic
frasl
frasl
and
(
) (
)
radic
frasl
frasl
Through a similar analysis the ohmic resistance or resistance in the electrolyte is derived as
The calculated resistances can be compared to data extracted from EIS The use of modeling by
the polarization curve accompanied by resistance calculations provides a useful tool in predicting
and interpreting fuel cell performance
40
30 Methodology The experiments presented in this report were executed at Ecole Nationale Supeacuterieure des
Industries Chimiques (ENSIC) in Nancy France Experiments were separated into three sections
aging of a three-cell healthy stack degradation in a three-cell stack with a defect in the first cell
and basic polarization curve modeling Experiments conducted on the three-cell stack fuel cell
operated at nominal conditions over a period of four weeks Over the course of four weeks water
and electrochemical impedance spectra were collected and analyzed from the cell Experiments
on the three-cell stack with a defect in the first cell occurred at the same operating conditions as
the healthy stack Finally the polarization model was used to predict cell performance of a single
cell Resistances from the stack were also compared to results from the model In this section
equipment used and experimental procedures are presented
The first part of this project analyzed aging in a three-cell at steady state conditions The
operation of the stack at nominal conditions occurred for a period of four weeks Throughout the
four weeks data was collected and analyzed each day to evaluate aging and degradation patterns
within the stack This section describes the equipment used and procedures followed on
experiments conducted on the healthy stack
311 Equipment
Equipment used in this project consisted of a fuel cell bench and accompanying software
This section will describe the stack assembly operating conditions and monitoring software used
to conduct the experiment
41
3111 Fuel Cell Bench
A schematic and picture of the work bench are shown in Figure 18 and Figure 19
respectively The fuel cell bench was comprised of a stack evaporator flow instruments and a
pump For the fuel cell system pure hydrogen and air (21 oxygen) was supplied to the anode
and cathode respectively
Figure 18 Experimental Schematic
Figure 19 Experimental Bench and Hood
42
Hydrogen and humidified air flow rates were determined based on Faradayrsquos law of
electrolysis The law states that the quantity of a substance produced or consumed by electrolysis
is directly proportional to the quantity of electricity used To provide an excess amount of gas
needed for the target current density (03 Acm2) the stoichiometric coefficient (λ) of hydrogen
was set to 15 (50 excess) λ of oxygen was set to 3 At the anode dry hydrogen gas entered the
system at 094 Lmin atone atmosphere and 55 To ensure humidified air was flowing into the
cathode air at 448 Lmin and deionized water at 038 gmin were mixed in an evaporator at
110 Figure 20 illustrates the heater configuration Air flowed above the plate while water was
heated through the channels After contact with the heater the water evaporated mixing with air
and forming a heterogeneous vapor mixture
Figure 20 WaterAir Heater Configuration (Huang 2012)
The flow rate of water corresponds to the amount of saturated water necessary to
humidify the air adequately The heterogeneous mixture was then introduced to a homogenizer to
produce a homogenous vapor at 55 and 62 relative humidity At both the anode and cathode
side water exited and was retained in two large beakers In order to guarantee the accuracy of
the water balance at the cathode side the outlet flow was first cooled in a condenser with cooling
43
water supply at 3 The flow rate at the anode side was too small for vapor condensate to make
an appreciable difference in the balance
To maintain steady state conditions fluid flow rates were monitored using Brooks
Instrument Readout amp Control Electronics heaters were monitored using Huber Polystate CC3
Heater
3112 Stack Assembly
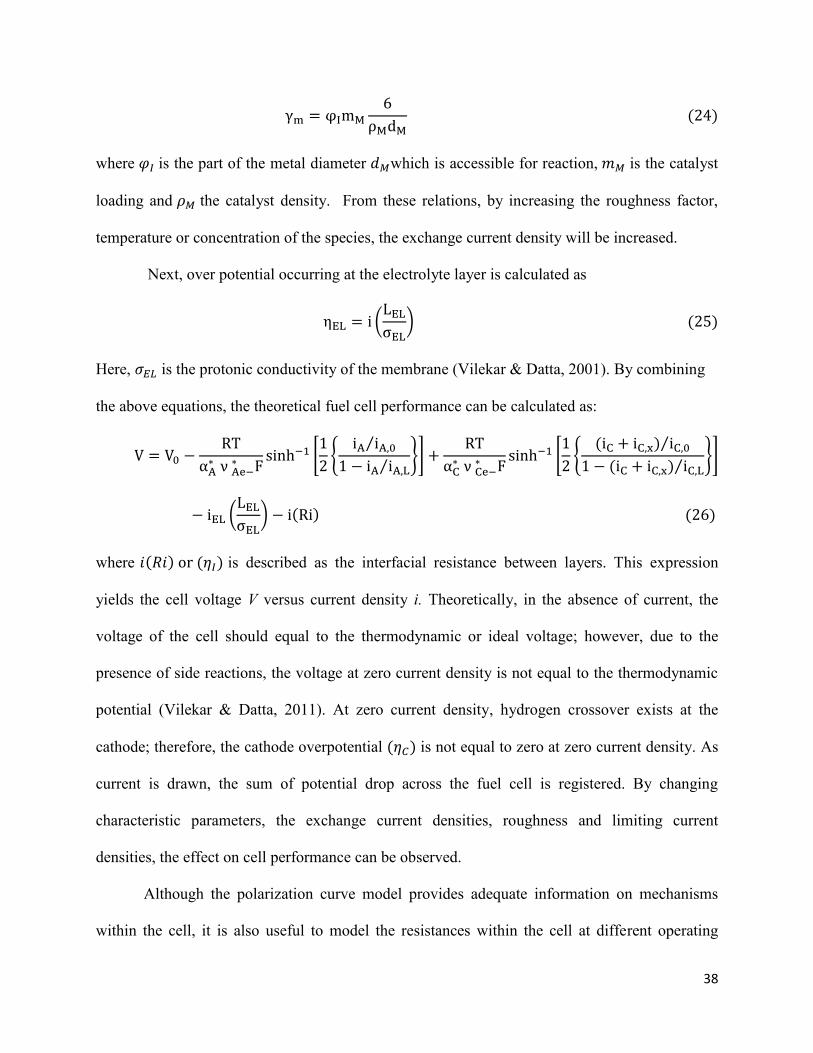
The fuel cell used for these experiments was composed of three healthy cells connected
in series Each cell was compiled of carbon paper (Sigracetreg made by SGL Technologies) as the
gas diffusion layer a fresh MEA (PRIMEAreg made by Gore) and two bipolar plates The ldquocarbon
paperrdquo itself was a bilayer with a macroporous side adjacent to the bipolar plate and flow field
with a microporous side adjacent to the catalyst layer The MEA was comprised of the
electrolyte and catalyst layers The electrolyte was an ePTFE enhanced perfluorosulfonic acid
(PFSA) polymeric membrane The catalyst on the anode side was 045 mgcm2 of a 5050
mixture of platinum to ruthenium particles on carbon support and the cathode side was 040
mgcm2 of platinum on carbon support The active area of each MEA per cell was 100 cm
2 The
basic assembly is shown in Figure 21
44
Figure 21 MEA and Carbon Paper Layers
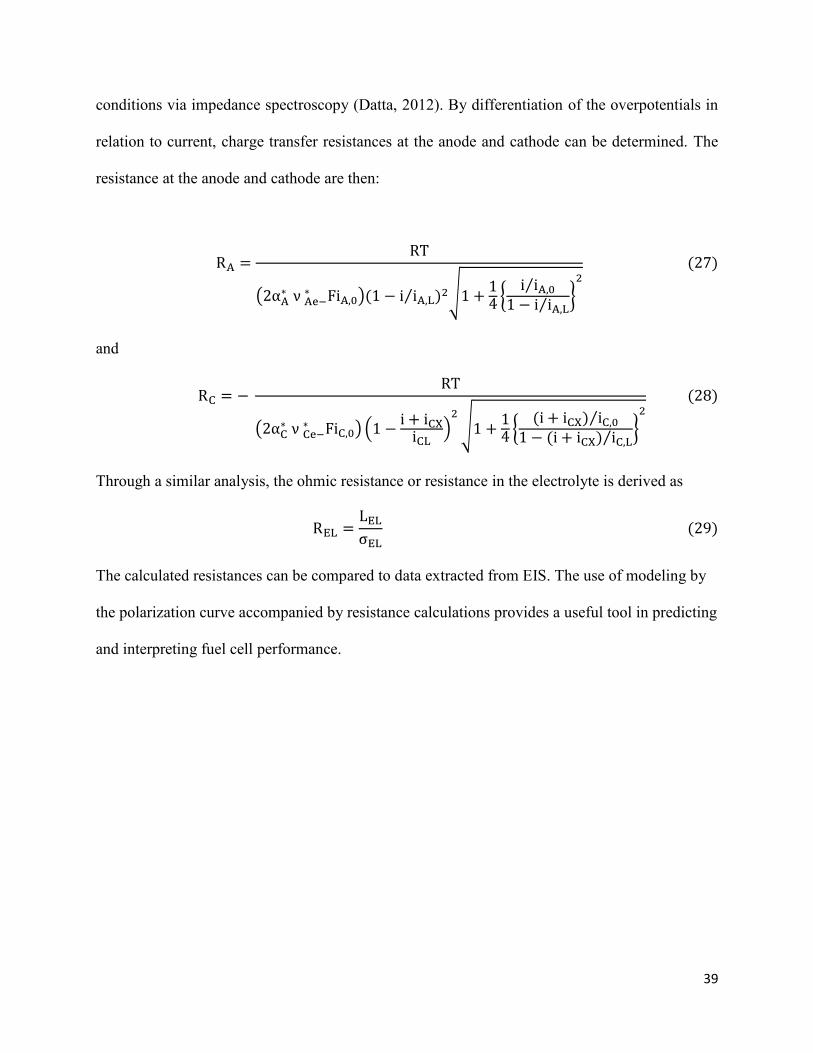
The bipolar plate used at the end each cell is displayed in Figure 22 Figure 22 A
illustrates the gas distribution to the fuel cell This side of the plate faces towards the gas
diffusion layer at both the anode and cathode sides The Figure 22 B displays the reverse side of
the bipolar plate On this side hot water is distributed evenly through the plate the distribution
of hot water is utilized to heat the cell and maintain a temperature of 55
Figure 22 (left) A) Bipolar Plate reactant distribution channels and (right) B) hot water distribution channels
(UBzM 2012)
45
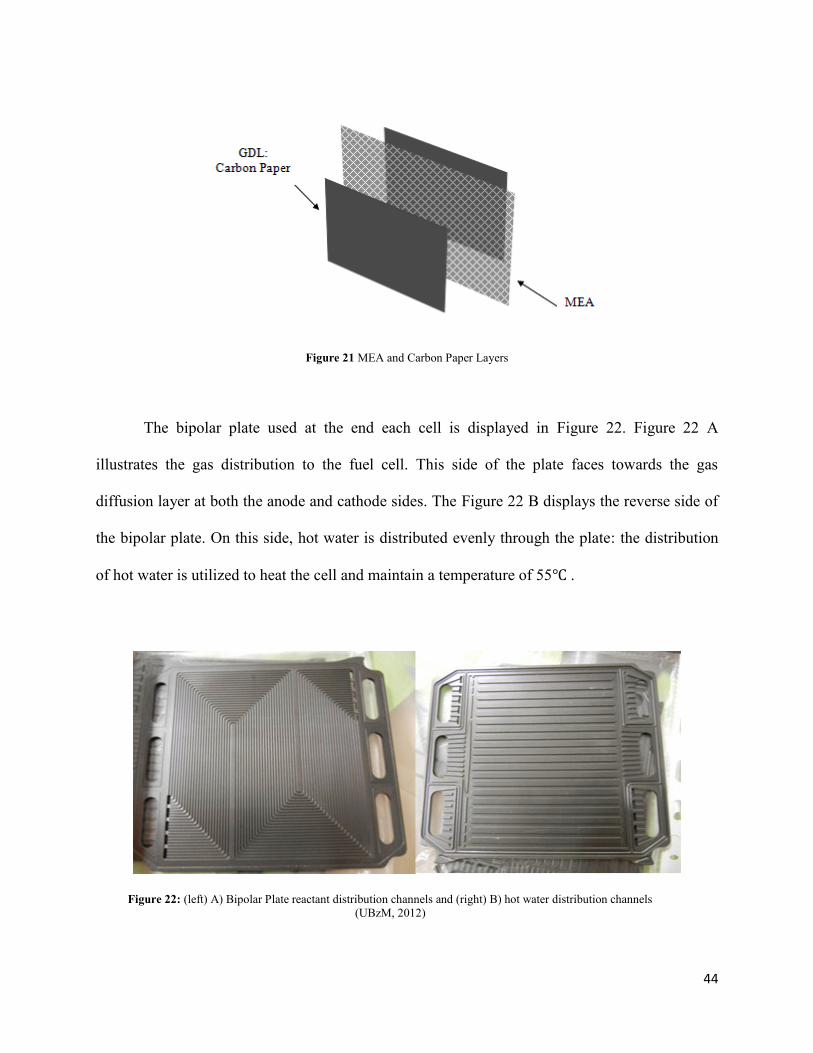
The nominal conditions of the stack are summarized in Table 2
Table 1 Nominal Operating Conditions
Steady State Operating Conditions
Temperature 55
Area (cm2) 100
Current (A) 30
Current Density (Acm2) 03
Relative Humidity
Anode 0
Cathode 62
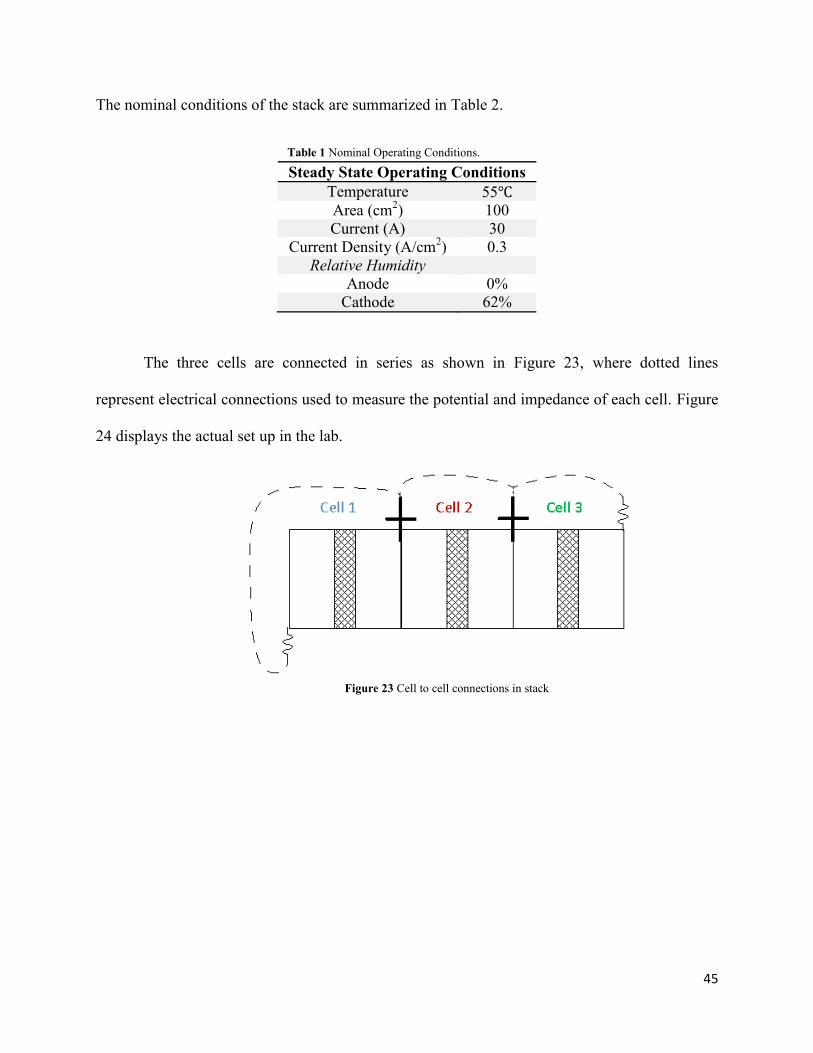
The three cells are connected in series as shown in Figure 23 where dotted lines
represent electrical connections used to measure the potential and impedance of each cell Figure
24 displays the actual set up in the lab
Figure 23 Cell to cell connections in stack
46
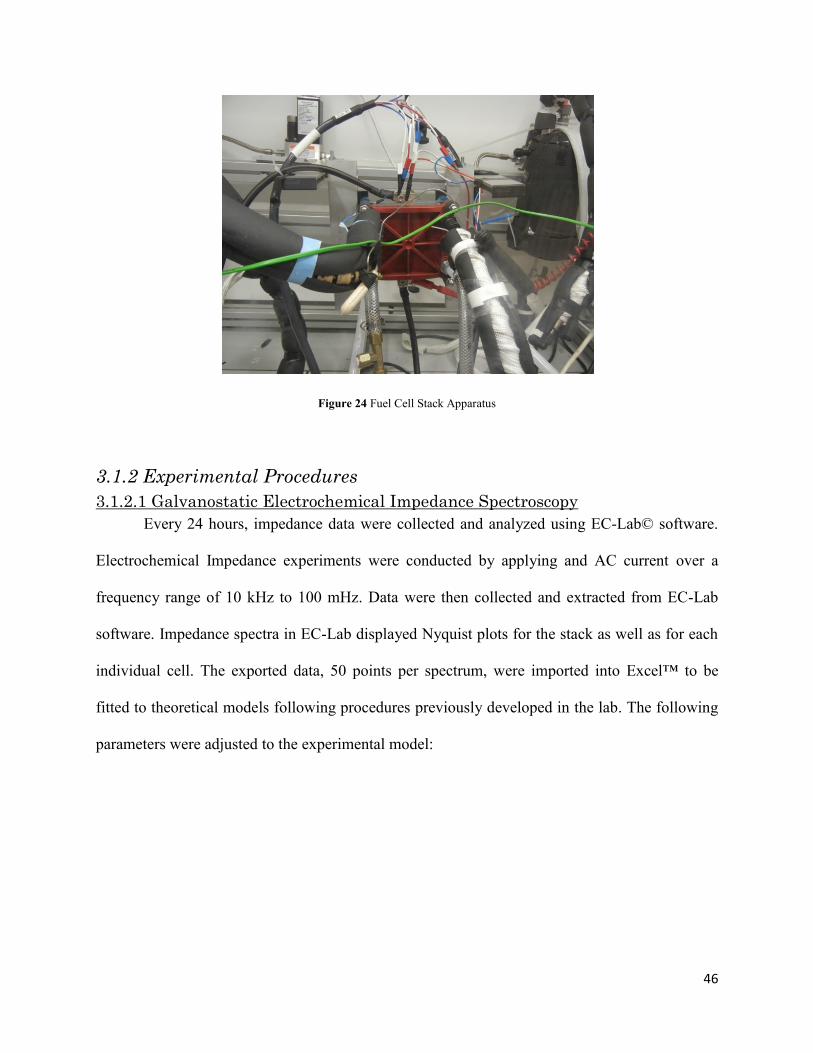
Figure 24 Fuel Cell Stack Apparatus
312 Experimental Procedures
3121 Galvanostatic Electrochemical Impedance Spectroscopy
Every 24 hours impedance data were collected and analyzed using EC-Labcopy software
Electrochemical Impedance experiments were conducted by applying and AC current over a
frequency range of 10 kHz to 100 mHz Data were then collected and extracted from EC-Lab
software Impedance spectra in EC-Lab displayed Nyquist plots for the stack as well as for each
individual cell The exported data 50 points per spectrum were imported into Exceltrade to be
fitted to theoretical models following procedures previously developed in the lab The following
parameters were adjusted to the experimental model
47
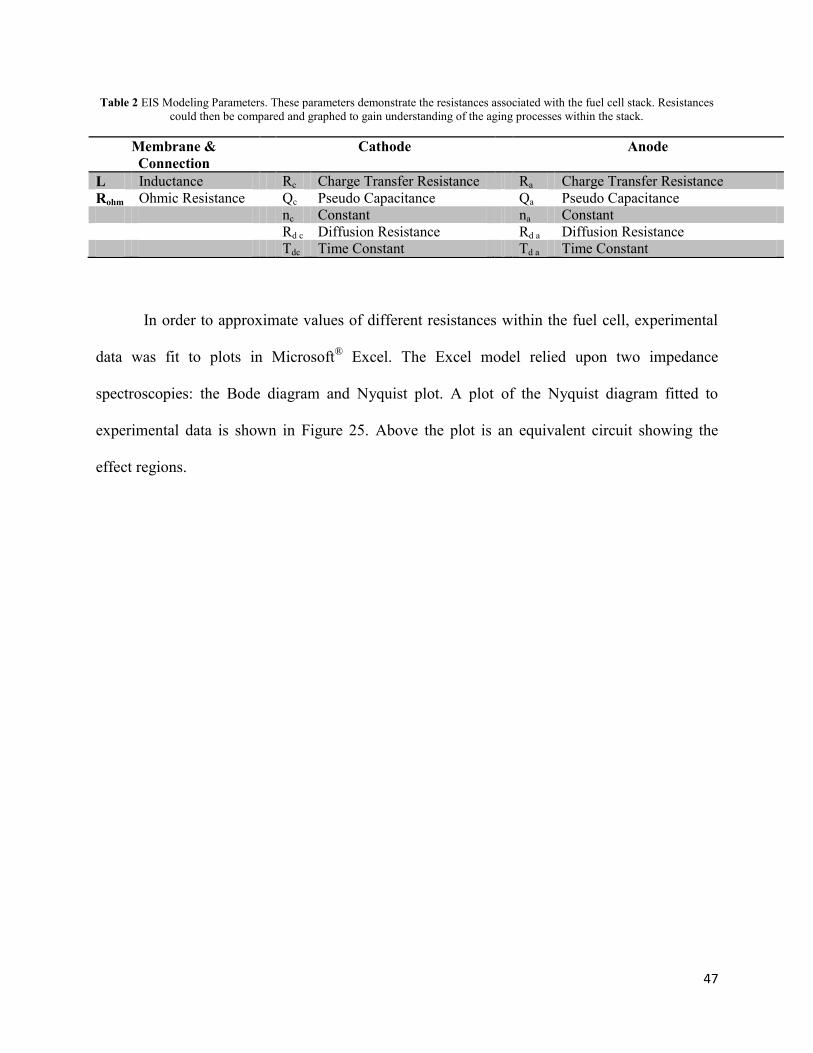
Table 2 EIS Modeling Parameters These parameters demonstrate the resistances associated with the fuel cell stack Resistances
could then be compared and graphed to gain understanding of the aging processes within the stack
Membrane amp
Connection
Cathode Anode
L Inductance Rc Charge Transfer Resistance Ra Charge Transfer Resistance
Rohm Ohmic Resistance Qc Pseudo Capacitance Qa Pseudo Capacitance
nc Constant na Constant
Rd c Diffusion Resistance Rd a Diffusion Resistance
Tdc Time Constant Td a Time Constant
In order to approximate values of different resistances within the fuel cell experimental
data was fit to plots in Microsoftreg Excel The Excel model relied upon two impedance
spectroscopies the Bode diagram and Nyquist plot A plot of the Nyquist diagram fitted to
experimental data is shown in Figure 25 Above the plot is an equivalent circuit showing the
effect regions
48
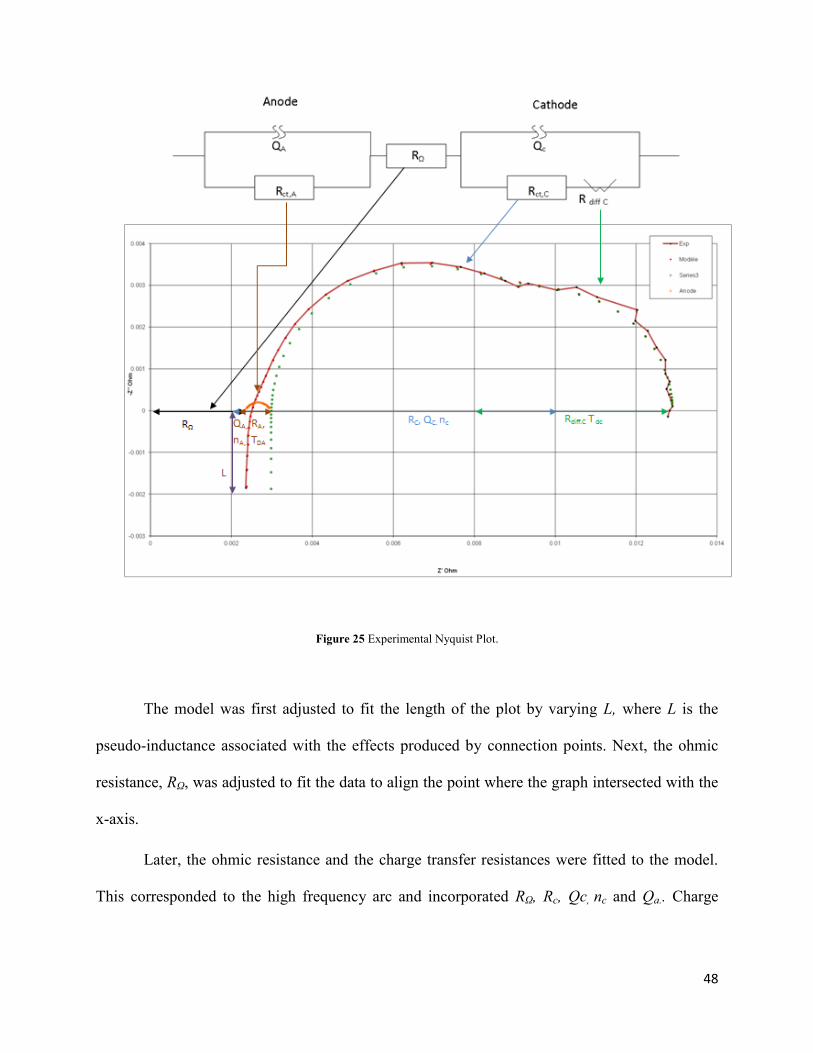
Figure 25 Experimental Nyquist Plot
The model was first adjusted to fit the length of the plot by varying L where L is the
pseudo-inductance associated with the effects produced by connection points Next the ohmic
resistance RΩ was adjusted to fit the data to align the point where the graph intersected with the
x-axis
Later the ohmic resistance and the charge transfer resistances were fitted to the model
This corresponded to the high frequency arc and incorporated RΩ Rc Qc nc and Qa Charge
49
transfer resistance at the anode is small in comparison to the cathode and can therefore be fixed
at the anode Ra is calculated to be 110 Rc
After fitting charge the high frequency arc the diffusion resistance or the low frequency
arc was fitted to the model (Rdc and Tdc) The diffusion resistance at the anode was considered
negligible and was set to zero An overall fit of resistances was then conducted to appropriately
fit both plots Figure 26 shows examples of both plots fitted to the data
Figure 26 GEIS Fitting (Top) Nyquist Plot and (Bottom) Bode Diagram
50
This process was repeated for the stack and each individual cell for a total of four
experimental values per day In the model the cathode capacitance Qc was determined to be the
pseudo-capacitance Qc could not be measured directly because it is linked to the exponent nc
The capacitance was then estimated with a true capacitor Cc and equivalent resistance RCeq The
following relations were used (Franck-Lacaze et al 2009)
(
) (30)
( )
After fitting RΩ Rcteq and V were plotted against time in hours
3122 Water Balance Calculations
Water management in a PEMFC is crucial to its stability and performance over its
lifespan At the end of each day the water produced from each side of the cell was collected and
massed The temperature of the water vapor at the anode and cathode was also recorded To
monitor water production within the fuel cell calculations were performed to compare the
theoretical water production to the actual water produced within the stack
First a mass balance was conducted on the anode side of the fuel cell
(32)
(33)
where F is Faradayrsquos constant (96485 coulombsmol) I is the current (30A) and λ is the
stoichiometric coefficient of hydrogen (15) Next the water flow rates exiting at the anode is
calculated Water exiting at the anode was due to water transport from the cathode to the anode
51
Because effluent water is both in vapor and liquid form two calculations were conducted The
flow rate of vapor water exiting the anode ( is expressed as
( )
where is the water vapor fraction and is the flow rate of liquid water out of the
anode The water vapor fraction was calculated using Antoinersquos equation
(
)
where T is the measured temperature of the vapor exiting the anode in Celsius By dividing the
partial pressure by the total pressure (1 atm) the water vapor fraction was found The flow rate
of liquid water was determined from the mass of water collected in the lab over the time in which
the experiment took place (~24 hrs)
The same principles were then applied to the cathode side An oxygen balance was
conducted where
(36)
(
) (37)
Here λ is 3 At the cathode air is fed therefore to calculate the flow of air into the cathode FO2
in must be divided by 21 ie the molar fraction of oxygen in air
At the cathode water also entered the system A complete water balance must then be
conducted Before entering the fuel cell water and air enter a homogenizer From the
temperature of the cell fixed at 55 the temperature of the homogenizer can be found
52
In the above equation the relative humidity RH is set to 62 The saturated pressure values
were equated using Antoinersquos equation The temperature of the humidifier was then calculated
The water vapor fraction entering the system was then equated by
The water vapor entering the fuel cell at the cathode was then found by
( )
Water flow rates exiting the cathode were then calculated The temperature of the vapor
exiting the cathode was measured The measured temperature was then used in Antoinersquos
equation to determine the partial pressure of the vapor The flow of the effluent vapor from the
cathode was then
(42)
where is the vapor fraction determined by Henryrsquos law and was found by
Similar to the anode liquid water collected was weighed and then divided by the duration of
time to calculate the flow rate of water produced at the cathode
To calculate the percent error and the water transport coefficient (α) the theoretical water
produced must first be calculated Theoretical water produced is then calculated by
(44)
53
The water transport coefficient is then calculated by
(45)
The outlet excess reactant coefficient was also calculated with the following relationship
(46)
By analyzing these two coefficients over time an analysis was conducted on the degradation of
the fuel cell stack
Analysis of a three-cell defective stack was the second part of this project The three-cell
stack was connected in series with a defect in the first cell The defect in the first cell consisted
of a single pinhole in the MEA made by puncturing the MEA with a thumbtack To produce
comparable data to the healthy stack previously tested equipment operating conditions and
stack assembly were identical to that of the healthy stack Each experiment conducted on the
healthy stack was repeated for the defective stack Data was collected and analyzed daily and
compared data from the healthy stack
The final section of this project conducted at ENSIC consisted of predicting and verifying
fuel cell performance through theoretical models Using the polarization curve model developed
in section 243 parameters were adjusted to fit experimental data previously collected on a
single cell PEMFC The single cell consisted of a 100 cm2
MEA operating at 55 At the anode
the catalyst was composed of equal parts ruthenium and platinum the cathode catalyst was
54
composed of platinum Data collected from the single cell ranged from a current density (i) of
01 Acm2 to 08 Acm
2 EIS data was also extracted from the single cell
331Modeling Parameters
The polarization modeling was first conducted Specific parameters from the single cell
are shown in Table 3 Parameters were estimated from literature from a typical PEMFC (Datta
2011 Vilekar amp Datta 2010)
Table 3 Parameters for theoretical model Parameters were specific to the single cell fuel cell and estimated according to
literature (Datta 2011 Vilekar amp Datta 2010) Sample calculations can be found in Appendix A
Because the cell operated at (55 ) the thermodynamic voltage was adjusted by
where and
were the partial pressures of oxygen and hydrogen respectfully Partial
pressures were then calculated by
The partial pressure of water was calculated using Antoinersquos equation The mole fraction
(x) of oxygen and hydrogen were 021 and 1 respectively
The roughness factor was then adjusted in accordance to catalyst parameters
described in Table 4 At the anode the catalyst was composed of equal parts ruthenium and
Operating Parameters Anode Cathode
T (K) 328 αa 05 αc 05
PT (atm) 1 vae 1 vce -2
iaoref(Acm
2) 300E-3 icl(Acm
2) 15
ial(Acm
2) 4 icoref(Acm
2) 1E-10
EAφ0 (kJmol) 346 ECφ0 (kJmol) 670
55
platinum Since the oxidation on ruthenium was negligible the catalyst loading at the anode was
calculated by
where 045 mg cm-2
was the total catalyst loading at the anode and Mi was the molar mass
(Huang 2012) By first evaluating the number of moles (y) platinum loading at the anode was
then equated
Table 4 Roughness parameters (Huang 2012)
Anode Cathode
560 320
(
) 0225 0400
(
) 2145 2145
ϕ 095 095
The exchange current densities were then determined for the anode and cathode as
described in section 243 where
(
)
(
)
Next the crossover current at the cathode was calculated by
where was the thickness of the membrane (18μm) or the permeability of hydrogen was
calculated by (Vilekar amp Datta 2010)
(
)
Both the anode and cathode overpotentials were then calculated using methods described in
243
56
To complete the polarization model the membrane overpotential was evaluated From
section 243 the membrane overpotential was derived as
(
)
where was the membrane thickness (18μm) The protonic conductivity was estimated
using (Thampan et al 2001) as well as assumptions made due to the material manufactured by
Gore was calculated by
(
) (
(
))
where the Nafion volume fraction in the Gore ePTFE membrane was estimate to be 07 the
ratio of effective diffusion coefficients was 55 and the activation energy was 14000
The volume fraction of water in the membrane was evaluated by
where was the number of molecules absorbed per ndashSO3H group The concentration of
water was also related to by
The percolation threshold or the ability of the electrochemical species to pass through the
membrane was expressed as
The degree of dissociation in terms of the equilibrium constant was
57
radic (
)
(
)
where
(
(
))
The theoretical polarization curve was then plotted with data extracted from the single
cell Estimated values ie limiting current densities and reference exchange current densities
were evaluated to ensure that the model and data correlated
After obtaining the theoretical polarization curve the theoretical resistances
were compared resistances extracted from EIS
For complete theoretical calculations please see Appendix A
58
40 Results and Discussion The main objective of this project was to compare and analyze aging in a three-cell
healthy stack to a three-cell stack with a pinhole defect operating at nominal conditions The next
objective was to verify the use of theoretical models to predict cell performance of a single cell
This section will investigate gathered experimental results in comparison to literature and theory
The analysis of the healthy three-cell stack in this project yielded results that
corresponded to degradation theories and mechanisms detailed in this report This portion of the
report will provide a review of the results and suggest the degradation phenomena that reduced
the PEMFC stack performance over time
411 Electrochemical Impedance Spectroscopy
By modeling the impedance spectra resistance values within the fuel cell stack could be
obtained and analyzed Data collected daily for four weeks from the healthy stack was graphed
as shown in the figures below Experimental data illustrated a relative constant ohmic resistance
for the three individual cells however the second cell in series (Cell 2) demonstrated a lower
ohmic resistance An overall increase in charge transfer and diffusion resistances was also
observed Complete data is included in Appendix B
4111
The ohmic resistances extracted from the cells remained relatively constant throughout
the four week period as seen in Figure 27 The ohmic resistance of each cell is of the same
magnitude however Cell 2 demonstrates a smaller resistance than Cell 1 and Cell 3 This
inconsistency in ohmic resistance may be attributed to the setup of the stack Physically within
the stack Cell 2 was sandwiched between Cell 1 and Cell 3 requiring different clips to achieve
59
contact with the electrodes The difference in resistance about 0025 ohm cm2 was observed
between Cell 2 and Cell 1 and 3
Figure 27 Healthy Stack Rohm C Ohmic resistance is relatively constant throughout the four week period The stack was
composed of three healthy cells connected in series with an active MEA area of 100cm2 per cell operating conditions were
TFC=55oC Tambient fluctuated over span of experiment i=03Acm2 P=1 atm
Although the ohmic resistance remained fairly constant throughout the experiment
theoretically the ohmic resistances should slightly increase From this data conclusions for
performance based on the positioning of the cells cannot be made considering the difference in
Cell 2 probably was due to differing cable resistance
The reproducibility of results across the cells suggests that the components of the fuel cell
were not subject to gross manufacturing defects as well Membrane drying probably did not
contribute to the ohmic resistance since the membrane was well saturated It is likely that some
of the chemical mechanisms for membrane degradation detailed in the background of this report
occurred in the PEMFC stack however a water fractions analysis would be necessary to
60
understand what portion of the polymer chains cleaved The mechanisms shown in Equations 4-8
and Equations 9-11 are most likely to have occurred
Ostwald ripening of platinum or ruthenium catalyst may have caused platinum
precipitation within the membrane and increased ohmic resistance This would proceed to block
ionomeric pores in the membrane limit proton conductivity and potentially provide surface for
crossover gases to react and produce pinholes It is unlikely that significant precipitation
occurred given the time span of the experiment Factoring the steady-state setup of the fuel cell
with constant reactant gas flow rates and relative humidity these results validate the consistency
in the ohmic resistance seen in previously in experiments run by LRGP
4112
The diffusion resistances were observed to increase at similar rates for each of the three
cells demonstrated in Figure 28 The rate of increase of the diffusive resistance in Cell 2 was
greater than those of either of the other two cells This is indicative of a hindrance between the
catalyst layer and the bipolar plates of the cells Greater mass transport resistance in Cell 2 could
be due to the geometry of the inlet flows and outlet flows of the fuel cell stack or even
temperature variations between the inner cell and the outer two cells or across the GDLs of the
cells An increase in mass transport resistance may also be due to water generation and
accumulation due to carbon (carbon support and GDLs) degradation As water accumulates
oxygen transport at the cathode is limited In addition to traveling through the GDL the oxygen
must diffuse through the excess water molecules too Oxidation of oxygen containing groups at
the surface of carbon is likely to have occurred The datarsquos upward trend suggests that the
corrosion of the carbon support of the catalyst and the carbon may be a primary contributor to
the increases in diffusion resistance
61
Figure 28 Healthy Stack Individual Cell Rd C The diffusion resistance at the cathode over the four week period linearly
increases The stack was composed of three healthy cells connected in series with an active MEA area of 100cm2 per cell
operating conditions were TFC=55oC Tambient fluctuated over span of experiment i=03Acm2 P=1 atm
4113
Like diffusion resistances the charge transfer resistances increased for each of the three
cells The rate of increase was not uniform for each cell as shown in Figure 29 The charge
transfer resistance in Cell 2 increases faster than that of the other two cells As the charge
transfer resistance grows the kinetics of the oxygen reduction reaction (ORR) slows down The
increase in charge transfer resistance across the cell can be substantiated by recognizing the
chemical degradation at the three-phase-interface between the membrane and cathode It is here
that oxygen is reduced accepting electrons It is also a prime region for undesired membrane
and catalyst degradation to occur
62
Figure 29 Healthy Stack Individual Cell Rct C Like diffusion resistance the charge transfer resistance at the cathode also
linearly increases over time Cell 2 provides a larger resistance than Cell 1 or 3 The stack was composed of three healthy cells
connected in series with an active MEA area of 100cm2 per cell operating conditions were TFC=55oC Tambient fluctuated over
span of experiment i=03Acm2 P=1 atm
A decrease in catalyst surface area may also promote catalyst degradation Catalyst
degradation through dissolution into water may have contributed to Ostwald ripening in which
this dissolved catalyst may deposit in the membrane on agglomerate on the electrode Corrosion
of the carbon support as mentioned in section 4112 is also a probable factor increasing charge
transfer resistance
Equations 5-7 detail how destructive radicals are formed within a PEMFC through the
breakdown of hydrogen peroxide that can be formed with the presence of hydrogen crossover at
the cathode The general increase in charge transfer resistance could also be attributed to thermal
variations to the system caused by temperature fluctuations impacting outlet streams The
increase of the charge transfer resistance also could be due to water accumulation Accumulation
63
in fuel cells blocks active catalyst sites slowing oxygen reduction reaction kinetics at the
cathode
412 Cell Voltages
From spectrometry data voltage data was also obtained Over time the voltage decreased
within each cell When the voltage fluctuated it did so in a pattern consistent across all the cells
in the stack This was most probably a result of changes to operating conditions Such conditions
included hydrogen supply and temperature Figure 30 illustrates the voltage from each healthy
cell over the four week period
The cell voltages indicate that performance of the cells in the fuel cell stack was steadily
declining over the four-week experiment The differences in perceived performance output may
be a result of varying resistances in the cables used to record voltage The positioning of the cells
may have played a legitimate role in the differing voltages of the cells if the resistances of the
cables were insignificant The reactant gas streams entering the fuel cell stack entered at Cell 1
and then flowed through Cell 2 and then Cell 3 It is probable that the flow rates of the gases
were higher in Cell 1 gradually decreasing through Cell 2 and then Cell 3 due to pressure drop
This expected difference in pressure drop and corresponding flow rate may have dried out the
membrane in Cell 1 more so than in Cell 2 or Cell 3 potentially causing the difference seen in
the data The resistance discussion provided by the EIS spectroscopy in section 411 presented
possible degradation mechanisms occurring in the cells These mechanisms are also applicable to
the reduction in cell voltage although conclusions regarding the differences in voltages of the
individual cells cannot be fully extracted
64
Figure 30 Healthy Stack Individual Cell Voltage Decreasing linearly with time at similar magnitudes for the each of the cells in
the stack voltage is a primary indicator of fuel cell degradation The stack was composed of three healthy cells connected in
series with an active MEA area of 100cm2 per cell operating conditions were TFC=55oC Tambient fluctuated over span of
experiment i=03Acm2 P=1 atm
413 Water Management
Over a span of four weeks water mass and outlet temperature data were collected for the
PEMFC stack The data gathered from the stack helped in the computational analysis of the mass
balance and water management and thereby can be used as a metric for PEMFC efficiency
Water was collected from the anode and cathode outlets of the stack but it is important to
recognize that no water is generated or supplied to the anode side Water enters cells at the
cathode side through the humidified air and is generated by the ORR Two parameters were used
to observe the residence time of water in the stack the water transport coefficient α and W
65
The water transport coefficient is the ratio of the net water flux or flow rate out of the fuel
cell at the anode side to the water produced by the cell α is an indicator of water management
within the cell indicating the net water flux from the cathode to the anode since dry hydrogen is
fed to the anode side
Figure 31 Healthy Stack Water Transport Coefficient over a run time of 35570 minutes 10 error bars are shown
based on average value of data points The data shows a moderate downward trend as either electro-osmotic drag
becomes stronger or diffusive flux becomes weaker (TFC=55oC Tambient fluctuated over span of experiment
i=03Acm2
Figure 31 shows the data from the healthy stack run over the span of four weeks The
data indicates a moderate drop in α over time however the correlation is not strong enough to
warrant a causal relationship If the relationship was valid the electro-osmotic drag may have
increased the diffusive flux may have decreased or a combination of the two may have
occurred
The excess reactant coefficient W is the ratio of the water flow (both vapor and liquid) of
one outlet of the PEMFC to the flux of saturated vapor exiting the same outlet of the fuel cell
66
(Huang 2012) This coefficient generalizes the phases of water that exist the cell The water is
completely vapor when W is between zero and one saturated vapor when W is equal to one and
completely liquid when W is greater than one Values for W were calculated for both the anode
and cathode sides of the fuel cell and are presented in Figure 32 and Figure 33
Figure 32 Healthy Stack Excess Reactant Coefficient Wa over a run time of 35570 minutes 10 error bars are
shown based on average value of data points The data shows a slight downward trend as the vapor content of the
anode stream increases (TFC=55oC Tambient fluctuated over span of experiment i=03Acm2)
Figure 32 shows the values of Wa over the experiment performed with a healthy stack of
fuel cells The data shows that W is exclusively positive illustrating that water there is a
significant amount more water at the anode side than calculated at saturation This indicates that
liquid water is present in excess at the anode Figure 33 displays the values of Wc over the
duration of the experiment and is also positive but less so than Wa This indicates that the
cathode also has more liquid water than expected at saturation but to a lesser extent than the
anode outlet
67
Figure 33 Healthy Stack Excess Reactant Coefficient Wc over a run time of 35570 minutes 10 error bars are
shown based on average value of data points The data shows a slight downward trend as the vapor content of the
cathode stream increases (TFC=55oC Tambient fluctuated over span of experiment i=03Acm2)
The Wa values are seen to have much more variation than Wc data This variation stems
from the inherent difference in mass transport of the water at the cathode and the anode At the
cathode the water travels through the GDL bipolar plate and exits the stack At the anode
however the water must travel across the membrane in addition to the GDL and bipolar plate of
the anode side increasing variability These values correspond to the positive α values discussed
earlier in this section since the net flux is from the cathode to the anode side This verifies that
the membrane is likely to be fully saturated as the Wa values are firmly positive and the α
values indicate that the water solely entering at the cathode side is indeed travelling to the anode
side
68
Membrane drying therefore should contribute significantly to reduced performance and
degradation of the PEMFC stack over time The fuel cell researchers at ENSIC have decided
that humidification for fuel cells proves to deliver greater performance based on literature and
prior experiments although a general consensus in academia and the industry has not been
reached (Huang 2012)
In an effort to observe the effects of pinhole defects in a PEMFC stack the MEA of the
first cell in a three-cell stack was punctured to produce pinholes At first one pinhole was
introduced however no discernible differences in the data trends were observed Hydrogen
supply problems also occurred throughout the experiment After a week this test was terminated
and followed by a similar setup except with 16 pinhole defects reproduced in the first cell of the
three-cell stack as shown in Figure 34
Figure 34 MEA with 16 pinholes
69
This test also encountered problems however with a fault in a hydrogen supply line the
data was invalidated Since the data in these two experiments were gathered over a short span
they were not particularly effective at showing a change in the patterns of the fuel cell stack over
time
Polarization and EIS data collected on a single cell were compared to theoretical models
and calculations Figure 35 illustrates the correlation of the theoretical model to polarization data
collected using the given parameters Here the theoretical model closely correlates to the
experimental data Discrepancies occur between the theoretical and experimental values at higher
current densities
Figure 35 Theoretical polarization curve correlation with experimental data T=55 P=1atm RH= 62 σEL=026 s cm-1 iCL=
15 A cm-2 iAL= 4 A cm-2 RI=0 rest of values found in Section 33
70
Next the calculated and extracted resistances from EIS were compared Figures 36 and
37 illustrate the correlation between the theoretical and experimental charge transfer resistances
Figure 36 Rc compared to model The cathode charge transfer resistances display the same decreasing trend The model and EIS
data do not closely correlate T=55 P=1atm RH= 62 σEL=026 s cm-1 iCL= 15 A cm-2 iAL= 4 A cm-2 RI=0 rest of values
found in Section 33
Figure 37 RA compared to model Experimental and theoretical charge transfer resistance did not trend the same T=55
P=1atm RH= 62 σEL=026 s cm-1 iCL= 15 A cm-2 iAL= 4 A cm-2 RI=0 rest of values found in Section 33
71
Although the charge transfer resistances at the cathode demonstrated the same
decreasing trend values were slightly skewed Anode charge transfer resistances did not match
the predicted resistances calculated from the model In an effort to further model the anode
charge transfer resistance another model was proposed The new model simplified Equation 27
to
radic
(
)
where any resistance due to diffusion was negated (Lapique 2012) The new relationship shown
in Figure 38 further confirmed that the model was not sufficient to predict anode charge transfer
resistance collected from EIS
Figure 38 RA compared to model Experimental and theoretical charge transfer resistance did not trend the same T=55
P=1atm RH= 62 σEL=026 s cm-1 iAL= 0 A cm-2 RI=0 rest of values found in Section 33
Significant differences between the anode charge transfer resistances may be due to two
reasons The first is the uncertainty in EIS fitting Anode charge transfer resistance is
72
incorporated into the high frequency arc of the Nyquist plot This arc is dominated by the
resistances occurring at the cathode Anode charge transfer resistance is then set to one tenth of
the cathode charge transfer resistance This is why both experimental charge transfer resistances
trend in the same manner The second explanation is the kinetics within a fuel cell Reaction
kinetics within a fuel cell is complex consisting of many parameters A more specific model may
be needed to appropriately predict fuel cell behavior at the anode
Finally the calculated and experimental ohmic resistances were compared
From EIS data the ohmic resistance was constant at 0108 ohm cm2 The theoretical resistance
was calculated to be 0068 ohm cm2 Although not exact ohmic resistance were comparable
identifying that the model was sufficient
431 Predicting Healthy Stack Performance
By developing the polarization curve the decline in voltage of the healthy fuel cell stack
was modeled Over the four weeks the decline in potential could be attributed to decrease in
catalyst surface roughness γm If the decline in surface area is due to catalyst dissolution and
agglomeration the kinetics can be given by
which was integrated to obtain an expression for both the anode and cathode surface roughness
(Gu et al 2009)
In this case k the rate constant was predicted to be By using this correlation and
estimated rate constant data collected from the healthy stack was compared to the model as seen
in Figure 39 Here the predicted decline in voltage can only be related to Cell 1
73
Figure 39 Predicted decline of cell voltage Predicted values were compared to voltage decline from the healthy fuel cell stack at
an operating current density of 03 Acm2 T=55C P=1atm
Using the same method the increase in cathode charge transfer resistance in the healthy
stack was predicted as seen in Figure 40
74
Figure 40 Predicted increase in cathode charge transfer resistance Operating conditions were current density of 03 Acm2
T=55C P=1atm
Although the model may predict voltage decline it is not sufficient in predicting
resistance for the healthy stack Further research is needed to develop model to predict
resistances within a fuel cell stack
75
50 Conclusion and Future Work The electrochemical impedance spectroscopy (EIS) results illustrate that degradation was
present within the three-healthy-cell fuel cell stack examined in this project The EIS experiment
data correlated well to the trends of increasing resistances that occur with the degradation
mechanisms detailed in this report With the ohmic resistance remaining fairly constant and the
charge transfer resistance and diffusion resistance increasing over the span of four weeks the
resistances match the relative rates of the degradation models Based on position and geometry
of the cells within the fuel cell stack that was employed in this project the data seemed to show
that Cell 2 had greater diffusion resistance than the other two cells and a higher rate of increase
in charge transfer resistance The diffusion resistance results are not distinguished enough to
truly determine a different trend for Cell 2 than Cells 1 and 3 however since the rate of increase
in the charge transfer resistance was higher for Cell 2 it is possible that the trend would have
continued Further experiments using accelerated stress testing or ones that are longer in duration
could be conducted to validate these trends
The data from the water balance analysis also supported some of the expected
phenomena in a PEMFC The water transport coefficient representative of the net flow of water
through the membrane verified that the net flow is in the direction from the cathode to the anode
since all of the values were steadily positive The net flow expected to be in this direction since
water is generated at the cathode and humidified air is delivered to the cathode side The excess
reactant coefficients for the anode and cathode showed a similar trend in consistency of data The
vapor content in the anode outlet increased slightly over time while the cathode outlet vapor
content decreased slightly
In current literature and research many aging tests are conducted on single cells From
experiments conducted on the healthy stack further research areas were identified Experiments
76
with increased operating temperature or pressure may be an area of interest Other future
experiments may include current cycling humidity cycling and further accelerated aging tests
Ensuing experiments on aging in a defective stack turned out to be unsuccessful due to
complications and the short time span of this project The initial experimental plan was to test
pinhole defects in one cell of the fuel cell stack The results revealed that one artificial pinhole
could not create significant results that differentiated from what has been observed in prior
experiments In an attempt to see the effects pinholes in membrane electrode assemblies
represented in data an MEA with sixteen pinholes was placed into the PEMFC stack However
problems with the hydrogen supply limited invalidated the data from this experiment and another
experiment was not possible before the conclusion of this report Further consideration for
realistic pinhole defect simulation and positioning in an MEA or across MEAs in a stack could
be applied
The theoretical modeling involved in this project was in relation to polarization curves
and data from EIS To intertwine the two models the data from a fuel cell run was utilized and
matched to the polarization curve The experimental data fit well to the polarization curve and
only begins to stray at higher current densities The charge transfer resistances from the EIS data
were also compared with the cathode values trending the same as theoretical model and the
anode values not fitting very well The experimental anode values here are largely
misrepresented because of the assumptions and uncertainty of the EIS fitting and polarization
curve model The anode charge transfer is modeled in EIS off of a portion of the Nyquist plot
that is dominated by the cathode resistances Since the kinetics of the hydrogen oxidation
reaction are much faster than the oxygen reduction reaction the data for the anode is essential
represented as a scaled-down version of the cathode resistances The polarization curve model
77
was adapted to correspond with the experimental data for voltage and cathode charge transfer
resistance gathered from the healthy stack The model predicted future cell voltages reasonably
for the first cell in the stack but not the second or third The relation did not translate well for the
charge transfer resistance It may be possible to modify one or both of these models to
incorporate the theories applied more appropriately
Overall experiments conducted at ENSIC in Nancy France were successful
Interpretation of the data collected can be used as a model for further research Although
experiments on the defective stack were terminated modified experimental procedures may be
conducted to analyze degradation patterns in a defective stack
78
References Asghari S Mokmeli A amp Samavati M (2010) Study of PEM fuel cell performance by
electrochemical impedance spectroscopy International Journal of Hydrogen
Energy 2010(35) 9289-9290
Baker R amp Zhang J (April 2011) Electrochemistry Encyclopedia PEM fuel cells YCES ndash
Case Western Reserve University Retrieved February 2 2012 from
httpelectrochemcwrueduencyclart-f04-fuel-cells-pemhtm
Borup R L Davey J R Garzon F H Wood D L Inbody M A PEM fuel cell
electrocatalyst durability measurements Journal of Power Sources 164 (2006) pp 76-81
Choi E Halder P amp Datta R (2006) Proton-exchange membrane fuel cells In Encylopedia of
Chemical Processing (pp 2501-2528) New York Taylor amp Francis
Choi E amp Moss J A (2009) Observation of a polymer electrolyte membrane fuel cell
degradation under dynamic load cycling Informally published manuscript Worcester
Polytechnic Institute Worcester MA
Datta R personal communication 2012
Datta R (2011) PEM fuel cellDMFC principles
Dhaunshkodi S R (2010) Proton exchange membrane fuel cells Boca Raton Taylor amp Francis
Group
Emerson A amp Montville L (2010) Electrochemical characterization and water balance of a
PEM fuel cell Informally published manuscriptWorcester Polytechnic Institute
Worcester MA
Genova-Dimitrova P Baradie B Foscallo D Poinsignon C amp Sanchez J (2001)
79
Ionomeric membranes for proton exchange membrane fuel cell (PEMFC) sulfonated
polysulfone associated with phosphatoantimonic acid Journal of Membrane
Science 185(1) 59ndash71
Gu Y StPierre J Joly A Goeke R Datye A amp Atanassov P (2009) Aging studies of
ptglassy carbon model electrocatalysts Journal of The Electrochemical
Society 156(4) B4485-B492 doi 10114913077608
Han M Xu JH Chan SH Jiang SP (2008) Characterization of has diffusion layers of
PEMFC Electrochemica Acta (53) 5361-5367
Huang B personal communication 2012
Lapique F personal communicatin 2012
Larminie J amp Dicks A (2003) Fuel cell systems explained West Sussex John Wiley amp Sons
Lee S J Mukerjee S McBreen J Rho Y Kho Y amp Lee T (1998) Effects of Nafion
impregnation on performances of PEMFC electrodes Electrochimica Acta 43(24)
3693-3701
Lu W Liu Z Wang C Mao Z Zhang M (2011) The effects of pinholes on proton
exchange membrane fuel cell performance International Journal of Energy Research
(35) 24-30
Luo Z Li D Tang H Pan M Ruan R (2006) Degradation behavior of membrane
electrode-assembly materials in 10-cell PEMFC stack International Journal of
Hydrogen Energy (31) 1831-1837
McDonald R Mittelsteadt C amp Thompson E (2004) Effects of Deep Temperature Cycling
on Nafionreg 112 Membranes and Membrane Electrode Assemblies Fuel Cells 4(3) 208-
213
80
Mekhielf S Saidur R amp Safari A (2011) Comparative study of different fuel cells
SGL Technologies GmbH - SIGRACETreg GDL - Optimized Gas Diffusion Layers for All Fuel
Cells Fuel Cell Markets - Fuel Cell and Hydrogen Products Web 17 Feb 2012
lthttpwwwfuelcellmarketscomproducts_and_services316171728418htmlsubsite
=617amplanguage=1gt
Schiraldi D Perfluorinated Polymer Electrolyte Membrane Durability Journal of
Macromolecular Science 46(2006) 315-327
Scribner Associates (2011) Electrochemical impedance spectroscopy (eis) Retrieved from
httpwwwscribnercomfilestech-papersScribner Associates - Electrochemical
Impedance Spectroscopy for Fuel Cell Researchpdf
Spendelow J amp Marcinkoski J (2009 October 7) Fuel Cell System Cost - 2009 DOE
Hydrogen Program Record Retrieved February 8 2012 from
wwwhydrogenenergygovpdfs9012_fuel_cell_system_costpdf
Srinivasan S (2006) Fuel cells (pp 3-25) New York Springer Science
Renewable and Sustainable Energy Reviews 16(2012) 981-989
Thampan T Malhotra S Zhang J amp Datta R (2001) PEM fuel cell as a membrane
reactor Catalysis Today 67(2001) 15-32
Vilekar S amp Datta R (2009) The effect of hydrogen crossover on open-circuit voltage in
polymer electrolyte membrane fuel cells Journal of Power Sources 185(2010) 2241-
2247
Wang X Huang Y Cheng C amp Jang J (2009) Flow field optimization for proton exchange
membrane fuel cells with varying channel heights and widths Electrochimica Acta 54
5522-5530
81
Wu J Yuan X Wang H Blanco M Martin J amp Zhang J (2008) Diagnostic tools in PEM
fuel cell research Part I electrochemical techniques International Journal of Hydrogen
Energy 33(2008a) 1735-1746
Wu J Yuan X Martin J Wan J Zhang J Shen J Wu S Merida W A review of PEM
fuel cell durability Degradation mechanisms and mitigation strategies Journal of Power
Sources 184 (2008b) pp 104-119 June 11th
2008 Accessed January 18th
2011
XieT amp Hayden CA (2007) A kinetic model for the chemical degradation of perfluorinated
sulfonic acid ionomers weak end groups versus side chain cleavage Polymer (48)
5497-5506
Yuan X Song C Wang H amp Zhang J (2010)Electrochemical impedance spectroscopy in
PEM fuel cells Springer Springer-Verlag London Limited
Zhang J Yuan X Wang H amp Sun J (2007) Ac impedance techniques in PEM fuel cells
diagnostics A review International Journal of Hydrogen Energy 32(2007) 4365-4380
82
Appendix A Sample Calculations
(
)
[ (
)] (
) [ (
)]
(
) (
)
(
) (
)
[
]
( )
( )
(
)
(
) (
)
(
) (
)
83
[
]
( )
[
]
(
)
[ (
)] (
) [ (
)]
( )
=
84
85
(
)
(
)
Anode
(
)
(
)
[
frasl
]
Cathode
(
)
(
)
(
)
86
[
frasl
frasl]
Electrolyte
(
)
(
(
))
radic (
)
(
)
(
) (
(
))
[
frasl
frasl]
[
frasl
frasl]
(
)
Resistances
87
(
) frasl radic
frasl
frasl
(
) frasl radic
frasl
frasl
88
Appendix B Healthy Stack EIS Data
y = -116E-05x + 252E-01
0244
0245
0246
0247
0248
0249
025
0251
0252
0253
0254
0 100 200 300 400 500 600 700
Rohm
89
y = 138E-04x + 598E-01
06
061
062
063
064
065
066
067
068
069
0 100 200 300 400 500 600 700
Rc
(oh
mcm
2)
t (hrs)
Rc
90

ii
Abstract Fuel cell degradation and defects are factors that prohibit the commercialization of fuel
cells To understand how fuel cells may degrade they are tested with and without defects to
simulate real-world applications By analyzing degradation patterns of a fuel cell stack operating
conditions and geometry within a stack can be optimized Preliminary work analyzed a three-cell
stack of healthy polymer electrolyte membrane fuel cells (PEMFC) under steady state conditions
for four weeks The voltage resistance and water production of this stack were monitored each
day to characterize degradation and aging Further efforts utilized theoretical modeling to predict
fuel cell performance of a single cell
Experiments conducted on the healthy stack demonstrated that the mass transport and
charge transfer resistances increased over time while the ohmic resistance remained constant
The degradation of the catalyst and gas diffusion layers may have caused the increase in mass
transport and charge transfer resistances Due to the increase in resistance the overall potential
of the cell decreased over time Through the use of theoretical modeling potential drop was
predicted for data collected on a single cell and a stack Resistances extracted from EIS could not
be predicted from the model Overall experiments conducted at ENSIC in Nancy France
provide a basis for future research
iii
Acknowledgments We would like to express our gratitude to those who contributed and assisted in the completion
of our project We would like to acknowledge advisors in Nancy France at ENSIC as well as
those in Worcester at WPI Many thanks to
ENSIC
Botao Huang
Yohann Chatillon
Francois Lapicque
WPI
Professor Ravindra Datta
Professor Terri Camesano
The LRGP amp SysPol Teams
iv
Table of Contents Abstractii
Acknowledgementsiii
Table of Figuresv
Table of Tablesvi
Nomenclaturevii
10 Executive Summary 1
20 Background 5
21 Fuel Cell Overview 5
211 History 5
212 Fuel Cell Working Principle 7
213 Types of Fuel Cells 8
22 Proton Exchange Membrane Fuel Cells 9
221 Membrane Electrode Assembly (MEA) 9
222 The Gas Diffusion Layer (GDL) 15
223 Bipolar Plates and Flow Fields 16
23 Fuel Cell Degradation 17
231 Membrane Degradation 18
232 Catalyst Layer Degradation 25
233 Gas Diffusion Layer (GDL) Degradation 28
234 Bipolar Plate Degradation 28
24 Diagnostic Tools for Experimental Methodology 30
241 Electrochemical Impedance Spectroscopy (EIS) 30
242 Water Management 33
243 Polarization Curve 34
30 Methodology 40
31 Aging in a Healthy Three-Cell Stack 40
311 Equipment 40
312 Experimental Procedures 46
32 Aging in a Defective Stack 53
33 Theoretical Modeling 53
331Modeling Parameters 54
40 Results and Discussion 58
41 Aging in a Healthy Three-Cell Stack 58
411 Electrochemical Impedance Spectroscopy 58
412 Cell Voltages 63
v
413 Water Management 64
42 Aging in a Defective Stack 68
43 Theoretical Modeling 69
431 Predicting Healthy Stack Performance 72
50 Conclusion and Future Work 75
References 78
Appendix A Sample Calculations 82
Water Balance (Data collected from 01082012) 82
Theoretical Modeling 85
Appendix B Healthy Stack EIS Data 88
Stack 88
Cell 1 89
Cell 2 90
Cell 3 90
Table of Figures Figure 1 Experiment conducted by Grove 6
Figure 2 Basic construction of a fuel cell 8
Figure 3 An example of a MEA 10
Figure 4 Three Phase Contact) 11
Figure 5 Macro-scale Perfluorosulfonic Acid Membrane (PFSA) 12
Figure 6 Water flux between electrodes and membrane 14
Figure 7 SEM GDL cross-section micrographs 16
Figure 8 SEM image of a pinhole in an MEA 20
Figure 9 Structure of Nafion 22
Figure 10 Secondary degradation reaction via end group unzipping 23
Figure 11 Unzipping progression of product of secondary degradation reaction 24
Figure 12 Initiation of degradation via side chain cleavage 24
Figure 13 Platinum Catalyst Degradation 27
Figure 14 Equivalent circuit to PEM fuel cell 31
Figure 15 Nyquist plot 32
Figure 16 Polarization Curve 35
Figure 17 Electrical Circuit of a Fuel Cell 36
Figure 18 Experimental Schematic 41
Figure 19 Experimental Bench and Hood 41
Figure 20 WaterAir Heater Configuration 42
vi
Figure 21 MEA and Carbon Paper Layers 44
Figure 22 Bipolar Plate 44
Figure 23 Cell to cell connections in stack 45
Figure 24 Fuel Cell Stack Apparatus 46
Figure 25 Experimental Nyquist Plot 48
Figure 26 GEIS Fitting 49
Figure 27 Healthy Stack Rohm C 59
Figure 28 Healthy Stack Individual Cell Rd C 61
Figure 29 Healthy Stack Individual Cell Rct C 62
Figure 30 Healthy Stack Individual Cell Voltage 64
Figure 31 Healthy Stack Water Transport Coefficient 2 65
Figure 32 Healthy Stack Excess Reactant Coefficient Wa 66
Figure 33 Healthy Stack Excess Reactant Coefficient Wc over a run time 67
Figure 34 MEA with 16 pinholes 68
Figure 35 Theoretical polarization curve correlation with experimental data 69
Figure 36 Rc compared to model 70
Figure 37 RA compared to model 70
Figure 38 RA compared to model 71
Figure 39 Predicted decline of cell voltage 73
Figure 40 Predicted increase in cathode charge transfer resistance 74
Table of Tables
Table 1 Nominal Operating Conditions 45
Table 2 EIS Modeling Parameters 47
Table 3 Parameters for theoretical model 54
Table 4 Roughness parameters 55
vii
Nomenclature
CH2O water concentration
dM catalyst metal crystalline diameter
EAφ0 effective activation energy for HOR (346 kJ mol-1
)
ECφ0 effective activation energy for ORR (670 kJ mol-1
)
Eμ activation energy for water viscosity (14000 kJ mol-1
)
F faradayrsquos constant (96485 C eq-1
)
Fi molar flow rate (mol s-1
)
i fuel cell current density (A cm-2
)
ixc crossover current at the cathode
i0 exchange current density (A cm-2
)
i0ref exchange current density reference(A cm-2
)
iL limiting current density (A cm-2
)
KA equilibrium constant
kH2 permeability of hydrogen (mol bar-1
cm-1
s-1
)
LEL thickness of electrolyte
MPT platinum molar mass (195084 gmol)
MRU ruthenium molar mass (10107gmol)
mm catalyst loading (mg cm-2
)
pi partial pressure
R gas constant (J mol-1
K-1
)
Rct charge transfer resistance
Rdiff diffusion resistance
RΩ ohmic resistance
T temperature (K)
Tref reference temperature
V0 thermodynamic potential
V fuel cell voltage
W vapor content coefficient
viii
Greek Symbols
α water transport coefficient
α transfer coefficient
β degree of dissociation
δ ratio of mutual to matrix diffusion coefficients
ε0 Nafionreg
volume fraction
εE water volume fraction
γm roughness factor
λ number of molecules absorbed per ndashSO3H group
ρ density (g cm-3
)
η over potential
ϕI
available metal surface involved in electro catalysis in contact with
ionomer
νie- electron stoichiometric number
σEL protonic conductivity of the membrane
Χ percolation threshold
1
10 Executive Summary Fuel cells are an ever-expanding topic of research in academia and energy-based
industries They are electrochemical devices that have fuel entering the cell continuously and
differ from battery cells which have a fixed amount of reactants (Baker amp Zhang 2011) Interest
in fuel cells has grown over time as dependence on fossil fuels triggered a global effort to find
alternative sources of energy for electrical power generation and transportation applications
Although considered a new age energy source research on fuel cells can be dated back to
1838 In 1838 the fuel cell effect (electrolysis) or the decomposition of water into hydrogen and
oxygen was discovered It was not until approximately a year later that inverse electrolysis was
utilized to produce electricity by forming water from hydrogen and oxygen Although fuel cell
research has been conducted over many centuries much knowledge and research is still needed
to perfect this alternative source of energy
Worcester Polytechnic Institute has collaborated with Ecole Nationale Supeacuterieure des
Industries Chimiques (ENSIC) in Nancy France to perform research on fuel cell operation and
degradation The focus of LRGP at ENSIC has been the degradation of proton exchange
membrane fuel cells (PEMFC) Degradation and aging of PEMFC components have been a
major limiting factor in the implementations of PEMFCs for real-world applications In concept
and practice PEMFCs prove to be practical alternatives to batteries and engines in many
applications if the lifetime of the cells can be ensured and validated
Several past research projects have analyzed the degradation of single cell PEMFCs with
various analytical techniques (Choi amp Moss 2009) This project was split into two major
sections prolonged aging tests at nominal conditions and prediction of fuel cell performance by
theoretical modeling The first objective of this project was to observe aging of a PEM fuel cell
stack comprised of three healthy cells under steady state conditions This type of experiment
2
conducted over four weeks was considered as a control stack that would provide aging patterns
that could be compared to those of a defective stack Electrochemical impedance spectroscopy
and water management data were collected each day to monitor the resistance and aging within
the fuel cell stack Data could be analyzed from a cell to cell basis or as a stack
The setup of the experiment consisted of a fuel cell bench with a three-cell stack
temperature indicator flow meters and electrochemical data collectors To ensure steady state
conditions the operating parameters of the stack were held constant by flow and temperature
meters At the anode dry hydrogen gas entered the cell at 094 Lmin at 55 Humidified air at
55 and 62 relative humidity entered at the cathode at approximately 448 Lmin A constant
current of 30A was applied to the stack Through hot water heaters the stack was maintained at a
temperature of 55 and pressure of one atmosphere Data from the stack was collected and
analyzed each day
The general procedures for the experiment were as follows at the end of each day
effluent water from each electrode was collected and massed followed by the collection and
analysis of impedance spectroscopy Water management and dynamics within the stack could be
understood through the collection of the effluent water and temperature measurement at the
anode and cathode Through mass balances the water transport coefficient and excess reactant
coefficient of the stack were obtained The analysis of resistances within the stack was acquired
from Galvanostatic Electrochemical Impedance Spectroscopy (GEIS) Data exported from GEIS
was fitted to Nyquist and Bode plots to determine ohmic charge transfer and diffusion
resistances occurring within the stack as well as through each cell Cell and stack voltages were
also monitored and recorded each day
3
Under the same operating parameters and experimental procedures a defective stack was
analyzed The stack was comprised of three cells in series with a defect a pin hole in the first
cellrsquos MEA After operation for a week experiments on the defective stack were terminated due
to inconsistent hydrogen supply to the cell The first cell was then altered to incorporate sixteen
pinholes and was then tested to examine aging patterns Again due to inconsistent hydrogen
supply experiments were terminated
The second objective of this project was to verify the use of theoretical models with fuel
cells To enhance the fuel cell durability models have been made to predict how fuel cells
perform under different operating conditions One model used in this project is the polarization
curve model A polarization curve is standard electrochemical technique used to characterize the
performance of a fuel cell It is essentially a plot of cell voltage against current density under a
set of constant operating conditions By constructing a polarization curve the effects of changes
to operating conditions such as temperature composition and relative humidity can be
systematically analyzed In this project a theoretical polarization curve was used to model data
previously collected from a single cell PEM fuel cell Although the polarization curve correlated
to the data with little discrepancies theoretical or calculated resistances did not correlate to
resistances extracted from impedance data
This report provides a basic overview of the history and working principle of a typical
fuel and provides detailed information on the degradation and aging processes presented in
literature A description of diagnostic tools used to monitor aging and degradation within a fuel
cell is also presented in the background of this report The report also validates the use of
theoretical models to predict fuel cell performance In Chapter 3 a more detailed methodology of
experimental procedures is described Finally results and analysis obtained from data are
4
discussed in Chapter 4 The outcome of this project was twofold a polarization curve model for
single PEMFCs was validated and theorized mechanisms were utilized to describe chemical
phenomena occurring in a three-cell healthy PEMFC stack
5
20 Background Fuel cells are favorable alternatives to conventional energy sources They consume
hydrogen and hydrocarbon fuels that contain substantial chemical energy By utilizing hydrogen
as the reactant fuel cells have a potential to be more efficient environmentally clean and silent
compared to other means of energy production Typically used as energy generators for small-
scale applications fuel cells can provide energy to rural areas outside the public grid where a
huge cost of building an electrical network is required Despite their advantages there are some
limitations to the usage of fuel cells For example due to aging and degradation during
operation the lifespan of a typical fuel cell is shorter than is required to be marketed as practical
products Other challenges include limited durability and accessibility to consumers Regardless
of limitations fuel cells offer a promising source of alternative energy
211 History
The operation of a fuel cell is based on electrochemistry or the field of science that relates
electricity with chemical phenomena In 1791 Luigi Galvani discovered the field of
electrochemistry by placing the tip of a scalpel on the internal nerves of a dissected frog which
caused its muscles to contract (Srinivasan 2006) Several years later in 1800 it was discovered
that by sandwiching a membrane with zinc and silver plates and wetting it with salt water
electrical current would flow It was not until 1838 that the ldquofuel cell effectrdquo was discovered by
CF Schoenbein (Choi et al 2006) Schoebein demonstrated the ldquofuel cell effectrdquo (electrolysis)
by immersing two platinum wires connected to a battery in a dilute acid When submerged
bubbles of hydrogen and oxygen evolved on two electrodes A year later the invention of the
ldquofuel cellrdquo was made
6
During 1839-1845 WR Grove demonstrated Schoenbeinrsquos discovery by inventing the
ldquogas batteryrdquo shown in Figure 1 (Larminie amp Dicks 2003) The experiment illustrated water
being electrolyzed into hydrogen and oxygen by passing an electrical current on two externally
connected platinum electrodes Grove then showed that when the current was stopped an
electrical current could be generated when hydrogen and oxygen recombined on the platinum
electrodes In other words hydrogen fuel was being ldquoburntrdquo or combusted however instead of
releasing heat energy electrical energy was produced
In 1839 Grove demonstrated the basic principle of a fuel cell stimulating interest in the
field of electrochemistry In Groversquos model due to low contact area and large distances between
the electrode and electrolyte the currents produced were minuscule Throughout the years fuel
cells evolved to address these and other issues to become more efficient In 1889 L Mond and
C Langer utilized a three dimensional porous electrode and claimed the term ldquofuel cellrdquo (Choi et
al 2006) Later fuel cells took new forms and were used in variety of ways For example in
1965 United Technologies Corporation (UTC) produced an alkaline fuel cell to be used in the
Apollo Lunar Mission
Figure 1 Experiment conducted by Grove (a) Water is separated into hydrogen and oxygen (electrolysis) by the flow of
an electrical current (b) Reverse electrolysis Hydrogen and oxygen are combined to form water and electricity
(Larminie amp Dicks 2003)
7
Fuel cell science and technology embodies a variety of disciplines Currently researchers
are focused on better understanding all of the operating parameters that influence the fuel cell
especially its performance In many cases researchers have utilized mathematical models to help
develop relationships between the fuel cell and its components (Wu et al 2008a) Nevertheless
fuel cells are efficient environmentally-friendly alternative sources of energy with a few
limitations that are holding them back
212 Fuel Cell Working Principle
A fuel cell is an electrochemical device ie a cell composed of four parts anode
cathode electrolyte (membrane) and external circuit In a hydrogen fuel cell hydrogen and
oxygen combine to generate electricity and water as depicted in Equation (1)
The reaction is similar to a combustion reaction differing in that a fuel cell will produce
electricity and heat energy (Larminie amp Dicks 2003)
To understand how reverse electrolysis works reactions at each electrode are considered
Although these considerations vary for different types of fuel cells an acid electrolyte fuel cell
will be the base model as it is the simplest and most common (Figure 2) At the anode of an acid
electrolyte hydrogen gas enters the system and ionizes releasing electrons thereby creating
protons (H+) As protons permeate through the electrolyte electrons are forced through the
external circuit and to the cathode Oxygen entering at the cathode reacts with the electrons from
the anode side Hydrogen which has permeated through the electrolyte combines with oxygen at
the cathode to form the by-product water Reactions at the anode and cathode are summarized in
Equations (2) and (3)
8
Although the acid electrolyte fuel cell is used here as a model there exists many other
types of fuel cells Other types of fuel cells utilize different materials and mechanisms to
effectively produce electricity
213 Types of Fuel Cells
Fuel cells differ according to efficiency applications and cost (Mekhielf et al 2011)
They are characterized by the type of electrolyte and fuel used into six major areas
Alkaline Fuel Cell (AFC)
Proton Exchange Membrane Fuel Cell (PEMFC)
Phosphoric Acid Fuel Cell (PAFC)
Molten Carbonate Fuel Cell (MCFC)
Figure 2 Basic construction of a fuel cell For an acid electrolyte fuel cell protons move from the anode to the cathode
Electrons circulate through a load Water is produced at the cathode side (Larminie amp Dicks 2003)
9
Solid Oxide Fuel Cell (SOFC)
Direct Methanol Fuel Cell (DMFC)
Different types of fuels cells are designed to optimize the different strengths associated
with fuel cells (Larminie amp Dicks 2003) For example PEMFCs capitalize on specific operating
parameters and physical design The simple design incorporates a solid immobile polymer
electrolyte Due to its low operating temperature PEMFCs utilizes platinum-based catalysts to
address problems with slow reaction rates Fueled by hydrogen PEMFCs do not address the
issue of the reliability of available hydrogen or hydrocarbon fuel One solution to hydrogen
supply is to use methanol or other alcohols as a fuel For example methanol is used as a fuel in
DMFCs Although there are many types of fuel cells this project will focus on the PEMFCs
their properties and degradation
The proton exchange membrane fuel cell (PEMFC) also known as the solid polymer fuel
cell was originally created for use in the Gemini manned space missions through collaboration
between NASA and General Electric (Larminie amp Dicks 2003) Now PEMFCs are utilized for
electric production as portable electric generators for vehicles and power generation for electric
devices or local grids In this section the functionality of PEMFC components is described
221 Membrane Electrode Assembly (MEA)
PEM technology requires a very specific set of conditions and materials for the fuel to
operate effectively Similar to other fuel cells a PEMFC is composed of four main components
bipolar plates catalyst gas diffusion layer and electrolyte however it is the fusion of electrolyte
and catalyst that makes the PEMFC unique This unit of PEMFCs the membrane electrode
10
assembly (MEA) drives the electrochemical reaction (Figure 3) The MEA is composed of three
basic functional layers the anodecathode catalyst layers and the membrane
Figure 3 An example of a MEA The MEA is composed of two main components- the catalyst later and the
electrolyte Typically a membrane is 005 to 01mm thick the GDL is between 02 and 05 mm thick
(Larminie amp Dicks 2003)
One important aspect of the interaction between the PEMFC layers is the integration of
the catalyst layer with the membrane This interlock between the electrode and the membrane
produces a charge double layer with opposing static charge (Larminie amp Dicks 2003) This
charge double layer allows what is called three phase contact Three-phase contact occurs at the
boundary layer between the reactant gases membrane layer and catalyst as can be seen in Figure
4 This direct connection made by fusing the catalyst with electrolyte drastically increases the
efficiency of a PEMFC
11
Figure 4 Three Phase Contact Meshing the electrode and electrolyte promotes three-phase contact and hydrogen ion
diffusivity (Larminie amp Dicks 2003)
2211 The Membrane Layer (Electrolyte)
As the name proton exchange membrane indicates the technology is based on proton
transport through a membrane the electrolyte of a PEMFC Protons must be able to readily and
actively diffuse through the membrane but should not conduct electrons thereby allowing the
current to flow from the anode to the cathode and create a potential difference (Larminie amp
Dicks 2003) The membrane should also be as thin as possible to minimize the proton transport
resistance across the membrane by limiting hydrogen or oxygen crossover
The requirements of the fuel cell membrane do not allow for much flexibility with the
types of membranes that are presently available In conjunction with NASA DuPonttrade
developed a material named Nafionreg that is still the primary membrane implemented in
PEMFCs (Larminie amp Dicks 2003) Nafionreg a Teflon
reg (tetrafluroethylene or PTFE) derivative
is hydrophobic enabling it to drive water away from the electrodes The Nafionreg
network is
infused with sections of sulfonated side chains which in contrast to PTFE are hydrophilic and
draw water towards them This porous hydrophobic network with interspersed hydrophilic
regions allows for effective proton transport through a saturated membrane The sulfonated side
chains draw protons towards them (seen in Figure 5) but because of the network of hydrophobic
12
Teflon the weaker intermolecular attraction is overcome and protons are driven through the
membrane
Figure 5 Macro-scale Perfluorosulfonic Acid Membrane (PFSA) As water molecules travel through the PFSA membrane they
are attracted to the hydrophilic sulphonate side chains as depicted in the illustration (Larminie amp Dicks 2003)
Other perfluorosulfonic acid membranes have been developed under similar principles like Gore-
Selectreg and Primea
reg (made by Goretrade) Aciplex
reg and Flemion
reg (made by Asahitrade) (Wu et al
2008b)
Nafionreg is still widely used as an industry standard for PEMFCs because of its distinctive
properties Although new membranes have been developed they are mostly variants of the
Nafionreg membrane having similar properties due to the hydrophobic and hydrophilic
characteristics generated by perfluorination and sulfonation Other properties that make Nafionreg
and fluorosulfonate ionomers unique are that they are more durable and resistant to chemical
degradation and can be formed into thin membranes without jeopardizing mechanical integrity
(Wu et al 2008b)
In addition to membrane material water management and relative humidity are other
parameters vital to maintain operation of a PEMFC The water content of a PEMFC has a direct
13
relationship with the proton transport through the membrane so the more saturated the cell the
better the cell operates (Larminie amp Dicks 2003) However to have optimal conditions a water
balance must be maintained If there is too much water flooding will occur By flooding the cell
pores and sites at the three-phase interface are blocked hindering mass transfer of the reactant to
the electrode The result of limited mass transfer within the cell is a decrease in fuel cell
efficiency
In an ideal situation the water generated by the desirable redox reactions in the PEMFC
at the cathode would provide all the water that would be necessary to sustain operation by
keeping the membrane hydrated The membrane would be thin enough for the water to diffuse
back through the membrane towards the anode Water at the cathode that would come in contact
with the air would evaporate readily and the fuel cell would be able to run at steady state without
any supplementary procedures There are a number of complications that do not permit this sort
of idealization to occur like the divergent theories on low or high humidification strategies
14
Figure 6 Water flux between electrodes and membrane (Larminie amp Dicks 2003)
When hydrated protons travel through the membrane from the anode side to the cathode
they ldquodragrdquo water molecules along through the membrane For each proton up to five water
molecules can be transferred This phenomenon is known as electro-osmotic drag (Larminie amp
Dicks 2003) Electro-osmotic drag can lead to the anode side drying out even though the cathode
side is well saturated The water distribution across the membrane also may not be uniform with
some regions receiving less water than other regions An excess of water can cause localized
flooding at the electrodes All of these setbacks are predictable and can be combated with
solutions Water drag and water generation are directly proportional to current and back diffusion
changes with the thickness of the membrane so water saturation can be predicted across the
membrane and solved by adding humidity to the reactant gases
15
2212 The Catalyst Layer
The development of catalysts and catalyst efficiency has vastly improved in the last
century In history of the PEMFC the most effective catalyst is platinum (Larminie amp Dicks
2003) Platinum is a precious expensive metal but does not substantially contribute to the cost of
a fuel cell because only a small amount of platinum is needed For example in the 1960s 28 mg
of catalyst were required per square centimeter of electrode now the electrodes are plated with
02 mg-cm-2
or less
Carbon powder is used as a support platform for the platinum particles Dispersing these
platinum particles across the carbon powder increases the surface contact area of the catalyst
layer increasing the effectiveness of the redox reactions that take place (Schiraldi 2006)
222 The Gas Diffusion Layer (GDL)
The essential function of the gas diffusion layer (GDL) is to disperse the reactant gases
evenly to the corresponding electrode (Schiraldi 2006) It is in place to facilitate water
management within the cell by 1) expelling water from fuel cell to avoid catalyst flooding and 2)
maintaining water within the cell to optimize proton transport (Larminie amp Dicks 2003)
The appropriate material selection is crucial to achieve and maintain high efficiency
especially when size restrictions are imposed on the design Carbon paper or carbon cloth is
often used as the GDL as it has the ability to drive water out of the cell while providing a
conductive layer for electron flow Carbon paper is usually selected when the PEMFC must be
small and thin in size whereas carbon cloth is thicker (Larminie amp Dicks 2003) Carbon cloth
will absorb more water making PEMFC manufacturing easier due to fewer voids in the cell
compared to carbon paper However because carbon cloth is thicker and more absorbent it will
also expand more into the bipolar plate channels where reactant gas may be restricted
16
Some GDLs employ a stratified level of porosity that has been shown to deliver different
results than uniformly porous GDLs (SGL Technologies GmbH 2012) These GDLs can have
two layers with a microporous layer (MPL) on the catalyst side and a macroporous layer on the
opposing side adjacent to the bipolar plate seen in Figure 7 The difference in pore size
increases efficiency and durability of a fuel cell by limiting exposure of contaminants and
undesired reactants to the catalyst The diffusion characteristics of the macroporous layer can be
examined by Fickrsquos 1st and 2
nd laws of diffusion while the microporous layer generally exhibits
Knudsen diffusion
Figure 7 SEM GDL cross-section micrographs a) In the single layer GDL a macroporous layer is shown and b) in
the dual-layer GDL macroporous and microporous layers are shown (Han et al 2008)
223 Bipolar Plates and Flow Fields
The primary use of bipolar plates in PEM cells is to feed reactant gases to their
appropriate electrodes Plates are also used to connect multiple fuel cells in a stack to achieve
voltages essential for various applications Bipolar plates usually made of graphite or steel are
grooved to channel the reactant gases through them The use of graphite or steel facilitates the
passage of electrons to the current collectors (Baker amp Zhang 2011) The collections of
conduits on bipolar plates that channel the reactant gases of the fuel cell are better known as flow
17
field patterns There are many different patterns for flow fields and research has not brought one
unifying optimal design but has elucidated efficient options for flow field patterns (Larminie amp
Dicks 2003) One study has tested multiple parameters of the flow fields by changing heights and
widths of channels (Wang et al 2006) In this experiment the goal was to balance the
manufacturing costs and performance of the bipolar plates The geometry of five channels was
varied in shape to promote convection and exchange between the layers of the MEA The study
concluded that flow fields can be optimized with diverging tapered channels that change the
convection currents By optimizing the channels at the inlet and outlet of each cell the efficiency
of the cell could be increased
Another important characteristic of bipolar plates that is directly related to the resistance
of the plates is thickness Increasing thickness of the plates contributes to larger voltage drop so
the thickness of the plates should be minimized to improve the power to weight ratio The
optimization of these plates becomes more complicated when considering the high flow rates of
air that are necessary to provide the appropriate amount of oxygen at the cathode for the oxygen
reduction reaction (ORR) Ultimately there is a trade-off between electrical conductivity and
reactant flow rate that must be balanced in the design of these plates and the overall design of the
fuel cells The bipolar plates can be integrated within a PEMFC with individual cells connected
with one bipolar plate thus reducing the number of interconnects
PEMFCs are remarkable energy conversion devices that have high energy densities in
comparison to cells of similar size For the technology to be effective PEMFCs need to be able
to withstand the stresses of the environments and loads that are imposed on them The durability
of PEMFCs is necessary for them to be viable products In the mid-1990s the PEMFC was
18
expected to be commercially viable for stationary applications by 2001 and viable for
transportation applications by 2003 but even today there are hurdles that are still present (Wu et
al 2008b)
The DOE established a target for the cost of $61-per-kilowatt in 2009 ($51 per kilowatt
in 2002 USD) to make fuel cells a competitive alternative in the market of portable cells for all
types of power applications (Spendelow amp Marcinkoski 2009) Since fuel cells are required to
have lifetimes that vary from 5000 to 40000 hours there are various methods to test the cells to
simulate the operating conditions of their applications (Wu et al 2008b) Real-time testing for
the lifespans of fuel cells would cost exorbitant amounts of capital but similar stressed
conditions can be reproduced by using accelerated testing techniques at much lower costs
Further the results of steady state tests for fuel cells presented a much lesser change in average
voltage drop per hour (when run for significantly less than 40000 h) than accelerated stress tests
(ASTs) (Wu et al 2008b)
The components of PEMFCs degrade in different manners and the mechanisms involved
in this degradation are not completely understood The various mechanisms are related so one
degradation mechanism may trigger or exacerbate another Noteworthy research has been
performed in this realm with the purpose of uncovering the mechanisms involved in the
degradation of PEMFCs In this section detailed degradation mechanisms of PEMFC
components are presented
231 Membrane Degradation
Membrane or electrolyte degradation is a severe form of deterioration that hinders
PEMFC performance over time PEMFCs degrade in manners mechanical thermal and
chemical or electrochemical in nature (Wu et al 2008b) These degradation phenomena could be
19
due to failures and defects in manufacturing processes of the MEAs including the introduction
of voids or foreign objects into the assembly tears pinholes perforations or cracks (Wu et al
2008b) Thermal degradation can occur outside the cellrsquos optimal operating range (60-80oC) in
extreme temperatures that the fuel cell could be subjected to in real world applications Chemical
and electrochemical degradation of PEMFC membranes can occur when an undesirable side
reaction takes place in direct relation to hydrogen and oxygen crossover
2311 Mechanical Degradation Mechanical degradation of membranes can specifically occur at the interfaces at which
the channels formed in the flow field are pressed causing tears In addition humidity plays a big
role in the dimensional shrinking or swelling of the membrane which adds to the pressure at
these interfaces (Wang 2009) With increasing humidity the membrane and gas diffusion layers
take up more water and expand increasing the overall dimensions of the PEMFC The opposite
occurs with decreasing humidity Non-humidification low humidification and humidity cycling
particularly impart intense mechanical stress upon the membrane and accelerate mechanical
degradation Also when crossover occurs at pinholes near electrodes a highly exothermic
reaction can occur that may slowly spread through the membrane and cause catastrophic failure
20
Figure 8 SEM image of a pinhole in an MEA The localized damage of pinholes can lead to diminished performance
and further widespread degradation of a fuel cell with exothermic crossover reactions creating regions of increased
temperatures (Lu et al 2011)
2312 Thermal Degradation
Thermal degradation generally arises when PEMFCs are subjected to extreme
temperatures typically high temperatures (Wu et al 2008b) With the use of Nafionreg
the
membrane is thermodynamically stable because of the strength of the carbon-fluorine bond and
the electronegativity of fluorine Above 80oC Nafion
regrsquos glass-liquid transition will begin to alter
the morphology of the membrane and the membrane will begin to chemically decompose in
appreciable amounts in excess of 150oC Beyond this point Nafion
regrsquos weaker sulphonic acid
groups start to separate from the membrane At even higher temperatures covalent bonds in the
membrane split between carbon and sulfur based radicals Low temperatures also present a
problem for the practicality of PEMFCs because of their reliance on water Because of waterrsquos
physical properties studies have shown that water in the PEMFC tended to partially freeze
within the membrane causing degradation
21
Cycling between low and high temperatures proves to result in considerable degradation
(Wu et al 2008b) A study evaluating thermal cycling on a PEMFC was performed by Giner Inc
and General Motors In this study repeated cycling was performed 385 times between -40oC and
80oC for two hour stints at each extreme over the course of three months (McDonald amp
Mittelsteadt 2004) Severe changes in ionic conductivity gas impermeability and impaired
mechanical strength of the membranes were observed however no catastrophic failures
occurred
2313 Chemical Degradation
Chemical and electrochemical degradation occur when a perfluorosulfonic acid
membrane such as Nafionreg decomposes due to undesired side reactions Researchers have
sought out to solve the problem involved with the membrane by understanding the mechanisms
involved in degradation It is believed that hydroxide and hydroperoxide radicals (∙OH and
∙OOH) form at the cathode surface causing chemical attack on the membrane electrolyte and
catalyst The studies performed have indicated that radicals do indeed form but whether the
source of the free radicals is the cathode anode or both is still uncertain Chemical degradation
mechanisms detailed in this section are weak end group initiation carboxylic acid end group
unzipping and side chain cleavage
The following mechanism has been proposed for when metals from the electrodes or
bipolar plates corrode and enter the membrane (Wu et al 2008b) In this mechanism the iron
ion can be substituted with any divalent cation that could possibly contaminate the fuel cell
22
The peroxide and hydroperoxide radicals that are formed in this mechanism can proceed to
attack the membrane layer of a PEMFC and cause catastrophic failure of the cell
Figure 9 Structure of Nafion The Teflon based backbone is shown with hydrophilic sulphonic side chains
(Xie amp Hayden 2007)
Equations 9 - 11 represent the mechanism of the end group unzipping reaction at the
Nafion backbone shown in Figure 9 (Xie amp Hayden 2007) The mechanism supports the general
theory and experimental evidence that deterioration of the cell membrane will lead to fluoride
leaving the membrane from the side chains and backbone and eventually entering the water
This mechanism can be described as an unzipping reaction in which the electrolyte backbone is
attacked and the functional fluoride units are broken off of the membrane This mechanism can
proceed in a chain reaction that continues until termination at which point shorter low
molecular weight compounds are created Equation 12 exemplifies the overall reaction of the
mechanism with a pair of hydroxyl radicals attacking the carboxylic end groups to remove a CF2
group from the main chain and being incorporated into a carbon dioxide molecule and two
hydrogen fluoride molecules
23
In addition to the primary degradation mechanism via end group unzipping there is a
secondary reaction that is not negligible and must be accounted for (Wu et al 2008b) The
mechanism formulated for the secondary degradation is shown below in Figure 10 The figure
demonstrates how the mechanism cleaves along the main chain between the side chains of the
polymer backbone Once a portion of the main chain is cleaved the reaction continues according
to the primary mechanism outlined in Equation 9-12 until a termination reaction occurs
Figure 10 Secondary degradation reaction via end group unzipping (Xie amp Hayden 2007)
The molecular product HOOC-CF(CF3)-O-CF2CF2-SO3H of the reaction illustrated in
Figure 10 is small enough to diffuse through the polymer membrane and block sites for hydrogen
ions to flow through (Xie amp Hayden 2007) This molecule can undergo further unzipping as
shown in Figure 11 in which ultimately leads to the formation of carbon dioxide hydrogen
fluoride and sulfate ions
24
Figure 11 Unzipping progression of product of secondary degradation reaction (Xie amp Hayden 2007)
Another proposed mechanism for radical formation is initiated by side chain cleavage in
which the carboxylic acid groups of the side chains undergo the unzipping reaction (Xie amp
Hayden 2007) An attacking species X cleaves the side chain at an unknown linkage and unzips
just like in the primary degradation The side chain cleavage in this reaction continues until
junction between the side chain and main chain exists where the main chain is cleaved and
carboxylic acid groups form on the ends of the chain This reaction is illustrated Figure 12
Figure 12 Initiation of degradation via side chain cleavage (Xie amp Hayden 2007)
25
In addition the presence of hydrogen can lead to the reaction shown below in which
hydrogen ions attack the carbon atoms of a PTFE chain and displaces fluorine (Wu et al
2008b)
Other chemical interactions exist if there is a presence of cations in the membrane that
contaminate the fuel cell (Wu et al 2008b) Besides the increased chance of corrosion for the
fuel cell assembly cations can reduce the performance of the cell by taking the place of protons
in the membrane layer of the fuel cell This has a directly proportional relationship to ionic
conductivity and water uptake Only 5 of sulphonic acid sites need to be contaminated for
water flux to be impacted potentially drying out regions in the membrane near the anode
232 Catalyst Layer Degradation
Platinum is a rare earth metal that is extremely valuable and expensive (Baker amp Zhang
2011) The effectiveness of platinum as a catalyst for PEMFCs has been proven through much
research and discovery Platinum catalysts are potent alone or accompanied by other metals like
cobalt chromium nickel ruthenium iridium and tin in several combinations as alloyed
compounds The durability of platinum-based catalysts however has not been demonstrated
bearing in mind the humidity low pH high temperatures and redox chemistry that they may be
subject to
Degradation of the platinum catalyst layer may stem a wide variety of sources Faults in
platinum refinery before even being implemented in a fuel cell may cause issues that proliferate
upon operation of the fuel cell (Dhaunshkodi 2010) Reactant gases may also introduce
impurities that reduce contact area Platinum particles may drift on the carbon support surface
26
and aggregate or sinter to decrease surface area dissolve into the electrolyte or also lose activity
due to galvanic corrosion of the carbon support
There has been no unified agreement on the mechanisms that are involved in catalyst
layer degradation though several have been proposed A mechanism called Ostwald ripening
suggests that platinum particles dissolve into the ionomer phase and precipitate on larger
particles that lead to particle agglomeration (Wu et al 2008b) The dissolved platinum particles
could also flow into the membrane and precipitate within the membrane causing losses in
membrane proton conductivity Another suggested mechanism is that agglomeration occurs in a
normal-log distribution of particle size Based on particle collision kinetics the mechanism
suggests that even if platinum particles are uniformly distributed when initially manufactured
kinetics will drive particles together Eventually the distribution will have agglomeration regions
of platinum particles Another similar mechanism is also based on a normal distribution except it
is based on Gibbrsquos free energy minimization instead of kinetic energy
Oxide formation at the electrodes has also been attributed to increased platinum particle
size as well as reduces active surface area ultimately decreasing catalytic activity Carbon
corrosion has also been a major contributor to the gradual decline of PEMFC performance of the
lifespan of the fuel cell Power cycling and hydrogen fuel starvation due to pore blockage at the
anode in conjunction with voltage cycling are the two modes believed to contribute to carbon
27
corrosion
Figure 13 Platinum Catalyst Degradation a) A TEM micrograph of an original platinum catalyst (black) on carbon
support can be seen as well as b) a TEM micrograph degraded catalyst The operation of the PEMFC has caused
agglomeration of platinum particles a decrease in platinum content in addition to a morphological change in the
carbon support (Luo et al 2006)
Power cycling of a PEMFC or startup and shutdown cycling creates an uneven supply of
reactant gases with hydrogen at the anode and oxygen in air crossing over towards the anode
Fuel starvation may be the result of uneven sharing of react flow between the cells in a stack or
due to ice formation at freezing temperatures Carbon and water oxidation will occur when
hydrogen blocks the pores and its supply is exhausted from the local region of the catalyst layer
with the follow reactions
Thermodynamically feasible from 067 V carbon oxidation does not happen occur readily but
platinum and platinum-ruthenium catalysts on carbon support have been shown to reduce the
carbon oxidation potential from the usual 11 VRHE to 055 VRHE increasing the frequency of
oxidation
28
233 Gas Diffusion Layer (GDL) Degradation
Gas diffusion layers are critical components for mass transport within the fuel cell
(Zhang et al 2007) Although some studies have discussed the morphology of the GDL and the
influence of pore size distribution on mass transport only a limited amount of studies have
focused on degradation of the gas diffusion layer and its effect on fuel cell performance (Wu et
al 2008b) Through understanding GDL degradation fuel cell durability can be improved
Through each degradation mechanism the fuel cell will decrease in efficiency Some
studies demonstrated that GDLs are susceptible to chemical attack and electrochemical
oxidation (Wu et al 2008b) Such losses decrease GDL conductivity and hydrophobicity which
further lowers MEA performance Corrosion on the GDL will increase resistance and decrease
electrical output or conductivity Some other areas where GDLs are vulnerable are degradation
of baking material and decreased water management from mechanical stress In study conducted
by Borup a decrease in hydrophobicity can also be due to an increased operating temperature
and the use of sparing air instead of nitrogen (Wu et al 2008b)
Because each degrading point negatively affects the durability of the entire cell more
studies must be conducted on the GDL Quantitative correlations between performance loss and
changes in GDL properties will give better understanding on fuel cell durability
234 Bipolar Plate Degradation
The bipolar plates are used to connect PEM cells with one another keep reactant
gases and utility cooling or heating supplies apart conduct current and distribute reactant gases
across the MEA These multipurpose plates are susceptible to degradation primarily in the form
of corrosion Corrosion of bipolar plates can be largely detrimental to PEMFC function As
indicated by the mechanism in Equations 4-8 corrosion leading to foreign cations entering the
MEA will take up sites that water and protons will normally exist in
29
The manufacturing and production of the bipolar plates for PEMFCs is very important to
prevent contamination of the cells so the material selection and design of the flow fields must be
considered in a concerted effort The material implemented in bipolar plates must have excellent
electrical and heat conductivity while the gas permeability must be very low Strong corrosion
resistance and mechanical strength is required since the plates will be constantly exposed to
oxygen hydrogen water vapor and an acidic electrolyte (Larminie amp Dicks 2003) On top of
these conditions the weight volume and costs must also be minimized The two main classes of
materials that are used are metal and carbon Graphite based plates the meet the conductivity
requirements of PEMFCs but their advantages are counteracted by their porous and brittle nature
and vulnerability to shock and vibration which forces the plate designs to be thick and heavy
Metals can also be used for bipolar plates and are conductive and dense so they can be
very thin Common noble metals like platinum tantalum niobium and zirconium have great
properties for bipolar plate production except the raw material cost of these metals is very high
(Wu et al 2008b) Metals are not without disadvantages however understanding that the most
feasible metals used for production are either susceptible to oxidation or corrosion Titanium and
aluminum are also effective metals and metal alloys that are much cheaper than noble metals
Nevertheless these two metals are likely to form oxide layers between the plates and the gas
diffusion layer which significantly increases contact resistance Steel is another metal considered
in production however it is also susceptible to galvanic corrosion While coatings can be
applied to metals the production time and costs increase
It turns out that most of the bipolar plate manufacturers are split on these technologies as
both types of plates are produced for use in fuel cells Both metal and carbon based bipolar plates
are used and introduce various contaminants into the reactant streams as the metals and carbon
30
are oxidized These metal and carbon contaminants cause degradation at the catalyst and
membrane as stated in their respective sections
Due to their low emissions high efficiency and power density PEM fuel cells are a
promising alternative energy source however several challenges still remain To address these
challenges intensive research and development is needed To aid in RampD fuel cell testing and
diagnostic tools have become vital in performance optimization design validation and
development of a fundamental understanding of fuel cell operation (Yuan et al 2010) The
diagnostic tools used and discussed in this report are electrochemical impedance spectroscopy
(EIS) water management analysis and the polarization curve
241 Electrochemical Impedance Spectroscopy (EIS)
Regarded by scientists as a powerful technique electrochemical impedance spectroscopy
(EIS) is used to investigate physical phenomena and essential loss factors occurring within a fuel
cell By analyzing performance losses the influence of operating parameters on the overall
response can be determined (Zhang et al 2007) In PEM studies the uses of EIS technique
includes (a) to obtain electrochemical parameters through the development of an equivalent
circuit (EC) (b) to assist in determining problems within the fuel cell by differentiating
resistances at individual fuel cell components (c) to provide microscopic information about the
fuel cell to aid in structure optimization and selection of operating conditions Other uses in PEM
include the differentiation of components such as the GDL to overall fuel cell performance and
the identification of individual contribution to the total impedance such as charge transfer and
mass transfer (Zhang et al 2007)
31
In a fuel cell the electrochemical reactions consist of an electron transfer at the electrode
surface (Yuan et al 2010) Through the system these reactions cause resistances mainly
membrane resistance (ohmic resistance) and charge transfer and mass transfer resistance at the
electrode surface Ohmic resistance ( is an intrinsic characteristic and can increase due to
membrane drying contamination and thermal degradation It is mainly due to internal resistance
of the fuel cell including electrolyte catalyst and contact resistance The charge transfer
resistances ( for both the anode and cathode refer to the barrier through which the electron
passes across the electrode surface This resistance is then related to electrode potential or
overpotential Mass transfer by diffusion refers to the transfer of H2 and O2 to the electrode
surface Through EIS reaction resistances can be represented as an electrical circuit as seen in
Figure 14 The circuit includes electrolyte resistance or ohmic resistance charge transfer
resistance double layer capacitance and mass transfer or diffusion resistance at both the anode
and the cathode
Figure 14 Equivalent circuit to PEM fuel cell RΩ is ohmic resistance Rct is charge transfer resistance and Ws is
mass transfer or Warburg impedance CPE is the capacitance relative to double layer charge at the interface of the
fuel cell
The general PEM circuit depicts resistances involved at both the anode and the cathode
However due to the slow oxygen reduction reaction and the fast hydrogen reduction reaction
the diffusion resistance of the fuel cell nearly equals that of the cathode (Wu et al 2008a) The
32
anode side of the circuit of a PEM fuel cell is then reduced to only include the capacitance and
charge transfer resistance
In EIS a small AC current as a perturbation signal varying between 10 kHz to 100 mHz
is applied to the cell in addition to a steady current (Wu et al 2008a) When this is done a
measurement of the frequency dependence of fuel cell is obtained through the resulting potential
response With this technique known as Galvanostatic mode (GEIS) the current through the cell
is precisely controlled By using GEIS in combination with an interpretation of the spectra
resistances from each component in the electrical circuit can be extracted Conventionally
impedance spectra are plotted on both Bode and Nyquist plots (Wu et al 2008a) Impedance is
made up of both imaginary and real parts In the Bode plot the impedance is illustrated as the
amplitude and phase of impedance versus frequency In the Nyquist plot the opposite plot is
graphed against the real part of impedance (Zrsquo vs Zrdquo) Figure 15 illustrates a traditional Nyquist
plot with two arcs as frequency decreases from left to right
Figure 15 Nyquist plot A mathematical model is fitted to experimental data to obtain resistance values From the plot a
high frequency and low frequency arc are displayed The distance from the origin to where the spectra cross the x-axis is
the ohmic resistance
33
From the plot three areas where resistances occur can be identified high frequency
resistance (ohmic resistance) high frequency arc low frequency arc Each of these areas relate to
resistance due to the electrolyte (ohmic) charge transfer and mass transfer respectfully
In the Nyquist plot ohmic resistance is illustrated as the distance from the origin to the
point in which the spectra cross the x-axis as seen in Figure 15 Cathode resistance can be split
into two sections the high frequency arc and low frequency arc The high frequency arc is
related to the charge transfer resistance ( ) The low frequency arc is due to mass transfer or
diffusion resistance and can be expressed as Warburg impedance (Zhang et al 2007)
From data collected in the GEIS model fitting can be conducted to identify quantitative
parameters representing resistances as well as electrode capacitance The fitting process is
conducted by minimizing the difference between experimental data and the model By analyzing
resistance values over time information on operation conditions and agingdegradation can be
obtained
EIS provides detail information on operations within the fuel cell With EIS
measurements can be conducted under real-world conditions ie open circuit voltage or under
load (Scribner Associates 2011) From this single experiment multiple parameters can be
determined and analyzed with relatively simple measurements Other advantages to this
diagnostic tool are EIS measurements are high precision and non-invasive
242 Water Management
Analysis on the water produced by a fuel cell is used to understand dynamics and
degradation Water flow within the cell can be analyzed by the following parameter
34
where FA
is the molar flow rate of water in the anode and similarly for the cathode For all
experiments conducted no water was introduced at the anode or Equation 17 is then
simplified to
Typically is greater than zero meaning that the net flow of water is from cathode to
anode If the water transport coefficient is zero there is not net flow and the flow of electro-
osmosis is equal but opposite Finally if is less than zero water flow is from anode to cathode
This can occur when water is introduced into the anode side
243 Polarization Curve
The standard electrochemical technique used to characterize the performance of fuel cells
is the polarization curve Polarization signifies that an electrochemical reaction takes place as the
potential of the electrode surface shifts away from its equilibrium point (Yuan et al 2010) A
polarization curve is essentially a plot of cell voltage against current density under a set of
constant operating conditions (Wu et al 2008a) By constructing a polarization curve the effects
of varying operating conditions such as temperature composition and relative humidity can be
systematically analyzed
The ideal polarization curve has three major regions as shown in Figure 16 At low
current densities or at activation polarization the cell potential drops exponentially (Wu et al
2008a) Losses are due to the slow oxidation reduction reaction and become more significant as
the catalyst layer degrades (Choi amp Moss 2009) The next region ohmic polarization is
encountered at intermediate current densities Potential losses that occur are due to ohmic
resistance or the resistance due to the flow of ions in the electrolyte and the flow of electrons
35
through the electrode Here the ohmic resistance contributes the most to the potential drop which
is essentially linear Finally at high current densities concentration polarization occurs Due to
the limit of the reactant gas through the GDL and electrocatalyst layer cell performance drops
significantly Such losses can be amplified through improper water management or impure gas
feeds
Figure 16 Polarization Curve In the ideal curve three regions of resistance are shown (Dhaunshkodi 2010)
Not only can the polarization curve directly characterize the performance of fuel cells it
can also be used as a modeling tool to predict how a fuel cell will act Through modeling
theoretical performance can be compared to experimental results and analyzed
2431 Theoretical Modeling
Mathematical modeling is a useful tool used to predict the performance of a fuel cell By
utilizing theoretical models operating conditions can be optimized Although theoretical
modeling is a useful tool it can be challenging due to numerous design parameters and the
36
complexity of a fuel cell itself Through modeling the importance of each parameter and its
influence on fuel cell performance can be evaluated
First to understand correlations from the polarization curve to experimental data it is
vital to investigate the electrochemical parameters Two significant parameters indicated in the
polarization curve are overpotential and exchange current density (Yuan et al 2010)
Overpotential is the difference between the applied potential and the thermodynamic potential
typically 1229 V for a PEM fuel cell at 25 The relationship demonstrates that the higher the
current the higher the overpotential On the other hand exchange current density is a kinetic
parameter depending on the active electrode surface area that the electrochemical reaction occurs
on In general the magnitude of determines how easily the reaction occurs on the electrode
surface Exchange current density is related to overpotential in that the smaller is the higher
the overpotential
The basic model used in the polarization curve is shown Figure 17 In the schematic the
overpotentials represent the five layers of a PEMFC as resistances
Figure 17 Electrical Circuit of a Fuel Cell The internals include voltage source and resistances (Datta 2012)
Mathematically the model is described as
37
where is the thermodynamic voltage and is potential drop across each layer (Datta 2012)
Potential drop across the anode and cathode are characterized as diffusion ( and electrode
reaction over potential ( which can be summed Thus
The losses for the anode can then be written as
[
frasl
frasl]
Likewise the potential drop for the cathode is
[
frasl
frasl]
where is the transfer coefficient is the electron stoichiometric number and is the
limiting current density Unlike the anode overpotential at the cathode takes into account
potential drop due to hydrogen crossover (Vilekar amp Datta 2010) The cross over current
density due to hydrogen flux can be expressed as
where is the permeability of hydrogen and is the membrane or electrolyte thickness The
exchange current density for both the anode and cathode can be calculated as
(
)
(
)
where is the partial pressure of the species permeating at the electrode is the effective
activation energy and is the roughness factor The roughness factor is the ratio of
electrochemically active metal catalyst surface area to the geometric MEA area and is given in
terms of particle diameter by
38
where is the part of the metal diameter which is accessible for reaction is the catalyst
loading and the catalyst density From these relations by increasing the roughness factor
temperature or concentration of the species the exchange current density will be increased
Next over potential occurring at the electrolyte layer is calculated as
(
)
Here is the protonic conductivity of the membrane (Vilekar amp Datta 2001) By combining
the above equations the theoretical fuel cell performance can be calculated as
[
frasl
frasl]
[
frasl
frasl]
(
)
where is described as the interfacial resistance between layers This expression
yields the cell voltage V versus current density i Theoretically in the absence of current the
voltage of the cell should equal to the thermodynamic or ideal voltage however due to the
presence of side reactions the voltage at zero current density is not equal to the thermodynamic
potential (Vilekar amp Datta 2011) At zero current density hydrogen crossover exists at the
cathode therefore the cathode overpotential is not equal to zero at zero current density As
current is drawn the sum of potential drop across the fuel cell is registered By changing
characteristic parameters the exchange current densities roughness and limiting current
densities the effect on cell performance can be observed
Although the polarization curve model provides adequate information on mechanisms
within the cell it is also useful to model the resistances within the cell at different operating
39
conditions via impedance spectroscopy (Datta 2012) By differentiation of the overpotentials in
relation to current charge transfer resistances at the anode and cathode can be determined The
resistance at the anode and cathode are then
(
) frasl radic
frasl
frasl
and
(
) (
)
radic
frasl
frasl
Through a similar analysis the ohmic resistance or resistance in the electrolyte is derived as
The calculated resistances can be compared to data extracted from EIS The use of modeling by
the polarization curve accompanied by resistance calculations provides a useful tool in predicting
and interpreting fuel cell performance
40
30 Methodology The experiments presented in this report were executed at Ecole Nationale Supeacuterieure des
Industries Chimiques (ENSIC) in Nancy France Experiments were separated into three sections
aging of a three-cell healthy stack degradation in a three-cell stack with a defect in the first cell
and basic polarization curve modeling Experiments conducted on the three-cell stack fuel cell
operated at nominal conditions over a period of four weeks Over the course of four weeks water
and electrochemical impedance spectra were collected and analyzed from the cell Experiments
on the three-cell stack with a defect in the first cell occurred at the same operating conditions as
the healthy stack Finally the polarization model was used to predict cell performance of a single
cell Resistances from the stack were also compared to results from the model In this section
equipment used and experimental procedures are presented
The first part of this project analyzed aging in a three-cell at steady state conditions The
operation of the stack at nominal conditions occurred for a period of four weeks Throughout the
four weeks data was collected and analyzed each day to evaluate aging and degradation patterns
within the stack This section describes the equipment used and procedures followed on
experiments conducted on the healthy stack
311 Equipment
Equipment used in this project consisted of a fuel cell bench and accompanying software
This section will describe the stack assembly operating conditions and monitoring software used
to conduct the experiment
41
3111 Fuel Cell Bench
A schematic and picture of the work bench are shown in Figure 18 and Figure 19
respectively The fuel cell bench was comprised of a stack evaporator flow instruments and a
pump For the fuel cell system pure hydrogen and air (21 oxygen) was supplied to the anode
and cathode respectively
Figure 18 Experimental Schematic
Figure 19 Experimental Bench and Hood
42
Hydrogen and humidified air flow rates were determined based on Faradayrsquos law of
electrolysis The law states that the quantity of a substance produced or consumed by electrolysis
is directly proportional to the quantity of electricity used To provide an excess amount of gas
needed for the target current density (03 Acm2) the stoichiometric coefficient (λ) of hydrogen
was set to 15 (50 excess) λ of oxygen was set to 3 At the anode dry hydrogen gas entered the
system at 094 Lmin atone atmosphere and 55 To ensure humidified air was flowing into the
cathode air at 448 Lmin and deionized water at 038 gmin were mixed in an evaporator at
110 Figure 20 illustrates the heater configuration Air flowed above the plate while water was
heated through the channels After contact with the heater the water evaporated mixing with air
and forming a heterogeneous vapor mixture
Figure 20 WaterAir Heater Configuration (Huang 2012)
The flow rate of water corresponds to the amount of saturated water necessary to
humidify the air adequately The heterogeneous mixture was then introduced to a homogenizer to
produce a homogenous vapor at 55 and 62 relative humidity At both the anode and cathode
side water exited and was retained in two large beakers In order to guarantee the accuracy of
the water balance at the cathode side the outlet flow was first cooled in a condenser with cooling
43
water supply at 3 The flow rate at the anode side was too small for vapor condensate to make
an appreciable difference in the balance
To maintain steady state conditions fluid flow rates were monitored using Brooks
Instrument Readout amp Control Electronics heaters were monitored using Huber Polystate CC3
Heater
3112 Stack Assembly
The fuel cell used for these experiments was composed of three healthy cells connected
in series Each cell was compiled of carbon paper (Sigracetreg made by SGL Technologies) as the
gas diffusion layer a fresh MEA (PRIMEAreg made by Gore) and two bipolar plates The ldquocarbon
paperrdquo itself was a bilayer with a macroporous side adjacent to the bipolar plate and flow field
with a microporous side adjacent to the catalyst layer The MEA was comprised of the
electrolyte and catalyst layers The electrolyte was an ePTFE enhanced perfluorosulfonic acid
(PFSA) polymeric membrane The catalyst on the anode side was 045 mgcm2 of a 5050
mixture of platinum to ruthenium particles on carbon support and the cathode side was 040
mgcm2 of platinum on carbon support The active area of each MEA per cell was 100 cm
2 The
basic assembly is shown in Figure 21
44
Figure 21 MEA and Carbon Paper Layers
The bipolar plate used at the end each cell is displayed in Figure 22 Figure 22 A
illustrates the gas distribution to the fuel cell This side of the plate faces towards the gas
diffusion layer at both the anode and cathode sides The Figure 22 B displays the reverse side of
the bipolar plate On this side hot water is distributed evenly through the plate the distribution
of hot water is utilized to heat the cell and maintain a temperature of 55
Figure 22 (left) A) Bipolar Plate reactant distribution channels and (right) B) hot water distribution channels
(UBzM 2012)
45
The nominal conditions of the stack are summarized in Table 2
Table 1 Nominal Operating Conditions
Steady State Operating Conditions
Temperature 55
Area (cm2) 100
Current (A) 30
Current Density (Acm2) 03
Relative Humidity
Anode 0
Cathode 62
The three cells are connected in series as shown in Figure 23 where dotted lines
represent electrical connections used to measure the potential and impedance of each cell Figure
24 displays the actual set up in the lab
Figure 23 Cell to cell connections in stack
46
Figure 24 Fuel Cell Stack Apparatus
312 Experimental Procedures
3121 Galvanostatic Electrochemical Impedance Spectroscopy
Every 24 hours impedance data were collected and analyzed using EC-Labcopy software
Electrochemical Impedance experiments were conducted by applying and AC current over a
frequency range of 10 kHz to 100 mHz Data were then collected and extracted from EC-Lab
software Impedance spectra in EC-Lab displayed Nyquist plots for the stack as well as for each
individual cell The exported data 50 points per spectrum were imported into Exceltrade to be
fitted to theoretical models following procedures previously developed in the lab The following
parameters were adjusted to the experimental model
47
Table 2 EIS Modeling Parameters These parameters demonstrate the resistances associated with the fuel cell stack Resistances
could then be compared and graphed to gain understanding of the aging processes within the stack
Membrane amp
Connection
Cathode Anode
L Inductance Rc Charge Transfer Resistance Ra Charge Transfer Resistance
Rohm Ohmic Resistance Qc Pseudo Capacitance Qa Pseudo Capacitance
nc Constant na Constant
Rd c Diffusion Resistance Rd a Diffusion Resistance
Tdc Time Constant Td a Time Constant
In order to approximate values of different resistances within the fuel cell experimental
data was fit to plots in Microsoftreg Excel The Excel model relied upon two impedance
spectroscopies the Bode diagram and Nyquist plot A plot of the Nyquist diagram fitted to
experimental data is shown in Figure 25 Above the plot is an equivalent circuit showing the
effect regions
48
Figure 25 Experimental Nyquist Plot
The model was first adjusted to fit the length of the plot by varying L where L is the
pseudo-inductance associated with the effects produced by connection points Next the ohmic
resistance RΩ was adjusted to fit the data to align the point where the graph intersected with the
x-axis
Later the ohmic resistance and the charge transfer resistances were fitted to the model
This corresponded to the high frequency arc and incorporated RΩ Rc Qc nc and Qa Charge
49
transfer resistance at the anode is small in comparison to the cathode and can therefore be fixed
at the anode Ra is calculated to be 110 Rc
After fitting charge the high frequency arc the diffusion resistance or the low frequency
arc was fitted to the model (Rdc and Tdc) The diffusion resistance at the anode was considered
negligible and was set to zero An overall fit of resistances was then conducted to appropriately
fit both plots Figure 26 shows examples of both plots fitted to the data
Figure 26 GEIS Fitting (Top) Nyquist Plot and (Bottom) Bode Diagram
50
This process was repeated for the stack and each individual cell for a total of four
experimental values per day In the model the cathode capacitance Qc was determined to be the
pseudo-capacitance Qc could not be measured directly because it is linked to the exponent nc
The capacitance was then estimated with a true capacitor Cc and equivalent resistance RCeq The
following relations were used (Franck-Lacaze et al 2009)
(
) (30)
( )
After fitting RΩ Rcteq and V were plotted against time in hours
3122 Water Balance Calculations
Water management in a PEMFC is crucial to its stability and performance over its
lifespan At the end of each day the water produced from each side of the cell was collected and
massed The temperature of the water vapor at the anode and cathode was also recorded To
monitor water production within the fuel cell calculations were performed to compare the
theoretical water production to the actual water produced within the stack
First a mass balance was conducted on the anode side of the fuel cell
(32)
(33)
where F is Faradayrsquos constant (96485 coulombsmol) I is the current (30A) and λ is the
stoichiometric coefficient of hydrogen (15) Next the water flow rates exiting at the anode is
calculated Water exiting at the anode was due to water transport from the cathode to the anode
51
Because effluent water is both in vapor and liquid form two calculations were conducted The
flow rate of vapor water exiting the anode ( is expressed as
( )
where is the water vapor fraction and is the flow rate of liquid water out of the
anode The water vapor fraction was calculated using Antoinersquos equation
(
)
where T is the measured temperature of the vapor exiting the anode in Celsius By dividing the
partial pressure by the total pressure (1 atm) the water vapor fraction was found The flow rate
of liquid water was determined from the mass of water collected in the lab over the time in which
the experiment took place (~24 hrs)
The same principles were then applied to the cathode side An oxygen balance was
conducted where
(36)
(
) (37)
Here λ is 3 At the cathode air is fed therefore to calculate the flow of air into the cathode FO2
in must be divided by 21 ie the molar fraction of oxygen in air
At the cathode water also entered the system A complete water balance must then be
conducted Before entering the fuel cell water and air enter a homogenizer From the
temperature of the cell fixed at 55 the temperature of the homogenizer can be found
52
In the above equation the relative humidity RH is set to 62 The saturated pressure values
were equated using Antoinersquos equation The temperature of the humidifier was then calculated
The water vapor fraction entering the system was then equated by
The water vapor entering the fuel cell at the cathode was then found by
( )
Water flow rates exiting the cathode were then calculated The temperature of the vapor
exiting the cathode was measured The measured temperature was then used in Antoinersquos
equation to determine the partial pressure of the vapor The flow of the effluent vapor from the
cathode was then
(42)
where is the vapor fraction determined by Henryrsquos law and was found by
Similar to the anode liquid water collected was weighed and then divided by the duration of
time to calculate the flow rate of water produced at the cathode
To calculate the percent error and the water transport coefficient (α) the theoretical water
produced must first be calculated Theoretical water produced is then calculated by
(44)
53
The water transport coefficient is then calculated by
(45)
The outlet excess reactant coefficient was also calculated with the following relationship
(46)
By analyzing these two coefficients over time an analysis was conducted on the degradation of
the fuel cell stack
Analysis of a three-cell defective stack was the second part of this project The three-cell
stack was connected in series with a defect in the first cell The defect in the first cell consisted
of a single pinhole in the MEA made by puncturing the MEA with a thumbtack To produce
comparable data to the healthy stack previously tested equipment operating conditions and
stack assembly were identical to that of the healthy stack Each experiment conducted on the
healthy stack was repeated for the defective stack Data was collected and analyzed daily and
compared data from the healthy stack
The final section of this project conducted at ENSIC consisted of predicting and verifying
fuel cell performance through theoretical models Using the polarization curve model developed
in section 243 parameters were adjusted to fit experimental data previously collected on a
single cell PEMFC The single cell consisted of a 100 cm2
MEA operating at 55 At the anode
the catalyst was composed of equal parts ruthenium and platinum the cathode catalyst was
54
composed of platinum Data collected from the single cell ranged from a current density (i) of
01 Acm2 to 08 Acm
2 EIS data was also extracted from the single cell
331Modeling Parameters
The polarization modeling was first conducted Specific parameters from the single cell
are shown in Table 3 Parameters were estimated from literature from a typical PEMFC (Datta
2011 Vilekar amp Datta 2010)
Table 3 Parameters for theoretical model Parameters were specific to the single cell fuel cell and estimated according to
literature (Datta 2011 Vilekar amp Datta 2010) Sample calculations can be found in Appendix A
Because the cell operated at (55 ) the thermodynamic voltage was adjusted by
where and
were the partial pressures of oxygen and hydrogen respectfully Partial
pressures were then calculated by
The partial pressure of water was calculated using Antoinersquos equation The mole fraction
(x) of oxygen and hydrogen were 021 and 1 respectively
The roughness factor was then adjusted in accordance to catalyst parameters
described in Table 4 At the anode the catalyst was composed of equal parts ruthenium and
Operating Parameters Anode Cathode
T (K) 328 αa 05 αc 05
PT (atm) 1 vae 1 vce -2
iaoref(Acm
2) 300E-3 icl(Acm
2) 15
ial(Acm
2) 4 icoref(Acm
2) 1E-10
EAφ0 (kJmol) 346 ECφ0 (kJmol) 670
55
platinum Since the oxidation on ruthenium was negligible the catalyst loading at the anode was
calculated by
where 045 mg cm-2
was the total catalyst loading at the anode and Mi was the molar mass
(Huang 2012) By first evaluating the number of moles (y) platinum loading at the anode was
then equated
Table 4 Roughness parameters (Huang 2012)
Anode Cathode
560 320
(
) 0225 0400
(
) 2145 2145
ϕ 095 095
The exchange current densities were then determined for the anode and cathode as
described in section 243 where
(
)
(
)
Next the crossover current at the cathode was calculated by
where was the thickness of the membrane (18μm) or the permeability of hydrogen was
calculated by (Vilekar amp Datta 2010)
(
)
Both the anode and cathode overpotentials were then calculated using methods described in
243
56
To complete the polarization model the membrane overpotential was evaluated From
section 243 the membrane overpotential was derived as
(
)
where was the membrane thickness (18μm) The protonic conductivity was estimated
using (Thampan et al 2001) as well as assumptions made due to the material manufactured by
Gore was calculated by
(
) (
(
))
where the Nafion volume fraction in the Gore ePTFE membrane was estimate to be 07 the
ratio of effective diffusion coefficients was 55 and the activation energy was 14000
The volume fraction of water in the membrane was evaluated by
where was the number of molecules absorbed per ndashSO3H group The concentration of
water was also related to by
The percolation threshold or the ability of the electrochemical species to pass through the
membrane was expressed as
The degree of dissociation in terms of the equilibrium constant was
57
radic (
)
(
)
where
(
(
))
The theoretical polarization curve was then plotted with data extracted from the single
cell Estimated values ie limiting current densities and reference exchange current densities
were evaluated to ensure that the model and data correlated
After obtaining the theoretical polarization curve the theoretical resistances
were compared resistances extracted from EIS
For complete theoretical calculations please see Appendix A
58
40 Results and Discussion The main objective of this project was to compare and analyze aging in a three-cell
healthy stack to a three-cell stack with a pinhole defect operating at nominal conditions The next
objective was to verify the use of theoretical models to predict cell performance of a single cell
This section will investigate gathered experimental results in comparison to literature and theory
The analysis of the healthy three-cell stack in this project yielded results that
corresponded to degradation theories and mechanisms detailed in this report This portion of the
report will provide a review of the results and suggest the degradation phenomena that reduced
the PEMFC stack performance over time
411 Electrochemical Impedance Spectroscopy
By modeling the impedance spectra resistance values within the fuel cell stack could be
obtained and analyzed Data collected daily for four weeks from the healthy stack was graphed
as shown in the figures below Experimental data illustrated a relative constant ohmic resistance
for the three individual cells however the second cell in series (Cell 2) demonstrated a lower
ohmic resistance An overall increase in charge transfer and diffusion resistances was also
observed Complete data is included in Appendix B
4111
The ohmic resistances extracted from the cells remained relatively constant throughout
the four week period as seen in Figure 27 The ohmic resistance of each cell is of the same
magnitude however Cell 2 demonstrates a smaller resistance than Cell 1 and Cell 3 This
inconsistency in ohmic resistance may be attributed to the setup of the stack Physically within
the stack Cell 2 was sandwiched between Cell 1 and Cell 3 requiring different clips to achieve
59
contact with the electrodes The difference in resistance about 0025 ohm cm2 was observed
between Cell 2 and Cell 1 and 3
Figure 27 Healthy Stack Rohm C Ohmic resistance is relatively constant throughout the four week period The stack was
composed of three healthy cells connected in series with an active MEA area of 100cm2 per cell operating conditions were
TFC=55oC Tambient fluctuated over span of experiment i=03Acm2 P=1 atm
Although the ohmic resistance remained fairly constant throughout the experiment
theoretically the ohmic resistances should slightly increase From this data conclusions for
performance based on the positioning of the cells cannot be made considering the difference in
Cell 2 probably was due to differing cable resistance
The reproducibility of results across the cells suggests that the components of the fuel cell
were not subject to gross manufacturing defects as well Membrane drying probably did not
contribute to the ohmic resistance since the membrane was well saturated It is likely that some
of the chemical mechanisms for membrane degradation detailed in the background of this report
occurred in the PEMFC stack however a water fractions analysis would be necessary to
60
understand what portion of the polymer chains cleaved The mechanisms shown in Equations 4-8
and Equations 9-11 are most likely to have occurred
Ostwald ripening of platinum or ruthenium catalyst may have caused platinum
precipitation within the membrane and increased ohmic resistance This would proceed to block
ionomeric pores in the membrane limit proton conductivity and potentially provide surface for
crossover gases to react and produce pinholes It is unlikely that significant precipitation
occurred given the time span of the experiment Factoring the steady-state setup of the fuel cell
with constant reactant gas flow rates and relative humidity these results validate the consistency
in the ohmic resistance seen in previously in experiments run by LRGP
4112
The diffusion resistances were observed to increase at similar rates for each of the three
cells demonstrated in Figure 28 The rate of increase of the diffusive resistance in Cell 2 was
greater than those of either of the other two cells This is indicative of a hindrance between the
catalyst layer and the bipolar plates of the cells Greater mass transport resistance in Cell 2 could
be due to the geometry of the inlet flows and outlet flows of the fuel cell stack or even
temperature variations between the inner cell and the outer two cells or across the GDLs of the
cells An increase in mass transport resistance may also be due to water generation and
accumulation due to carbon (carbon support and GDLs) degradation As water accumulates
oxygen transport at the cathode is limited In addition to traveling through the GDL the oxygen
must diffuse through the excess water molecules too Oxidation of oxygen containing groups at
the surface of carbon is likely to have occurred The datarsquos upward trend suggests that the
corrosion of the carbon support of the catalyst and the carbon may be a primary contributor to
the increases in diffusion resistance
61
Figure 28 Healthy Stack Individual Cell Rd C The diffusion resistance at the cathode over the four week period linearly
increases The stack was composed of three healthy cells connected in series with an active MEA area of 100cm2 per cell
operating conditions were TFC=55oC Tambient fluctuated over span of experiment i=03Acm2 P=1 atm
4113
Like diffusion resistances the charge transfer resistances increased for each of the three
cells The rate of increase was not uniform for each cell as shown in Figure 29 The charge
transfer resistance in Cell 2 increases faster than that of the other two cells As the charge
transfer resistance grows the kinetics of the oxygen reduction reaction (ORR) slows down The
increase in charge transfer resistance across the cell can be substantiated by recognizing the
chemical degradation at the three-phase-interface between the membrane and cathode It is here
that oxygen is reduced accepting electrons It is also a prime region for undesired membrane
and catalyst degradation to occur
62
Figure 29 Healthy Stack Individual Cell Rct C Like diffusion resistance the charge transfer resistance at the cathode also
linearly increases over time Cell 2 provides a larger resistance than Cell 1 or 3 The stack was composed of three healthy cells
connected in series with an active MEA area of 100cm2 per cell operating conditions were TFC=55oC Tambient fluctuated over
span of experiment i=03Acm2 P=1 atm
A decrease in catalyst surface area may also promote catalyst degradation Catalyst
degradation through dissolution into water may have contributed to Ostwald ripening in which
this dissolved catalyst may deposit in the membrane on agglomerate on the electrode Corrosion
of the carbon support as mentioned in section 4112 is also a probable factor increasing charge
transfer resistance
Equations 5-7 detail how destructive radicals are formed within a PEMFC through the
breakdown of hydrogen peroxide that can be formed with the presence of hydrogen crossover at
the cathode The general increase in charge transfer resistance could also be attributed to thermal
variations to the system caused by temperature fluctuations impacting outlet streams The
increase of the charge transfer resistance also could be due to water accumulation Accumulation
63
in fuel cells blocks active catalyst sites slowing oxygen reduction reaction kinetics at the
cathode
412 Cell Voltages
From spectrometry data voltage data was also obtained Over time the voltage decreased
within each cell When the voltage fluctuated it did so in a pattern consistent across all the cells
in the stack This was most probably a result of changes to operating conditions Such conditions
included hydrogen supply and temperature Figure 30 illustrates the voltage from each healthy
cell over the four week period
The cell voltages indicate that performance of the cells in the fuel cell stack was steadily
declining over the four-week experiment The differences in perceived performance output may
be a result of varying resistances in the cables used to record voltage The positioning of the cells
may have played a legitimate role in the differing voltages of the cells if the resistances of the
cables were insignificant The reactant gas streams entering the fuel cell stack entered at Cell 1
and then flowed through Cell 2 and then Cell 3 It is probable that the flow rates of the gases
were higher in Cell 1 gradually decreasing through Cell 2 and then Cell 3 due to pressure drop
This expected difference in pressure drop and corresponding flow rate may have dried out the
membrane in Cell 1 more so than in Cell 2 or Cell 3 potentially causing the difference seen in
the data The resistance discussion provided by the EIS spectroscopy in section 411 presented
possible degradation mechanisms occurring in the cells These mechanisms are also applicable to
the reduction in cell voltage although conclusions regarding the differences in voltages of the
individual cells cannot be fully extracted
64
Figure 30 Healthy Stack Individual Cell Voltage Decreasing linearly with time at similar magnitudes for the each of the cells in
the stack voltage is a primary indicator of fuel cell degradation The stack was composed of three healthy cells connected in
series with an active MEA area of 100cm2 per cell operating conditions were TFC=55oC Tambient fluctuated over span of
experiment i=03Acm2 P=1 atm
413 Water Management
Over a span of four weeks water mass and outlet temperature data were collected for the
PEMFC stack The data gathered from the stack helped in the computational analysis of the mass
balance and water management and thereby can be used as a metric for PEMFC efficiency
Water was collected from the anode and cathode outlets of the stack but it is important to
recognize that no water is generated or supplied to the anode side Water enters cells at the
cathode side through the humidified air and is generated by the ORR Two parameters were used
to observe the residence time of water in the stack the water transport coefficient α and W
65
The water transport coefficient is the ratio of the net water flux or flow rate out of the fuel
cell at the anode side to the water produced by the cell α is an indicator of water management
within the cell indicating the net water flux from the cathode to the anode since dry hydrogen is
fed to the anode side
Figure 31 Healthy Stack Water Transport Coefficient over a run time of 35570 minutes 10 error bars are shown
based on average value of data points The data shows a moderate downward trend as either electro-osmotic drag
becomes stronger or diffusive flux becomes weaker (TFC=55oC Tambient fluctuated over span of experiment
i=03Acm2
Figure 31 shows the data from the healthy stack run over the span of four weeks The
data indicates a moderate drop in α over time however the correlation is not strong enough to
warrant a causal relationship If the relationship was valid the electro-osmotic drag may have
increased the diffusive flux may have decreased or a combination of the two may have
occurred
The excess reactant coefficient W is the ratio of the water flow (both vapor and liquid) of
one outlet of the PEMFC to the flux of saturated vapor exiting the same outlet of the fuel cell
66
(Huang 2012) This coefficient generalizes the phases of water that exist the cell The water is
completely vapor when W is between zero and one saturated vapor when W is equal to one and
completely liquid when W is greater than one Values for W were calculated for both the anode
and cathode sides of the fuel cell and are presented in Figure 32 and Figure 33
Figure 32 Healthy Stack Excess Reactant Coefficient Wa over a run time of 35570 minutes 10 error bars are
shown based on average value of data points The data shows a slight downward trend as the vapor content of the
anode stream increases (TFC=55oC Tambient fluctuated over span of experiment i=03Acm2)
Figure 32 shows the values of Wa over the experiment performed with a healthy stack of
fuel cells The data shows that W is exclusively positive illustrating that water there is a
significant amount more water at the anode side than calculated at saturation This indicates that
liquid water is present in excess at the anode Figure 33 displays the values of Wc over the
duration of the experiment and is also positive but less so than Wa This indicates that the
cathode also has more liquid water than expected at saturation but to a lesser extent than the
anode outlet
67
Figure 33 Healthy Stack Excess Reactant Coefficient Wc over a run time of 35570 minutes 10 error bars are
shown based on average value of data points The data shows a slight downward trend as the vapor content of the
cathode stream increases (TFC=55oC Tambient fluctuated over span of experiment i=03Acm2)
The Wa values are seen to have much more variation than Wc data This variation stems
from the inherent difference in mass transport of the water at the cathode and the anode At the
cathode the water travels through the GDL bipolar plate and exits the stack At the anode
however the water must travel across the membrane in addition to the GDL and bipolar plate of
the anode side increasing variability These values correspond to the positive α values discussed
earlier in this section since the net flux is from the cathode to the anode side This verifies that
the membrane is likely to be fully saturated as the Wa values are firmly positive and the α
values indicate that the water solely entering at the cathode side is indeed travelling to the anode
side
68
Membrane drying therefore should contribute significantly to reduced performance and
degradation of the PEMFC stack over time The fuel cell researchers at ENSIC have decided
that humidification for fuel cells proves to deliver greater performance based on literature and
prior experiments although a general consensus in academia and the industry has not been
reached (Huang 2012)
In an effort to observe the effects of pinhole defects in a PEMFC stack the MEA of the
first cell in a three-cell stack was punctured to produce pinholes At first one pinhole was
introduced however no discernible differences in the data trends were observed Hydrogen
supply problems also occurred throughout the experiment After a week this test was terminated
and followed by a similar setup except with 16 pinhole defects reproduced in the first cell of the
three-cell stack as shown in Figure 34
Figure 34 MEA with 16 pinholes
69
This test also encountered problems however with a fault in a hydrogen supply line the
data was invalidated Since the data in these two experiments were gathered over a short span
they were not particularly effective at showing a change in the patterns of the fuel cell stack over
time
Polarization and EIS data collected on a single cell were compared to theoretical models
and calculations Figure 35 illustrates the correlation of the theoretical model to polarization data
collected using the given parameters Here the theoretical model closely correlates to the
experimental data Discrepancies occur between the theoretical and experimental values at higher
current densities
Figure 35 Theoretical polarization curve correlation with experimental data T=55 P=1atm RH= 62 σEL=026 s cm-1 iCL=
15 A cm-2 iAL= 4 A cm-2 RI=0 rest of values found in Section 33
70
Next the calculated and extracted resistances from EIS were compared Figures 36 and
37 illustrate the correlation between the theoretical and experimental charge transfer resistances
Figure 36 Rc compared to model The cathode charge transfer resistances display the same decreasing trend The model and EIS
data do not closely correlate T=55 P=1atm RH= 62 σEL=026 s cm-1 iCL= 15 A cm-2 iAL= 4 A cm-2 RI=0 rest of values
found in Section 33
Figure 37 RA compared to model Experimental and theoretical charge transfer resistance did not trend the same T=55
P=1atm RH= 62 σEL=026 s cm-1 iCL= 15 A cm-2 iAL= 4 A cm-2 RI=0 rest of values found in Section 33
71
Although the charge transfer resistances at the cathode demonstrated the same
decreasing trend values were slightly skewed Anode charge transfer resistances did not match
the predicted resistances calculated from the model In an effort to further model the anode
charge transfer resistance another model was proposed The new model simplified Equation 27
to
radic
(
)
where any resistance due to diffusion was negated (Lapique 2012) The new relationship shown
in Figure 38 further confirmed that the model was not sufficient to predict anode charge transfer
resistance collected from EIS
Figure 38 RA compared to model Experimental and theoretical charge transfer resistance did not trend the same T=55
P=1atm RH= 62 σEL=026 s cm-1 iAL= 0 A cm-2 RI=0 rest of values found in Section 33
Significant differences between the anode charge transfer resistances may be due to two
reasons The first is the uncertainty in EIS fitting Anode charge transfer resistance is
72
incorporated into the high frequency arc of the Nyquist plot This arc is dominated by the
resistances occurring at the cathode Anode charge transfer resistance is then set to one tenth of
the cathode charge transfer resistance This is why both experimental charge transfer resistances
trend in the same manner The second explanation is the kinetics within a fuel cell Reaction
kinetics within a fuel cell is complex consisting of many parameters A more specific model may
be needed to appropriately predict fuel cell behavior at the anode
Finally the calculated and experimental ohmic resistances were compared
From EIS data the ohmic resistance was constant at 0108 ohm cm2 The theoretical resistance
was calculated to be 0068 ohm cm2 Although not exact ohmic resistance were comparable
identifying that the model was sufficient
431 Predicting Healthy Stack Performance
By developing the polarization curve the decline in voltage of the healthy fuel cell stack
was modeled Over the four weeks the decline in potential could be attributed to decrease in
catalyst surface roughness γm If the decline in surface area is due to catalyst dissolution and
agglomeration the kinetics can be given by
which was integrated to obtain an expression for both the anode and cathode surface roughness
(Gu et al 2009)
In this case k the rate constant was predicted to be By using this correlation and
estimated rate constant data collected from the healthy stack was compared to the model as seen
in Figure 39 Here the predicted decline in voltage can only be related to Cell 1
73
Figure 39 Predicted decline of cell voltage Predicted values were compared to voltage decline from the healthy fuel cell stack at
an operating current density of 03 Acm2 T=55C P=1atm
Using the same method the increase in cathode charge transfer resistance in the healthy
stack was predicted as seen in Figure 40
74
Figure 40 Predicted increase in cathode charge transfer resistance Operating conditions were current density of 03 Acm2
T=55C P=1atm
Although the model may predict voltage decline it is not sufficient in predicting
resistance for the healthy stack Further research is needed to develop model to predict
resistances within a fuel cell stack
75
50 Conclusion and Future Work The electrochemical impedance spectroscopy (EIS) results illustrate that degradation was
present within the three-healthy-cell fuel cell stack examined in this project The EIS experiment
data correlated well to the trends of increasing resistances that occur with the degradation
mechanisms detailed in this report With the ohmic resistance remaining fairly constant and the
charge transfer resistance and diffusion resistance increasing over the span of four weeks the
resistances match the relative rates of the degradation models Based on position and geometry
of the cells within the fuel cell stack that was employed in this project the data seemed to show
that Cell 2 had greater diffusion resistance than the other two cells and a higher rate of increase
in charge transfer resistance The diffusion resistance results are not distinguished enough to
truly determine a different trend for Cell 2 than Cells 1 and 3 however since the rate of increase
in the charge transfer resistance was higher for Cell 2 it is possible that the trend would have
continued Further experiments using accelerated stress testing or ones that are longer in duration
could be conducted to validate these trends
The data from the water balance analysis also supported some of the expected
phenomena in a PEMFC The water transport coefficient representative of the net flow of water
through the membrane verified that the net flow is in the direction from the cathode to the anode
since all of the values were steadily positive The net flow expected to be in this direction since
water is generated at the cathode and humidified air is delivered to the cathode side The excess
reactant coefficients for the anode and cathode showed a similar trend in consistency of data The
vapor content in the anode outlet increased slightly over time while the cathode outlet vapor
content decreased slightly
In current literature and research many aging tests are conducted on single cells From
experiments conducted on the healthy stack further research areas were identified Experiments
76
with increased operating temperature or pressure may be an area of interest Other future
experiments may include current cycling humidity cycling and further accelerated aging tests
Ensuing experiments on aging in a defective stack turned out to be unsuccessful due to
complications and the short time span of this project The initial experimental plan was to test
pinhole defects in one cell of the fuel cell stack The results revealed that one artificial pinhole
could not create significant results that differentiated from what has been observed in prior
experiments In an attempt to see the effects pinholes in membrane electrode assemblies
represented in data an MEA with sixteen pinholes was placed into the PEMFC stack However
problems with the hydrogen supply limited invalidated the data from this experiment and another
experiment was not possible before the conclusion of this report Further consideration for
realistic pinhole defect simulation and positioning in an MEA or across MEAs in a stack could
be applied
The theoretical modeling involved in this project was in relation to polarization curves
and data from EIS To intertwine the two models the data from a fuel cell run was utilized and
matched to the polarization curve The experimental data fit well to the polarization curve and
only begins to stray at higher current densities The charge transfer resistances from the EIS data
were also compared with the cathode values trending the same as theoretical model and the
anode values not fitting very well The experimental anode values here are largely
misrepresented because of the assumptions and uncertainty of the EIS fitting and polarization
curve model The anode charge transfer is modeled in EIS off of a portion of the Nyquist plot
that is dominated by the cathode resistances Since the kinetics of the hydrogen oxidation
reaction are much faster than the oxygen reduction reaction the data for the anode is essential
represented as a scaled-down version of the cathode resistances The polarization curve model
77
was adapted to correspond with the experimental data for voltage and cathode charge transfer
resistance gathered from the healthy stack The model predicted future cell voltages reasonably
for the first cell in the stack but not the second or third The relation did not translate well for the
charge transfer resistance It may be possible to modify one or both of these models to
incorporate the theories applied more appropriately
Overall experiments conducted at ENSIC in Nancy France were successful
Interpretation of the data collected can be used as a model for further research Although
experiments on the defective stack were terminated modified experimental procedures may be
conducted to analyze degradation patterns in a defective stack
78
References Asghari S Mokmeli A amp Samavati M (2010) Study of PEM fuel cell performance by
electrochemical impedance spectroscopy International Journal of Hydrogen
Energy 2010(35) 9289-9290
Baker R amp Zhang J (April 2011) Electrochemistry Encyclopedia PEM fuel cells YCES ndash
Case Western Reserve University Retrieved February 2 2012 from
httpelectrochemcwrueduencyclart-f04-fuel-cells-pemhtm
Borup R L Davey J R Garzon F H Wood D L Inbody M A PEM fuel cell
electrocatalyst durability measurements Journal of Power Sources 164 (2006) pp 76-81
Choi E Halder P amp Datta R (2006) Proton-exchange membrane fuel cells In Encylopedia of
Chemical Processing (pp 2501-2528) New York Taylor amp Francis
Choi E amp Moss J A (2009) Observation of a polymer electrolyte membrane fuel cell
degradation under dynamic load cycling Informally published manuscript Worcester
Polytechnic Institute Worcester MA
Datta R personal communication 2012
Datta R (2011) PEM fuel cellDMFC principles
Dhaunshkodi S R (2010) Proton exchange membrane fuel cells Boca Raton Taylor amp Francis
Group
Emerson A amp Montville L (2010) Electrochemical characterization and water balance of a
PEM fuel cell Informally published manuscriptWorcester Polytechnic Institute
Worcester MA
Genova-Dimitrova P Baradie B Foscallo D Poinsignon C amp Sanchez J (2001)
79
Ionomeric membranes for proton exchange membrane fuel cell (PEMFC) sulfonated
polysulfone associated with phosphatoantimonic acid Journal of Membrane
Science 185(1) 59ndash71
Gu Y StPierre J Joly A Goeke R Datye A amp Atanassov P (2009) Aging studies of
ptglassy carbon model electrocatalysts Journal of The Electrochemical
Society 156(4) B4485-B492 doi 10114913077608
Han M Xu JH Chan SH Jiang SP (2008) Characterization of has diffusion layers of
PEMFC Electrochemica Acta (53) 5361-5367
Huang B personal communication 2012
Lapique F personal communicatin 2012
Larminie J amp Dicks A (2003) Fuel cell systems explained West Sussex John Wiley amp Sons
Lee S J Mukerjee S McBreen J Rho Y Kho Y amp Lee T (1998) Effects of Nafion
impregnation on performances of PEMFC electrodes Electrochimica Acta 43(24)
3693-3701
Lu W Liu Z Wang C Mao Z Zhang M (2011) The effects of pinholes on proton
exchange membrane fuel cell performance International Journal of Energy Research
(35) 24-30
Luo Z Li D Tang H Pan M Ruan R (2006) Degradation behavior of membrane
electrode-assembly materials in 10-cell PEMFC stack International Journal of
Hydrogen Energy (31) 1831-1837
McDonald R Mittelsteadt C amp Thompson E (2004) Effects of Deep Temperature Cycling
on Nafionreg 112 Membranes and Membrane Electrode Assemblies Fuel Cells 4(3) 208-
213
80
Mekhielf S Saidur R amp Safari A (2011) Comparative study of different fuel cells
SGL Technologies GmbH - SIGRACETreg GDL - Optimized Gas Diffusion Layers for All Fuel
Cells Fuel Cell Markets - Fuel Cell and Hydrogen Products Web 17 Feb 2012
lthttpwwwfuelcellmarketscomproducts_and_services316171728418htmlsubsite
=617amplanguage=1gt
Schiraldi D Perfluorinated Polymer Electrolyte Membrane Durability Journal of
Macromolecular Science 46(2006) 315-327
Scribner Associates (2011) Electrochemical impedance spectroscopy (eis) Retrieved from
httpwwwscribnercomfilestech-papersScribner Associates - Electrochemical
Impedance Spectroscopy for Fuel Cell Researchpdf
Spendelow J amp Marcinkoski J (2009 October 7) Fuel Cell System Cost - 2009 DOE
Hydrogen Program Record Retrieved February 8 2012 from
wwwhydrogenenergygovpdfs9012_fuel_cell_system_costpdf
Srinivasan S (2006) Fuel cells (pp 3-25) New York Springer Science
Renewable and Sustainable Energy Reviews 16(2012) 981-989
Thampan T Malhotra S Zhang J amp Datta R (2001) PEM fuel cell as a membrane
reactor Catalysis Today 67(2001) 15-32
Vilekar S amp Datta R (2009) The effect of hydrogen crossover on open-circuit voltage in
polymer electrolyte membrane fuel cells Journal of Power Sources 185(2010) 2241-
2247
Wang X Huang Y Cheng C amp Jang J (2009) Flow field optimization for proton exchange
membrane fuel cells with varying channel heights and widths Electrochimica Acta 54
5522-5530
81
Wu J Yuan X Wang H Blanco M Martin J amp Zhang J (2008) Diagnostic tools in PEM
fuel cell research Part I electrochemical techniques International Journal of Hydrogen
Energy 33(2008a) 1735-1746
Wu J Yuan X Martin J Wan J Zhang J Shen J Wu S Merida W A review of PEM
fuel cell durability Degradation mechanisms and mitigation strategies Journal of Power
Sources 184 (2008b) pp 104-119 June 11th
2008 Accessed January 18th
2011
XieT amp Hayden CA (2007) A kinetic model for the chemical degradation of perfluorinated
sulfonic acid ionomers weak end groups versus side chain cleavage Polymer (48)
5497-5506
Yuan X Song C Wang H amp Zhang J (2010)Electrochemical impedance spectroscopy in
PEM fuel cells Springer Springer-Verlag London Limited
Zhang J Yuan X Wang H amp Sun J (2007) Ac impedance techniques in PEM fuel cells
diagnostics A review International Journal of Hydrogen Energy 32(2007) 4365-4380
82
Appendix A Sample Calculations
(
)
[ (
)] (
) [ (
)]
(
) (
)
(
) (
)
[
]
( )
( )
(
)
(
) (
)
(
) (
)
83
[
]
( )
[
]
(
)
[ (
)] (
) [ (
)]
( )
=
84
85
(
)
(
)
Anode
(
)
(
)
[
frasl
]
Cathode
(
)
(
)
(
)
86
[
frasl
frasl]
Electrolyte
(
)
(
(
))
radic (
)
(
)
(
) (
(
))
[
frasl
frasl]
[
frasl
frasl]
(
)
Resistances
87
(
) frasl radic
frasl
frasl
(
) frasl radic
frasl
frasl
88
Appendix B Healthy Stack EIS Data
y = -116E-05x + 252E-01
0244
0245
0246
0247
0248
0249
025
0251
0252
0253
0254
0 100 200 300 400 500 600 700
Rohm
89
y = 138E-04x + 598E-01
06
061
062
063
064
065
066
067
068
069
0 100 200 300 400 500 600 700
Rc
(oh
mcm
2)
t (hrs)
Rc
90
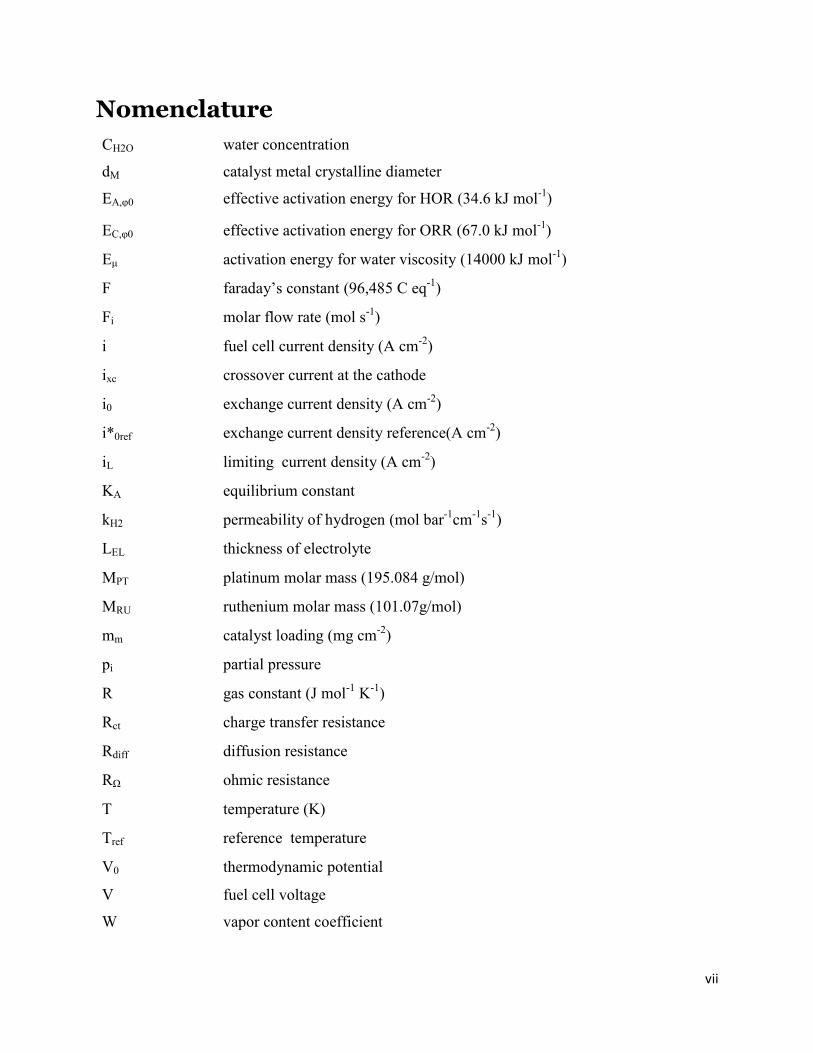
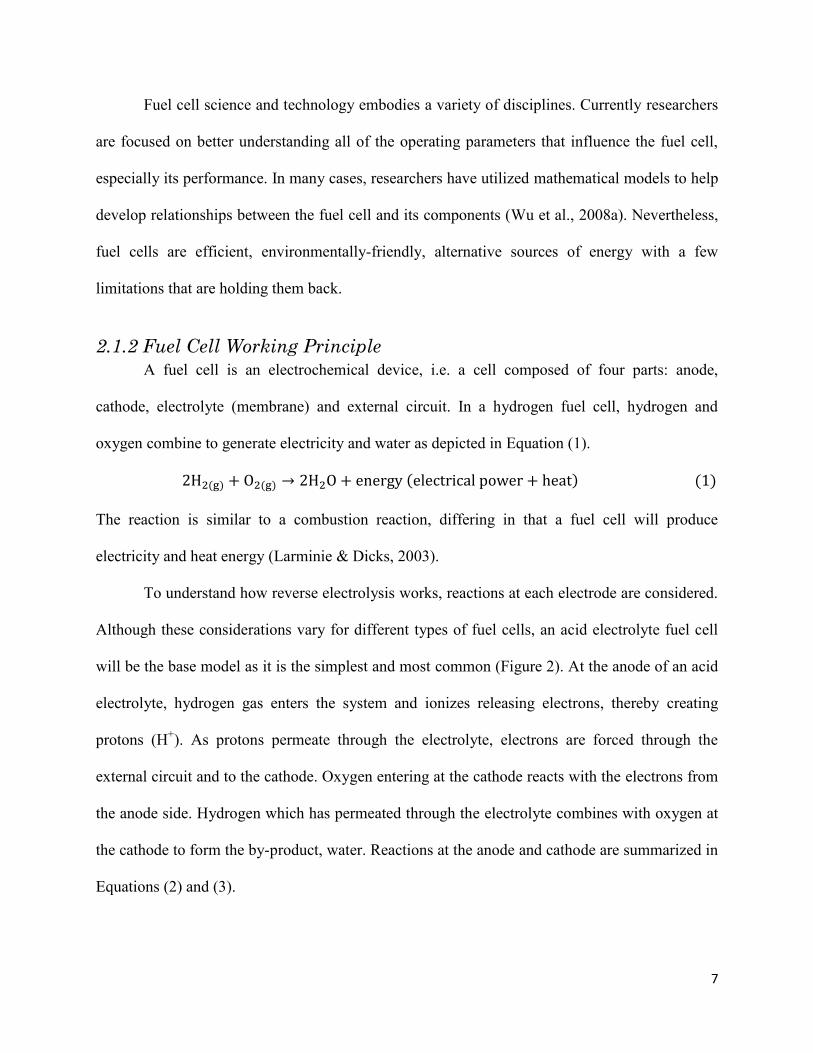
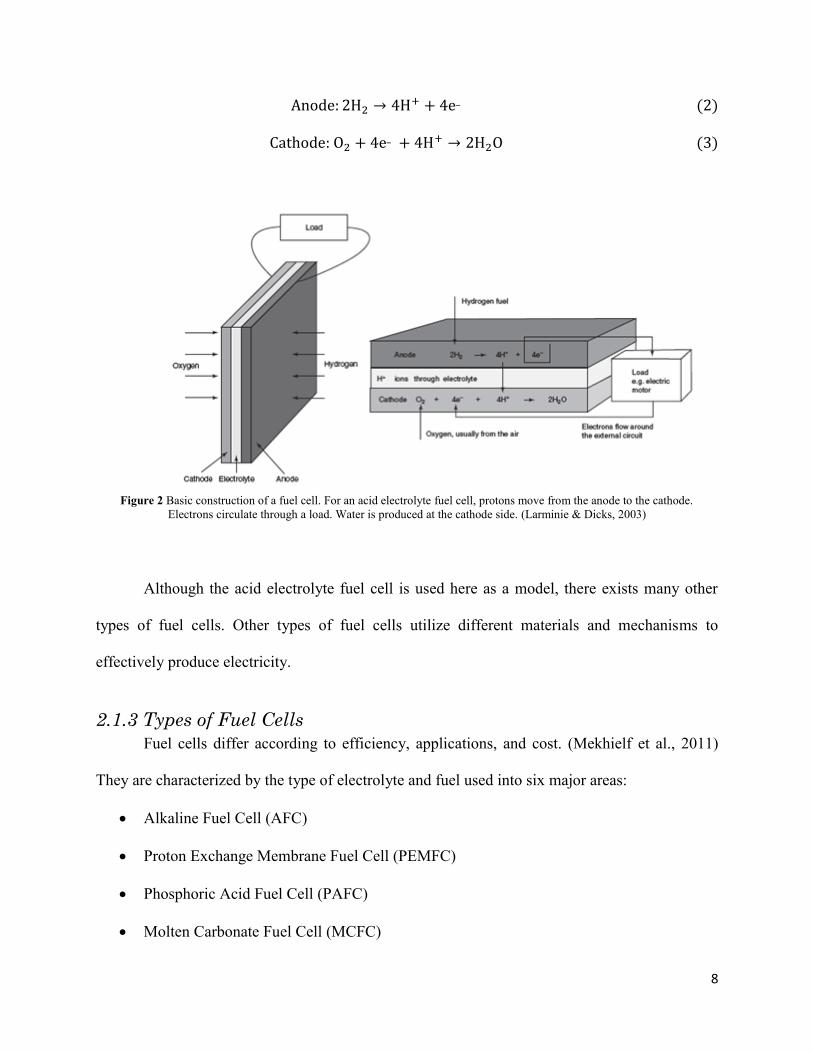