Thermal analysis of air-cooled PEM fuel cells - SFU.cambahrami/pdf/2012/Thermal analysis of...
11
Thermal analysis of air-cooled PEM fuel cells Setareh Shahsavari a , Andrew Desouza b , Majid Bahrami a , Erik Kjeang a, * a Mechatronic Systems Engineering, School of Engineering Science, Simon Fraser University, 250-13450 102 Avenue, Surrey, BC V3T 0A3 Canada b Ballard Power Systems, Inc., 9000 Glenlyon Parkway, Burnaby, BC V5J 5J8 Canada article info Article history: Received 10 July 2012 Received in revised form 7 September 2012 Accepted 11 September 2012 Available online 11 October 2012 Keywords: PEM fuel cell Air cooling Thermal management Forced convection Heat transfer Numerical modeling abstract Air-cooled proton exchange membrane fuel cells (PEMFCs), having combined air cooling and oxidant supply channels, offer significantly reduced bill of materials and system complexity compared to conventional, water-cooled fuel cells. Thermal management of air-cooled fuel cells is however a major challenge. In the present study, a 3D numerical thermal model is presented to analyze the heat transfer and predict the temperature distribution in air-cooled PEMFCs. Conservation equations of mass, momentum, species, and energy are solved in the oxidant channel, while energy equation is solved in the entire domain, including the membrane electrode assembly (MEA) and bipolar plates. The model is validated with experiments and can reasonably predict the maximum temperature and main temperature gradients in the stack. Large temperature variations are found between the cool incoming air flow and the hot bipolar plates and MEA, and in contrast to water- cooled fuel cells, significant temperature gradients are detected in the flow direction. Furthermore, the air velocity and in-plane thermal conductivity of the plate are found to play an important role in the thermal performance of the stack. Copyright ª 2012, Hydrogen Energy Publications, LLC. Published by Elsevier Ltd. All rights reserved. 1. Introduction Operation of a polymer electrolyte membrane fuel cell (PEMFC) is a complex process that includes electrochemical reactions coupled with transport of mass, momentum, energy, species and charges that occur on a wide range of length scales [1]. Different parts of a PEMFC are comprised of current collectors, anode and cathode flow channels, gas diffusion layers (GDLs), catalyst layers and membrane [2]. During operation of a PEMFC, hydrogen molecules are supplied at the anode and split into protons and electrons. The polymeric membrane conducts protons to the cathode while the electrons move from anode to cathode through an external load powered by the cell. Oxygen (from air) reacts with the protons and electrons in the cathode half-cell where water and heat are produced. A simple way to improve the performance of a fuel cell is to operate the system at its maximum allowed temperature. At higher-temperature, electrochemical activities increase and reaction takes place at a higher rate, which in turn increases the power output. On the other hand, operating temperature affects the maximum theoretical voltage at which a fuel cell can operate. Higher temperature corresponds to lower theo- retical maximum voltage and lower theoretical efficiency [3]. Temperature in the cell also influences cell humidity, which significantly influences membrane ionic conductivity. There- fore, temperature has an indirect effect on cell performance through its impact on the membrane water content. The * Corresponding author. Tel.: þ1 778 782 8791; fax: þ1 778 782 7514. E-mail address: [email protected] (E. Kjeang). Available online at www.sciencedirect.com journal homepage: www.elsevier.com/locate/he international journal of hydrogen energy 37 (2012) 18261 e18271 0360-3199/$ e see front matter Copyright ª 2012, Hydrogen Energy Publications, LLC. Published by Elsevier Ltd. All rights reserved. http://dx.doi.org/10.1016/j.ijhydene.2012.09.075
Transcript of Thermal analysis of air-cooled PEM fuel cells - SFU.cambahrami/pdf/2012/Thermal analysis of...

ww.sciencedirect.com
i n t e r n a t i o n a l j o u r n a l o f h y d r o g e n en e r g y 3 7 ( 2 0 1 2 ) 1 8 2 6 1e1 8 2 7 1
Available online at w
journal homepage: www.elsevier .com/locate/he
Thermal analysis of air-cooled PEM fuel cells
Setareh Shahsavari a, Andrew Desouza b, Majid Bahrami a, Erik Kjeang a,*aMechatronic Systems Engineering, School of Engineering Science, Simon Fraser University, 250-13450 102 Avenue, Surrey, BC V3T 0A3
CanadabBallard Power Systems, Inc., 9000 Glenlyon Parkway, Burnaby, BC V5J 5J8 Canada
a r t i c l e i n f o
Article history:
Received 10 July 2012
Received in revised form
7 September 2012
Accepted 11 September 2012
Available online 11 October 2012
Keywords:
PEM fuel cell
Air cooling
Thermal management
Forced convection
Heat transfer
Numerical modeling
* Corresponding author. Tel.: þ1 778 782 8E-mail address: [email protected] (E. Kjean
0360-3199/$ e see front matter Copyright ªhttp://dx.doi.org/10.1016/j.ijhydene.2012.09.0
a b s t r a c t
Air-cooled proton exchange membrane fuel cells (PEMFCs), having combined air cooling
and oxidant supply channels, offer significantly reduced bill of materials and system
complexity compared to conventional, water-cooled fuel cells. Thermal management of
air-cooled fuel cells is however a major challenge. In the present study, a 3D numerical
thermal model is presented to analyze the heat transfer and predict the temperature
distribution in air-cooled PEMFCs. Conservation equations of mass, momentum, species,
and energy are solved in the oxidant channel, while energy equation is solved in the entire
domain, including the membrane electrode assembly (MEA) and bipolar plates. The model
is validated with experiments and can reasonably predict the maximum temperature and
main temperature gradients in the stack. Large temperature variations are found between
the cool incoming air flow and the hot bipolar plates and MEA, and in contrast to water-
cooled fuel cells, significant temperature gradients are detected in the flow direction.
Furthermore, the air velocity and in-plane thermal conductivity of the plate are found to
play an important role in the thermal performance of the stack.
Copyright ª 2012, Hydrogen Energy Publications, LLC. Published by Elsevier Ltd. All rights
reserved.
1. Introduction with the protons and electrons in the cathode half-cell where
Operation of a polymer electrolyte membrane fuel cell
(PEMFC) is a complex process that includes electrochemical
reactions coupled with transport of mass, momentum,
energy, species and charges that occur on a wide range of
length scales [1]. Different parts of a PEMFC are comprised of
current collectors, anode and cathode flow channels, gas
diffusion layers (GDLs), catalyst layers and membrane [2].
During operation of a PEMFC, hydrogen molecules are
supplied at the anode and split into protons and electrons. The
polymeric membrane conducts protons to the cathode while
the electrons move from anode to cathode through an
external load powered by the cell. Oxygen (from air) reacts
791; fax: þ1 778 782 7514.g).2012, Hydrogen Energy P75
water and heat are produced.
A simple way to improve the performance of a fuel cell is to
operate the system at its maximum allowed temperature. At
higher-temperature, electrochemical activities increase and
reaction takes place at a higher rate, which in turn increases
the power output. On the other hand, operating temperature
affects the maximum theoretical voltage at which a fuel cell
can operate. Higher temperature corresponds to lower theo-
retical maximum voltage and lower theoretical efficiency [3].
Temperature in the cell also influences cell humidity, which
significantly influences membrane ionic conductivity. There-
fore, temperature has an indirect effect on cell performance
through its impact on the membrane water content. The
ublications, LLC. Published by Elsevier Ltd. All rights reserved.

i n t e rn a t i o n a l j o u r n a l o f h y d r o g e n en e r g y 3 7 ( 2 0 1 2 ) 1 8 2 6 1e1 8 2 7 118262
durability of the membrane electrolyte is another barrier for
higher-temperature operation due to performance degrada-
tion during long-term operation. As a result, the operating
temperature is selected by considering the durability of the
membrane electrolyte. The main purpose of thermal
management in fuel cell systems is to ensure stack operation
within a reliable temperature range and to provide a more
uniform temperature distribution in the stack. A detailed
understanding of the stack thermal behavior is therefore
necessary for design and development of an efficient cooling
solution. Oosterkamp [4] addressed some of the heat transfer
issues for both PEM based systems and solid oxide fuel cell
(SOFC) systems.
Many studies are available on analytical and numerical
modeling of PEMFCs [5e16] and several researchers have
concentrated on the area of thermal modeling and thermal
management [17e26]. Chupin et al. [20] presented a one-
dimensional thermal model for a water-cooled fuel cell.
Promislow and Wetton [21] decoupled the cross-plane heat
transfer at each channel and presented a one-dimensional
thermal model that determines the temperature distribution
through a unit fuel cell with straight flow channels. Shan and
Choe [22] also considered a one-dimensional temperature
gradient across the fuel cell stack in the through-plane direc-
tion, assuming that the temperature is constant at each cell but
varies from cell to cell. Yu and Jung [23] developed a two-
dimensional numerical thermal model of a water-cooled
PEMFC. The heat transfer sub-model included the conduction
heat transfer inside the MEA and convective heat rejection
from MEA to cooling water flow and gases. Pharoah and Bur-
heim [24] presented a two-dimensional thermal model and
obtained temperature distributions in a PEMFC in the plane
normal to the cathode flow direction. In this case, convective
heat transfer was neglected. Sasmito et al. [27] developed
a two-dimensional numerical model to investigate the forced-
air convectionheat transfer ina small, open-cathodeair-cooled
PEMFC and studied the effects of the fan power and pressure
drop on the overall performance. A three-dimensional model
was developed by Shimpalee and Dutta [17], which solved the
energy equation to predict the temperature distribution inside
a straight channel PEMFC.Adzakpaet al. [25] developeda three-
dimensional dynamic model of a single cell and included the
thermal conduction and heat generation inside the fuel cell
without considering internal convective heat transfer. A three-
dimensionalmodel that included analysis of species, heat, and
charge transport in a single-channel unit cell, was presentedby
Sinha and Wang [26]. They investigated the performance of
a PEMFCoperatingathigh temperature. In their thermalmodel,
a constant temperature condition was applied on all the
external boundaries of the fuel cell. Ramousse et al. [28]
analyzed electrochemical performances as a function of the
temperature distribution. In their thermal model they neglec-
ted convective heat transfer inside the stack [28]. The system-
level thermal management of PEMFC stacks is also studied. A
simple description of thermal effects at the system-level is
given in Ref. [29].
The majority of the PEMFC thermal studies published to
date apply to either a single fuel cell without a cooling system
orwater-cooled fuel cell stacks. Thermal analysis of air-cooled
fuel cells has not been considered extensively in the literature.
Air-cooled fuel cell systems combine the cooling functionwith
the cathode flow field and reduce the overall cost by (i) elim-
inating many of the auxiliary systems required for conven-
tional fuel cell designs (water cooling loop, air compressor,
and humidifier) and (ii) enabling a single bipolar fuel cell plate
design. The main applications of the air-cooled fuel cell are in
portable and backup power generation. Our present objective
is to develop a three-dimensional thermal model of an air-
cooled PEMFC stack in order to predict temperature distribu-
tion and heat transfer coefficients and perform parametric
studies to investigate thermal management strategies. The
results of the modeling activities are validated by experi-
mental data collected by our industrial partner, Ballard Power
Systems, Inc. Parametric studies include investigating the
effects of air velocity and bipolar plate and gas diffusion layer
(GDL) in-plane and through-plane thermal conductivities on
the stack temperature.
2. Model description
One of the most challenging aspects of computational
modeling of PEMFCs is the multi-physics and multi-scale
nature of the transport processes, and the coupling between
different processes and length scales [30]. The development of
a complete three-dimensional PEMFCmodel that considers all
the components with simultaneous transport phenomena is
a complex and challenging task. Furthermore, if the entire fuel
cell stack composed of several cells is considered as the
computational domain, modeling multi-physics processes
involves significant computational cost, even by using high
performance advanced numerical algorithms and taking
advantage of parallel computing. The present model aims to
capture the main thermal characteristics of air-cooled PEMFC
stacks at reasonable accuracy while reducing the computa-
tional cost. This can be done by decoupling the heat transfer
mode from charge transport and by considering a computa-
tional domain that can feature the two most important stack-
level thermal characteristics of air-cooled fuel cells: the
maximum stack temperature, and the main temperature
gradient which has been observed experimentally to occur in
the flow direction.
2.1. Computational domain
Two computational domains are considered in the present
study: (i) a complete cell with 80 cathode flow channels and (ii)
a single cathode channel with plate andMEA surrounding it in
the central cell. A cell-level model can represent the fuel cell
stack behavior by using periodic boundary conditions. Since
the computation time for a complete cell model is high,
a channel-level model is considered for parametric studies. As
explained previously, it is desirable to operate the fuel cell
system at a temperature slightly below the maximum allow-
able temperature. The channel-level model captures the
extreme temperature conditions by considering the central
cathode channel, which experiences the maximum temper-
ature in the entire stack. The computational domains corre-
sponding to the cell-level and channel-level models are both
illustrated in Fig. 1. Taking advantage of symmetry in the fuel

Fig. 1 e 3D schematic of an air-cooled fuel cell stack. The central cell and the central cathode channel are considered in the
present model.
i n t e r n a t i o n a l j o u r n a l o f h y d r o g e n en e r g y 3 7 ( 2 0 1 2 ) 1 8 2 6 1e1 8 2 7 1 18263
cell geometry, the equations are solved in half of the compu-
tational domain. Since air-cooled fuel cell stacks are the focus
of this study, ambient air plenums are included at the inlet
and outlet of the cell and channel, as shown in Fig. 2. These air
plenums are required to adequately capture the sudden
contraction and expansion of the flow entering and exiting the
channel as well as the heat transfer from the end walls.
2.2. Governing equations
The present model considers heat transfer in the entire
domain and laminar fluid flow and species transport in the
oxidant channel and does not include the electrochemical
reactions; local current density and cell voltage are inputs of
Fig. 2 e Cross-section of the computational domain including am
lines on top and bottom specify periodic boundary conditions.
the model. Since we have used the experimental values of
these inputs, it is possible to obtain the temperature distri-
bution both qualitatively and quantitatively. The experi-
mental data for local current density (consisting of 96 data
points on each cell) shows that the current density distribu-
tion is almost uniform in more than 90% of the cell area. The
maximum gradient is seen at the bipolar plate edges, rela-
tively far from the central cathode channel. Nevertheless, the
small variation of current density in the central channel is
included in the present model. The following main assump-
tions are made to model the fluid flow and heat transfer in an
air-cooled PEMFC stack: (1) continuous, steady state, single
phase laminar (Re < 800) incompressible flow (Ma < 0.3) is
assumed; (2) convective heat transfer in anode channel and
bient air plenums at inlet (right) and outlet (left). The dark

i n t e rn a t i o n a l j o u r n a l o f h y d r o g e n en e r g y 3 7 ( 2 0 1 2 ) 1 8 2 6 1e1 8 2 7 118264
GDL is neglected due to the relatively low velocity of fluid in
these regions (anode channels are dead-ended); (3) constant
thermophysical properties are assumed for the solid phase; (4)
radiation heat transfer is neglected since the temperature is
relatively low and the surface area of the domain exposed to
radiation is small compared to the total surface area; and (5)
heat generation is assumed to have a linear relationship with
local current density.
For the solid region, the mechanism of heat transfer is
conduction. The energy equation is as follows:
V$ðkVTÞ þ _q ¼ 0 (1)
where T is the temperature of the solid region. The term _q is
the source term for heat generation and is assumed to be zero
except in the cathode catalyst layer, where the reaction heat is
released. In order to determine the amount of heat produced
by a fuel cell, an energy balance for a fuel cell stack can be
provided:
Xi
Hi;in ¼Xi
Hi;out þ _Wstack;gross þ _Qtotal (2)
where Hi,in and Hi,out are the enthalpies of reactants and
products respectively. The heat generation calculated using
Eq. (2) can be approximated by the following equation [12]:
_Qtotal ¼ ðE� VcellÞIncell (3)
where ncell is the number of cells in a stack and E is the
maximum voltage obtained if the hydrogen heating value or
Fig. 3 e Cell-level model results for case 1: (a) air velocity magni
plate [�C].
enthalpy of formation were transformed into electrical
energy, and is given by [2]:
E ¼ �DHnF
(4)
The enthalpy of formation of water vapor at 25 �C, 100 kPa is
�241,826 kJ kmol�1. Therefore, if the lower heating value (LHV)
is used as DH in Eq. (4), E (25 �C) ¼ 1.253 V. Due to the relatively
low relative humidity and current densities of air-cooled fuel
cells, themajority of thewater produced is expected to remain
in the vapor phase and the presence of liquid water is
neglected. It should be noted that by using the LHV, the
cooling effect of evaporation is implicitly included in the heat
generation of Eq. (3). This equation also includes other sources
of heat generation such as ohmic heating. In this study, Vcell
and I are inputs of the model obtained from experimental
measurements.
In the cell-level model, natural convection heat transfer is
applied on the edges while in the channel-level model,
symmetry boundary condition is applied on the side walls.
The periodic heat transfer condition is applied on the top and
bottom surfaces of the cell, where it contacts the adjacent
cells in the stack. This boundary condition implies that T
(at zmin)¼ T (at zmax) and also _qn (at zmin)¼ _qn (at zmax) (see axes
in Figs. 1 and 2). In the cathode fluid region, due to the high
stoichiometry of air (w100) the consumption of oxygen and
production of water vapor do not affect the overall thermo-
physical properties and temperature distribution. Therefore,
tude [m sL1]; and (b) temperature distribution in the bipolar

x*=x/xmax
Temperature/ºC
0 0.2 0.4 0.6 0.8 150
60
70
80
90
100Texp (y=y1)Tsim (y=y1)Texp (y=y2)Tsim (y=y2)Texp (y=y3)Tsim (y=y3)Texp (y=y4)Tsim (y=y4)
max difference=3%
Fig. 4 e Comparison of plate temperature for case 1:
cell-level model (lines) and measured data (symbols) at
different locations for the central cell in the stack. Four
lines, y1, ., y4, from oxidant inlet to outlet are specified in
Fig. 3.
i n t e r n a t i o n a l j o u r n a l o f h y d r o g e n en e r g y 3 7 ( 2 0 1 2 ) 1 8 2 6 1e1 8 2 7 1 18265
we have neglected the oxygen depletion and only considered
water vapor generation to investigate the effect of tempera-
ture on relative humidity distribution inside the channel.
Assuming continuous, steady state, laminar, incompressible
flow inside the cathode channels and air plenums, the
conservation equations of mass, species, momentum, and,
energy are as follows:
V$ðruÞ ¼ Smass (5)
u$Vc ¼ V$ðDVcÞ þ Smol (6)
ru$Vu ¼ �Vpþ mV2u (7)
rcpu$VTf ¼ V$�kVTf
�(8)
where u is the velocity vector (m s�1), Smass (kg m�3 s�1) and
Smol (mol m�3 s�1) are source terms for mass and species
Fig. 5 e Channel-level model results for case 1: temperature pro
and (b) parallel to the oxidant flow direction.
transport, respectively. Two species are considered in the fluid
region: air and water vapor. The transport of water vapor in
the air stream takes place through convection and diffusion.
In Eq. (6), D denotes the binary diffusion coefficient of
water vapor in air, which depends on temperature and can
be described by the following relation proposed by Bolz and
Tuve [31]:
D ¼ �2:775� 10�6
�m2
s
�þ 4:479� 10�8
�m2
s K
�Tþ 1:656
� 10�10
�m2
s K2
�T2 (9)
In the present model, the water vapor production is defined
as amolar flux boundary condition at the interface ofMEA and
oxidant channel that accounts for the total species flux across
the boundary. This implies that all the produced water is
assumed to be removed through the oxidant channel. The
rate of water vapor generation in the cathode half-cell is
derived by:
_mH2O;produced ¼ IMH2O
2F(10)
Since the flow is continuous, no slip and no temperature
jump conditions are applied at the wall. Therefore, the
boundary condition for velocity field is u (at wall) ¼ 0 and for
temperature field is T (at wall) ¼ Twall. The flow enters with
a constant uniform velocity, uin, and constant temperature,
Tin. For the fluid flow conditions at the outlet, no viscous stress
along with constant atmospheric pressure, patm, are
considered.
For the species transport equation, the boundary condition
at the inlet is the ambient air relative humidity specified by
a constant concentration: c ¼ cin. At the outlet, the species is
transported out of the domain by the fluid flow. Here,
convection is the dominating effect and the diffusive contri-
bution can be ignored, such that:
n$ð�DVcÞ ¼ 0 (11)
For solving the system of partial differential equations
described above, COMSOL Multiphysics 4.2a is used. Constant
thermophysical properties are assumed for the solid phase
while air properties such as density, heat capacity, dynamic
viscosity, and thermal conductivity vary with temperature.
Air density is obtained from the ideal gas law. Other thermo-
physical properties of air are obtained from COMSOL library.
files in the middle cross-section of the channel (a) normal

Table 1 e Model validation.
Case # Air inletvelocity, u [m s�1]
Cell heatgeneration, _Qcell [W]
Maximum temperature, Tmax [�C] Relative difference,Tsim � Texp
TsimExperimenta Simulation
1 1.76 55.7 76 77 1.3%
2 2.19 37.7 65 68 4.4%
3 1.63 27.6 61 64 4.7%
4 1.45 29.1 67 69 2.8%
5 0.95 6.3 35 36 2.7%
6 0.94 13.7 50 54 7.4%
a Experimental results from Ballard Power Systems.
i n t e rn a t i o n a l j o u r n a l o f h y d r o g e n en e r g y 3 7 ( 2 0 1 2 ) 1 8 2 6 1e1 8 2 7 118266
Grid independency is checked by solving a case study using
three different mesh sizes. For the channel-level study, three
mesh sizes consisting of 3.5 � 105, 7.0 � 105, and 1.4 � 106
elements were implemented. We found that the mesh size of
7.0 � 105 elements gives approximately 1% deviation in terms
of local temperature, velocities, and pressure compared to the
finest mesh and therefore is sufficient for the numerical
investigation purposes. For the cell-levelmodel, amesh size of
1.4 � 107 elements leads to a mesh-independent result. The
computation time for the channel-level model is 30 min and
for the cell-level simulation is 5 days on a PC with Intel Core2
2.66 GHz processor. Hence, the channel-level model is
considered for the parametric studies.
Table 2 e Geometrical and thermophysical parametersassumed in the reference case.
tBP 5.50 mm trib,cathode 1.50 mm
tGDL,anode 0.20 mm trib,anode 1.50 mm
tGDL,cathode 0.20 mm kBP,thr 20 W m�1 K�1
tCCM 0.05 mm kBP,in 60 W m�1 K�1
lcell 280.0 mm kGDL,in 10 W m�1 K�1
wcell ¼ lch 60.00 mm kGDL,thr 0.7 W m�1 K�1
hch,cathode 2.50 mm kCCM 1.5 W m�1 K�1
hch,anode 1.50 mm kH2 0.18 W m�1 K�1
wch,cathodea 2.50 mm D From Eq. (9)
wch,anodea 1.00 mm Vcell From experiment
qch,cathode 80� I From experiment
qch,anode 80� E 1.253 V
a In trapezoidal cross-section, w is the longer side.
3. Results and discussion
3.1. Model validation
To validate the model with experimental data and also to
verify the practicality of the boundary conditions considered
in the channel-level model, the three-dimensional numerical
model described in Section 2 is first solved on the cell level.
The cell-level simulation is conducted under the test condi-
tions that generate the highest amount of heat in a Ballard air-
cooled PEMFC stack. The velocity magnitude in the flow
channels and the bipolar plate temperature distribution are
presented in Fig. 3(a) and (b), respectively. The isothermal
contours in Fig. 3(b) are flat in the central channels, which
indicates that thermally insulated boundary condition can be
considered in the channel-level model. The plate temperature
is measured in the Ballard ACS stack at 24 different positions
using thermocouples arranged in a 6� 4matrix: 6 points along
x axis and 4 points along y axis. Fig. 4 compares these data
points with simulated temperature variation in x-direction at
four equivalent lines located at y ¼ y1, ., y4 (see Fig. 3), from
cathode inlet to outlet. The difference between measured and
predicted temperature is less than 3% for all points.
Similarly, for validating the channel-level model, simula-
tions under certain conditions are performed and compared
with experimental data. Fig. 5 shows the simulated tempera-
ture profiles in the middle cross-section of the channel in the
normal (a) and parallel (b) directions to the flow. In the solid,
a prominent gradient exists in the y direction parallel to the
flow in the cathode channel, whereas relatively high
temperature gradients exist in all directions in the flow
channel.
The obtained maximum stack temperatures for different
cases are presented in Table 1. The location of the maximum
temperature as observed in the experiments is the plate
temperature at the outlet of the central channel in the middle
row of the stack, in agreement with themodeling approach. In
the tests reported in Table 1, the inlet air temperature is
constant at the room temperature, 21 �C, while the air velocity
and the cell voltage vary in different cases. The operating
conditions in case 1 (Table 1), are the same as for the cell-level
simulation shown in Figs. 3 and 4. The last column in this
table shows the relative difference between predicted
maximum temperature and experimentally measured
maximum temperature. Overall, the modeling results are
within a few degrees of the measured data (the relative
difference is in the range of 1e7%).
3.2. Reference case
To elucidate the overall thermal characteristics of air-cooled
fuel cells and to perform parametric studies, a reference
case is investigated in the single-channel level. In this refer-
ence case (described schematically in Figs. 1 and 2 and para-
metrically in Table 2), the inlet air velocity is selected to
3.0 m s�1, the inlet air temperature is 20 �C, and the total heat
generated in one cell is 48 W. Assuming 80 channels in one
cell, the total heat generated in the modeling domain (half
channel) is 0.3 W. The material thermophysical properties
assumed for the reference case are listed in Table 2.

Fig. 6 e Schematic of heat flux vectors: (a) conductive heat flux; and (b) convective heat flux.
i n t e r n a t i o n a l j o u r n a l o f h y d r o g e n en e r g y 3 7 ( 2 0 1 2 ) 1 8 2 6 1e1 8 2 7 1 18267
Two major modes of heat transfer in air-cooled fuel cells
are forced convective heat transfer in cathode channels and
conductive heat transfer in the entire domain. The direction of
the convective heat flux is the same as the flow direction
whereas the direction of the conductive heat flux is deter-
mined by the temperature gradient which is in the opposite
direction of the flow, as schematically shown in Fig. 6. Inter-
estingly, the combined heat transfer mechanism exhibits
completely three-dimensional characteristics, thereby justi-
fying the proposed use of a three-dimensional numerical
modeling approach.
Fig. 7 compares the absolute values of the local convective
and conductive heat fluxes along the channel. The convective
heat flux is calculated as follows:
q00conv ¼
_maircpdTm
dyG
(12)
y*=y/ymax
Heatflux/Wm-2
0.2 0.4 0.6 0.8 1101
102
103
104
convective heat fluxconductive heat flux
Fig. 7 e Absolute values of mean conductive and
convective heat flux in the direction of air flow (reference
case).
where Tm is the velocity-weighted average of the temperature
distribution over the cross-section and G is the channel
perimeter. The convective heat flux is based on the channel
wall area while the conductive heat flux calculated from
Eq. (13) is based on the domain cross-sectional area.
q00cond ¼ 1
Ac
ZAc
�kvTvy
dAc (13)
Therefore, to compare the order of magnitude of these two
heat fluxes in Fig. 7, q00cond in Eq. (13) is multiplied by a factor of
Ac/Aw, where Ac is the domain cross-sectional area and Aw is
the channel wall surface area. Note that the conductive heat
flux is negative in the air flow direction. As can be inferred
from Fig. 7, at the inlet, the convective heat flux is one order of
magnitude higher than the conductive heat flux. Moreover,
the convective heat flux has its maximum at the inlet and
decreases in the flow direction consistently while the
conductive heat flux has its maximum value internally at
some point after the inlet. This is due to the different variation
of the fluid bulk temperature and the plate temperature
gradient in the flow developing region.
In Table 3, the values of total convective and conductive
heat transfer dissipated from the domain to the surroundings
are calculated by integrating Eq. (12) over the channel wall
area and Eq. (13) over the inlet and outlet cross-sectional area
of the domain respectively. Also, the percentages of each type
of heat transfer, under different conditions (air velocity and
plate thermal conductivity), are compared in Table 3. At high
air velocities, convection is the major part of heat transfer,
and the contribution of conductive heat transfer becomes
more important as the plate thermal conductivity increases.
In general, the convective heat dissipation is an order of
magnitude (w10�) higher than the conductive portion.
Simulations of the water vapor distribution are also con-
ducted for the reference case air-cooled fuel cell configuration.
The resulting variation of the average relative humidity and
water vapor mass fraction inside the cathode channel is
plotted in Fig. 8. As a result of the water generation in the
cathode catalyst layer (calculated using Eq. (10)) and associ-
ated mass flux into the relatively dry cathode air channel, the
mass fraction of water vapor increases along the channel.
Although a significant amount of water vapor diffuses into the

Table 3 e Comparison of simulated conductive and convective heat dissipation to the surroundings.
Case# Air velocity u[m s�1]
Plate thermalconductivity kBP[W m�1 K�1]
Convective heattransfer _Qconv [W]
Conductive heattransfer _Qcond [W]
Percentageof convectiveheat transfer
Percentage ofconductive heat
transfer
1 4.0 30 0.289 0.011 96% 4%
2 3.0 50 0.27 0.03 90% 10%
3 2.0 30 0.264 0.036 88% 12%
4 4.0 60 0.262 0.038 87% 13%
All parameters are kept constant in different cases except the oxidant flow rate and plate thermal conductivity.
i n t e rn a t i o n a l j o u r n a l o f h y d r o g e n en e r g y 3 7 ( 2 0 1 2 ) 1 8 2 6 1e1 8 2 7 118268
channel, it is noteworthy to observe that the average relative
humidity is decreasing from 25% at the inlet to 11% at the
outlet of the cathode channel. This is due to the temperature
rise in the air flow, which increases the saturation pressure
and controls the relative humidity. It is therefore important to
consider the coupled effects of humidity and temperature in
air-cooled fuel cells.
100
3.3. Parametric study
In this section, the effects of selected parameters such as air
inlet velocity, bipolar plate thermal conductivity, and GDL
thermal conductivity on the maximum temperature and
temperature distribution in the fuel cell stack are investigated.
In the parametric studies, only one parameter is varied while
all other inputs parameters are kept the same as the reference
case (see Table 2). The air velocities and plate thermal
conductivities considered here are based on a practical range
of fan operating conditions and graphite based bipolar plate
materials, respectively. For the range of bipolar plate thermal
conductivity see Refs. [32] and [33].
The results of varying the air velocity and bipolar plate
thermal conductivity are plotted in Figs. 9 and 10, respectively.
By increasing the air inlet velocity, the maximum stack
temperature drops considerably, as expected. Increasing the
bipolar plate thermal conductivity also has a positive impact
on reducing the temperature in the entire domain, although
y*=y/ymax
Relativehumidity/%
Vapourmassfraction
0 0.2 0.4 0.6 0.8 110
12
14
16
18
20
22
24
26
0.004
0.006
0.008
0.010
0.012
Fig. 8 e Relative humidity and water vapor mass fraction
along the cathode channel.
not as significantly as for air velocity. Both air velocity and
plate thermal conductivity are thus important parameters for
thermal management of air-cooled stacks. There are highly
thermally conductive materials such as pyrolytic graphite
sheet (with thermal conductivity of 600e800Wm�1 K�1 in the
in-plane directions) that can be used for efficient heat transfer
in the stack [32].
Fig. 11 shows the effect of the GDL thermal conductivity on
temperature distribution along the channel (see Ref. [34] for
the GDL effective thermal conductivity range). It can be
observed that unlike the bipolar plate thermal conductivity,
which has significant impact on the overall heat transfer
characteristics, changing the GDL thermal conductivity does
not alter the temperature distribution, at least within the
studied range. This is due to the fact that both thickness and
thermal conductivity of bipolar plate are one order of magni-
tude higher than that of GDL. The effect of anisotropic GDL
thermal conductivity is also analyzed in Fig. 11: in-plane and
through-plane thermal conductivities of 17 and 0.5Wm�1 K�1
respectively are compared to the isotropic case of
0.5 W m�1 K�1 (see Ref. [35] for the GDL in-plane thermal
conductivity). According to our modeling results, the GDL
thermal conductivity does not change the temperature
profiles significantly in any of the cases studied. Because of
uair, channel / m s-1
T max/ºC
1 2 3 4 5 640
50
60
70
80
90
Fig. 9 e Effect of air velocity on maximum stack
temperature.
kBP / W m-1 K-1
T max/ºC
0 50 100 150 20063
64
65
66
67
68
69
Fig. 10 e Effect of bipolar plate thermal conductivity on
maximum stack temperature.
y*=y/ymax
Platetemperature/ºC
0 0.2 0.4 0.6 0.8 145
50
55
60
65
70
kBP, in=kBP, thr=20kBP, in=kBP, thr=40kBP, in=kBP, thr=60kBP, in=60, kBP, thr=20
Fig. 12 e Effect of bipolar plate in-plane and through-plane
thermal conductivity on plate temperature distribution
along the channel. Unit of thermal conductivity is
[W mL1 KL1].
i n t e r n a t i o n a l j o u r n a l o f h y d r o g e n en e r g y 3 7 ( 2 0 1 2 ) 1 8 2 6 1e1 8 2 7 1 18269
the high air flow rate, the heat transfer in air-cooled fuel cells
is primarily controlled by convection and thus GDL thermal
conductivity does not play a major role.
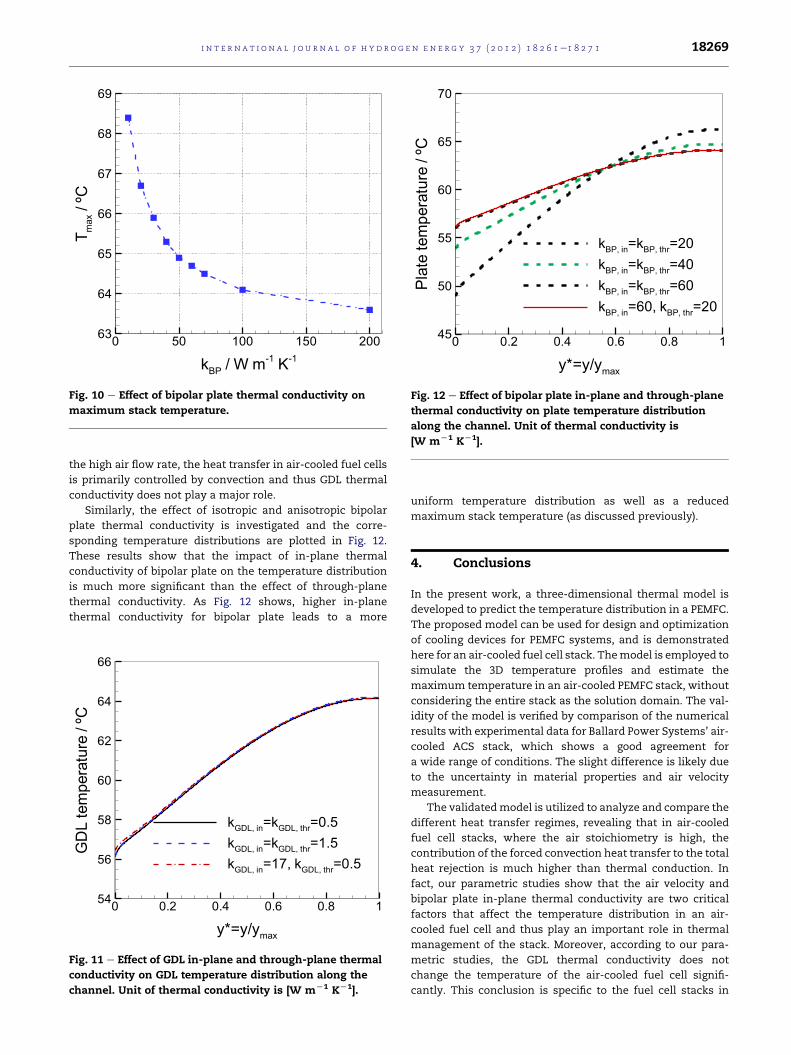
Similarly, the effect of isotropic and anisotropic bipolar
plate thermal conductivity is investigated and the corre-
sponding temperature distributions are plotted in Fig. 12.
These results show that the impact of in-plane thermal
conductivity of bipolar plate on the temperature distribution
is much more significant than the effect of through-plane
thermal conductivity. As Fig. 12 shows, higher in-plane
thermal conductivity for bipolar plate leads to a more
y*=y/ymax
GDLtemperature/ºC
0 0.2 0.4 0.6 0.8 154
56
58
60
62
64
66
kGDL, in=kGDL, thr=0.5kGDL, in=kGDL, thr=1.5kGDL, in=17, kGDL, thr=0.5
Fig. 11 e Effect of GDL in-plane and through-plane thermal
conductivity on GDL temperature distribution along the
channel. Unit of thermal conductivity is [W mL1 KL1].
uniform temperature distribution as well as a reduced
maximum stack temperature (as discussed previously).
4. Conclusions
In the present work, a three-dimensional thermal model is
developed to predict the temperature distribution in a PEMFC.
The proposed model can be used for design and optimization
of cooling devices for PEMFC systems, and is demonstrated
here for an air-cooled fuel cell stack. Themodel is employed to
simulate the 3D temperature profiles and estimate the
maximum temperature in an air-cooled PEMFC stack, without
considering the entire stack as the solution domain. The val-
idity of the model is verified by comparison of the numerical
results with experimental data for Ballard Power Systems’ air-
cooled ACS stack, which shows a good agreement for
a wide range of conditions. The slight difference is likely due
to the uncertainty in material properties and air velocity
measurement.
The validatedmodel is utilized to analyze and compare the
different heat transfer regimes, revealing that in air-cooled
fuel cell stacks, where the air stoichiometry is high, the
contribution of the forced convection heat transfer to the total
heat rejection is much higher than thermal conduction. In
fact, our parametric studies show that the air velocity and
bipolar plate in-plane thermal conductivity are two critical
factors that affect the temperature distribution in an air-
cooled fuel cell and thus play an important role in thermal
management of the stack. Moreover, according to our para-
metric studies, the GDL thermal conductivity does not
change the temperature of the air-cooled fuel cell signifi-
cantly. This conclusion is specific to the fuel cell stacks in

i n t e rn a t i o n a l j o u r n a l o f h y d r o g e n en e r g y 3 7 ( 2 0 1 2 ) 1 8 2 6 1e1 8 2 7 118270
which convective heat transfer is considerably higher than
conductive heat transfer. It is also determined that humidity
and temperature distributions are highly coupled in air-cooled
cells. Despite water generation in the cell, the relative
humidity may decrease along the channel due to the rising
temperature towards the outlet.
In our future work, the present thermal model will be
integrated with a performance model in order to investigate
the effects of parameters that influence the fuel cell current
and voltage and provide a more detailed analysis of the heat
generation in the stack. This three-dimensional model for
single cells will form a theoretical foundation for thermal
analysis of multi-cell stacks where thermal management and
stack cooling is a significant engineering challenge.
Acknowledgments
Funding for this research provided by Ballard Power Systems,
Inc., Natural Sciences and Engineering Research Council of
Canada, Western Economic Diversification Canada, Canada
Foundation for Innovation, British Columbia Knowledge
Development Fund, and Simon Fraser University is highly
appreciated. We also gratefully acknowledge the in-kind
contributions provided by Ballard Power Systems and the
support from the following individuals: Julie Bellerive, David
Harvey, and Shanna Knights.
Nomenclature
Ac cross-sectional area of the channel, m2
Aw surface area of the channel walls, m2
c concentration, mol m�3
cp specific heat, J K�1 kg�1
D diffusion coefficient, m2 s�1
E thermal voltage, V
F Faraday’s constant, C mol�1
H enthalpy, J
I electrical current, A
k thermal conductivity, W m�1 K�1
l length, m
M molar mass, g mol�1
_m mass flow rate, kg s�1
ncell number of cells in a stack, e
n number of moles of electrons per mole of reactant, e
n outward unit normal, e
p pressure, Pa
PEM polymer electrolyte membrane_q heat generation per unit volume, W m�3
q00 heat generation per unit area, W m�2
_Q total heat generation, W
Smass mass source term, kg m�3 s�1
T temperature, K
t thickness, m
u velocity, m s�1
u velocity vector, m s�1
V output voltage, V_W power, W
w width, m; water vapor mass fraction, e
Greek symbols
G channel perimeter, m
q smaller angle in trapezoidal cross-section
m fluid viscosity, N s m�2
r density, kg m�3
Subscripts
atm atmospheric
BP bipolar plate
CCM catalyst coated membrane
cell single fuel cell
ch channel
cond conduction
conv convection
exp experiment
f fluid
GDL gas diffusion layer
in inlet, in-plane
m mean
MEA membrane electrode assembly
out outlet
sim simulation
thr through-plane
r e f e r e n c e s
[1] Mench MM. In: Fuel cell engines. 1st ed. New Jersey: JohnWiley & Sons; 2008.
[2] Larminie J, Dicks A. In: Fuel cell systems explained. 2nd ed.Chichester: John Wiley & Sons; 2003.
[3] Faghri A, Guo Z. Challenges and opportunities of thermalmanagement issues related to fuel cell technology andmodeling. International Journal of Heat and Mass Transfer2005;48:3891e920.
[4] van den Oosterkamp PF. Critical issues in heat transfer forfuel cell systems. Energy Conversion and Management 2006;47:3552e61.
[5] Berning T, Djilali N. Three-dimensional computationalanalysis of transport phenomena in a PEM fuel cell ea parametric study. Journal of Power Sources 2003;124:440e52.
[6] Wang L, Husar A, Zhou T, Liu H. A parametric study of PEMfuel cell performances. International Journal of HydrogenEnergy 2003;28:1263e72.
[7] Gasteiger HA, Panels JE, Yan SG. Dependence of PEM fuel cellperformance on catalyst loading. Journal of Power Sources2004;127:162e71.
[8] Pathapati PR, Xue X, Tang J. A new dynamic model forpredicting transient phenomena in a PEM fuel cell system.Renewable Energy 2005;30:1e22.
[9] Ferng YM, Tzang YC, Pei BS, Sun CC, Su A. Analytical andexperimental investigations of a proton exchange membranefuel cell. International Journal of Hydrogen Energy 2004;29:381e91.
[10] Schwarz DH, Djilali N. 3D modeling of catalyst layers in PEMfuel cells. Journal of The Electrochemical Society 2007;154:B1167e78.
[11] Inoue G, Yoshimoto T, Matsukuma Y, Minemoto M, Itoh H,Tsurumaki S. Numerical analysis of relative humiditydistribution in polymer electrolyte fuel cell stack includingcooling water. Journal of Power Sources 2006;162:81e93.

i n t e r n a t i o n a l j o u r n a l o f h y d r o g e n en e r g y 3 7 ( 2 0 1 2 ) 1 8 2 6 1e1 8 2 7 1 18271
[12] Huisseune H, Willockx A, De Paepe M. Semi-empirical along-the-channel model for a proton exchange membrane fuelcell. International Journal of Hydrogen Energy 2008;33:6270e80.
[13] Inoue G, Yoshimoto T, Matsukuma Y, Minemoto M, Itoh H,Tsurumaki S. Effect of flow pattern of gas and cooling wateron relative humidity distribution in polymer electrolyte fuelcell. Journal of Power Sources 2006;162:94e104.
[14] Scholta J, Haussler F, Zhang W, Kuppers L, Jorissen L,Lehnert W. Development of a stack having an optimized flowfield structure with low cross transport effects. Journal ofPower Sources 2006;155:60e5.
[15] Chang PAC, St-Pierre J, Stumper Jr , Wetton B. Flowdistribution in proton exchange membrane fuel cell stacks.Journal of Power Sources 2006;162:340e55.
[16] Liu Z, Mao Z, Wang C, Zhuge W, Zhang Y. Numericalsimulation of a mini PEMFC stack. Journal of Power Sources2006;160:1111e21.
[17] Shimpalee S, Dutta S. Numerical prediction of temperaturedistribution in PEM fuel cells. Numerical Heat Transfer Part A2000;38:111e28.
[18] Fuller TF, Newman J. Water and thermal management insolid-polymer-electrolyte fuel cells. Journal of TheElectrochemical Society 1993;140:1218e25.
[19] Ju H, Meng H, Wang CY. A single-phase, non-isothermalmodel for PEM fuel cells. International Journal of Heat andMass Transfer 2005;48:1303e15.
[20] Chupin S, Colinart T, Didierjean S, Dube Y, Agbossou K,Maranzana G, et al. Numerical investigation of the impact ofgas and cooling flow configurations on current and waterdistributions in a polymer membrane fuel cell througha pseudo-two-dimensional diphasic model. Journal of PowerSources 2010;195:5213e27.
[21] Promislow K, Wetton B. A simple, mathematical model ofthermal coupling in fuel cell stacks. Journal of Power Sources2005;150:129e35.
[22] Shan Y, Choe SY. A high dynamic PEM fuel cell model withtemperature effects. Journal of Power Sources 2005;145:30e9.
[23] Yu S, Jung D. Thermal management strategy for a protonexchange membrane fuel cell system with a large active cellarea. Renewable Energy 2008;33:2540e8.
[24] Pharoah JG, Burheim OS. On the temperature distribution inpolymer electrolyte fuel cells. Journal of Power Sources 2010;195:5235e45.
[25] Adzakpa KP, Ramousse J, Dube Y, Akremi H, Agbossou K,Dostie M, et al. Transient air cooling thermal modeling ofa PEM fuel cell. Journal of Power Sources 2008;179:164e76.
[26] Sinha PK, Wang CY, Beuscher U. Transport phenomena inelevated temperature PEM fuel cells. Journal of theElectrochemical Society 2007;154:B106e16.
[27] Sasmito AP, Lum KW, Birgersson E, Mujumdar AS.Computational study of forced air-convection in open-cathode polymer electrolyte fuel cell stacks. Journal of PowerSources 2010;195:5550e63.
[28] Ramousse J, Adzakpa KP, Dube Y, Agbossou K, Fournier M,Poulin A, et al. Local voltage degradations (drying andflooding) analysis through 3D stack thermal modeling.Journal of Fuel Cell Science and Technology 2010;7:041006e10.
[29] Musio F, Tacchi F, Omati L, Gallo Stampino P, Dotelli G,Limonta S, et al. PEMFC system simulation in MATLAB-Simulink� environment. International Journal of HydrogenEnergy 2011;36:8045e52.
[30] Djilali N. Computational modelling of polymer electrolytemembrane (PEM) fuel cells: challenges and opportunities.Energy 2007;32:269e80.
[31] Bolz R, Tuve G. In: Handbook of tables for appliedengineering science. 2nd ed. Cleveland: CRC Press; 1976.
[32] Wen C-Y, Huang G-W. Application of a thermally conductivepyrolytic graphite sheet to thermal management of a PEMfuel cell. Journal of Power Sources 2008;178:132e40.
[33] Du L. Highly conductive epoxy/graphite polymer compositebipolar plates in proton exchange membrane (PEM) fuel cells.Akron, Ohio: The University of Akron; 2008.
[34] Sadeghi E, Djilali N, Bahrami M. Effective thermalconductivity and thermal contact resistance of gas diffusionlayers in proton exchange membrane fuel cells. Part 1: effectof compressive load. Journal of Power Sources 2011;196:246e54.
[35] Sadeghi E, Djilali N, Bahrami M. A novel approach todetermine the in-plane thermal conductivity of gas diffusionlayers in proton exchange membrane fuel cells. Journal ofPower Sources 2011;196:3565e71.