ELECTRICITY PRICE SUPPRESSION EFFECTS: AN...
19
ELECTRICITY PRICE SUPPRESSION EFFECTS: AN EFFICIENCY BENEFIT IN ILLINOIS STAKEHOLDER ADVISORY GROUP MEETING SPRINGFIELD, IL July 29, 2014 Chris Neme, Energy Futures Group Paul Chernick, Resource Insight
Transcript of ELECTRICITY PRICE SUPPRESSION EFFECTS: AN...

ELECTRICITY PRICE SUPPRESSION EFFECTS: AN EFFICIENCY BENEFIT IN ILLINOIS STAKEHOLDER ADVISORY GROUP MEETING SPRINGFIELD, IL July 29, 2014
Chris Neme, Energy Futures Group Paul Chernick, Resource Insight

Summary 2
Economics 101: lower demand means lower prices NRDC study quantified effect for IL electric EE
programs Lower price benefits all Illinois electricity consumers That benefit should be included in IL TRC screening

Conceptually Simple – Law of Supply & Demand
3
Graph from AmosWEB Encyclonomic WEB*pedia

Estimating IL Electric Price Suppression Effects
4
1. Estimate effect of 1% reduction in load on price Regress historical hourly prices as function of loads Separately analyze on-peak and off-peak hours July 2009 to December 2012 data from PJM, MISO Adjust for % of regional load affected by IL EE
2. Adjust for short-term mitigation of effects by existing contracts
3. Adjust for erosion of effects over time due to several factors: Price-induced demand increases Accelerated plant retirements, delayed capacity adds Shift in new capacity to peakers (higher energy prices)

Effect of Load on Price - Example 5
ComEd LMP as Function of ComEd Load (October 2012)

Effect of Load on Price - Results 6
1% Reduction in Load = ~2% Reduction in Price Very consistent result across varying region
definitions For both on-peak and off-peak periods For both ComEd and Ameren
IL prices driven by loads in wider Midwest region So 1% reduction in IL load alone reduces IL price
<2% The impact of IL EE on IL price proportional to IL
share of load for total price-setting region

Regions Examined 7
MISO Load Regions and PJM ComEd Zone
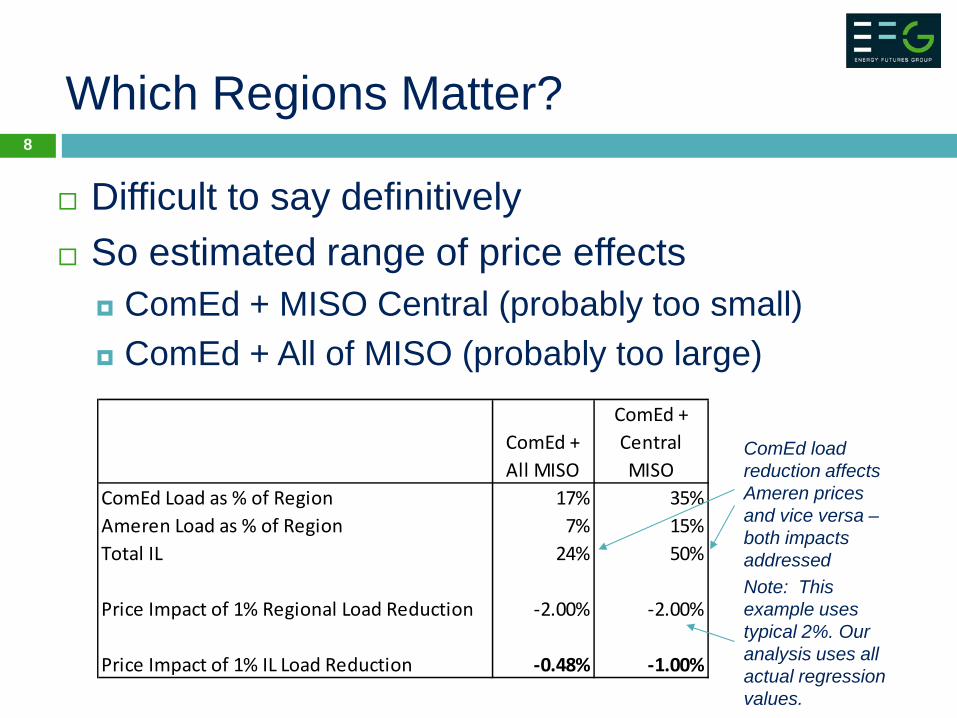
Which Regions Matter? 8
Difficult to say definitively So estimated range of price effects
ComEd + MISO Central (probably too small) ComEd + All of MISO (probably too large)
ComEd + All MISO
ComEd + Central MISO
ComEd Load as % of Region 17% 35%Ameren Load as % of Region 7% 15%Total IL 24% 50%
Price Impact of 1% Regional Load Reduction -2.00% -2.00%
Price Impact of 1% IL Load Reduction -0.48% -1.00%
Note: This example uses typical 2%. Our analysis uses all actual regression values.
ComEd load reduction affects Ameren prices and vice versa – both impacts addressed

Translating Price Reduction to Avoided Cost
9
1% lower price has same total bill effect as 1% lower use
Value of lower usage expressed in avoided energy costs
Therefore, (additional) benefits of 1% drop in load =~100% of avoided energy costs Effectively doubles avoided energy costs
Thus, IL EE price suppression effects = ~50% to 100% of avoided energy costs before adjusting for… short-term price hedging (fixed contracts) long-term erosion effects

Short-Term Price Hedging Effects 10
IPA 2013 Procurement Plan suggest goal of hedging: 75% of energy in current year 50% for next year 25% for year after that
Difficult to assess hedging by competitive retailers Res. customers offered fixed rates for 1 to 24 months Bus. customers offered both fixed price & indexed products
But little info available on distribution of contracts by duration Study assumes
60% hedged 1st year 40% headed 2nd year 20% hedged 3rd year 2% hedged subsequent years
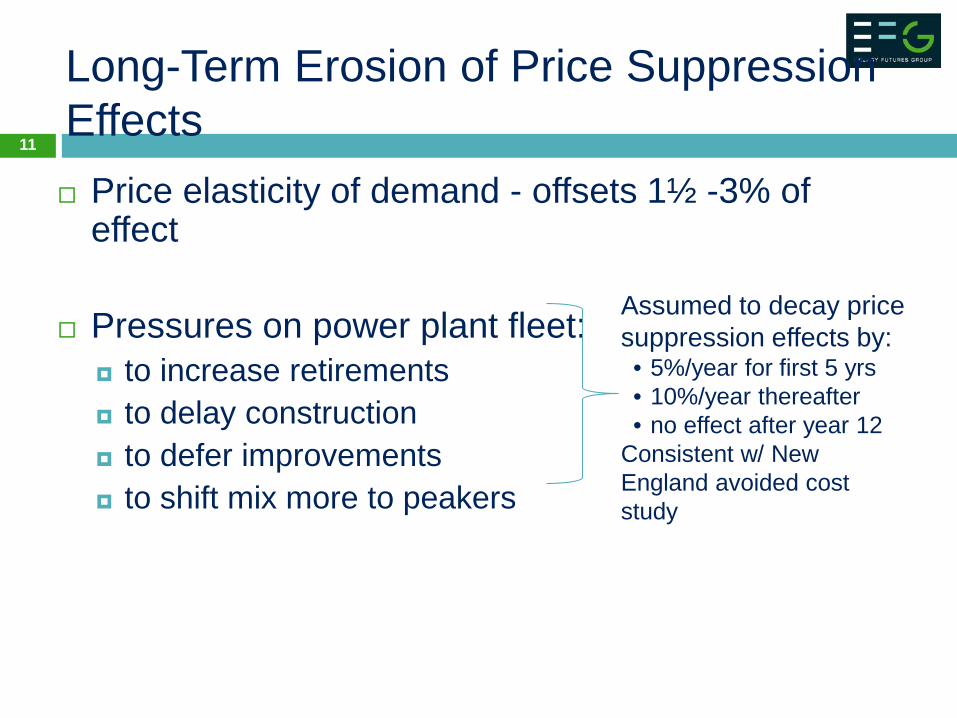
Long-Term Erosion of Price Suppression Effects
11
Price elasticity of demand - offsets 1½ -3% of effect
Pressures on power plant fleet:
to increase retirements to delay construction to defer improvements to shift mix more to peakers
Assumed to decay price suppression effects by: • 5%/year for first 5 yrs • 10%/year thereafter • no effect after year 12
Consistent w/ New England avoided cost study

Net Effect of All Adjustments 12
Depends on measure life: 5 years: 30% to 60% increase in energy avoided
costs 10 years: 30% to 50% increase in energy avoided
costs 15 years: 20% to 40% increase in energy avoided
costs 20 years: 20% to 35% increase in energy avoided
costs
Note: all estimates above assume a real discount rate of 6%
Effects Not Addressed by Current Study
13
Suppression of electric capacity prices ($/MW-day) Suppression of gas prices from reduced electric
demand To extent gas power plants are on the margin & run
less Suppression of gas prices from gas efficiency
programs Lowers price of gas purchased by consumers
Reduction of electric prices from reduced gas price Lower cost to gas generators savings to electric
consumers

Are Price Suppression Effects a TRC Benefit? National Expert Opinion 14
Woolf, Tim et al. (Synapse Energy Economics), “Energy Efficiency Cost-Effectiveness Screening in the Northeast and Mid-Atlantic States: A Survey of Issues and Practices, With Recommendations for Developing Guidance to the Regional Evaluation, Measurement and Verification (EM&V) Forum”, prepared for the Regional EM&V Forum, a project of the Northeast Energy Efficiency Partnerships, October 2, 2013.

IL Legislative Language on Cost-Eff Test
15
TRC test “compares the sum of avoided electric utility costs, representing the benefits that accrue to the system and the participant in the delivery of those efficiency measures, as well as other quantifiable societal benefits…” Lower bills for all customers are a benefit to the system Impacts on supplier profits are generally excluded from
“the system” in regulatory decision-making: when evaluating QF rates and IPP contracts when selecting T&D equipment when reviewing IPA’s procurement – of both energy and
efficiency when determining cost of DSM contractor services

Chris Neme Energy Futures Group [email protected] Phone: 802-482-5001 Cell: 802-363-6551
Q&A 16
Paul Chernick Resource Insight [email protected] Phone: 781-646-1505 x207
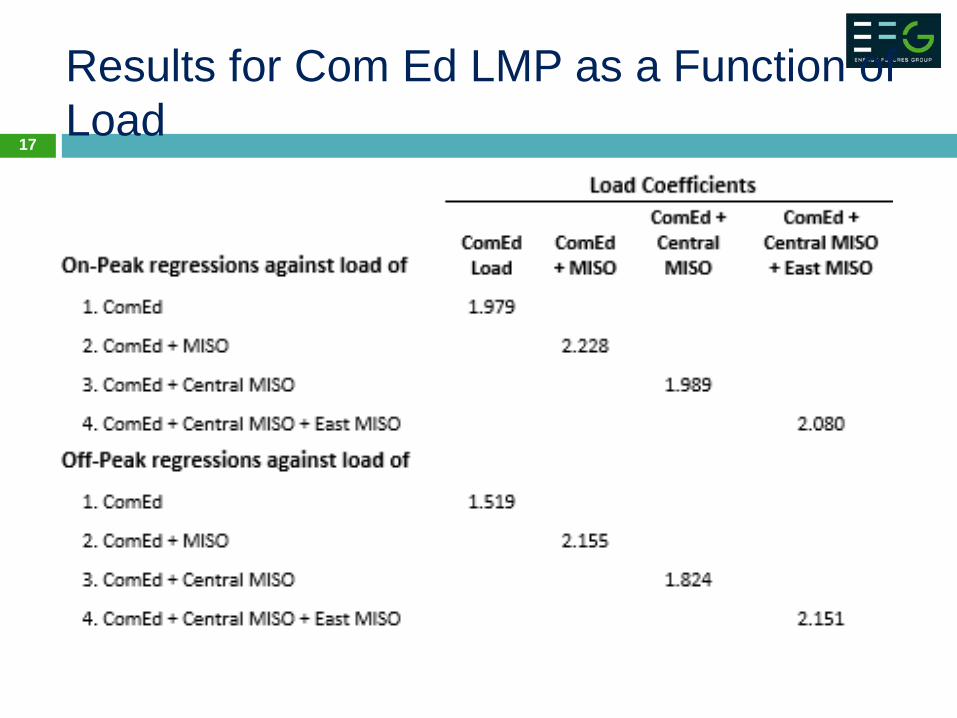
Results for Com Ed LMP as a Function of Load
17

Results for MISO IL LMP as a Function of Load
18

Full IL Legislative Language on TRC 19
TRC test “compares the sum of avoided electric utility costs, representing the benefits that accrue to the system and the participant in the delivery of those efficiency measures, as well as other quantifiable societal benefits, including avoided natural gas utility costs, to the sum of all incremental costs of end-use measures that are implemented due to the program (including both utility and participant contributions), plus costs to administer, deliver, and evaluate each demand-side program, to quantify the net savings obtained by substituting the demand-side program for supply resources. In calculating avoided costs of power and energy that an electric utility would otherwise have had to acquire, reasonable estimates shall be included of financial costs likely to be imposed by future regulations and legislation on emissions of greenhouse gases.”(emphasis added)