
Electric Energy Systems Curriculumpeople.ece.umn.edu/groups/power/summer_workshops/... ·...
56
Electric Energy Systems Curriculum Curriculum With Emphasis on - Renewables Renewables - Smart Delivery - Efficient End-Use ONR-NSF Workshop Minneapolis MN June 7-12 2010 © UMN 2010 1 Minneapolis, MN June 7 12, 2010
Transcript of Electric Energy Systems Curriculumpeople.ece.umn.edu/groups/power/summer_workshops/... ·...

Electric Energy Systems CurriculumCurriculum
With Emphasis on - RenewablesRenewables- Smart Delivery- Efficient End-Use
ONR-NSF WorkshopMinneapolis MN June 7-12 2010
© UMN 2010 1
Minneapolis, MN June 7 12, 2010

Electric EnergyElectric Energy
El t i P S t Th Bi Pi t• Electric Power Sector – The Big Picture– Crisis– Opportunities
• Curricular Reform
© UMN 2010 2

‘We Need Energy Miracles’(Bill Gates: TED Speech 2010)
© UMN 2010 3Source: www.huffingtonpost.com

Financial CostP d ti dP d ti d
700 B$/yrProduction and
Consumption 700 B$/yrProduction and
Consumption
© UMN 2010 4

Electric Power
Source: DOESource: DOE
© UMN 2010 5

Electric Power Generation by Fuel Type:Type:
© UMN 2010 6

Electricity from RenewablesElectricity from Renewables
Wi d• Wind– On-land– Offshore
• Solar– Concentrated Solar Power (CSP)– Photovoltaic (PV)( )
• Wave
© UMN 2010 7

WINDWIND
Th t I t t C it iThree most Important Criteria• Location• Location• LocationLocation
© UMN 2010 8

Wind in the U SWind in the U.S.
© UMN 2010 9

U.S. Wind Energy Projects gy j(as of 12/31/2009)
© UMN 2010 10Source: www.awea.org

Trip to a Wind Farm – 11:30 June 10th
© UMN 2010 11

Turbines Are Getting Bigger . . g gg
1981 1985 1990 1996 1999 2000 2005 2008rotor diameter (in meters) 10 17 27 40 50 71 104 120rated capacity (in kilowatts) 25 100 225 550 750 1,650 3,600 5,000
© UMN 2010 12

How big is a 2.3 MW Wind Turbine?
B i 74759.6
8093 m.
60 m
• Boeing 747– 60 m diameter
• Siemens 2.3 MW turbine – 93 m diameter
© UMN 2010 13

Siemens blades, Port of Duluth, 2006 August
© UMN 2010 14

© UMN 2010 15

Reduced Cost Driving Wind’s Success
$0.30
$0.4038 cents/kWh
$0.10
$0.20
4 /k h$0.00
1980 1984 1988 1991 1995 2000 2005
4 - 7 cents/kWh
Levelized cost at good wind sites in nominal dollars, including tax credit
© UMN 2010 16

20% Wind by 203020% Wind by 2030
350 GW f i d t b• 350 GW of wind power must be installed
• 35 GW of total wind power installed todaytoday
• Investment required -- $1 Trillion
© UMN 2010 17

© UMN 2010 18

Wind Energy EssentialsCollege of Science & Engineering, University of g g g, y
Minnesota(EE 5940 - Fall 2010)
1 d i ( i S i l C d h C )1. Introduction (Fotis Sotiropoulos - CE, Ned Mohan - ECE)2. New Challenges in a High Penetration of Wind Power (Ed Muljadi, Senior Engineer,
National Wind Technology Center, NREL) 3. Gears/Transmission (Kim Stelson - ME)( )4. Blade Aerodynamics and Acoustics (Fotis Sotiropoulos, Roger Arndt - CE) 5. Foundation Design (Chris Kopchynski, Jennifer Entwistle, Barr Engineering) 6. Controls (Mihailo Jovanovic - ECE, Gary Balas - AEM) 7 Electric Generation and Power Electronics (Ned Mohan ECE)7. Electric Generation and Power Electronics (Ned Mohan - ECE)8. Materials and Structural Reliability (Sue Mantell - ME, Henryk Stolarski - CE) 9. Wind Assessment and Wind Forecasting (Mark Ahlstrom, CEO, WindLogics Inc.) 10. Grid Integration (Matt Schuerger, Energy Systems Consulting Services) 11 Wi d F D l S i i A (J k L i C F d d C11. Wind Farm Development, Socio-economic Aspects (Jack Levi – Co-Founder and Co-
Chairman, National Wind LCC.) 12. Environmental Considerations – Radar Interference (Mos Kaveh – ECE, others TBD)
© UMN 2010 19

Offshore WindDOE estimates offshore
resources to be 900,000 MW.
© UMN 2010 20

Solar
Source: www.esolar.com
Solar is today where wind was 5-8 years ago.
© UMN 2010 21
Solar is today where wind was 5 8 years ago.
Wave Energy• It is estimated that if 0 2% of the ocean’s untapped• It is estimated that if 0.2% of the ocean’s untapped
energy could be harnessed, it could provide power sufficient for the entire world.
Tid l– Tidal– Current– Temperature gradient (OTEC and SWAC)– Salinity– Wave
• Compared to other renewables, wave energy has advantages: –Higher availability–More predictable and forecastable: up to 10 hours forecast time–Low viewshed impact
• At present, wave energy is estimated at 20-30 cents per kwh. Coal and wind are 4 to 9 cents per kwh.
• Wave energy is about 20-30 years behind wind, but it is predicted th t t h i kl
© UMN 2010 22
that wave energy can catch up quickly.

S O
© UMN 2010 23
Source: DOE

NuclearNuclear
© UMN 2010 24

StorageStorage
© UMN 2010 25

Storage OptionsStorage Options
• Compressed Air• Compressed Air• Fuel Cells
Fl h l• Flywheels• Superconducting Magnetic• Ultra-Capacitors• Batteries
– Lead Acid, Li-ion, NiMH, Flow, Sodium Sulfur
© UMN 2010 26

Sodium Sulfur Battery Energy Storage and its Potential to Enable Further Integration of Wind
Project Description• 1 MW NaS Battery System• 1 MW NaS Battery System• Can deliver 1 MW for 7 hrs• Power Conditioning Equipment• 175 kW backup power 5 bac up po e• Wind farm/grid interconnection• Local and remote data and
communication equipment• Two Phases of Study• Understand how system could
optimize wind farm economies• Understand how system could• Understand how system could
optimize utility integration of wind resources
© UMN 2010 27

Efficient End-UseEfficient End UseFixed form
Power ProcessingUnit (PPU)
Motor Load
d /
Electric Drive
Lighting 19%Lighting 19%Lighting 19%
Electric Source(utility)
PowerSignal
Controller
Sensor
Adjustable Form
Input command
speed / position
Motors 51%HVAC 16%
IT 14%
Motors 51%HVAC 16%
IT 14%
Motors 51%HVAC 16%
IT 14%
Figure 1-3 Block diagram of an electric drive system.
p(speed / position) Motors 51%HVAC 16% Motors 51%HVAC 16% Motors 51%HVAC 16%
Adjustable Speed Drives
EV
© UMN 2010 28

The American Recovery and Reinvestment Act of 2009
© UMN 2010 29

Renewable Portfolio Standards
© UMN 2010 30

California RPSCalifornia RPS
© UMN 2010 31

Curricular ReformCurricular Reform
© UMN 2010 32

Group Effort:• Ned Mohan • Bill Robbins• Bill Robbins• Bruce Wollenberg• Paul Imbertson• Tom Posbergh• Dr. Narain G. Hingorani (Project Consultant)• Students• Students
www.ece.umn.edu/groups/power
© UMN 2010 33

Past Sponsors:Past Sponsors:Lab Development Grants:
NSF CCLI-EMDNASAONR
Initial Dissemination Grant: NSF CCLI-ND
© UMN 2010 34

Present ONR Dissemination Grant:Program Officer: Terry Ericsen
(1.23 Million Dollars over 5 years)( y )Supported by NSF
© UMN 2010 35

DARPA-RA-10-3DARPA RA 10 3
© UMN 2010 36

Outline: Problem
Approach and Results Approach and Results Available Resources Dissemination Goals Brief Description of the
Courses
© UMN 2010 37

Workforce Crisis: Serious shortfalls predictedp NSF-Sponsored Workshop in
Arlington, Virginia Nov, 2008BPA W kfBPA Workforce:
2,944 employeesMedian age is 5021% eligible to retire by 12/0742% eligible to retire by 12/11
BPA Employee Age (as of 3/9/06)
60
80
100
120
140
160
mbe
r of E
mpl
oyee
sData Source: HRMIS as of 2/9/06
0
20
40
22 23 24 25 26 2 7 2 8 2 9 3 0 31 3 2 3 3 3 4 3 5 36 3 7 3 8 3 9 4 0 41 4 2 4 3 4 4 4 5 4 6 4 7 4 8 4 9 5 0 5 1 5 2 5 3 5 4 5 5 5 6 57 5 8 5 9 6 0 6 1 62 6 3 6 4 6 5 6 6 67 >67
AgeN
umSource: HRM IS Date Accessed : 3/23/06
Source: Clark Gellings EPRI
© UMN 2010 38
Source: Clark Gellings, EPRI

Crisis in Undergraduate Education in Power EngineeringPower Engineering Courses have not kept pace with
I d t i l P tiIndustrial Practices
© UMN 2010 39

We can all agree….We can all agree….• Goal: Increase Quality and Quantity• Faculty Resources are Limited
© UMN 2010 40

Young People are Concerned about the Environment -Environment -
We can tap into their enthusiasm to make a difference andenthusiasm to make a difference and provide them a career path.
© UMN 2010 41
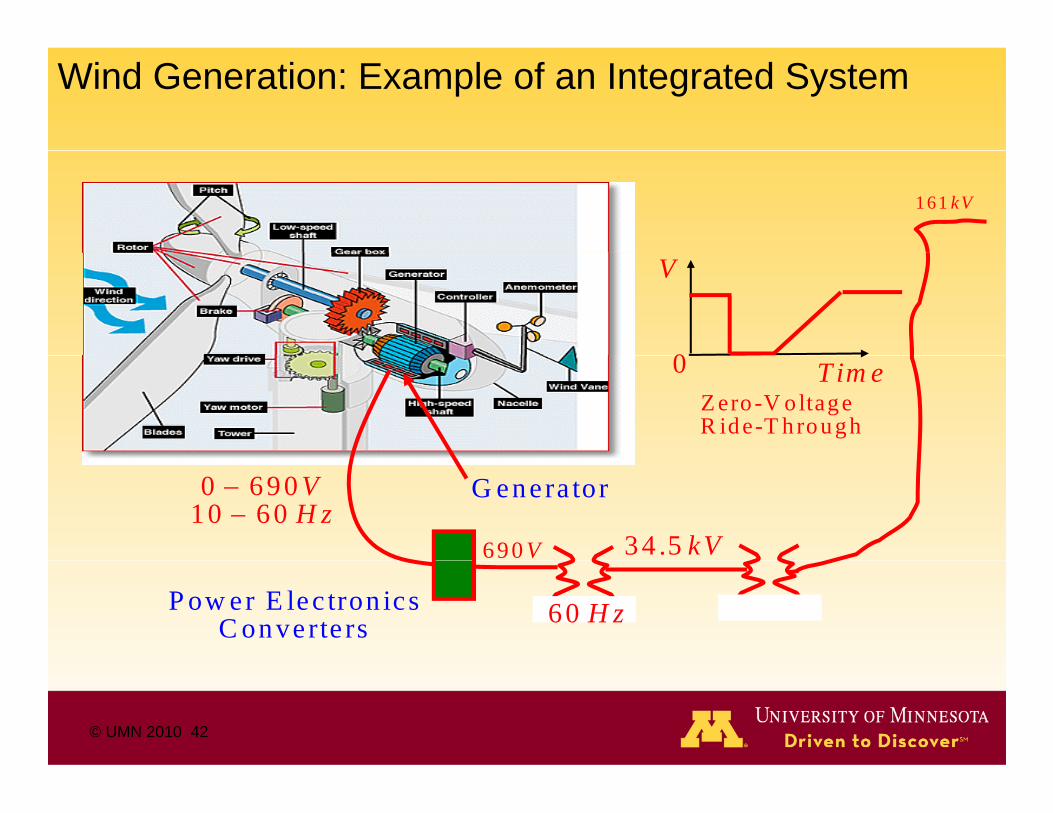
Wind Generation: Example of an Integrated System
161 kV
V
0 T im e0Z ero -V o ltageR id e-T h ro u g h
0 69010 60
VH z
34 .5 kV
G enera tor
690 V
P ow er E lec tron icsC onverte rs 60 H z
© UMN 2010 42

Our Integrated Curriculum –Only 3 Courses
Complementary Courses:Analog/Digital Control
Only 3 Courses
- Analog/Digital Control- DSPs, FPGAs- Programming
LanguagesPower Electric Power Electric Languages- Heat Transfer- ThermoCore
Courses
Electronics DrivesCore
Courses
Electronics Drives
Courses
Power
Courses
PowerPower Systems
Power Systems Students are Broadly Trained;
They can work in any field of EE.
© UMN 2010 43

Increasing Student Enrollments –2008-2009 Enrollment:Power Systems: 90Power Electronics: 118Power Electronics: 118Electric Drives: 124
Fundamentals-based Education Leads toFundamentals-based Education Leads to Graduate Education and PhD Research
© UMN 2010 44

© UMN 2010 45

Resources:El t i Power Power Electronics: Electric Drives:
Power Systems:
SoftwareL bLab:M A T LA B /S im ulinkP ow erW orldP S C A D E M T D CPSpice P S C A D -E M T D CPSpice
Lab:
© UMN 2010 46

ONR/NSF-Sponsored Faculty Workshops
2011 Annual WorkshopNapa, CA Feb 4-5, 2011
© UMN 2010 47

Weeklong Summer Training Workshops: (sponsored by ONR-NSF-EPRI-AEP)Oregon State University
July 4 6 2010July 4-6, 2010
In collaboration with Prof. T d B kk f OSUTed Brekken of OSU
© UMN 2010 48

Goal of ONR/NSF Grants Supported by EPRI & AEP:Supported by EPRI & AEP:Affect Curricular Change in atAffect Curricular Change in at least 175 Schools Nationwide
Ad t d f i i– Adapted so far in various combinations at > 100 schools
P ll l I t ti l Eff tParallel International Effort
© UMN 2010 49

Online Courses• Power Electronics• Electric Machines/Drives• Electric Machines/Drives• Power Systems Modular Tightly-Coupled to our Textbooks CEUs/PDH Low Cost: $70/Module
Use of Online Courses:• Certificates for Practicing Engineers• at other Universities (ABET: 432)
© UMN 2010 50

Center for Innovation – Electric Energy Systems(CI EESE)(CI-EESE)
Midwest ISONew York ISOISO - New EnglandAir Force Research LabHamilton SundstrandUlteig EngineersUMCEE Members
Benefit to Members: Courses are free to all their employees
Membership Fee: 10,000 $/year
© UMN 2010 51

Pedagogy-• Motivation:
Students are actively engaged– Students are actively engaged• Procedure:
– Pre-class: watch a 20-minute module and answer a brief online quizD i l di d l l– During-class: discuss and solve real-world, design-oriented, somewhat open-ended problems in small groupsended problems in small groups
– Post-class: homework problems on individual basis; based on Moodle
© UMN 2010 52
individual basis; based on Moodle

Animations by Prof. Riaz:
http://www.ece.umn.edu/users/riaz/animations/sqmoviemotgen.html
© UMN 2010 53

Instructor’s CD
© UMN 2010 54

Power Systems Lab:Lab Manual - Experiments CD with 18 Video Clips
1. Visit to a Local Substation/Generating Plant
2. Familiarization with PSCAD/EMTDC
3. Obtaining Parameters of a 345 kV Transmission Line and Modeling it in PSCAD/EMTDC http://www.ece.umn.edu/groups/power/labs/ps/video instructions.html
4. Power Flow using MATLAB and PowerWorld
5. Including Transformers in Power Flow using PowerWorld and Confirmation by MATLAB
6. Including an HVDC Transmission Line for Power Fl C l l ti i P W ld d M d li f
1. Installation of PowerWorld and PSCAD-EMTDC 2. Familiarization with using PSCAD-EMTDC 3. Obtaining Parameters of Transmission Line using PSCAD/EMTDC 4. Simulating a Transmission Line in a Power System using PSCAD/EMTDC 5. Power Flow using PowerWorld 6. Power Flow using MATLAB
p g p p p _
Flow Calculations in PowerWorld and Modeling of Thyristor Converters in PSCAD/EMTDC
7. Power Quality
8. Synchronous Generators
9 V lt R l ti
6. Power Flow using MATLAB7. Including Off-Nominal Turns-Ratio and Phase-Shifting Transformers in
Power Flow using PowerWorld 8. Including an HVDC Transmission Line for Power Flow in PowerWorld 9. Modeling of Thyristor Converters in PSCAD-EMTDC 10. Power Quality Calculations using PSCAD-EMTDC 11. Modeling of Synchronous Generators using PSCAD-EMTDC
9. Voltage Regulation
10. Transient Stability using MATLAB
11. AGC using Simulink and Economic Dispatch using PowerWorld
12. Voltage Regulation by Thyristor Controlled Reactors (TCR) using EMTDC13. Thyristor Controlled Series Capacitors (TCSC) using PSCAD-EMTDC 14. Transient Stability using MATLAB 15. AGC using Simulink 16. Transmission Line Short Circuit Faults using PowerWorld 17. Tripping of Transmission Lines due to Overloads using PowerWorld 18 S it hi O V lt d M d li f S A t i EMTDC12. Transmission Line Short Circuit Faults using
MATLAB and PowerWorld, and Overloading of Transmission Lines using PowerWorld
13. Switching Over-Voltages and Modeling of Surge Arresters using PSCAD/EMTDC
18. Switching Over-Voltages and Modeling of Surge Arresters using EMTDC
MATLAB/SimulinkPowerWorld
Software:
© UMN 2010 55
PSCAD-EMTDC

DOE Proposal Accepted: “A Nationwide Consortium of Universities toA Nationwide Consortium of Universities to
Revitalize Electric Power Engineering”
82 Universities
“These 82 schools represented about 25% of all the graduates i l t i l i i i 2008 ” Willi P R bbi© UMN 2010 56
in electrical engineering in 2008.” – William P. Robbins


