Elanco Animal Health Reports Strong 2018 Fourth Quarter ... · • Experior: Received U.S. approval...
15
1 FOR IMMEDIATE RELEASE Investor Contact: Jim Greffet (317) 383-9935 or [email protected] Media Contact: Colleen Parr Dekker (317) 989-7011 or [email protected] Elanco Animal Health Reports Strong 2018 Fourth Quarter and Full Year Results, Confirms 2019 Guidance Full year global revenue increased 6 percent to $3.1 billion, Interceptor ® Plus reaches blockbuster status with more than $100 million in annual sales • Fourth quarter and full year revenue both grew 6 percent to $799.3 million and $3.1 billion, respectively. • Core Revenue, which excludes strategic exits, grew 6 percent to $774.7 million in Q4; or 9 percent without the impact of foreign currency exchange rates. • Full year reported earnings per share (EPS) increased by $1.34 to $0.28 compared to a loss of $1.06 per share in 2017; Adjusted EPS increased 71 percent to $1.18. • Launched Credelio for cats in Europe and gained U.S. approval of Experior for the reduction of ammonia gas emission in cattle. • Completed the sale of a manufacturing facility in Cali, Colombia and announced a program to streamline international operations, continuing progress on Elanco’s productivity agenda. • Confirm expected 2019 revenue to be between $3.10 billion and $3.16 billion. Reported EPS for 2019 is expected in the range of $0.36 to $0.48 and Adjusted EPS of $1.02 to $1.12. GREENFIELD, Ind, February 6, 2019 - Elanco Animal Health Incorporated (NYSE: ELAN), today reported global revenue for full year 2018 increased 6 percent to $3.1 billion. For the fourth quarter of 2018, global revenue also grew 6 percent to $799.3 million. The results reflect strong volume growth and the execution of the company’s targeted, three-pillar strategy focused on Portfolio, Innovation and Productivity. The results also reflect strong full year
Transcript of Elanco Animal Health Reports Strong 2018 Fourth Quarter ... · • Experior: Received U.S. approval...

1
FOR IMMEDIATE RELEASE
Investor Contact: Jim Greffet (317) 383-9935 or [email protected]
Media Contact: Colleen Parr Dekker (317) 989-7011 or [email protected]
Elanco Animal Health Reports Strong 2018 Fourth Quarter and Full Year Results,
Confirms 2019 Guidance
Full year global revenue increased 6 percent to $3.1 billion, Interceptor® Plus reaches
blockbuster status with more than $100 million in annual sales
• Fourth quarter and full year revenue both grew 6 percent to $799.3 million and $3.1 billion,
respectively.
• Core Revenue, which excludes strategic exits, grew 6 percent to $774.7 million in Q4; or 9 percent
without the impact of foreign currency exchange rates.
• Full year reported earnings per share (EPS) increased by $1.34 to $0.28 compared to a loss of $1.06
per share in 2017; Adjusted EPS increased 71 percent to $1.18.
• Launched Credelio for cats in Europe and gained U.S. approval of Experior for the reduction of
ammonia gas emission in cattle.
• Completed the sale of a manufacturing facility in Cali, Colombia and announced a program to
streamline international operations, continuing progress on Elanco’s productivity agenda.
• Confirm expected 2019 revenue to be between $3.10 billion and $3.16 billion. Reported EPS for 2019
is expected in the range of $0.36 to $0.48 and Adjusted EPS of $1.02 to $1.12.
GREENFIELD, Ind, February 6, 2019 - Elanco Animal Health Incorporated (NYSE: ELAN), today reported global
revenue for full year 2018 increased 6 percent to $3.1 billion. For the fourth quarter of 2018, global revenue also grew
6 percent to $799.3 million. The results reflect strong volume growth and the execution of the company’s targeted,
three-pillar strategy focused on Portfolio, Innovation and Productivity. The results also reflect strong full year

2
performance in its three targeted growth categories: Companion Animal Disease Prevention, Companion Animal
Therapeutics and Food Animal Future Protein & Health.
“Our solid results for the full year demonstrate that our strategy is on track, we’re executing efficiently and making
strong progress against our strategy to deliver the results we promised to our customers, investors and employees,”
said Jeff Simmons, president and chief executive officer of Elanco. “Overall, the animal health market continues to
display strong fundamentals that will drive growth going forward. We are well positioned to capitalize on these industry
growth drivers and are optimistic about our ability to continue to drive top and bottom line growth with the momentum
we are carrying into 2019.”
Fourth Quarter Key Events:
Innovation
• Our portfolio of innovation launched since 2015 accounted for $69.8 million in revenue, up $29.7 million or
74 percent over the same quarter last year.
• Experior: Received U.S. approval for Experior, a first-of-its-kind product for the reduction of ammonia gas
emission in cattle. This approval marked Elanco’s fourth consecutive year since 2015 of securing three key
new product approvals.
• Imvixa: Met with the Norwegian Medicines Agency and have agreed on the path forward for submission of
Imvixa, a novel treatment for sea lice in salmon.
• Credelio: Launched Credelio, our innovative oral flea and tick treatment for cats in Europe.
Portfolio
• As a group, the targeted growth categories in Elanco's portfolio - Companion Animal Disease Prevention,
Companion Animal Therapeutics and Food Animal Future Protein & Health grew 20 percent on a constant
currency basis, representing 60 percent of Elanco's total business.
• Interceptor Plus reached blockbuster status, exceeding $100 million in annual sales for the first time.
Productivity
• Completed the sale of the Cali, Colombia manufacturing facility in December 2018.
• Announced a restructuring program that will replace physical presence in 16 countries with other go-to
market models, as well as streamline and delayer international operations.
• For the full year 2018, Elanco:.
◦ Reduced operating expenses by 5%
◦ Exited four manufacturing facilities;

3
◦ Reduced 18 contract manufacturing organizations (CMOs), finishing the year with 100 CMOs;
◦ Rationalized 15 percent of low-volume, low-margin stock keeping units (SKUs).
Fourth Quarter Reported Results:
In the fourth quarter of 2018, global revenue was $799.3 million, an increase of 6 percent compared to the fourth
quarter of 2017. Revenue, excluding strategic exits, increased 6 percent to $774.7 million. Gross margin, as a percent
of revenue, increased 200 basis points to 48 percent. Tax expense was a benefit of $18.6 million in the fourth quarter
of 2018. Net income for the fourth quarter increased $177.9 million to $16.4 million, or $0.04 per basic share.
Companion Animal Disease Prevention revenue increased 43 percent for the quarter, primarily driven by volume
and increased price partially offset by an unfavorable impact from foreign exchange. Revenue growth improved in
comparison to prior year due to a reduction in channel inventory in the fourth quarter of 2017. Growth was also driven
by continued uptake in demand for Interceptor Plus and Credelio, and increased sales of certain vaccines from new
customer agreements. Parastar® contributed unique growth in the quarter as we entered into a one-time agreement
to sell all remaining inventory.
Companion Animal Therapeutics revenue decreased 6 percent for the quarter, driven by decreased volume and
an unfavorable impact from foreign exchange, partially offset by increased price. The revenue decrease was impacted
by both timing and availability of Galliprant® shipments. A planned shipment in late 2018 was delayed until early 2019
to appropriately complete the quality release process. In addition, market demand for Galliprant continues to grow,
exceeding supply capacity and resulting in Galliprant backorders at the end of the year. Elanco is working diligently
to expand production and expects to clear remaining backorders by late first quarter or early second quarter 2019.
Food Animal Future Protein & Health revenue increased 8 percent for the quarter, driven by both volume and
increased price, partially offset by an unfavorable impact from foreign exchange. Growth was driven by poultry animal-
only antibiotics and vaccines, as well as aqua products.
Food Animal Ruminants & Swine revenue decreased 8 percent for the quarter, driven by price, volume and an
unfavorable impact from foreign exchange. The revenue decline was driven by softness in swine antibiotics,
particularly in Asia, and a stock-outage of Micotil®, an injectable treatment for Bovine Respiratory Disease, now
resolved.
Strategic Exits are businesses Elanco has exited or has made the decision to exit. Revenue from Strategic Exits
decreased 6 percent for the quarter, and now represents 3 percent of total revenue.
Gross profit increased 11 percent, to $386.8 million, in the fourth quarter of 2018 compared with the fourth quarter of
2017. Gross margin, as a percent of revenue, was 48 percent, an increase of 200 basis points period over period.
The gross margin increase was primarily due to favorable product mix and non-recurring costs in 2017 associated

4
with the unwinding of purchase accounting inventory adjustments, partially offset by 200 basis points of unfavorable
impact from foreign exchange rates.
Research and development expenses decreased 1 percent, to $61.1 million, or 8 percent of revenue. This decrease
was primarily driven by timing of certain projects within the year. Marketing, selling and administrative expenses
decreased 6 percent, to $185.1 million, primarily driven by continued productivity initiatives, cost control measures
across the business, and timing of marketing investments.
Amortization of intangibles decreased 17 percent to $50.1 million primarily driven by the acceleration of amortization
related to certain product exits and rationalization in 2017.
Asset impairments, restructuring, and other special charges decreased $139.8 million to $46.0 million primarily due
to elevated severance and terminations cost incurred in 2017 associated with the U.S. voluntary early retirement
program offered by Lilly and asset impairment charges in 2017 related to acquired IPR&D assets.
Net interest expense was $21.0 million in the fourth quarter of 2018; no net interest expense was incurred in the
previous year. Other-net, (income) expense was expense of $25.7 million in the fourth quarter of 2018, compared
with income of $0.1 million in the fourth quarter of 2017. The increase in expense was primarily driven by an increase
in the Aratana contingent consideration associated with Galliprant.
Full Year Reported Results
For the full-year 2018, global revenue increased 6 percent, to $3.1 billion, compared with $2.9 billion for the full-year
2017. Reported net income and earnings per share were $86.5 million and $0.28, respectively.
Fourth Quarter Consolidated non-GAAP Results:
Adjusted net income for the fourth quarter increased 148 percent to $105.4 million, which excludes the net impact of
$128.0 million of asset impairments, restructuring and other special charges, the amortization of intangible assets,
and adjustments related to contingent consideration for Aratana, net of the impact from taxes. Adjusted EPS for the
quarter was $0.29 per diluted share. Adjusted EBITDA margin was 21 percent, an increase of 400 basis points
primarily driven by increased gross margin and a reduction in operating expenses.
For further detail of non-GAAP measures, see the Reconciliation of GAAP Reported to Selected Non-GAAP Adjusted
Information table later in this press release.
Full Year Non-GAAP Measures
For the full-year 2018, net income and earnings per share, on an Adjusted non-GAAP basis, were $431.8 million and
$1.18 per diluted share, respectively.
For further detail of non-GAAP measures, see the Reconciliation of GAAP Reported to Selected Non-GAAP Adjusted
Information table later in this press release.

5
FINANCIAL GUIDANCE
Elanco confirms guidance on earnings expectations for the full year 2019, which includes:
Full Year
2019 Guidance
(dollars in billions, except per share
amounts)
Core Revenue $ 3.04 to $ 3.10
Strategic Exits $0.06
Total Revenue $ 3.10 to $ 3.16
GAAP EPS $ 0.36 to $ 0.48
Amortization of intangible assets $0.53
Expenses associated with establishing stand-alone capabilities $0.28 to $0.26
Subtotal $ 1.17 to $ 1.27
Tax impact of adjustments (0.15)
Adjusted EPS $ 1.02 to $ 1.12
“Moving into 2019, we have a compelling value proposition, supported by our financial expectations for the year. The
combination of our revenue growth, the positive impact of our ongoing productivity agenda and the consistent flow of
innovation we’ve created will continue to result in our ability to deliver consistent value to shareholders,” said
Simmons.
WEBCAST & CONFERENCE CALL DETAILS
Elanco will host a webcast and conference call at 8:00 a.m. eastern today, during which company executives will
review fourth quarter and full year financial and operational results, confirm 2019 financial guidance, and respond to
questions from financial analysts. Investors, analysts, members of the media and the public may access the live
webcast and accompanying slides by visiting the Elanco website at https://investor.elanco.com and selecting Events
and Presentations. A replay of the webcast will be archived and made available a few hours after the event on the
company's website, at https://investor.elanco.com/investor/events-and-presentations.
ABOUT ELANCO
Elanco (NYSE: ELAN) is a global animal health company that develops products and knowledge services to prevent
and treat disease in food animals and pets in more than 90 countries. With a 64-year heritage, we rigorously innovate
to improve the health of animals and benefit our customers, while fostering an inclusive, cause-driven culture for more
than 5,800 employees. At Elanco, we’re driven by our vision of food and companionship enriching life - all to advance
the health of animals, people and the planet. Learn more at www.elanco.com.
Cautionary Statement Regarding Forward-Looking Statements
This press release includes forward-looking statements within the meaning of Section 27A of the Securities Act of
1933 and Section 21E of the Securities Exchange Act of 1934 (Exchange Act). This press release contains forward-
looking statements, including, without limitation, statements concerning our 2019 guidance, our industry and our

6
operations, performance and financial condition, including in particular, statements relating to our business, growth
strategies, product development efforts and future expenses.
Forward-looking statements are based on our current expectations and assumptions regarding our business, the
economy and other future conditions. Because forward-looking statements relate to the future, by their nature, they
are subject to inherent uncertainties, risks and changes in circumstances that are difficult to predict. As a result, our
actual results may differ materially from those contemplated by the forward-looking statements. Important factors that
could cause actual results to differ materially from those in the forward-looking statements include regional, national,
or global political, economic, business, competitive, market, and regulatory conditions including, but not limited to the
following:
• heightened competition, including from new innovation or generics;
• the impact of disruptive innovations and advances in veterinary medical practices, animal health
technologies and alternatives to animal-derived protein;
• changes in regulatory restrictions on the use of antibiotics in food animals, as well as changing market
demand regarding the use of antibiotics and productivity products;
• our ability to implement our business strategies or achieve targeted cost efficiencies and gross margin
improvements;
• consolidation of our customers and distributors;
• the success of our R&D and licensing efforts;
• our ability to successfully acquire target companies and integrate them into our existing operations;
• unanticipated safety, quality or efficacy concerns associated with our products;
• the impact of weather conditions and the availability of natural resources;
• changes in U.S. foreign trade policy, imposition of tariffs or trade disputes;
• the impact of global macroeconomic conditions; and
• the effect of the transactions involving the separation of our business from that of Lilly and distribution of
Lilly's interest in us to its shareholders, if consummated, on our business.
See "Risk Factors" in our prospectus relating to our initial public offering filed on September 21, 2018 with the
Securities and Exchange Commission for a further description of these and other factors. Although we have attempted
to identify important risk factors, there may be other risk factors not presently known to us or that we presently believe
are not material that could cause actual results and developments to differ materially from those made in or suggested
by the forward-looking statements contained in this quarterly report. If any of these risks materialize, or if any of the
above assumptions underlying forward-looking statements prove incorrect, actual results and developments may

7
differ materially from those made in or suggested by the forward-looking statements contained in this quarterly report.
For the reasons described above, we caution you against relying on any forward-looking statements, which should
also be read in conjunction with the other cautionary statements that are included elsewhere in this press release.
Any forward-looking statement made by us in this press release speaks only as of the date thereof. Factors or events
that could cause our actual results to differ may emerge from time to time, and it is not possible for us to predict all of
them. We undertake no obligation to publicly update or to revise any forward-looking statement, whether as a result
of new information, future developments or otherwise, except as may be required by law. Comparisons of results for
current and any prior periods are not intended to express any future trends or indications of future performance,
unless specifically expressed as such, and should be viewed as historical data.
Use of Non-GAAP Financial Measures:
We use non-GAAP financial measures, such as revenues excluding strategic exits, EBITDA, EBITDA margin,
adjusted EBITDA, adjusted EBITDA margin, adjusted net (income) loss, adjusted EPS, adjusted gross profit and
adjusted gross margin to assess and analyze our operational results and trends as explained in more detail in the
reconciliation tables later in this release.
We believe these non-GAAP financial measures are also useful to investors because they provide greater
transparency regarding our operating performance. Reconciliation of non-GAAP financial measures and reported
GAAP financial measures are included in the tables accompanying this press release and are posted on our website
at www.elanco.com. The primary material limitations associated with the use of such non-GAAP measures as
compared to U.S. GAAP results include the following: (i) they may not be comparable to similarly titled measures
used by other companies, including those in our industry, (ii) they exclude financial information and events, such as
the effects of an acquisition or amortization of intangible assets, that some may consider important in evaluating our
performance, value or prospects for the future, (iii) they exclude items or types of items that may continue to occur
from period to period in the future and (iv) they may not exclude all unusual or non-recurring items, which could
increase or decrease these measures, which investors may consider to be unrelated to our long-term operations,
such as Strategic Exits. These non-GAAP measures are not, and should not be viewed as, substitutes for U.S. GAAP
reported measures. We encourage investors to review our unaudited condensed consolidated and combined
financial statements in their entirety and caution investors to use U.S. GAAP measures as the primary means of
evaluating our performance, value and prospects for the future, and non-GAAP measures as supplemental measures.
Availability of Certain Information
We use our website to disclose important company information to investors, customers, employees and others
interested in the Elanco. We encourage investors to consult our website regularly for important information about
Elanco.
8
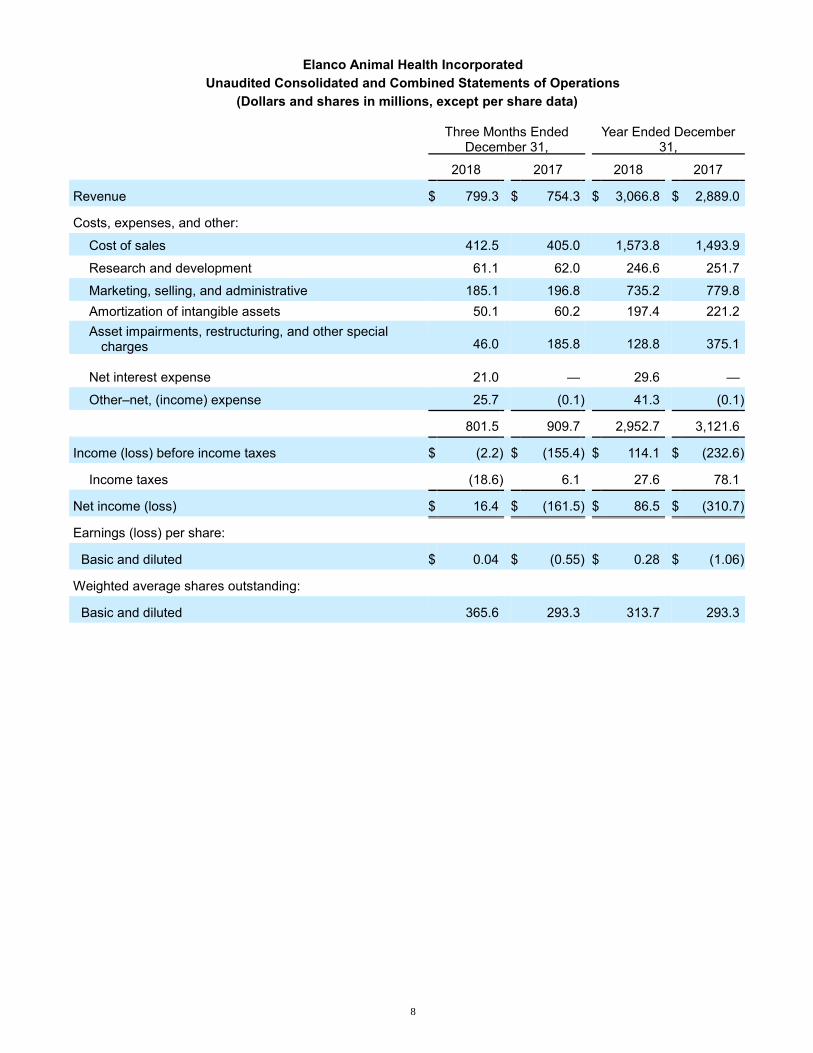
Elanco Animal Health Incorporated
Unaudited Consolidated and Combined Statements of Operations
(Dollars and shares in millions, except per share data)
Three Months Ended
December 31, Year Ended December
31,
2018 2017 2018 2017
Revenue $ 799.3
$ 754.3
$ 3,066.8
$ 2,889.0
Costs, expenses, and other:
Cost of sales 412.5 405.0 1,573.8 1,493.9
Research and development 61.1 62.0 246.6 251.7
Marketing, selling, and administrative 185.1 196.8 735.2 779.8
Amortization of intangible assets 50.1 60.2 197.4 221.2
Asset impairments, restructuring, and other special charges 46.0
185.8
128.8
375.1
Net interest expense 21.0
—
29.6
—
Other–net, (income) expense 25.7 (0.1 ) 41.3 (0.1 )
801.5 909.7
2,952.7
3,121.6
Income (loss) before income taxes $ (2.2 ) $ (155.4 ) $ 114.1 $ (232.6 )
Income taxes (18.6 ) 6.1 27.6
78.1
Net income (loss) $ 16.4 $ (161.5 ) $ 86.5
$ (310.7 )
Earnings (loss) per share:
Basic and diluted $ 0.04 $ (0.55 ) $ 0.28
$ (1.06 )
Weighted average shares outstanding:
Basic and diluted 365.6 293.3
313.7
293.3
9
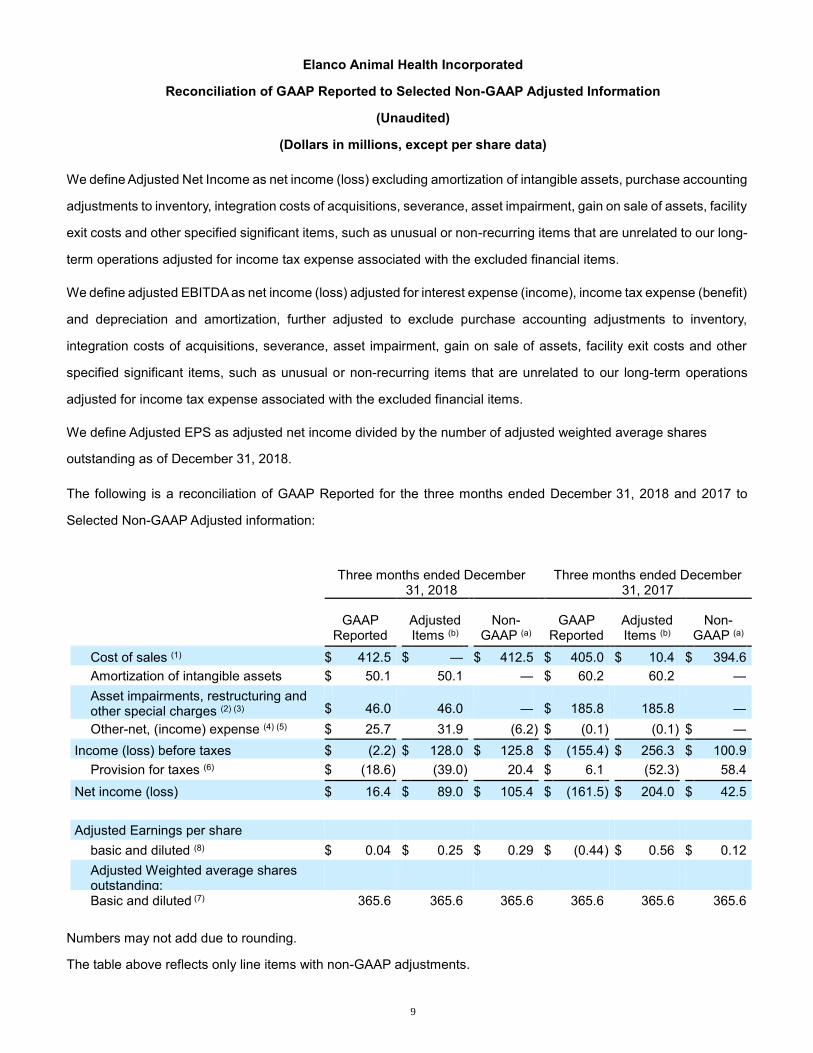
Elanco Animal Health Incorporated
Reconciliation of GAAP Reported to Selected Non-GAAP Adjusted Information
(Unaudited)
(Dollars in millions, except per share data)
We define Adjusted Net Income as net income (loss) excluding amortization of intangible assets, purchase accounting
adjustments to inventory, integration costs of acquisitions, severance, asset impairment, gain on sale of assets, facility
exit costs and other specified significant items, such as unusual or non-recurring items that are unrelated to our long-
term operations adjusted for income tax expense associated with the excluded financial items.
We define adjusted EBITDA as net income (loss) adjusted for interest expense (income), income tax expense (benefit)
and depreciation and amortization, further adjusted to exclude purchase accounting adjustments to inventory,
integration costs of acquisitions, severance, asset impairment, gain on sale of assets, facility exit costs and other
specified significant items, such as unusual or non-recurring items that are unrelated to our long-term operations
adjusted for income tax expense associated with the excluded financial items.
We define Adjusted EPS as adjusted net income divided by the number of adjusted weighted average shares
outstanding as of December 31, 2018.
The following is a reconciliation of GAAP Reported for the three months ended December 31, 2018 and 2017 to
Selected Non-GAAP Adjusted information:
Three months ended December
31, 2018 Three months ended December
31, 2017
GAAP
Reported Adjusted Items (b)
Non-GAAP (a)
GAAP Reported
Adjusted Items (b)
Non-GAAP (a)
Cost of sales (1) $ 412.5 $ — $ 412.5 $ 405.0 $ 10.4 $ 394.6
Amortization of intangible assets $ 50.1 50.1 — $ 60.2 60.2 —
Asset impairments, restructuring and other special charges (2) (3) $ 46.0
46.0
—
$ 185.8
185.8
—
Other-net, (income) expense (4) (5) $ 25.7 31.9 (6.2 ) $ (0.1 ) (0.1 ) $ —
Income (loss) before taxes $ (2.2 ) $ 128.0 $ 125.8 $ (155.4 ) $ 256.3 $ 100.9
Provision for taxes (6) $ (18.6 ) (39.0 ) 20.4 $ 6.1 (52.3 ) 58.4
Net income (loss) $ 16.4 $ 89.0 $ 105.4 $ (161.5 ) $ 204.0 $ 42.5
Adjusted Earnings per share
basic and diluted (8) $ 0.04 $ 0.25 $ 0.29 $ (0.44 ) $ 0.56 $ 0.12
Adjusted Weighted average shares outstanding:
Basic and diluted (7) 365.6 365.6 365.6 365.6 365.6 365.6
Numbers may not add due to rounding.
The table above reflects only line items with non-GAAP adjustments.

10
(a) The company uses non-GAAP financial measures that differ from financial statements reported in conformity with
U.S. generally accepted accounting principles (GAAP). The company’s non-GAAP measures adjust reported
results to exclude amortization of intangibles and items that are typically highly variable, difficult to predict, and/or
of a size that could have a substantial impact on the company’s reported operations for a period. The company
believes that these non-GAAP measures provide useful information to investors. Among other things, they may
help investors evaluate the company’s ongoing operations. They can assist in making meaningful period-over-
period comparisons and in identifying operating trends that would otherwise be masked or distorted by the items
subject to the adjustments. Management uses these non-GAAP measures internally to evaluate the performance
of the business, including to allocate resources. Investors should consider these non-GAAP measures in addition
to, not as a substitute for or superior to, measures of financial performance prepared in accordance with GAAP.
(b) Adjustments to certain GAAP reported measures for the three months ended December 31, 2018 and 2017
include the following:
(1) 2017 excludes charges entirely associated with the incremental purchase accounting charges related
to inventory valuation due to inventory that was subsequently sold.
(2) 2018 excludes expenses primarily related to severance and asset impairment charges taken as a part
of the company’s productivity agenda ($33.7 million): in-process research and development write-offs
($2.0 million) and independent company stand-up and other related activities ($17.3 million): partially
offset by the gain on the sale of our Cali, Columbia facility ($1.5 million) and a favorable contract
termination related to the suspension of commercial activities for Imrestor ($5.5 million).
(3) 2017 excludes expenses primarily related to severance, curtailment loss and special termination
benefits ($99.8 million) associated with the U.S. voluntary early retirement program: integration costs
($15.2 million) associated with our acquired businesses; facility exist costs ($7.6 million); asset
impairment costs ($66.8 million) primarily related to intangible asset impairments for acquired IPR&D
assets; and partially offset by a gain on the disposal of a site ($3.6 million) previously closed as part of
our acquisition and integration of Novartis AH.
(4) 2018 excludes expenses resulting from an increase in the Aratana contingent consideration ($30.2
million) and expenses related to the integration activities ($1.7 million).
(5) 2017 excludes expenses resulting from an increase in the Aratana contingent ($0.1 million).
(6) 2018 and 2017 represent the income tax expense associated with the adjusted items. 2017 include
expense (33.1 million) related to the U.S. tax reform.
(7) Adjusted weighted average shares outstanding: Basic and diluted includes 72.3 million shares sold in
the September 2018 initial public offering for all periods presented.
(8) Reconciliation of each adjustment to earnings (loss) per share by line item is shown in the table below.

11
Q4 2018 Q4 2017
As Reported EPS $ 0.04 $ (0.55 )
Cost of sales — 0.03
Amortization of intangible assets 0.14 0.16
Asset impairments, restructuring and other special charges 0.13 0.51
Other-net, (income) expense 0.09 —
Subtotal 0.36 0.70
Provision for tax on income (0.11 ) (0.14 )
Total Adjustments to EPS $ 0.25 $ 0.56
Impact of Adjusted weighted shares outstanding: Basic and diluted (1) — 0.11
Adjusted EPS $ 0.29 $ 0.12
(1) See note (7) above. Impact is based on including 72.3 million shares sold in the September 2018 initial public
offering for all periods presented.
The following is a reconciliation of GAAP Reported for the year ended December 31, 2018 and 2017 to Select Non-
GAAP Adjusted information.
Year ended December 31, 2018 Year ended December 31, 2017
GAAP
Reported Adjusted Items (b)
Non-GAAP (a)
GAAP Reported
Adjusted Items (b)
Non-GAAP (a)
Cost of sales (1) (2) $ 1,573.8 $ 38.6 $ 1,535.2 $ 1,493.9 $ 42.7 $ 1,451.2
Amortization of intangible assets $ 197.4 197.4 $ — 221.2 221.2 —
Asset impairments, restructuring and other special charges (3) (4) $ 128.8
128.8
$ —
375.1
375.1
—
Other-net, (income) expense (5) (6) $ 41.3 40.4 $ 0.9 (0.1 ) (4.7 ) 4.6
Income (loss) before taxes $ 114.1 405.2 $ 519.3 (232.6 ) 634.3 401.7
Provision for taxes (7) $ 27.6 (59.9 ) $ 87.5 78.1 (73.1 ) 151.2
Net income (loss) $ 86.5 345.3 $ 431.8 (310.7 ) 561.2 250.5
Adjusted Earnings per share
basic and diluted (9) $ 0.24 $ 0.94 $ 1.18 $ (0.85 ) $ 1.54 $ 0.69
Adjusted Weighted average shares outstanding:
Basic and diluted (8) 365.6 365.6 365.6 365.6 365.6 365.6
Numbers may not add due to rounding.
The table above reflects only line items with non-GAAP adjustments.
(a) The company uses non-GAAP financial measures that differ from financial statements reported in conformity with
U.S. generally accepted accounting principles (GAAP). The company’s non-GAAP measures adjust reported
results to exclude amortization of intangibles and items that are typically highly variable, difficult to predict, and/or
of a size that could have a substantial impact on the company’s reported operations for a period. The company
believes that these non-GAAP measures provide useful information to investors. Among other things, they may
help investors evaluate the company’s ongoing operations. They can assist in making meaningful period-over-

12
period comparisons and in identifying operating trends that would otherwise be masked or distorted by the items
subject to the adjustments. Management uses these non-GAAP measures internally to evaluate the performance
of the business, including to allocate resources. Investors should consider these non-GAAP measures in addition
to, not as a substitute for or superior to, measures of financial performance prepared in accordance with GAAP.
(b) Adjustments to certain GAAP reported measures for the year ended December 31, 2018 and 2017 include the
following:
(1) 2018 excludes charges primarily associated with inventory adjustments related to the suspension of
commercial activities for Imrestor ($34.7 million), as well as the closure of the Larchwood, IA facility
($3.9 million).
(2) 2017 excludes charges entirely associated with the incremental purchase accounting charges related
to inventory valuation due to inventory that was subsequently sold.
(3) 2018 excludes restructuring expenses associated with the suspension of Imrestor commercial activities:
severance, company stand up cost: facility closures ($47.7 million): asset impairments ($82.6 million):
partially offset by a gain on the sale of our Cali, Columbia facility ($1.5 million).
(4) 2017 excludes charges primarily related to severance, curtailment loss: special termination benefits
($162.0 million) associated with the U.S. voluntary early retirement program: integration costs ($90.3
million) associated with acquired businesses; facility exist costs ($31.8 million): asset impairment costs
($110.6 million) primarily related to intangible asset impairments for marketed product and for acquired
IPR&D assets; partially offset by a gain on the disposal of two sites ($19.6 million) previously closed as
part of our acquisition and integration of Novartis AH.
(5) 2018 excludes expenses resulting from an increase in the Aratana contingent consideration ($38.7
million) and expenses related to on going integration activities ($1.7 million).
(6) 2017 excludes expenses resulting from an increase in the Aratana contingent consideration ($4.7
million).
(7) 2018 and 2017 represent the income tax associated with the adjusted items. 2017 includes expense
($33.1 million) related to the U.S. tax reform.
(8) Adjusted weighted average shares outstanding: Basic and diluted includes 72.3 million shares sold in
the September 2018 initial public offering for all periods presented.
(9) Reconciliation of each adjustment to earnings (loss) per share by line item is shown in the table below:

13
Year-to-Date
2018 2017
As Reported $ 0.28 $ (1.06 )
Cost of sales 0.10 0.12
Amortization of intangible assets 0.54 0.60
Asset Impairments, restructuring and other certain charges 0.35 1.03
Other-net, (income) expense 0.11 (0.01 )
Subtotal 1.10 1.74
Provision for tax on income (0.16 ) (0.20 )
Total Adjustments to EPS $ 0.94 $ 1.54
Impact of Adjusted weighted shares outstanding: Basic and diluted (1) (0.04 ) 0.21
Adjusted EPS $ 1.18 $ 0.69
(1) See note (8) above. Impact is based on including 72.3 million shares sold in the September 2018 initial public
offering for all periods presented.

14
For the periods presented, we have not made adjustments for all items that may be considered unrelated to our long-
term operations. We believe adjusted EBITDA, when used in conjunction with our results presented in accordance
with U.S. GAAP and its reconciliation to net income (loss), enhances investors' understanding of our performance,
valuation and prospects for the future. We also believe adjusted EBITDA is a measure used in the animal health
industry by analysts as a valuable performance metric for investors.
The following is a reconciliation of U.S. GAAP Net Income (loss) for the three months and year ended December 31,
2018 and 2017 to EBIT, EBITDA and adjusted EBITDA for the respective periods:
Three Months Ended December 31, Year Ended December 31,
2018 2017 2018 2017
Reported Net Income (Loss) $ 16.4 $ (161.5 ) $ 86.5 $ (310.7 )
Net interest expense 21.0 — 29.6 —
Income tax (benefit) expense (18.6 ) 6.1 27.6 78.1
Depreciation and amortization 70.0 87.1 292.3 318.4
EBITDA $ 88.8 $ (68.3 ) $ 436.0 $ 85.8
Non-GAAP Adjustments:
Cost of sales $ — $ 10.4 $ 38.6 $ 42.7
Asset impairment, restructuring and other special charges 46.0
185.8
128.8
375.1
Other-net, (income) expense 31.9 (0.1 ) 40.4 (4.7 )
Adjusted EBITDA $ 166.7 $ 127.8 $ 643.8 $ 498.9

15
For a reconciliation of our revenue excluding Strategic Exits to total GAAP revenue reported, please see the table
below, which is a breakdown of revenue by category and the respective percent of total revenue for the same period
(in millions):
For the three months ended December 31,
2018 2017
Companion Animal
Disease Prevention $ 200.7 25 % $ 140.5 19 %
Therapeutics 72.0 9 % 76.7 10 %
Total Companion Animal $ 272.7 34 % $ 217.2 29 %
Food Animal
Future Protein & Health $ 209.1 26 % $ 193.2 26 %
Ruminants and Swine 292.9 37 % 317.7 42 %
Total Food Animal $ 502.0 63 % $ 510.9 68 %
Revenue Subtotal $ 774.7 $ 728.1
Strategic Exits $ 24.6 3 % $ 26.2 3 %
Total Revenue $ 799.3 100 % $ 754.3 100 %
For the Year ended December 31,
2018 2017
Companion Animal
Disease Prevention $ 804.6 26 % $ 660.2 23 %
Therapeutics 283.1 9 % 260.8 9 %
Total Companion Animal $ 1,087.7 35 % $ 921.0 32 %
Food Animal
Future Protein & Health $ 711.2 23 % $ 649.2 22 %
Ruminants and Swine 1,174.0 38 % 1,175.0 41 %
Total Food Animal $ 1,885.2 61 % $ 1,824.2 63 %
Revenue Subtotal $ 2,972.9 $ 2,745.2
Strategic Exits $ 93.9 3 % $ 143.8 5 %
Total Revenue $ 3,066.8 100 % $ 2,889.0 100 %
Note: Amounts may not sum due to rounding.