
Efficient Hardware Acceleration on SoC- FPGA...
31
Efficient Hardware Acceleration on SoC- FPGA using OpenCL Susmitha Gogineni 30 th August ‘17 Advisor : Dr. Benjamin Carrion Schafer
Transcript of Efficient Hardware Acceleration on SoC- FPGA...

Efficient Hardware Acceleration on SoC- FPGA using OpenCL
Susmitha Gogineni30th August ‘17
Advisor : Dr. Benjamin Carrion Schafer

Presentation Overview
1.Objective & Motivation
2.Configurable SoC -FPGA
3.High Level Synthesis (HLS) & OpenCL
4.Hardware Acceleration on FPGA
5.Design Space Exploration (DSE)
6.Conclusions & Future work
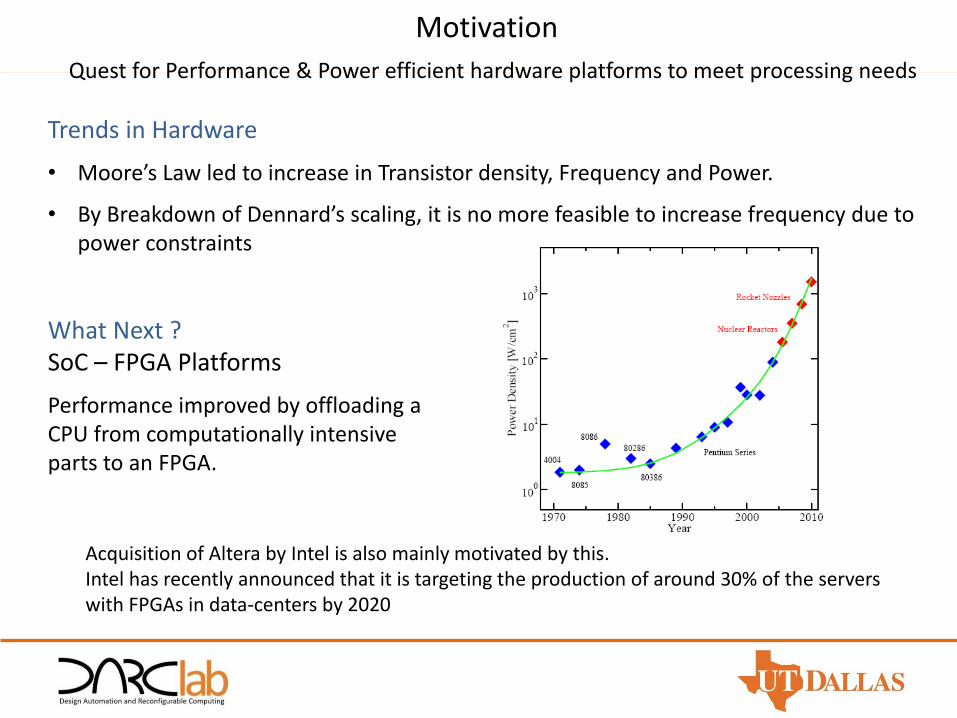
Motivation
Quest for Performance & Power efficient hardware platforms to meet processing needs
Trends in Hardware
• Moore’s Law led to increase in Transistor density, Frequency and Power.
• By Breakdown of Dennard’s scaling, it is no more feasible to increase frequency due to power constraints
What Next ?SoC – FPGA Platforms
Performance improved by offloading a CPU from computationally intensive parts to an FPGA.
Acquisition of Altera by Intel is also mainly motivated by this.Intel has recently announced that it is targeting the production of around 30% of the servers with FPGAs in data-centers by 2020

Objective
1. Hardware Acceleration using OpenCL
• Accelerate Computationally Intensive Applications on SoC-FPGA• Study effects on acceleration with different attributes.• Perform DSE using HLS.
2. Automated & Faster Design Space Exploration (DSE) method
• DSE is exploiting the different micro-architectures based on parameters of interest.• DSE is multi objective optimization Problem.• The search space is extremely large and Time constrained.• Genetic Algorithm based meta heuristic to automate DSE is implemented.
Design Space Exploration
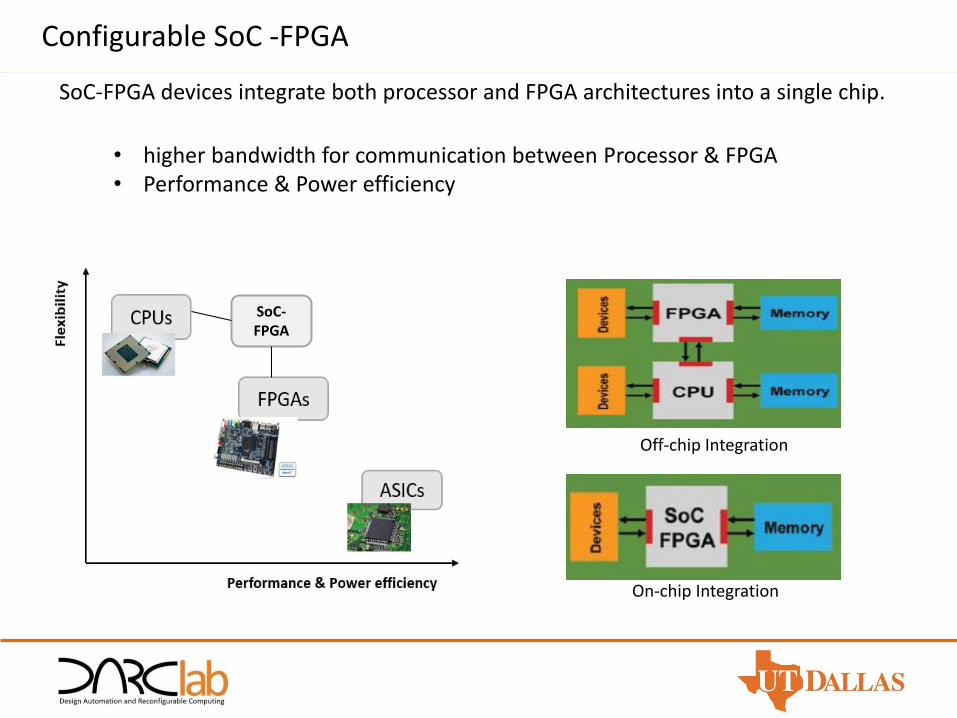
Configurable SoC -FPGA
• higher bandwidth for communication between Processor & FPGA• Performance & Power efficiency
SoC-FPGA devices integrate both processor and FPGA architectures into a single chip.
SoC-FPGA
Off-chip Integration
On-chip Integration
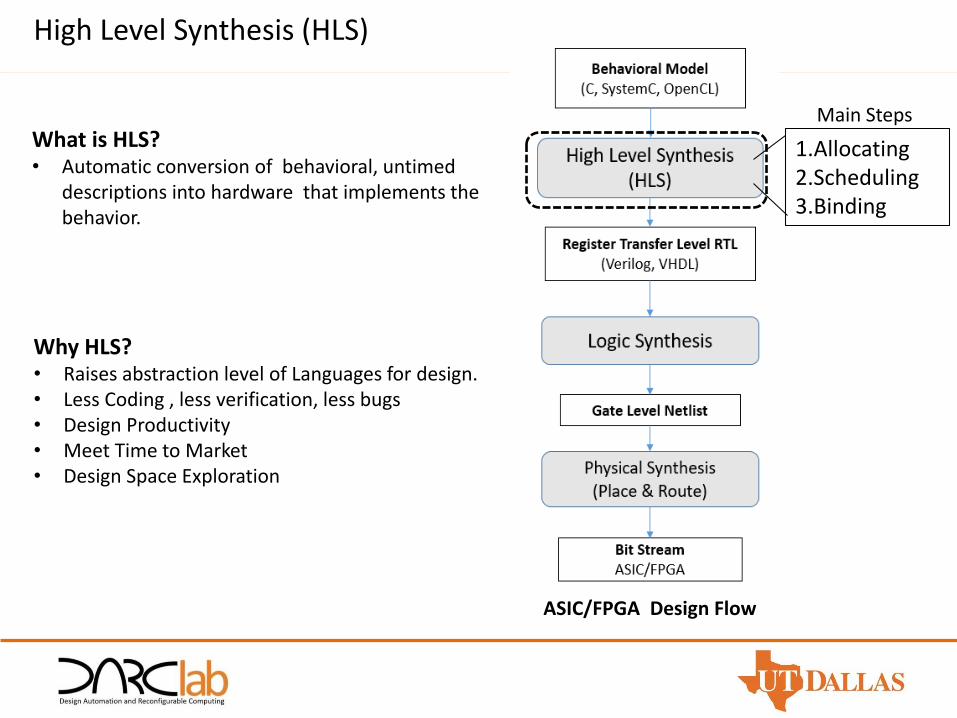
High Level Synthesis (HLS)
ASIC/FPGA Design Flow
1.Allocating2.Scheduling3.Binding
Main StepsWhat is HLS?• Automatic conversion of behavioral, untimed
descriptions into hardware that implements the behavior.
Why HLS?• Raises abstraction level of Languages for design.• Less Coding , less verification, less bugs• Design Productivity • Meet Time to Market• Design Space Exploration

OpenCL – Open Computing Language
OpenCL (Open Computing Language) is a standard framework which allows parallel programming of heterogeneous systems.
• Programming the devices on the heterogeneous platform• Application Programming Interface (API) to control the communication
between the compute devices.
OpenCL Platform ModelHardware abstraction Layers• Host• OpenCL Device• Compute Units• Processing Elements
GPU ,CPU,DSP,FPGA
CPUKernel Program
OpenCL Execution Units1. Host Program
Manages Workload division and Communication among the Compute Units.
2. Kernel program
Execute the computational part of the OpenCL application.
Host Program
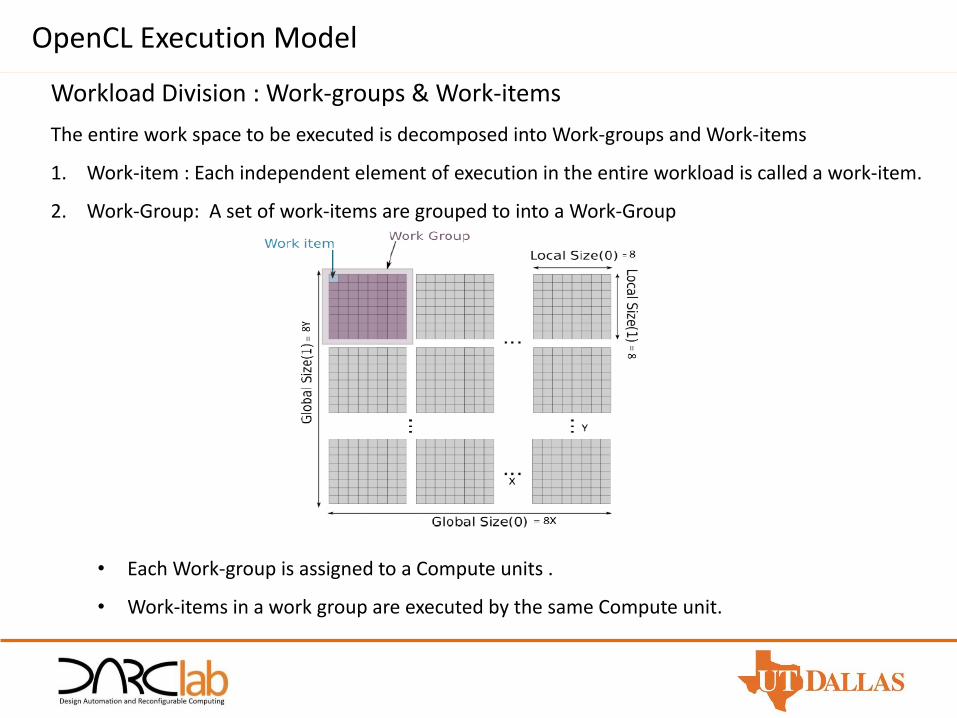
OpenCL Execution Model
Workload Division : Work-groups & Work-items
The entire work space to be executed is decomposed into Work-groups and Work-items
1. Work-item : Each independent element of execution in the entire workload is called a work-item.
2. Work-Group: A set of work-items are grouped to into a Work-Group
• Each Work-group is assigned to a Compute units .
• Work-items in a work group are executed by the same Compute unit.

OpenCL Memory Hierarchy
Memory Type
Scope Accessibility
Global Memory
HostCompute Units
Processing Elements
All work groups All workitems
Local Memory
Compute UnitsProcessing Elements
All Work-items in a workgroupNot shared to other workgroups
PrivateMemory
Processing ElementsExclusive to Work-item
Not shared to other work-item
Capacity decreasesLatency decreases
Memory hierarchy is structured to support data sharing ,Communication and synchronization of the work items.
Hardware Acceleration on FPGA using OpenCL

System Description
1. System Hardware
• Terasic DE1-SoC Board
Altera Cyclone V FPGA
2. Software Tools
• Intel FPGA SDK for OpenCL
• Altera Quartus II
• Intel® SoC-FPGA Embedded
Development Suite (SoC EDS)
cyclone V
Cyclone V
Kernel Host

3. System Memory Model
• Private memory:Registers & Block RAM on FPGA, Lowest latency at cost of area utilization.
• Global Memory : Off-Chip DDR , High Capacity and High latency , Host to Kernel Interface
• Local Memory: On-Chip memory ,Higher Bandwidth & lower latency than Global Memory.
Communication Host & Kernel
Read buffers Write Buffers
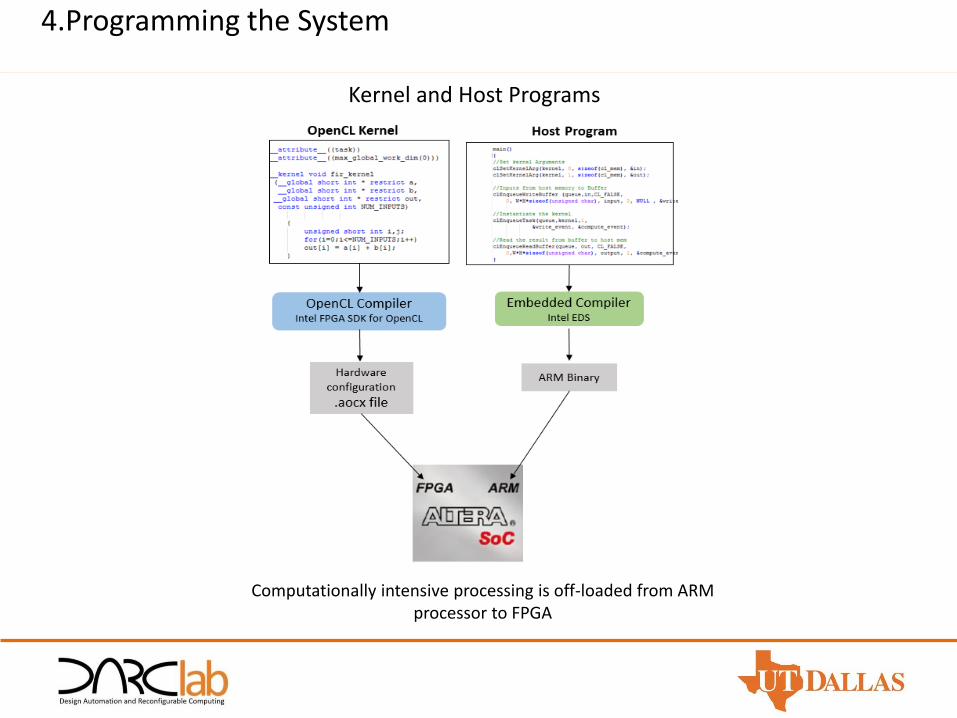
4.Programming the System
Kernel and Host Programs
Computationally intensive processing is off-loaded from ARM processor to FPGA
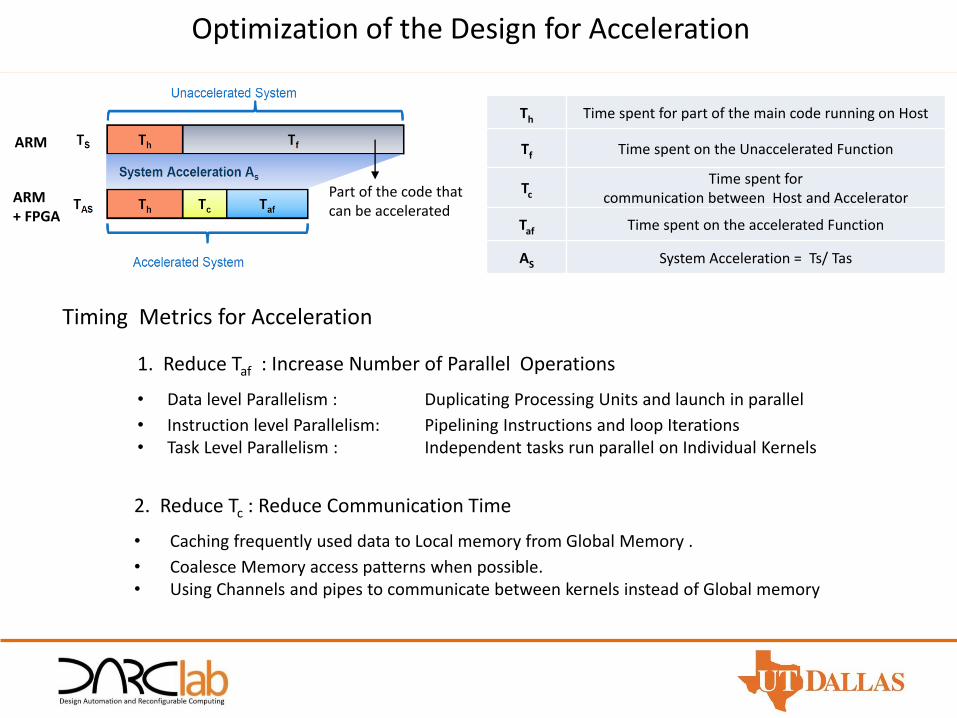
Timing Metrics for Acceleration
ARM
ARM+ FPGA
Part of the code that can be accelerated
Th Time spent for part of the main code running on Host
Tf Time spent on the Unaccelerated Function
Tc
Time spent for communication between Host and Accelerator
Taf Time spent on the accelerated Function
AS System Acceleration = Ts/ Tas
1. Reduce Taf : Increase Number of Parallel Operations
• Data level Parallelism : Duplicating Processing Units and launch in parallel
• Instruction level Parallelism: Pipelining Instructions and loop Iterations• Task Level Parallelism : Independent tasks run parallel on Individual Kernels
2. Reduce Tc : Reduce Communication Time
• Caching frequently used data to Local memory from Global Memory .
• Coalesce Memory access patterns when possible.• Using Channels and pipes to communicate between kernels instead of Global memory
Optimization of the Design for Acceleration
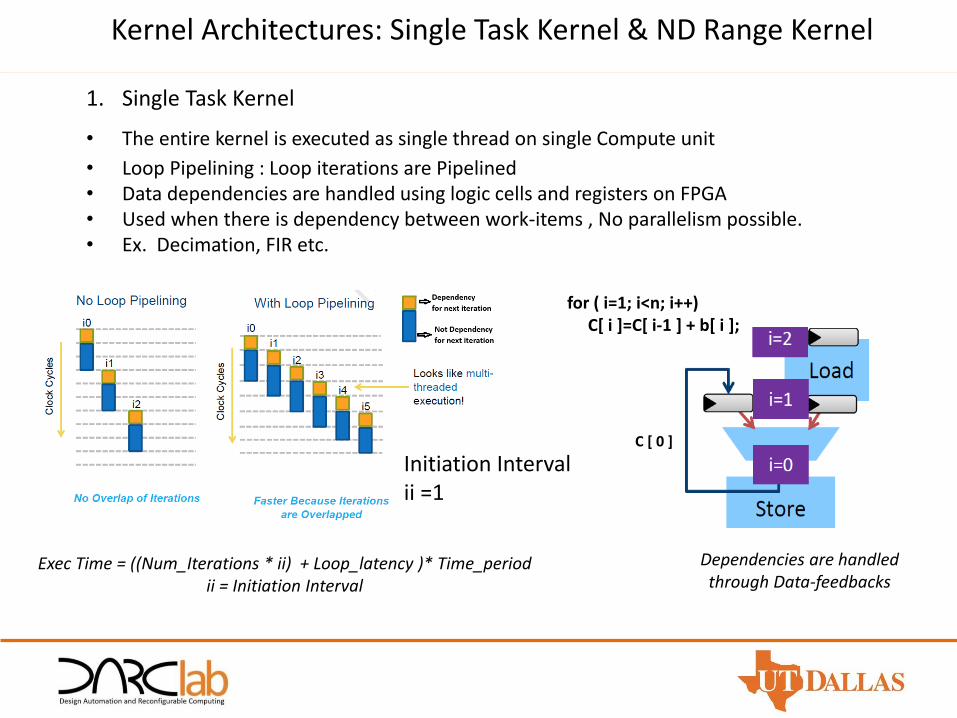
Kernel Architectures: Single Task Kernel & ND Range Kernel
1. Single Task Kernel
• The entire kernel is executed as single thread on single Compute unit
• Loop Pipelining : Loop iterations are Pipelined• Data dependencies are handled using logic cells and registers on FPGA• Used when there is dependency between work-items , No parallelism possible.• Ex. Decimation, FIR etc.
Exec Time = ((Num_Iterations * ii) + Loop_latency )* Time_periodii = Initiation Interval
for ( i=1; i<n; i++)C[ i ]=C[ i-1 ] + b[ i ];
Dependencies are handled through Data-feedbacks
C [ 0 ]
Initiation Interval ii =1
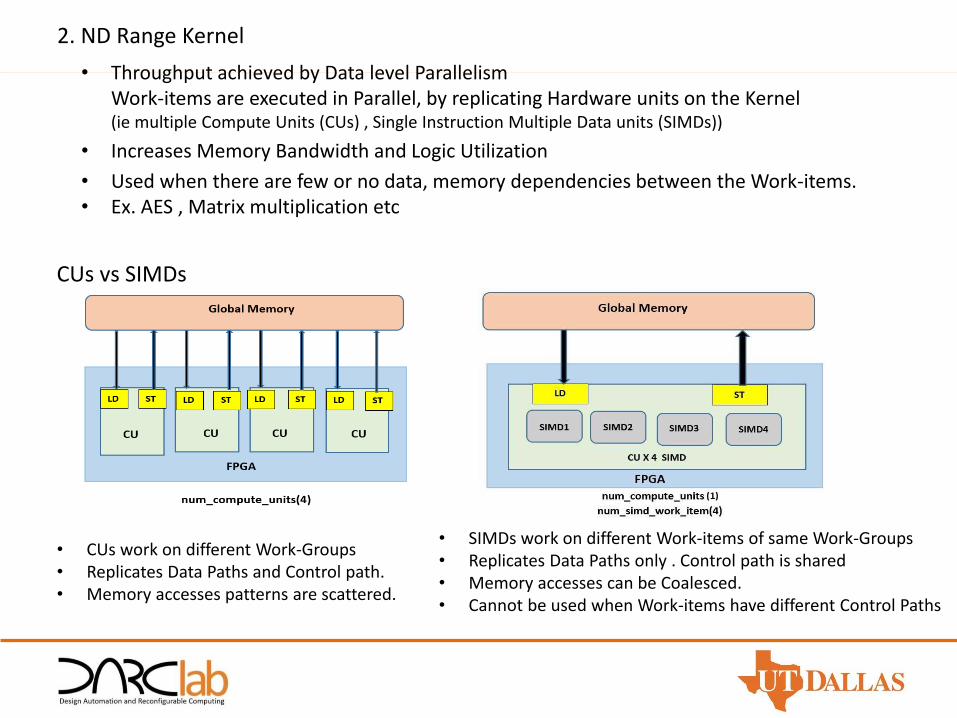
2. ND Range Kernel
• Throughput achieved by Data level Parallelism Work-items are executed in Parallel, by replicating Hardware units on the Kernel(ie multiple Compute Units (CUs) , Single Instruction Multiple Data units (SIMDs))
• Increases Memory Bandwidth and Logic Utilization
• Used when there are few or no data, memory dependencies between the Work-items.• Ex. AES , Matrix multiplication etc
• SIMDs work on different Work-items of same Work-Groups• Replicates Data Paths only . Control path is shared • Memory accesses can be Coalesced.• Cannot be used when Work-items have different Control Paths
• CUs work on different Work-Groups• Replicates Data Paths and Control path.• Memory accesses patterns are scattered.
CUs vs SIMDs

Optimization Attributes & Pragmas
1. num_compute_units(N)2. num_simd_work(N)3. #pragma unroll < N >4. max work group size(N)5. reqd work group size(x; y; z)
OpenCL Benchmarks
BENCHMARKKernel Type
Pipeline Initiation Interval
Logic (%)
Sobel Single Task 2 20
FIR Single Task 1 20
ADPCM Single Task 40 20
Decimation Single Task 1 81
Interpolation Single Task 1 28
AESNDRange
CU=2,SIMD=2Not Pipelined 84
• 6 OpenCL applications• Kernel Type chosen based on application• Experimented on both Unaccelerated System( ARM ) and Accelerated System
(ARM+FPGA) to compare performance
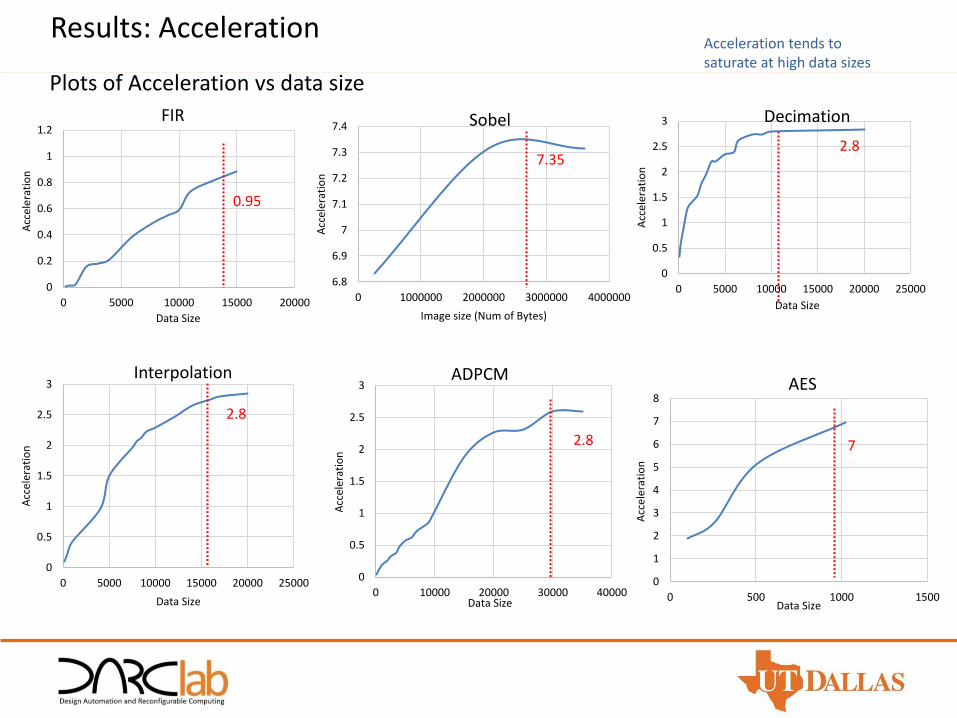
Results: Acceleration
Plots of Acceleration vs data size
0
0.2
0.4
0.6
0.8
1
1.2
0 5000 10000 15000 20000
Acc
eler
atio
n
Data Size
FIR
6.8
6.9
7
7.1
7.2
7.3
7.4
0 1000000 2000000 3000000 4000000
Acc
eler
atio
nImage size (Num of Bytes)
Sobel
7.35
0
0.5
1
1.5
2
2.5
3
0 5000 10000 15000 20000 25000
Acc
eler
atio
n
Data Size
Decimation
2.8
0
0.5
1
1.5
2
2.5
3
0 10000 20000 30000 40000
Acc
eler
atio
n
Data Size
ADPCM
2.8
0
0.5
1
1.5
2
2.5
3
0 5000 10000 15000 20000 25000
Acc
eler
atio
n
Data Size
Interpolation
2.8
0
1
2
3
4
5
6
7
8
0 500 1000 1500
Acc
eler
atio
n
Data Size
0.95
7
AES
Acceleration tends to saturate at high data sizes

Results: Communication Overhead
• Communication Overhead:Most of the time on the accelerated system is spent for data Communication between the host and Kernel
• Initially, the acceleration tends to increase with data size due to growing computation complexity.
• The acceleration ceases beyond a point because of no immediate data is available for processing due to communication overhead and limited Communication Data buffer size between Host and Kernel.
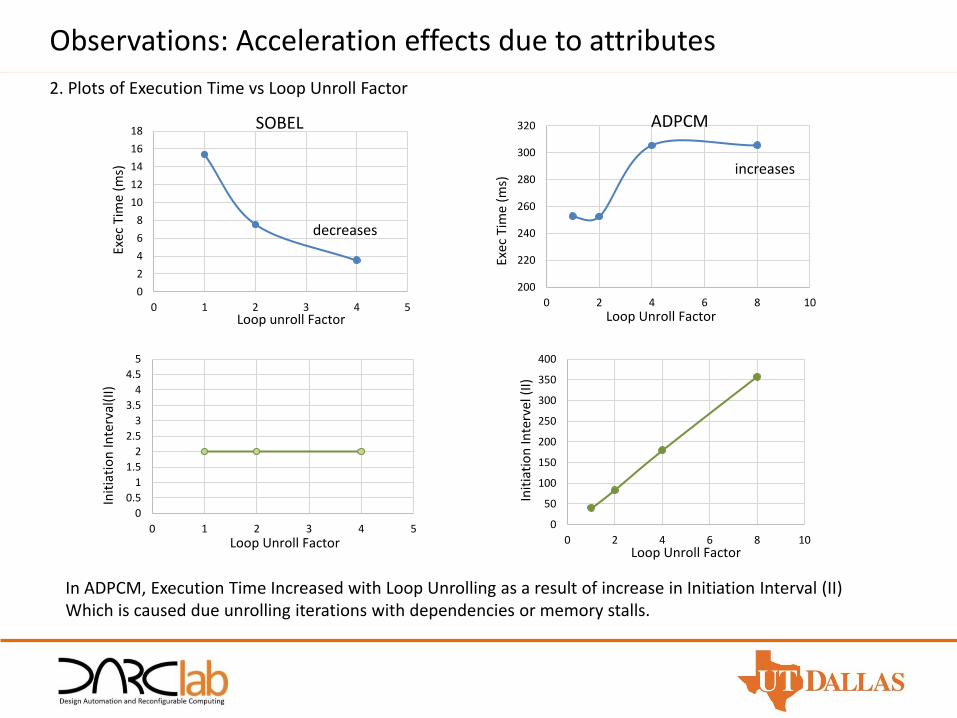
Observations: Acceleration effects due to attributes
0
2
4
6
8
10
12
14
16
18
0 1 2 3 4 5
Exec
Tim
e (m
s)
Loop unroll Factor
SOBEL
2. Plots of Execution Time vs Loop Unroll Factor
200
220
240
260
280
300
320
0 2 4 6 8 10
Exec
Tim
e (m
s)
Loop Unroll Factor
ADPCM
0
50
100
150
200
250
300
350
400
0 2 4 6 8 10In
itia
tio
n In
terv
el (
II)
Loop Unroll Factor
In ADPCM, Execution Time Increased with Loop Unrolling as a result of increase in Initiation Interval (II)Which is caused due unrolling iterations with dependencies or memory stalls.
0
0.5
1
1.5
2
2.5
3
3.5
4
4.5
5
0 1 2 3 4 5
Init
iati
on
Inte
rval
(II)
Loop Unroll Factor
decreases
increases

Observations: Acceleration effects due to attributes
ComputeUnits
SIMDUnits
Acceleration
256Inputs
512Inputs
1024Inputs
1 1 2.5 4.6 6.6
1 2 2.7 5.4 6.6
1 4 2.4 5.4 6.9
2 1 4 4.6 6.9
2 2 2.6 5.2 6.9
1. Acceleration of AES by varying the number of CU and SIMD attributes across different data sizesNumber of Workgroups = 2 , Number of Workitems = (Num_inputs)/2
trade off between Data processing efficiency and Bandwidth requirement
Increased Decreased
Each Attributes has various trade-off affects on the performance ,memory access ,Bandwidth requirement ,Logic utilization etc.

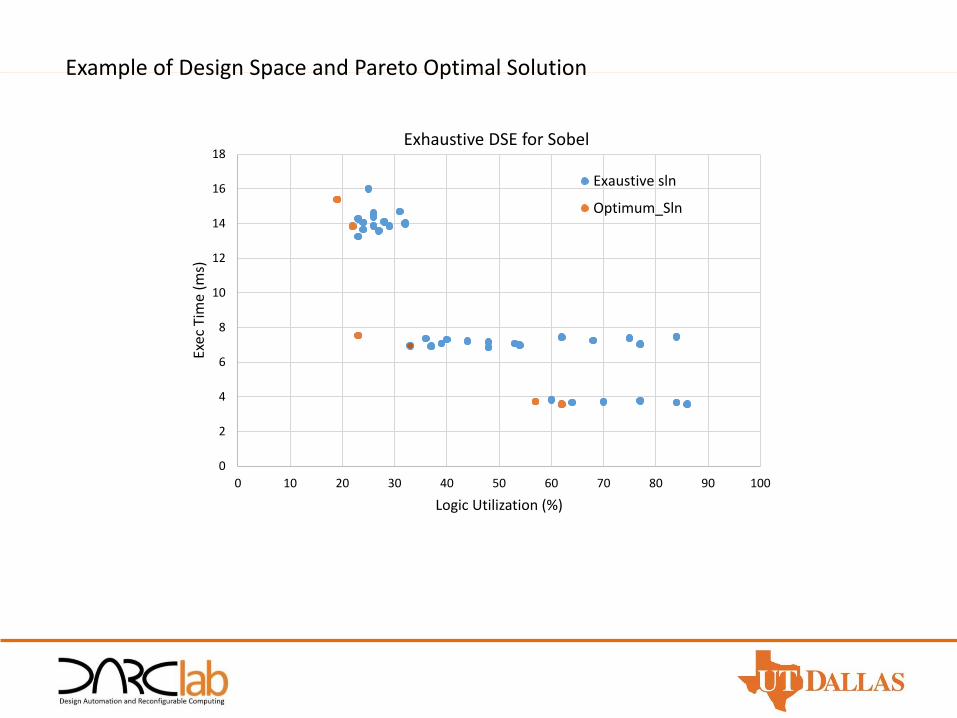
Design Space Exploration
Exhaustive Search vs Fast Heuristic

DSE by Exhaustive Search methodology• Exhaustive search DSE involves analyzing of all possible search combinations.
• Pareto Optimal Solutions is the set of dominant solutions, for which no parameter can be improved without sacrificing at least one other Parameter.
• Area and Execution time parameters are used.
1. Add Tunableattributes
2. Generate possible Solutions
3. CompileSolutions
4. Design Space
5. Pareto OptimalSolutions
The main disadvantage is that the design space is typically large and grows exponentially with the number of exploration options.
0
2
4
6
8
10
12
14
16
18
0 10 20 30 40 50 60 70 80 90 100
Exec
Tim
e (m
s)
Logic Utilization (%)
Exhaustive DSE for Sobel
Exaustive sln
Optimum_Sln
Example of Design Space and Pareto Optimal Solution
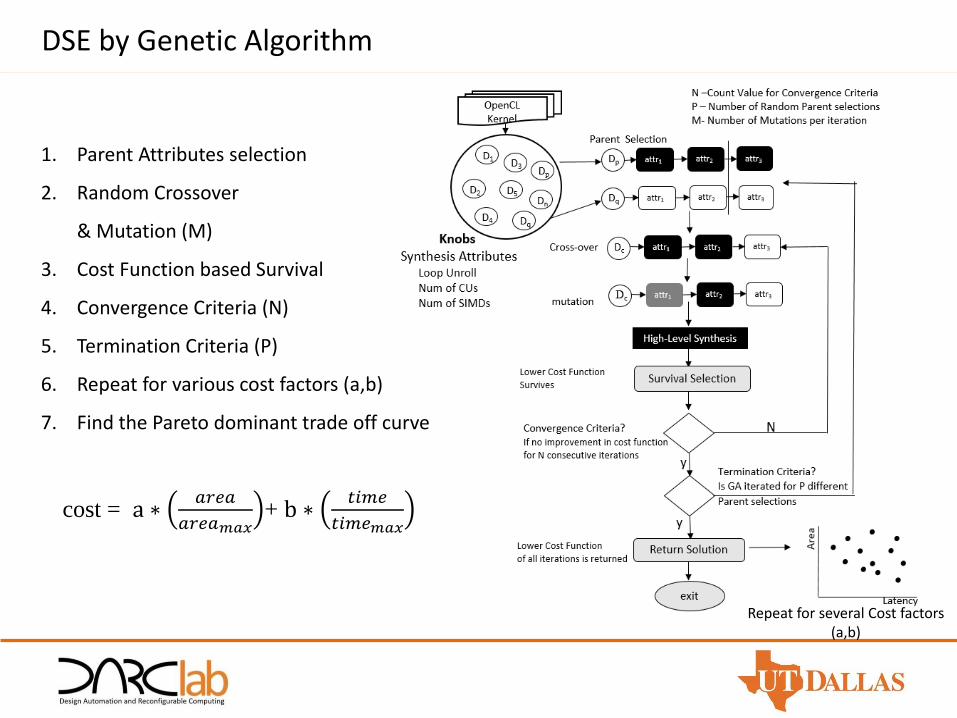
DSE by Genetic Algorithm
1. Parent Attributes selection
2. Random Crossover
& Mutation (M)
3. Cost Function based Survival
4. Convergence Criteria (N)
5. Termination Criteria (P)
6. Repeat for various cost factors (a,b)
7. Find the Pareto dominant trade off curve
Repeat for several Cost factors (a,b)
cost = a ∗𝑎𝑟𝑒𝑎
𝑎𝑟𝑒𝑎𝑚𝑎𝑥+ b ∗
𝑡𝑖𝑚𝑒
𝑡𝑖𝑚𝑒𝑚𝑎𝑥

Efficiency Metrics
Metrics to measure the quality of solutions in Genetic Algorithm based Heuristic :
1. Pareto Dominance (Dom) :The fraction of total number of solutions in the Pareto set being evaluated ,also present in the reference Pareto set .
2. Average Distance from Reference Set (ADRS): ADRS measures the average distance between the Heuristic approximated front and the Pareto Optimal Front.
3. Speed up:Determines speed up in the compilation time to find the Pareto dominant Front compared to the Exhaustive search.
0
0.2
0.4
0.6
0.8
1
1.2
0 0.2 0.4 0.6 0.8 1
Pareto optimum
GA_1_5_10
Dominance = 2/4 = 0.5
ADRS = 0.64
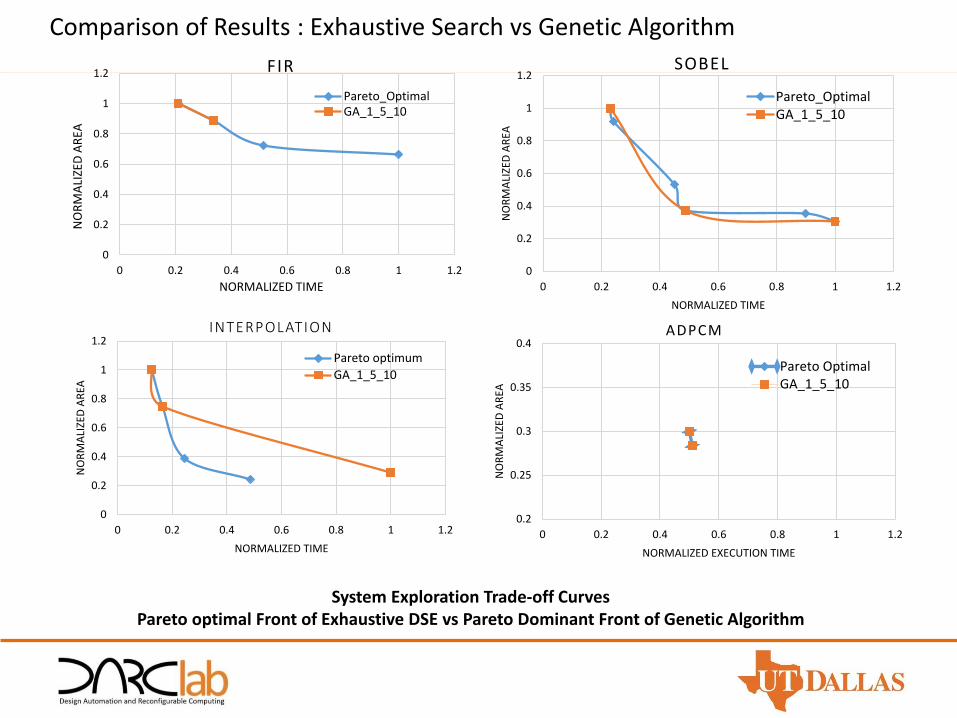
Comparison of Results : Exhaustive Search vs Genetic Algorithm
System Exploration Trade-off CurvesPareto optimal Front of Exhaustive DSE vs Pareto Dominant Front of Genetic Algorithm
0
0.2
0.4
0.6
0.8
1
1.2
0 0.2 0.4 0.6 0.8 1 1.2
NO
RM
ALI
ZED
AR
EA
NORMALIZED TIME
FIR
Pareto_OptimalGA_1_5_10
0
0.2
0.4
0.6
0.8
1
1.2
0 0.2 0.4 0.6 0.8 1 1.2
NO
RM
ALI
ZED
AR
EA
NORMALIZED TIME
SOBEL
Pareto_OptimalGA_1_5_10
0
0.2
0.4
0.6
0.8
1
1.2
0 0.2 0.4 0.6 0.8 1 1.2
NO
RM
ALI
ZED
AR
EA
NORMALIZED TIME
INTERPOLATION
Pareto optimum
GA_1_5_10
0.2
0.25
0.3
0.35
0.4
0 0.2 0.4 0.6 0.8 1 1.2
NO
RM
ALI
ZED
AR
EA
NORMALIZED EXECUTION TIME
ADPCM
Pareto OptimalGA_1_5_10
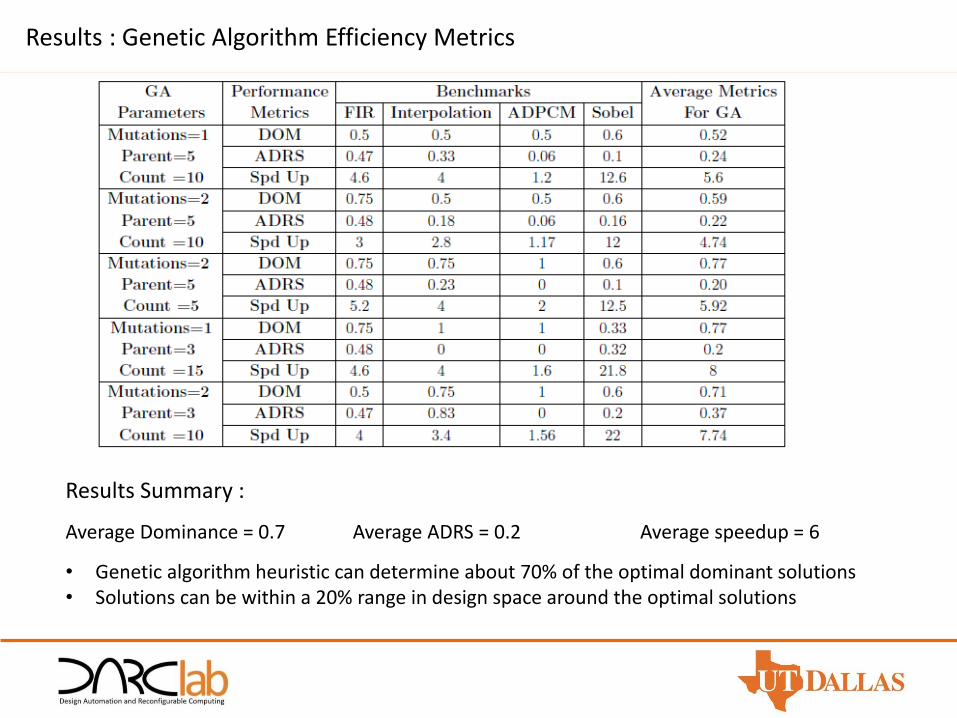
Results : Genetic Algorithm Efficiency Metrics
Results Summary :
Average Dominance = 0.7 Average ADRS = 0.2 Average speedup = 6
• Genetic algorithm heuristic can determine about 70% of the optimal dominant solutions• Solutions can be within a 20% range in design space around the optimal solutions

Future Work
• Experimenting with wider range of benchmarks.
• Upgrade benchmarks to multiple FPGA Platforms.
• Other fast Heuristic methods like Simulation Annealing or Machine Learning algorithms can be used for exploration of design space.
Conclusions
• We developed set of OpenCL benchmarks to study the trend in acceleration as a result of various attributes.
• A fast and heuristic method to explore the design space is implemented. Its performance is analyzed & compared with the reference solution set.
• Based on the experiments, an average dominance of 0.7, average ADRS of 0.2 at average speed up of 6 times compared to the exhaustive DSE search is observed.
Thank You !

Questions ?