
5736: Agricultural Leadership, Education, & Communications ...

Policy Research Working Paper 5736
Efficiency in Public Procurement in Rural Road Projects of Nepal
Radia BenamgharAtsushi Iimi
The World BankSouth Asia RegionSustainable Development DepartmentJuly 2011
WPS5736P
ublic
Dis
clos
ure
Aut
horiz
edP
ublic
Dis
clos
ure
Aut
horiz
edP
ublic
Dis
clos
ure
Aut
horiz
edP
ublic
Dis
clos
ure
Aut
horiz
edP
ublic
Dis
clos
ure
Aut
horiz
edP
ublic
Dis
clos
ure
Aut
horiz
edP
ublic
Dis
clos
ure
Aut
horiz
edP
ublic
Dis
clos
ure
Aut
horiz
ed

Produced by the Research Support Team
Abstract
The Policy Research Working Paper Series disseminates the findings of work in progress to encourage the exchange of ideas about development issues. An objective of the series is to get the findings out quickly, even if the presentations are less than fully polished. The papers carry the names of the authors and should be cited accordingly. The findings, interpretations, and conclusions expressed in this paper are entirely those of the authors. They do not necessarily represent the views of the International Bank for Reconstruction and Development/World Bank and its affiliated organizations, or those of the Executive Directors of the World Bank or the governments they represent.
Policy Research Working Paper 5736
Transport infrastructure is important for economic growth. In Nepal, about 20 percent of rural residents have to spend more than 3 hours to go to the nearest marketplace or agriculture center. Public procurement is an important policy instrument to use resources wisely and efficiently. This paper analyzes a series of policy questions, from procurement design to contract management and project quality assurance. The paper finds that the competition effect is significant. To enhance
This paper is a product of the Sustainable Development Department, South Asia Region. It is part of a larger effort by the World Bank to provide open access to its research and make a contribution to development policy discussions around the world. Policy Research Working Papers are also posted on the Web at http://econ.worldbank.org. The authors may be contacted at [email protected] or [email protected].
competition, bidding documents can be distributed free of charge on a website. The bid preparation period can be extended. Security issues are also found to be particularly important to avoid unnecessary cost overruns and project delays. Heavy rainfall and the bidders’ low-balling strategy are identified as other factors of project delays. The quality of roads would deteriorate with not only security incidence but also time, precipitation and traffic volume.

EFFICIENCY IN PUBLIC PROCUREMENT
IN RURAL ROAD PROJECTS OF NEPAL
Radia Benamghar
World Bank (SAR)
Atsushi Iimi¶ †
World Bank (SDNCE)
Key words: Public procurement; rural roads, auction theory; competition; market entry;
ethnicity; weather, governance.
JEL classification: D44, H54, H57, D82.
¶ We express our special thanks to United Nations, Nepal and Department of Hydrology and Meteorology,
Ministry of Environment, Nepal for their kind collaboration in collecting relevant data for this study. We also
thank Farhad Ahmed, Luis Andres, Rodrigo Archondo-Callao, Michel Audigé, Marianne Fay, Hiramani
Ghimire, Susan Goldmark, Martin Humphreys, Tesfaalem Ilysus, Marianne Kilpatrick, Christine Kimes,
Richard Messick, Rajashree Paralkar, Tahseen Sayed, Tomoyuki Yamashita and other Bank colleagues for their
comments and suggestions on an earlier version of this paper. † Corresponding author.
- 2 -
EXECUTIVE SUMMARY
Transport infrastructure is among the most important driving forces for economic growth. In
Nepal, rural road accessibility remains a crucial challenge. The vast majority of rural
residents had to spend more than 30 minutes to access to paved roads. Public procurement is
an important policy instrument to use resources wisely and efficiently.
This paper addresses a series of policy challenges in public road procurement, from
procurement planning to contract management and project quality assurance. Important,
these issues are interrelated to each other. Therefore, the issues need to be addressed in
concert. Using data collected from 155 rural road upgrading contracts in Nepal, five
questions are addressed: How do bidders determine their bidding strategy, i.e., bid prices, in
competitive bidding for rural road contracts? How do they decide whether to participate in
the procurement market? What are the main determinants of efficiency in contracting road
works? Why ex post contract amendments, such as cost overruns and delays, happen? Which
factor is important to ensure the quality of roads delivered by the project?
Our main findings and policy implications are as follows:
1. Competition needs to be enhanced particularly in government owned projects.
Competition is the most important factor to bring down road procurement costs. The level of
competition is clearly insufficient in some public tenders in Nepal. In particular in
government owned projects, the average competition is about 4.5, unfavorably compared to
an average of 7.3 in World Bank financed projects. Significant losses―possibly, $3
million―are estimated to be incurred by the lack of competition.
2. Wider distribution of tender information at cheaper costs increases competition as well
as transparency and accountability.
To attract more interest and bidders, tender notices should be distributed widely and at low
costs. This will bring down the cost of entry for firms. Public tenders can be advertized on
national newspapers, rather than local ones. E-bidding or e-procurement can distribute tender
information even more widely and in a timely manner. The findings are consistent with the
recent initiative that the Nepal government has taken in its e-procurement strategy.
3. Longer bid preparation periods encourage bidder participation in public tenders.
As stipulated in the procurement guidelines, it is important to grant sufficient time for firms
to prepare bids. By doing so, even inexperienced contractors are allowed to consider to
participate in auctions, thereby intensifying competition in the market. Of particular note, the
extension of the bid preparation period is a no-cost measure for procurers. In Nepal, some of
the government owned projects had extremely short bid preparation periods. As an indicative

- 3 -
target, 30 days may have to be given for bid preparation. The cost savings could be $0.2
million in the total sample projects financed by DDCs.
4. Procurement packaging is an important element to influence the firms’ entry and
bidding decisions
The study shows that the competition increases with the size of contracts. Too small
contracts are not profitable enough to encourage potential contractors to participate in
competitive bidding. Particularly, the number of participants can be increased to about 7
bidders for small contracts with a length of 10 km or less, which are the majority of the rural
road contracts in Nepal. Procurers should reexamine the way of contract packaging to take
advantage of the competition effect.
5. Local contractors’ capabilities need to be fostered to enhance competition.
Firm location does not matter to bid prices but influences the bidders’ entry strategy. For
projects far from the capital where many construction firms are located, a fewer firms would
likely apply. In addition, local firms do not appear competitive enough, despite their potential
advantages of proximity to the project location. Public procurement can be used to foster the
local business capacities. However, the careful allocation of projects is necessary to maintain
competitive pressure and transparency in the market.
6. Security is great concern for not only procurement costs but also road management.
Security issues would push up bid prices and discourage the market entry of potential firms.
Both will end up with a heavy burden on the economy. In addition, security incidence would
cause cost overruns and project delays. Unstable security would also hamper timely road
maintenance required. As a result, the quality of roads would deteriorate quickly where
security is not secured.
7. Severe weather causes project delays.
The government should be aware of the risk of project delays caused by weather conditions.
It rains a lot in Nepal. Increased precipitation is likely to cause project delays, which often
lead to cost overruns and fiscal inefficiency. Some flexibility may be needed in the road
procurement planning and budget formulation in Nepal.
8. Proper and solid project design and preparation help to avoid unnecessary contract
amendments and improve efficiency in the whole project cycle.
Proper project specifications are important to avoid unnecessary contract amendments and
minimize the risk of contractors’ opportunistic behavior. In particular, large projects must be
prepared carefully. Cost overruns and project delays tend to occur in relatively large road

- 4 -
works. To ensure the quality of works, quality assurance mechanisms, such as post-
qualification review, need to be established in the procurement system.
9. Roads are deteriorating with time, traffic and precipitation, if not properly maintained.
The quality of roads would decline with the duration of use of roads, traffic volume and
cumulative precipitation. In Nepal, the vast majority of roads would be rated to be ―very
uncomfortable‖ if they are used for more than one year without proper maintenance.
10. Capacity building for efficient road procurement is necessary at local level
Government effectiveness in making road contracts varies significantly across districts. The
difference can be attributed partly to technical reasons, such as technical complexity of
projects. But it is also because the government capacities may not be sufficient at the local
level. Important, the lengthy contract award process is likely to result in significant project
delays. Thus, it is critical to develop the procurement capability of local governments. In
addition, efforts toward procurement efficiency may be needed in collaboration with donors.
While about 30 days are required to award a road contract in DDC projects, it takes more
than 3 months in World Bank financed projects.

- 5 -
I. INTRODUCTION
Transport infrastructure is among the most important driving forces for economic growth.
Sustained access to infrastructure is essential to improve living standards. In particular in
rural areas, the lack of access to reliable transport infrastructure remains a significant
constraint for people’s daily life and local businesses in developing countries. About 900
million rural dwellers are estimated to have no access to all-weather road within two
kilometers over the world.
In Nepal, rural road accessibility is one of the most crucial challenges. The vast majority of
rural residents had to spend more than 30 minutes to access to paved roads. About one-third
do not have paved road within more than 3 hours. The lack of access to all-season roads
significantly limits their economic opportunities in remote areas. About 20 percent of rural
residents have to spend more than 3 hours to go to the nearest marketplace or agriculture
center. The road deficiency also has adverse effects on social welfare. Most urban people
may find a health post within less than 30 minutes. However, for rural people, it often takes
more than 1 hour (Nepal CBS, 2004).
In Nepal, road density remains low particularly in mountainous areas. On a per capita basis,
road density is also low in northern and northeastern districts (Figure 1). In these regions,
many rural roads were in operational condition only during the dry season. Road density
looks relatively high around the capital, Kathmandu. However, with the significant
concentration of population on the capital area taken into account, there may not be sufficient
road network even in the capital area. In Terai, the road density per population is relatively
high.

- 6 -
Figure 1. Road density in Nepal
Source: Central Bureau of Statistics, Nepal (2004).
Recognizing the issues in the transport sector, the government has been making efforts to
improve the rural accessibility by upgrading dry-season-only roads to all-season standards
and providing structures, gravel surface and Otta seal, which is a low-cost paving option
(World Bank, 2005; 2007). Some of the impacts have already been observed. An interim
survey of the project indicates that the people’s mobility increased by more than 20 percent
and that their travel time declined dramatically from 2.6 hours to 32 minutes on average
(World Bank, 2009).
However, resources available for infrastructure development continue to be limited, as in
other developing countries.1 Nepal spent $105 million or 1.2 percent of GDP for road
development (World Bank, 2005). This is more or less equally comparable with regional
countries, such as Bangladesh spending 0.7 percent of GDP on transport infrastructure and
India 1.4 percent. But these may still be far below the infrastructure needs, which are
estimated at 3-7 percent of GDP in typical low-income countries.
Public procurement is an important instrument to use resources wisely and efficiently (e.g.,
Iimi, 2006; Estache and Iimi, 2011). ―[T]he best way to find fiscal space for public
investment is to eliminate waste and improve technical efficiency in public expenditure
(World Bank, 2005).‖ However, how to design an efficient procurement system is still a
challenging task, especially in the infrastructure sector. Infrastructure projects are often
technically complex, highly customized and politically sensitive. As a result, competition for
public contracts tends to be limited, and the procurement markets would likely be vulnerable
1 See more discussion on transport infrastructure financing in Annex I.
.
Road Density per 100 km2
0.0 - 2.82.9 - 6.97.0 - 11.511.6 - 19.319.4 - 29.429.5 - 57.958.0 - 87.587.6 - 205.8
/
Road Density per 1000 population
0.00 - 0.100.11 - 0.320.33 - 0.520.53 - 0.710.72 - 0.900.91 - 1.101.11 - 1.381.39 - 2.23

- 7 -
to collusive bidding and corruption. The lengthy bid evaluation process is of particular
concern. It will reduce transparency of the process and increase the risk of anticompetitive
practices and cost overruns (Ware et al., 2007).
The current paper primarily aims at examining the firms’ bidding and entry strategy to
establish an efficient public road procurement system. However, it also casts light on a series
of policy issues related to contract management and project quality assurance, because public
contracts for infrastructure projects are often far from complete. In addition, firms can take
the low-balling strategy—which is to submit an unrealistic bid and initiate renegotiation
afterward (Ware and others, 2007). If this strategy cannot be excluded, the procurement
performance needs to be analyzed along with assessment of ex post contract amendments as
well as the quality of projects delivered.
The paper collected new data on procurement and contract performance from 155 rural road
upgrading works in Nepal, on which about 820 bids were submitted. The quality of roads
was also assessed by road specialists who visited every road location. The remaining paper is
organized as follows: Section II describes recent road developments and other relevant issues
in Nepal. Section III develops the empirical models with all possible hypotheses taken into
account. The section also presents our data in an informal way. Section IV summarizes our
formal empirical results, and Section V discusses policy implications. Then, Section VI
concludes.
II. RECENT ROAD DEVELOPMENTS AND RELEVANT ISSUES IN NEPAL
Nepal is one of the least developed countries in the world. About 29 million people live in
the country, out of which half still live on less than $1.25 a day at 2005 international prices.
Gross domestic product (GDP) per capita was about $430 in 2009. In the country, there
exists some 17,000 km of road network. This is about 12 km per 100 sq. km of land area,
which is compared unfavorably to other developing countries in the region. Not only quantity

- 8 -
but also quality of roads has been low. About 40 percent of roads in Nepal remain to be
paved (Figure 2).
Figure 2. Road density in South Asia
Note: Figures are the latest available data in 2002-2007.
Source: World Development Indicators.
In Nepal there are several important rural road reconstruction and rehabilitation projects
assisted by multi- and bi-lateral donors. While the World Bank has been assisting the Rural
Access Improvement and Decentralization Project (RAIDP) in 20 districts mainly in the
Terai area, other donors, such as Asian Development Bank and UK Department for
International Development (DfID), have been supporting other 45 districts under the Rural
Reconstruction and Rehabilitation Sector Development Project. The remaining 10 districts
are planned to be covered by scaling up the RAIDP.
In the RAIDP, the 20 districts were selected according to the predetermined performance
evaluation framework composed of a wide range of criteria, such as project preparedness,
existing infrastructure gap and poverty profile. The framework aimed at creating institutional
incentives to compete for resources among districts. The funding allocation was also
designed on a performance basis. However, the original performance criteria were found
unsuitable, given the prevailing conflict unstable political conditions, and low
implementation capabilities at the district level. Therefore, the criteria were somewhat
simplified, focusing on financial and physical progress of the works carried out.
Three entities share responsibility for the rural road development and maintenance in Nepal:
the Ministry of Local Development (MOLD), the Department of Local Infrastructure and
166
148
112
34
17 12 616
120
53
2211 7 2
0
20
40
60
80
100
120
140
160
180
Ban
gla
des
h
Sri
Lan
ka
India
Pak
ista
n
Bhuta
n
Nep
al
Afg
han
ista
n
Km
per
100 k
m2 o
f la
nd a
rea Road density
Paved road density

- 9 -
Agricultural Roads (DOLIDAR), and individual District Development Committees (DDCs).
DDCs are the main implementing agencies to prepare District Transport Management Plans,
prioritize the local needs, mobilize community groups, and procure and manage civil works
and services. However, the DDCs planning and implementation capacity remains weak. Thus,
DOLIDAR is playing an important role in coordinating DDCs and providing technical and
engineering support to them. MOLD is responsible for general oversight and monitoring of
the whole program.
We collected procurement and contract data from 155 rural road upgrading works in 19 Terai
districts assisted by the World Bank.2 Data were also collected from projects financed by the
government and other aid agencies. In each district, about 8 road contracts were
reviewed―half from World Bank-financed projects and half from government-owned
projects (Figure 3). Because of the selection criteria of the RAIDP, these districts have the
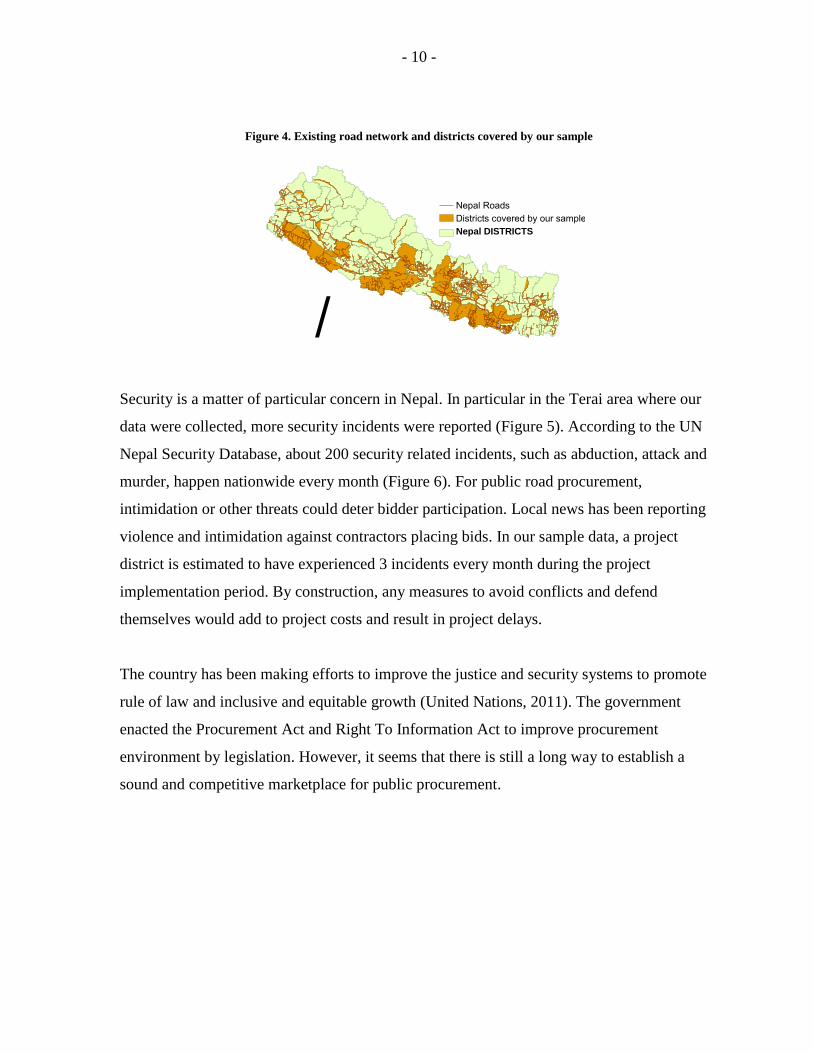
relatively high road-sector development performance and thus high road density (Figure 4).
Figure 3. Sample coverage by district
2 One of the 20 districts assisted by the RAIDP has not yet had road work contracts that can be evaluated at the
time of our data collection.
0
2
4
6
8
10
12
14
16
Ban
ke
Bar
diy
a
Dhad
ing
Dhan
usa
Kai
lali
Kap
ilvas
tu
Kas
ki
Mah
ott
ari
Mak
wan
pur
Naw
alpar
asi
Nuw
akot
Pal
pa
Rau
tahat
Rupan
deh
i
Sal
yan
Sar
lahi
Sir
aha
Syan
gja
Uday
apur
Num
ber
of
sam
ple
contr
acts
- 10 -
Figure 4. Existing road network and districts covered by our sample
Security is a matter of particular concern in Nepal. In particular in the Terai area where our
data were collected, more security incidents were reported (Figure 5). According to the UN
Nepal Security Database, about 200 security related incidents, such as abduction, attack and
murder, happen nationwide every month (Figure 6). For public road procurement,
intimidation or other threats could deter bidder participation. Local news has been reporting
violence and intimidation against contractors placing bids. In our sample data, a project
district is estimated to have experienced 3 incidents every month during the project
implementation period. By construction, any measures to avoid conflicts and defend
themselves would add to project costs and result in project delays.
The country has been making efforts to improve the justice and security systems to promote
rule of law and inclusive and equitable growth (United Nations, 2011). The government
enacted the Procurement Act and Right To Information Act to improve procurement
environment by legislation. However, it seems that there is still a long way to establish a
sound and competitive marketplace for public procurement.
/
Nepal RoadsDistricts covered by our sampleNepal DISTRICTS

- 11 -
Figure 5. Number of security-related incidents by district
Source: UN Nepal Security Database.
Figure 6. Number of security-related incidents in Nepal
Source: UN Nepal Security Database.
In general, governance matters to public procurement. In Nigeria, the majority of private
firms surveyed on perceptions of public sector procurement reforms answered that they
decided not to submit their expressions of interest in recent public tenders, because they did
not trust the selection process. There is a general perception that contractors are
predetermined or must pay a bribe. Particularly, integrity tends to be relatively weaker at the
subnational levels (World Bank, 2008c).
In Nepal, ethnicity may be another issue that might affect the bidders’ entry strategy in the
market. In Nepal there are 103 castes and ethnic groups.3 In some areas, a dominant ethnic
group accounts for nearly half the population in a district. There is a general perception that
3 In the 1991 census, there were 60 castes and ethnic groups in the country, some of which are re-categorized
into new groups in the 2001 census.
.
Security incidence per month (2006-2010)
0.05 - 0.280.29 - 0.650.66 - 1.031.04 - 1.581.59 - 2.532.54 - 3.903.91 - 5.685.69 - 13.35
0
50
100
150
200
250
300
2006
-01
2006
-04
20
06
-07
2006
-10
2007
-01
2007
-04
2007
-07
20
07
-10
2008
-01
2008
-04
20
08
-07
2008
-10
2009
-01
2009
-04
2009
-07
20
09
-10
2010
-01
2010
-04
2010
-07
2010
-10
- 12 -
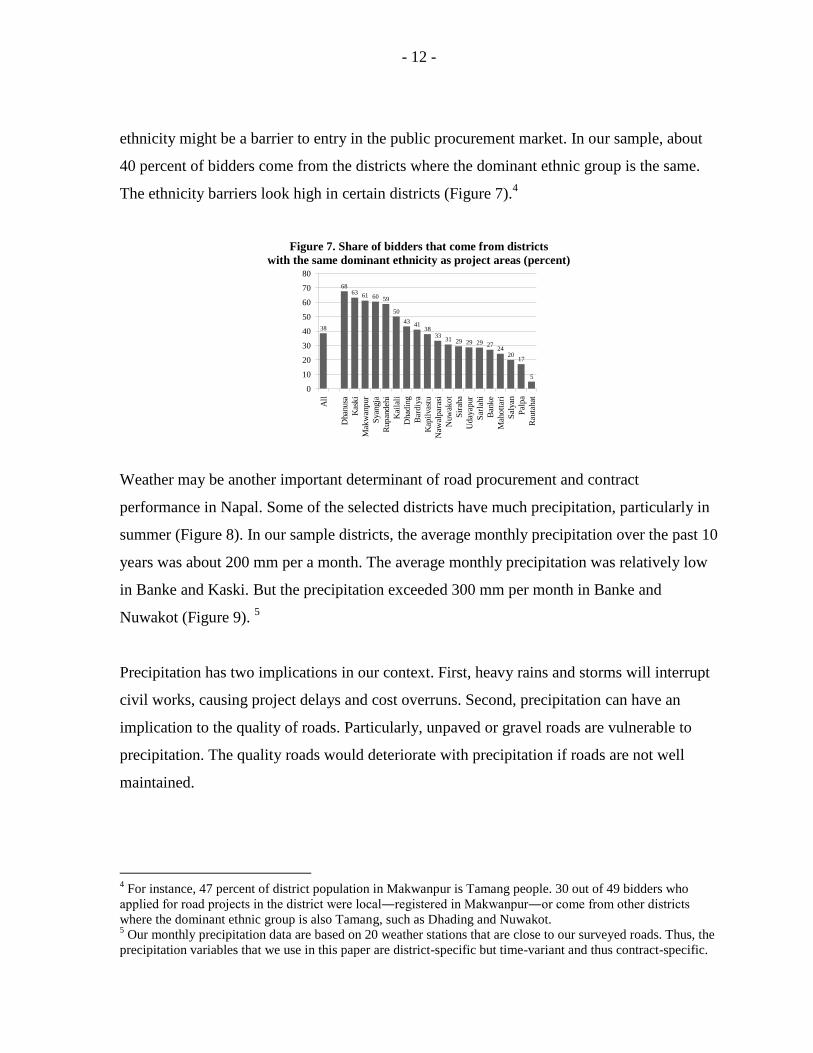
ethnicity might be a barrier to entry in the public procurement market. In our sample, about
40 percent of bidders come from the districts where the dominant ethnic group is the same.
The ethnicity barriers look high in certain districts (Figure 7).4
Figure 7. Share of bidders that come from districts
with the same dominant ethnicity as project areas (percent)
Weather may be another important determinant of road procurement and contract
performance in Napal. Some of the selected districts have much precipitation, particularly in
summer (Figure 8). In our sample districts, the average monthly precipitation over the past 10
years was about 200 mm per a month. The average monthly precipitation was relatively low
in Banke and Kaski. But the precipitation exceeded 300 mm per month in Banke and
Nuwakot (Figure 9). 5
Precipitation has two implications in our context. First, heavy rains and storms will interrupt
civil works, causing project delays and cost overruns. Second, precipitation can have an
implication to the quality of roads. Particularly, unpaved or gravel roads are vulnerable to
precipitation. The quality roads would deteriorate with precipitation if roads are not well
maintained.
4 For instance, 47 percent of district population in Makwanpur is Tamang people. 30 out of 49 bidders who
applied for road projects in the district were local―registered in Makwanpur―or come from other districts
where the dominant ethnic group is also Tamang, such as Dhading and Nuwakot. 5 Our monthly precipitation data are based on 20 weather stations that are close to our surveyed roads. Thus, the
precipitation variables that we use in this paper are district-specific but time-variant and thus contract-specific.
38
6863
61 60 59
50
4341
3833
31 29 29 29 2724
2017
5
0
10
20
30
40
50
60
70
80
All
Dhan
usa
Kas
ki
Mak
wan
pur
Syan
gja
Rupan
deh
i
Kai
lali
Dhad
ing
Bar
diy
a
Kap
ilvas
tu
Naw
alpar
asi
Nuw
akot
Sir
aha
Uday
apur
Sar
lahi
Ban
ke
Mah
ott
ari
Sal
yan
Pal
pa
Rau
tahat

- 13 -
Figure 8. Average monthly precipitation for the past 10 years
Source: Authors’ calculation based on data from the Ministry of Environment, Nepal.
Figure 9. Average monthly precipitation
Given these backgrounds, road procurement costs vary significantly across districts, though
the absolute levels remain low by global standards. The average unit cost of road upgrading
is about NRs1.6 million or $23,000 per km (Table 1), which is far below the range of unit
costs supported by the literature.6 This is mainly because of the project specifications. Our
sampled roads are mostly unpaved, gravel roads with simple surface treatment, if any. If an
additional surface material, such as otta seals, is added, the project cost increases by $3,000-
4,000 per km. Still, it is relatively cheap.
Normalized bids, which are bid prices relative to engineering cost estimates, vary from 0.55
in Dhanusa to 1.05 in Syangja (Figure 10). Normalized bids are a good indicator to
incorporate unobserved heterogeneity in road specifications. The average normalized bid is
6 An estimate of unit cost is about $410,000 per km (Fay and Yepes, 2003). Another is $390,000 for
rehabilitation and $360,000 for upgrading in Africa (Alexeeva, Padam and Queiroz, 2008). Foster and Briceno-
Garmendia (2010) also estimate the road rehabilitation cost at $200,000 to $500,000 per km, depending on
country and the scale of roads.
0
200
400
600
800
1000
1200
1 2 3 4 5 6 7 8 9 10 11 12M
on
thly
pre
cip
itat
ion (m
m)
Month
Siraha
Makwanpur
Banke
.
Average monthly precipitationin 2000-2009 (mm)
73
74 - 136
137 - 173
174 - 208
209 - 329
330 - 426

- 14 -
about 0.8, which means that the government’s engineering cost estimates are reasonable but
tend to slightly overestimate the true costs. The question is why some districts are spending
twice as high normalized costs as others. This paper will explore reasons.
Table 1. Average rural road contract and unit costs in Nepal
Obs Mean Std. Dev. Min Max
Actual payment per contract (million rupee) 156 7.76 7.95 0.14 39.89
Actual payment per km (million rupee) 156 1.63 2.32 0.02 21.97
Figure 10. Average normalized bid by district
Lack of competition may be one of the alleged concerns. The average number of bidders that
participated in competitive bidding is about 6. This appears consistent with the existing
literature. For highway construction auctions in Florida, the number of bidders ranged from 2
to 19, with an average of about 5 (Gupta, 2002). In Oklahoma, the average number of bidders
is 3.3 (De Silva, Dunne, and Kosmopoulou, 2003). In Africa, road auctions have an average
of 5 firms with a range of between 1 and 15. Most have 3 or 4 bidders (Alexeeva, Padam, and
Queiroz, 2008).
Average normalized bid
0.55 - 0.61
0.62 - 0.75
0.76 - 0.83
0.83 - 0.88
0.89 - 1.05
0.80
0.55
0.62
0.710.750.75
0.780.800.820.830.830.840.860.870.870.88
0.950.991.00
1.05
0.5
0.6
0.7
0.8
0.9
1.0
1.1
1.2
All
Dhan
usa
Mak
wan
pur
Sir
aha
Ud
ayap
ur
Pal
pa
Rup
and
ehi
Mah
ott
ari
Naw
alp
aras
i
Kap
ilvas
tu
Ban
ke
Sal
yan
Sar
lahi
Bar
diy
a
Nuw
ako
t
Dhad
ing
Kas
ki
Rau
tahat
Kai
lali
Syan
gja
Bid
/ C
ost
est
imat
e

- 15 -
In Nepal the level of competition varies considerably across regions. The average number of
bidders was only about 3 in Kailali and Rautahat. But competitive bidding in Dhanusa
attracted more than 9 firms on average (Figure 11). There is some broad consistency between
the level of competition and realized procurement costs. Where competition is limited,
normalized bids tend to be high.
Figure 11. Average number of bidders by district
Potential entrants do exist in the country, but they may be located unevenly across regions. If
firms that bought the bidding documents but decided not to submit bids are considered as
potential contractors, there are a number of prospective bidders particularly in the north of
Kathmandu and Western districts, such as Kailali and Bardiya. In these districts, only 2-3 out
of 10 potential contractors that bought the bidding documents submitted bids (Figure 12).
Figure 12. Participation rate of potential contractors
There are many possible reasons why these prospective firms did not enter the market. On
the physical side, firm location may matter (e.g., Porter and Zona, 1993; Price, 2008). There
are two potential implications. First, the entry costs may be high for firms located far from a
Average number of bidders
3.3 - 3.4
3.5 - 4.5
4.6 - 6.1
6.2 - 7.4
7.4 - 9.6
.
Participation rateof potential contractorsshowing initial interest
0.15 - 0.18
0.19 - 0.27
0.28 - 0.39
0.40 - 0.47
0.48 - 0.58

- 16 -
project site. They may not be familiar with local conditions around the site. They may not be
acquainted with potential contenders in the local market. Therefore, they may have to incur
more costs to prepare their bids. This can result in limiting the bidder participation.
Second, the cost of undertaking a project may also be high for those who are located far from
the project site. They may not have transaction with good local material suppliers.
Supervising the work from a distant place is generally more costly, because of higher
transportation and travel costs. It is usually costly to transport road work equipment, such as
paver, across regions, especially in the mountainous areas. In addition, skill and equipment
sets required may be different across regions; thus, applying for contracts in distant places
may add to production costs. This will be reflected in bid prices. Otherwise, firms may
simply decide not to enter the market.
In our data, a large number of bidders come from the nation’s capital, Kathmandu, and its
neighboring districts in the south (Figure 13). Fewer contractors may be willing to undertake
road works in distant places from Kathmandu. In such cases, contract prices may be high,
because of high transaction and mobilization costs of firms.
Figure 13. Number of bidders by origin district
Procurement planning is also an important element influencing the firms’ entry and bidding
decisions. In Nepal, most contracts assisted by the World Bank and other donors are fairly
small. How to (un)bundle project components is an important policy question to encourage or
discourage the bidder participation (Grimm and others, 2006). In theory, on one hand,
0
50
100
150
200
250
300
350
400
Kat
hm
andu
Ru
pan
deh
iC
hit
wan
Dh
anu
saM
akw
anp
ur
Lal
itp
ur
Kas
ki
Kap
ilv
astu
Ud
ayap
ur
Bar
diy
aS
yan
gja
Dh
adin
gN
awal
par
asi
Kai
lali
Ban
ke
Sir
aha
Pal
pa
Mah
ott
ari
Nu
wak
ot
Sar
lah
iIl
amP
arsa
Sal
yan
Kan
chan
pur
Su
nsa
riA
rgh
akh
anch
iD
adel
dhu
raD
ang
Deo
kh
uri
Ach
ham
Dai
lek
hD
ola
kha
Jaja
rko
tR
amec
hh
apS
apta
ri
Nu
mb
er o
f b
idd
ing fir
ms

- 17 -
smaller contracts may attract more contractors that are relatively small yet specialized. On
the other hand, dividing a project into smaller contracts will sacrifice potential economies of
scale in procurement and production.
There exists a rule of thumb for how to divide tasks, but significant flexibility in procurement
planning is left to procurers.7 Our sample data show the mixed relationship between the size
of contracts and the number of bidders. For relatively small contracts, participants increased
in number with the size of contracts (Figure 14). This may be because small contracts are too
costly for firms to undertake, given their high transaction and mobilization costs for small
contracts. In addition, economies of scale exist in procurement (Figure 15).8 As a result, the
unit costs of road procurement tend to be high for small contracts, as shown in the case of
Africa (e.g., Foster and Briceno-Garmendia, 2010).9 But the number of participants may
decline when the length of contracted roads increases further. Thus, more formal analysis is
needed to investigate this tradeoff between the competition effect and economies of scale in
procurement.
Figure 14. Average number of bidders by contract size (road length)
7 The World Bank’s current procurement guidelines stipulate that ―[t]he size and scope of individual contracts
will depend on the magnitude, nature, and location of the project. For projects requiring a variety of goods and
works, separate contracts generally are awarded for the supply and/or installation of different items of
equipment and plant.‖ 8 Some of the statistical outliers are omitted, such as 2 observations with unit bid prices greater than NRs7.9
million. 9 A construction work of a more than 50 km road would cost $290,000 per km, but it would be $400,000 if it is
less than 50 km (Foster and Briceno-Garmendia, 2010).
5.6
6.7
5.6
3.3
0
1
2
3
4
5
6
7
Less than 5 km 5 to 10 km 10 to 20 km More than 20
kmLength of roads

- 18 -
Figure 15. Contract size and winning bid per km
Efficiency in road contracting in Nepal may be favorably compared to other low-income
countries, especially in Africa, where the average time required to award a contract after the
bid opening ranges from 2-3 months to nearly a year (Table 2). In Nepal, the bid evaluation
takes on average about 65 days. But it varies across districts, ranging from 30 days in
Nawalparasi and Nuwakot to 100 days in Mahottari, Palpa and Rautahat (Figure 16). The
difference may depend on technical conditions, such as the complexity of works, and the
number of bids to be assessed. But the lengthy evaluation process is clearly a matter of
concern, because it would inflate the procurement costs and reduce the transparency of the
process.
Table 2. Average time required to sign a road contract after the bid opening in low-income countries in Africa
Avg. time
(days)
Congo, Democratic Rep. of 71.2
Madagascar 88.8
Ghana 153.1
Zambia 187.9
Ethiopia 207.4
Mozambique 220.6
Tanzania 253.7
Malawi 261.5
Uganda 326.3
Kenya 348.0
Source: Alexeeva, Padam, and Queiroz, 2008.
ln( winning bid per km ) = 0.998 - 0.837 ln(road length)
R² = 0.1693
0
1
2
3
4
5
6
7
0 10 20 30 40
Win
nin
g b
id p
er k
m (
mil
lio
n R
s)
Road length (km)

- 19 -
Figure 16. Efficiency in contract awarding by district
In Nepal, ex post contract adjustments appear relatively moderate in financial terms, but
many projects incurred significant delays. Infrastructure contracts are often far from
complete and experience massive cost overruns and project delays. About 30 percent of PPP
infrastructure transactions underwent renegotiation within two years after being awarded
(Guasch, 2004). Some adjustments are necessary because of unanticipated technical
difficulties, but others may be caused by the firms’ opportunistic low-balling strategy (Ware
and others, 2007). In the transport sector, 9 out of 10 projects experienced cost overruns
(Flyvbjerg and others, 2002). Project delays also add to cost overruns. Each year of delay
would add on average $4.6 million to a project cost of $100 million in the transport sector
(Flyvbjerg et al., 2004).
In our sample, the road projects experienced considerable delays, but cost overruns were
relatively small. Road contracts experienced a delay of 104 days on average. About 10
percent of projects experienced more than 1 year of delay (Figure 17). About 45 percent of
contracts incurred cost overruns, which range from several percent to 20 percent of the
original contract amounts. About 20 contracts experienced cost underruns, mostly because
the scope of the work was reduced (Figure 18). Since our sample projects are relatively
simple rural road rehabilitation works, unexpected geotechnical issues are unlikely to cause
cost overruns. The low-balling strategy may also be difficult, because there may be little
room to justify cost adjustments due to technical reasons.
But projects can be delayed for several reasons. Civil works may be delayed by heavy rain at
the project sites, as discussed above. Another possibility is the low-balling strategy counting
.
Number of days requiredto award a contract
36 - 44
45 - 57
58 - 69
70 - 79
80 - 110

- 20 -
on ex post project delays. Firms can propose an unrealistic schedule and then diminish their
efforts to accomplish a work on schedule, causing delays.
Figure 17. Project delays (number of days)
Figure 18. Cost overruns relative to the original contract amount
The contract performance differs across districts (Figure 19). Some districts are better at
managing road contracts than others. The average cost overrun rates are 7 to 9 percent in
Rautahat, Mahottari and Udayapur. But other districts, such as Banke and Kailali, have very
small cost overruns less than 3 percent. The difference may be able to be explained for both
internal and external reasons. On one hand, the government effectiveness may be different at
the local level. The implementation capacities of district-level executing agencies, DDCs, are
relatively high in our sampled districts. Still, their capabilities of managing and supervising
contracted works may differ. On the other hand, weather and security issues are external
factors that may affect the contract performance. These are generally beyond the capabilities
of DDCs to manage contracts.
0
.001
.002
.003
.004
.005
Den
sity
0 500 1000 1500Delay
0
.05
.1.1
5.2
Den
sity
-20 -10 0 10 20CostOverrunRate

- 21 -
Figure 19. Cost overruns rate (%)
Finally, the quality of roads that were upgraded and have been used differs across districts.
We classified road conditions into four categories: (i) very uncomfortable, (ii) uncomfortable,
(iii) fairly comfortable, and (iv) very comfortable (Table 3). This is a subjective rating but
based on the field survey. Transport specialists actually drove on each road and evaluated the
quality of roads. Despite our small sample size (per district), there is a clear trend: The
quality of roads is relatively low around the nation’s capital, possibly because of the large
traffic volume, weather conditions and other institutional factors (Figure 20).
Table 3. Road quality rating criteria
Rating Condition
4 Very comfortable throughout the entire road segment
3 Fairly comfortable though occasionally jolting
2 Uncomfortable with frequent shakes
1 Very uncomfortable with continuous shakes and frequent slowdown and stops
Figure 20. Average road quality rating
.
Cost overrun rate relative to original contract amount
-1.32 - 0.18
0.19 - 3.00
3.01 - 4.91
4.92 - 7.79
7.80 - 9.39
.
Road quality rating(4 is the best; 1 is the lowest)
1.66 - 2.00
2.01 - 2.40
2.41 - 2.55
2.56 - 2.90
2.91 - 3.16

- 22 -
III. EMPIRICAL MODELS AND DATA
Bid equation
To formally investigate the bidding behavior in the road procurement market, the following
symmetric equilibrium bid function is considered based on the empirical auction literature
(e.g., Porter and Zona, 1993; Gupta, 2002; Estache and Iimi, 2009, 2010):
itiitit
tttit
WethinicityDdist
Xoresecritybefnumbid
')(ln
'lnlnln
43
21
(1)
where bidit is the amount of evaluated bid―both winning and losing― submitted by bidder i
on road contract t. In the first-price sealed-bid format, both winning and losing bids are
equally informative to estimate the equilibrium bid. num is the number of bidders who
participated in the auction.
The functional form is consistent with both auction theory and the existing empirical auction
literature to capture the competition effect associated with num. In theory, the bidding
strategy depends on the level of competition (e.g., Wilson, 1977; Milgrom and Weber, 1982;
Wolfstetter, 1996). Under the standard setting, bids are expected to approach the lowest
possible market price, as the number of bidders increases. This is because the probability that
a bidder wins a contract with a given bid price would decline, as the number of participants
increases. Under a certain distributional assumption for the private costs, the competition
effect would diminish in a convex fashion, as the number of bidders increases. On the
empirical side, auctions have been supportive of the competition effect and the effect tapers
off quickly as the number of bidders grows. This is why many empirical auction papers
model the effect under the logarithmic specification (e.g., Kessel, 1971; Brannman and others,
1987; Paarsch, 1992; Iimi, 2006). As per Rezende (2005), the mapping between winning bids
and the number of bidders is never linear.

- 23 -
At first glance, our sample data also seem to support the fact that competitive pressure exists
in the road procurement market of Nepal. Although the level of competition is still low, the
bids relative to engineering cost estimates tend to decline, as the competition increases
(Figure 21). Of course, however, this is merely on a simple correlation basis; the competition
effect has to be tested formally by estimating Equation (1).
Figure 21. Competition and normalized bids
To capture the impact of security issues, securitybefore is included, which is defined by the
number of security-related incidents in a project host district during the three months prior to
the auction. Note that this is constructed based on the information of incidents before each
auction. This is the best information that potential bidders can know and incorporate in their
bid calculation. Based on the past history of security incidents, they are assumed to estimate
the likelihood of similar future incidents.
X controls for other contract-specific technical characteristics, such as engineering cost
estimates, length of roads, width of the road, thickness of the surface, and used materials (see
Table 4 for details).10
Note that the engineering cost estimate, which is calculated by DDCs
prior to public tendering, is included in X to control the observable and unobservable size
10
A small but positive value is used to avoid logarithms of zero in independent variables, if they are zero.
ln(bid /cost) = 1.741 - 0.222 ln(num)
R² = 0.1927
0.0
0.5
1.0
1.5
2.0
2.5
0 5 10 15
Bid
/ C
ost
est
imat
e
Number of bids

- 24 -
effect of contracts.11
X also includes a binary variable to indicate whether an auction includes
the ex post quality evaluation process to exclude technically unreliable bids. About 90
percent of our sampled auctions adopted this mechanism. To control other district-level
unobservables, we include 18 dummy variables to indicate project districts.
To account for heterogeneity across bidders, we include the distance―denoted by
dist―between a project site and a contractor’s location, which is calculated as a straight line
distance between the two district capitals. This is merely an approximation; it is not the exact
distance that individual contractors would have to go and work if awarded. Intuitively, it
would be more costly to supervise any public work from a distant location. In addition, as
discussed, ethnicity may be one important factor determining the bidding strategy in Nepal.
D(ethnicity) is set to one if the dominant ethnicity is the same between a project host district
and a bidder’s home district. Dummy variables indicating bidders’ origin districts are also
included in W. Firms may have unobserved comparative advantages. Local firms may have
the cost and information advantage to supervise a project. Firms outside the district may have
more work experience and stronger financial background.
Table 4. Summary statistics
Variable Abbreviation Obs Mean Std.
Dev. Min Max
Bid equation:
Evaluated bid amount (NRs million) bid 599 13.70 70.90 0.27 1410.00
Number of bidders num 106 5.86 4.04 1 15
Number of security incidents during the
three months prior to each tender
securitybefore 106 10.95 10.21 0 38
Line distance between project and firm
origin districts
dist 599 121.74 159.28 0 762.57
Dummy for the same dominant ethnicity
between project and firm origin districts
D(ethnicity) 599 0.48 0.50 0 1
Engineering cost estimate (NRs million) cost 106 9.22 9.80 0.32 39.40
Length of roads (km) length 106 8.64 5.44 0.20 34.00
Number of lanes lane 106 1.05 0.21 1 2
Thickness of road surface (mm) thickness 106 7.11 9.33 0 50
Gravel (m3) gravel 106 2279.6 2900.4 0 18600.0
11
An alternative is to regress the normalized bid on contract characteristics. However, our model is considered
more flexible, since this alternative specification assumes that the coefficient of the engineering cost estimate is
equal to one, which is not necessarily the case in general.

- 25 -
Bitumen (kg) bitumen 106 4762.4 14122.5 0 79029.6
Earthworks (m3) earth 106 6742.0 12665.7 0 93403.0
Brickworks (m3) brick 106 45.2 165.5 0 1204.1
Gabion (m3) gabion 106 238.6 856.4 0 8400.0
Excavation (m3) excavation 106 2952.1 5319.8 0 29266.6
Cement concrete (m3) cement 106 32.7 74.5 0 507.8
Dummy variable for postqualification of
bids
D(postqualify) 106 0.92 0.28 0 1
Bidder participation:
Number of bidders purchasing bidding
documents
bdnum 118 22.53 17.93 4 107
Price of bidding documents bdcost 118 1547.6 1044.6 290.5 3576.1
Bid preparation period (days) bdpreptime 118 25.94 9.25 6 52
Efficiency in contract awarding:
Number of days required to award a
contract
dayscontracting 154 64.66 47.46 1 190
Contract management:
Cost overrun rate (percent) overrun 155 3.73 6.25 -14.83 21.69
Project delay (days) delay 152 107.25 208.09 -76 1217
Number of security incidents during the
project implementation
securityduring 152 33.86 47.06 0 280
Precipitation during the project
implementation (mm)
rainduring 155 1652.22 1724.13 0 8774.2
Difference between the winning bid and the
second lowest bid (NRs million)
lowball 142 -0.32 2.70 -29.60 6.29
Project quality:
Confortability rating (1 to 4) rate 136 2.63 0.60 1 4
Average traffic speed (km per houir) speed 148 24.71 10.13 7.50 57.00
Number of days for which a road has been
used since the project completion
age 136 794.32 497.60 11 2656
Cumulative traffice since the project
completion
traffic 132 150802 153255 0 807884
Number of security incidents after the
project completion
securityafter 133 81.94 79.05 0 377
Precipitation after the project
implementation (mm)
rainafter 136 4953.4 3591.9 0.0 18223.2
Bidder participation
One of the most important empirical issues in estimating Equation (1) is that the number of
bidders, num, is likely to be endogenous. Basic auction theory assumes it fixed. In reality,
however, contractors may or may not enter the market for many reasons. Endogenous auction
theory suggests that the entry cost would determine how many bidders would participate in

- 26 -
an auction. If a fixed positive cost is required for participating in an auction, bidders will
enter until their expected profits are driven to the entry cost. At this level no more firms can
expect nonnegative profits from new entry. Therefore, the bidder participation can be
increased by reducing the entry costs or by raising the profit guaranteed to the least efficient
bidder in the procurement market (McAfee and McMillan, 1987; Levin and Smith, 1994;
Menezes and Monteiro, 2000).
In practice, the bidder participation is a dynamic process. Some firms may decide not to enter
the market, even though having shown initial interest. Other contractors may be disqualified
for technical reasons, even if they wanted to participate in the competition. Our sample data
show that the vast majority of firms in Nepal are giving up the opportunity to participate in
public tenders and engage in public works. At the initial stage, about 23 firms on average
bought the bidding documents; but only 6 firms applied to the formal process. After the
technical evaluation, 5 bids were compared for determining the winner (Figure 22).
Figure 22. Change in the number of bidders over the procurement process
The question is why they decided not to apply for public tenders, though showing initial
interest. To address this bidder participation problem, the following entry equation is
considered:
),,( tttt ZXforesecuritybefnum (2)
23.5
6.05.2
0
5
10
15
20
25
Number of firms
buying bidding documents
Number of
applying bidders
Number of
technically qualified bidders

- 27 -
Equation (2) can be estimated by a generalized count regression model, i.e., zero-truncated
negative binomial model, because the observed number of bidders num is a positive integer
and typical of count data (e.g., Li and Perrigne, 2003; Li and Zheng, 2006; Ohashi, 2009).
The bidder participation is assumed to depend on security conditions, auction design,
contract size, and other project-specific technical characteristics in X. As discussed, the
impact of security issues is of particular concern in Nepal. Aggravating security might be
discouraging firms from applying for public tenders. Z is a vector of instrument variables that
particularly affect the firms’ entry decisions. The equation can also be estimated as a first
stage regression, when the bid function is estimated with the number of bidders instrumented
directly by Z.
Another approach to estimate the bidders’ entry strategy is a binary probability model where
each bidder’s decision about whether to apply for a public tender is regressed on explanatory
variables. Letting a binary variable, entryit, be 1 if bidder i participates in auction t and zero
otherwise, the probability of bidder i’s participating in auction t is:
),,),(,,(1)0Pr(
),,),(,,()1Pr(
tititittit
tititittit
ZWXethnicityDdistforesecuritybeentry
ZWXethnicityDdistforesecuritybeentry
(3)
In this case, bidder-specific characteristics, such as dist and ethnicity, can be incorporated in
the model.
Following the endogenous auction literature, three instruments are considered for Z: (i) the
number of prospective contractors who can potentially apply for each tender, (ii) costs of
bidding documents, and (iii) the length of bid preparation periods.
The first instrument is the number of firms who bought the bidding documents (denoted by
bdnum). This is considered as the maximum number of contenders that could participate in
each auction. The underlying idea is the same as the use of the number of plan holders or

- 28 -
eligible bidders in the existing literature (e.g., Haile, 2001; Paarsch, 2007; De Silva, Dunne,
Knkanamge & Kosmopoulou, 2008). In our case, the number of firms requesting the bidding
documents or applying for the prequalification is determined prior to the submission of bids.
As shown in Figure 20, some firms may not apply, and others may be disqualified. But the
number of firms purchasing the bidding documents can be a good proxy of the potential pool
of bidders.
Second, the price of bidding documents (denoted by bdcost) is included in Z. Theory
suggests that potential firms may not participate in public tenders, because there are some
implicit and/or explicit costs of entry. The cost of bidding documents may not be
economically significant but surely adds to the entry costs. In Nepal, bidding documents cost
NRs300 to NRs3,500 with an average of NRs1,800 or $25 in our sample.
Finally, the number of days granted contractors to prepare bids (denoted by bidpreptime) is
included in Z. The longer bid preparation period can reduce the entry costs for potential
contractors, particularly inexperienced firms. In addition, one of the yellow flags that may
signal corruption or collusion is that an invitation to bid is published just a few days or a few
weeks before bids have to be submitted (Ware et al., 2007). The World Bank Procurement
Guidelines stipulate ―[g]enerally, not less than 6 (six) weeks from the date of the invitation to
bid or the date of availability of bidding documents, whichever is later, shall be allowed for
ICB. Where large works or complex items of equipment are involved, this period shall
generally be not less than 12 (twelve) weeks to enable prospective bidders to conduct
investigations before submitting their bids.‖12
Our data seem to be supportive of the view that
the too short time for the bid preparation could restrain the bidder participation (Figure 23).
12
The World Bank’s Guidelines: Procurement under IBRD Loans and IDA Credits, Clause 2.44 (pp. 21).

- 29 -
Figure 23. Average number of bidders by duration of bid preparation
Efficiency in contracting
One of the possible disadvantages of attracting more bids is that the administrative cost of
procurers would increase with the number of applicants. Technical complexity in public
works may also add to the time required to evaluate bidders and bids. However, the lengthy
procurement process tends to lack transparency and raise procurement costs. Inefficient
contracting would also lead to ex post adjustments, because of inflated input prices during
the lengthy process.
To measure the administrative efficiency in contracting, the following equation is considered:
ttt Xforesecuritybenumctingdayscontra 'lnlnln 21 (4)
where dayscontracting is defined by the number of days required to award a contract after
the bid opening date. In Nepal, the time required to evaluate bids and award (or sign) a
contract seems to increase proportionally with the number of bids received. On a simple
correlation basis, one additional bid might add 12 days on average to the evaluation period
(Figure 24).
Contrary to our prior expectation, the time for the bid evaluation seems to proportionally
decrease, not increase, with the size of contracts (Figure 25). Smaller contracts require more
4.6
5.6
9.2
0
2
4
6
8
10
Less than
3 weeks
3 weeks
to 1 month
More than
1 month

- 30 -
time to be awarded. This may raise concern about governance in public procurement and
political interference, because there is a view that smaller contracts are often prepared using
weaker, less formal, and less transparent procedures than those used for large contracts. As a
result, the stakeholders involved have difficulty disputing formally, and this motivates
corruption among both public officials and private contractors (World Bank, 2008a). If this is
the case, it takes longer to negotiate with the lowest evaluated bidder and award a contract
for smaller works.
Related to the above, security-related incidents, such as intimidations and complaints, may
retard the bid evaluation process. Note that our security variable, securitybefore, is an
approximation, since there is no available data representing the actual incidence that is
specifically related to the public road procurement. But our security proxy is expected to
capture unobserved obstructions through the bid evaluation procedures.
Figure 24. Average time between the bid opening and the contract award by level of competition
Figure 25. Average time between the bid opening and the contract award by contract size
42.1
60.1
90.7
0
10
20
30
40
50
60
70
80
90
100
Less than 4 4 to 6 More than 6
Nu
mb
er o
f d
ays
Number of bidders
76.7
61.2
45.4
25.3
0
10
20
30
40
50
60
70
80
90
Less than
5 km
5 to 10 km 10 to 20 km More than
20 km
Nu
mb
er o
f d
ays
Length of roads contracted out

- 31 -
Contract management
Good procurement and efficient contracting are necessary but may not be sufficient to ensure
the delivery of quality services as originally planned. Many infrastructure projects in fact
incur massive cost overruns and project delays. To examine why these post-award
adjustments happened, the following equation is examined:
ttt
ttttt
Xctingdayscontra
lowballnumrainduringringsecurityduY
'ln
lnlnlnlnln
5
4321
(5)
where Y is a measurement of ex post adjustments, for which we use two variables: the rate of
cost overruns relative to the original contract amount (denoted by overrun) and the number of
days by which a project delayed (denoted by delay).
Ex post adjustments depend on technical factors. For instance, ex post adjustments are likely
to happen if contracts are technically complex and involve greater project risks. This will be
captured by X in Equation (5). In Nepal, larger-size contracts seem to have more significant
cost overruns. Cost overruns were minimal if the contract amount is less than NRs5 million
or $70,000. Beyond that level, significant cost overruns are likely to occur (Figure 26).
Similarly, larger contracts seem to be more likely to be delayed. The projects, of which the
contract values exceed NRs5 million, delayed by 100-250 days on average (Figure 27).
Figure 26. Cost overruns and size of contracts
0.4
-0.1
7.5
25.3
-5
0
5
10
15
20
25
30
Less than
Rs 1 mil
Rs 1 to
5 mil
Rs 5 to
10 mil
More than
Rs 10 mil
Per
cen
t of
ori
gin
al c
on
trac
t am
ou
nt
Size of contract

- 32 -
Figure 27. Project delays and size of contracts
Weather may be another potential determinant of post-award adjustments on the technical
side. This is clearly an exogenous factor. In Nepal, heavy rain is one of the major constraints
to project completion without delay. Thus, the amount of cumulative precipitation during the
project implementation period, rainduring, is included in our models. On a simple correlation
basis, our data appear to suggest that increased precipitation would cause cost overruns and
project delays in the country (Figures 28 and 29).
One may think that unexpected increases or decreases in precipitation are more relevant to
post-award contract adjustments than actual levels of precipitation. The reason is that
potential contractors may already have anticipated normal precipitation and reflected it to
their bids. If this is the case, actual precipitation may not impact on cost overruns or project
delays. To test this possibility, another variable unexpectedrain is constructed by subtracting
the average monthly precipitation in the one-year period prior to each tender from the actual
precipitation per month during the project implementation period.
Figure 28. Cost overruns and precipitation during project implementation
10.7
40.3
247.2
99.9
0
50
100
150
200
250
300
Less than
Rs 1 mil
Rs 1 to
5 mil
Rs 5 to
10 mil
More than
Rs 10 mil
Pro
ject
del
ay (d
ays)
Size of contract
-0.5
2.4
5.4
6.3
-1
0
1
2
3
4
5
6
7
Less than
500 mm
500 mm to
1,000 mm
1,000 mm to
2,000 mm
More than
2,000 mm
Per
cen
t of
ori
gin
al c
on
trac
t am
ou
nt
Total precipitation during work period

- 33 -
Figure 29. Project delays and precipitation during project implementation
As discussed, security is a major concern for contractors in Nepal. Strikes and intimidations
would likely cause significant delays of rural road projects in Nepal. Thus, Equation (5)
includes the number of security-related incidents during the project implementation period,
denoted by securityduring. Note that this is not the same as the security variable that is used
above. securityduring is defined by the number of incidents that actually happened during the
project period. For the same reason as unexpectedrain, we also construct the number of
unexpected security incidents during the project implementation period, compared to the
monthly average during the one-year period prior to the bid submission (unexpectedsecurity).
In our sample, one-third of the contracts experienced some delays due to security concern or
strikes. If more than 40 security incidents occurred in a project district during the project
implementation period, the project is likely to experience about 7 percent of cost overruns,
which are relatively large in our sample (Figure 30). In addition, the projects are likely to
delay as well (Figure 31).
Figure 30. Cost overruns and security incidents during project implementation
1.611.2
73.9
305.1
0
50
100
150
200
250
300
350
Less than
500 mm
500 mm to
1,000 mm
1,000 mm to
2,000 mm
More than
2,000 mmP
roje
ct d
elay
(d
ays)
Total precipitation during work period
2.1
5.7
6.9
0
1
2
3
4
5
6
7
8
Less than 20 20 to 40 More than 40
Per
cen
t of
ori
gin
al c
on
trac
t am
ou
nt
Number of security-related incidents during project
implementation period

- 34 -
Figure 31. Project delays and security incidents during project implementation
Ex post contract adjustments may also be influenced by other institutional factors. One issue
is that post-award contract adjustments may result from excess competition at the market.
This is considered as a ―winner’s curse‖ phenomenon (e.g., Kagel and Levin, 1986;
Klemperer, 1998; Hong and Shum, 2002; Athias and Nunez, 2006). If competition at the
auction is intense, bidders are forced to be more aggressive. It may turn out that the winner
was too optimistic. This will be captured by num. Our data indicate a certain possibility of
this winner’s curse. At the low level of competition, bidders seem to be induced to be more
aggressive under competitive pressure, which results in cost overruns (Figure 32). Intense
competition may also result in project delays. This is observed partly at the relatively high
level of competition involving more than 6 contenders (Figure 33).
Figure 32. Cost overruns and number of bidders
35.145.5
310.1
0
50
100
150
200
250
300
350
Less than 20 20 to 40 More than 40
Pro
ject
del
ay (d
ays)
Number of security-related incidents during project
implementation period
2.5
4.4 4.4
0.0
0.5
1.0
1.5
2.0
2.5
3.0
3.5
4.0
4.5
5.0
Less than 4 4 to 6 More than 6
Per
cen
t of
ori
gin
al c
on
trac
t am
ou
nt
Number of bidders
- 35 -
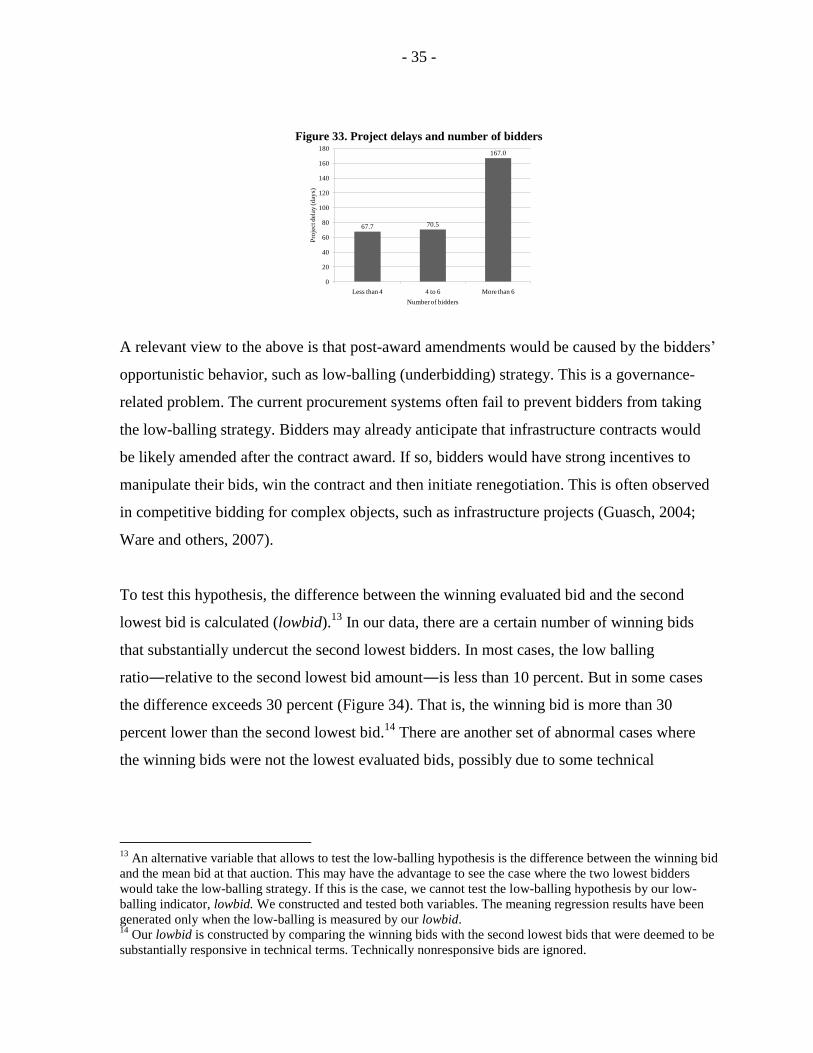
Figure 33. Project delays and number of bidders
A relevant view to the above is that post-award amendments would be caused by the bidders’
opportunistic behavior, such as low-balling (underbidding) strategy. This is a governance-
related problem. The current procurement systems often fail to prevent bidders from taking
the low-balling strategy. Bidders may already anticipate that infrastructure contracts would
be likely amended after the contract award. If so, bidders would have strong incentives to
manipulate their bids, win the contract and then initiate renegotiation. This is often observed
in competitive bidding for complex objects, such as infrastructure projects (Guasch, 2004;
Ware and others, 2007).
To test this hypothesis, the difference between the winning evaluated bid and the second
lowest bid is calculated (lowbid).13
In our data, there are a certain number of winning bids
that substantially undercut the second lowest bidders. In most cases, the low balling
ratio―relative to the second lowest bid amount―is less than 10 percent. But in some cases
the difference exceeds 30 percent (Figure 34). That is, the winning bid is more than 30
percent lower than the second lowest bid.14
There are another set of abnormal cases where
the winning bids were not the lowest evaluated bids, possibly due to some technical
13
An alternative variable that allows to test the low-balling hypothesis is the difference between the winning bid
and the mean bid at that auction. This may have the advantage to see the case where the two lowest bidders
would take the low-balling strategy. If this is the case, we cannot test the low-balling hypothesis by our low-
balling indicator, lowbid. We constructed and tested both variables. The meaning regression results have been
generated only when the low-balling is measured by our lowbid. 14
Our lowbid is constructed by comparing the winning bids with the second lowest bids that were deemed to be
substantially responsive in technical terms. Technically nonresponsive bids are ignored.
67.7 70.5
167.0
0
20
40
60
80
100
120
140
160
180
Less than 4 4 to 6 More than 6
Pro
ject
del
ay (d
ays)
Number of bidders

- 36 -
reasons.15
In these cases, the difference between the winning bid and the second lowest bid
can be negative.
Figure 34. Difference between winning bid and second lowest bid (%)
Ex post adjustments can also be related to the effectiveness of procurers to evaluate bids and
bidders. One common view is that procurers would be bothered with a number of addenda, if
the bid qualification process is compromised at the bid evaluation stage. If this is the case,
the shorter bid evaluation period would likely result in a larger number of contract
amendments. This is tested by our inefficiency measurement, dayscontracting, in Equation
(5). Note that contracting with incompetent and faithless contractors is costly in particular in
infrastructure projects. For example, in Madagascar, three road contracts were re-bided
because of the unacceptably low quality of the contractor’s performance. However, the
contract cost turned out 37 percent higher than the original contract, when the contractor was
reselected. This is because the costs of inputs, such as fuel and cement, increased during the
procurement delay (Alexeeva, Padam, and Queiroz, 2008).
Quality of projects
Finally, the quality of project delivered is investigated:
15
Based on the collected data, no detailed reasons are known.
0.1
.2.3
.4
Den
sity
-10 0 10 20 30 40Low balling ratio (%)

- 37 -
),,,,( tttttt XrainaftertersecurityaftrafficagefQ (6)
To measure the quality of roads, Q, we use two measurements. One is a subjective indicator,
which is a rating to by transport specialists who drove on the road, i.e., ratet={1, 2, 3, 4}.16
In
this case, the ordered probit model is used to estimate Equation (6), because rate is an
ordered discrete variable. Another measurement for Q is a more objective indicator, i.e., the
average speed at which a normal vehicle actually ran on the rehabilitated or upgraded road
(lnspeed). In this case, the equation can be estimated by the ordinary (log)linear regression.
The quality of roads must of necessity depend on technical factors, such as the volume of
traffic and how long the road has been used. In general, roads are deteriorating over time
(Figure 35). age is the number of days for which the road has been used since the project was
completed. In addition, heavy traffic would cause more road deterioration. The cumulative
traffic volume, traffic, can be calculated by age multiplied by the average daily traffic (ADT),
which was measured for each road segment by field visit.
The road condition may depend on weather, especially, precipitation. More precipitation
would cause deterioration on the road surface. The cumulative amount of precipitation after
the project completion, rainafter, is included in the model.
The quality of roads also depends on whether they are maintained periodically. As discussed
above, roads are deteriorating anyway. The periodical maintenance is essential to keep the
road quality high. To this end, security issues may be a potential problem. If security concern
is severe, roads would not be able to be maintained properly. Therefore, the cumulative
number of security-related incidents that occurred in each project district is also included in
the model, denoted by securityafter.
16
The rating has four grades: (i) very uncomfortable with continuous shakes and frequent slowdown and stops, (ii)
uncomfortable with frequent shakes, (iii) fairly comfortable though occasionally jolting, and (iv) very comfortable
throughout the entire road segment.

- 38 -
Figure 35. Average road quality rating by road age
Note: Rate 4 is the best quality and 1 is the lowest.
IV. MAIN ESTIMATION RESULTS AND POLICY IMPLICATIONS
Equilibrium bid function
The equilibrium bid function is first estimated by an ordinary least squares (OLS) technique.
As theory predicts, the coefficient of the number of bidders is negative (Table 5). However,
this may potentially be biased, because the endogeneity of the bidder participation is not
controlled.
With the endogeneity taken into account, the competition effect has been found to be
significant. The two-stage least squares (2SLS) regression, in which the number of bidders is
replaced with the predicted value from a zero-truncated negative binomial model, provides a
consistent estimate of the bid function. The bid elasticity with respect to competition is
estimated at -0.285. Thus, if competition is intensified by 10 percent, bids are estimated to
decline by 2.8 percent. The instrumental variable (IV) regression where the number of
bidders is directly instrumented by Z (and other exogenous variables) shows the same result.
The more competition, the lower procurement costs. In this model, the elasticity is slightly
higher (in absolute terms) at -0.338.
2.62
2.73 2.74
2.61
2.57
2.45
2.50
2.55
2.60
2.65
2.70
2.75
2.80
Less than
6 months
6 months to
1 year
1 to 2
years
2 to 3
years
More than
3 years
Length of roads

- 39 -
The estimation results also show that security concern is a cost factor in Nepal. The
coefficient of securitybefore is positive and significant across all the models. Thus, when
security concern is high around a project area, firms would increase their bid prices. This
implies that potential contractors would likely anticipate increases in project costs in insecure
areas, either due to expected project delays or because they have to take security measures to
prevent incidents. The elasticity of bid prices with respect to security incidence is about 0.23.
Engineering cost estimates turned out to be a good proxy of the actual bid amounts, after
other specification differences are controlled.17
The estimated coefficient is close to one in all
the models. This is a good indication for the procurement planning capacity of district-level
road agencies, DDCs. Contrary to our prior expectation, the firm location does not seem to be
an important factor to determine bid prices. One empirical possibility is that the potential
distance effect may have been captured by a combination of bidder location and project site
dummy variables. In fact, if all the dummy variables for bidder and project locations are
excluded, the significance of lndist increases. But the p-value is 0.15, above the conventional
threshold; thus, the impact of distance is still weak. Ethnicity does not affect bid prices, either.
17
The principal component analysis identified the engineering cost estimate as the most influential variable
among our independent variables representing technical specifications of projects. The vast majority of the
differences in technical specifications can be explained by the engineering cost estimate, followed by some
input variables, such as gravel and gabion.
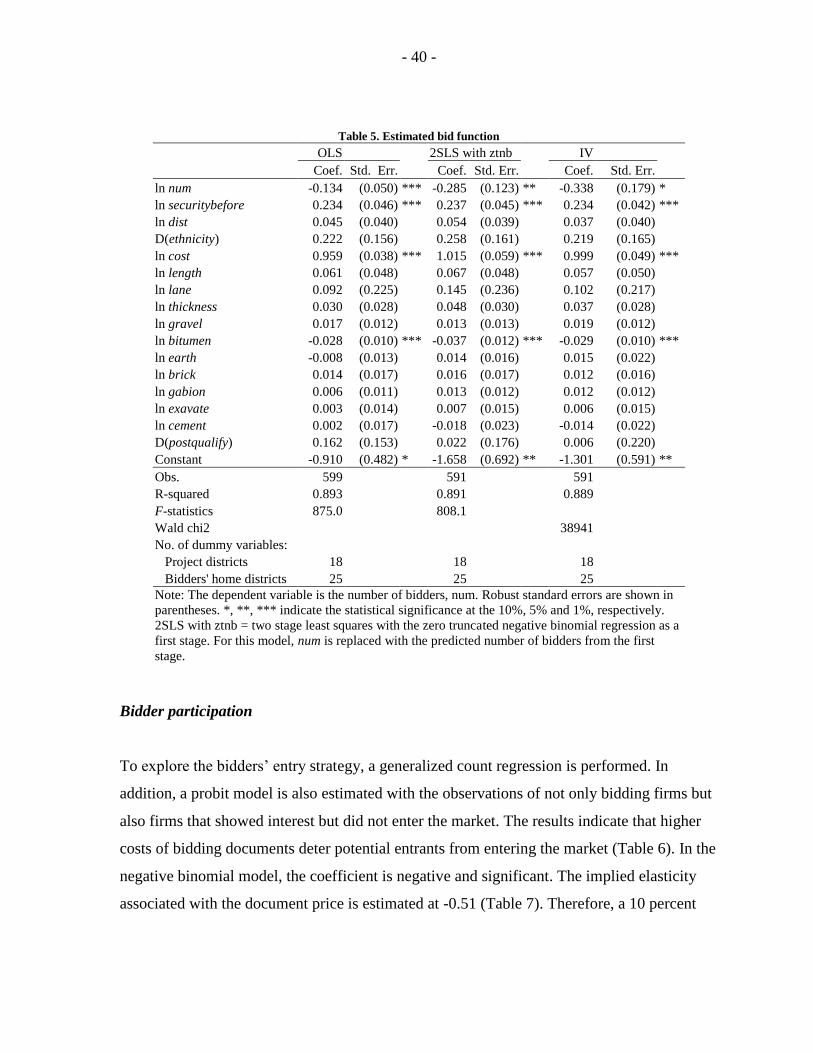
- 40 -
Table 5. Estimated bid function
OLS 2SLS with ztnb IV
Coef. Std. Err. Coef. Std. Err. Coef. Std. Err.
ln num -0.134 (0.050) *** -0.285 (0.123) ** -0.338 (0.179) *
ln securitybefore 0.234 (0.046) *** 0.237 (0.045) *** 0.234 (0.042) ***
ln dist 0.045 (0.040)
0.054 (0.039)
0.037 (0.040)
D(ethnicity) 0.222 (0.156)
0.258 (0.161)
0.219 (0.165)
ln cost 0.959 (0.038) *** 1.015 (0.059) *** 0.999 (0.049) ***
ln length 0.061 (0.048)
0.067 (0.048)
0.057 (0.050)
ln lane 0.092 (0.225)
0.145 (0.236)
0.102 (0.217)
ln thickness 0.030 (0.028)
0.048 (0.030)
0.037 (0.028)
ln gravel 0.017 (0.012)
0.013 (0.013)
0.019 (0.012)
ln bitumen -0.028 (0.010) *** -0.037 (0.012) *** -0.029 (0.010) ***
ln earth -0.008 (0.013)
0.014 (0.016)
0.015 (0.022)
ln brick 0.014 (0.017)
0.016 (0.017)
0.012 (0.016)
ln gabion 0.006 (0.011)
0.013 (0.012)
0.012 (0.012)
ln exavate 0.003 (0.014)
0.007 (0.015)
0.006 (0.015)
ln cement 0.002 (0.017)
-0.018 (0.023)
-0.014 (0.022)
D(postqualify) 0.162 (0.153)
0.022 (0.176)
0.006 (0.220)
Constant -0.910 (0.482) * -1.658 (0.692) ** -1.301 (0.591) **
Obs. 599
591
591
R-squared 0.893
0.891
0.889
F-statistics 875.0
808.1
Wald chi2
38941
No. of dummy variables:
Project districts 18
18
18
Bidders' home districts 25 25 25
Note: The dependent variable is the number of bidders, num. Robust standard errors are shown in
parentheses. *, **, *** indicate the statistical significance at the 10%, 5% and 1%, respectively.
2SLS with ztnb = two stage least squares with the zero truncated negative binomial regression as a
first stage. For this model, num is replaced with the predicted number of bidders from the first
stage.
Bidder participation
To explore the bidders’ entry strategy, a generalized count regression is performed. In
addition, a probit model is also estimated with the observations of not only bidding firms but
also firms that showed interest but did not enter the market. The results indicate that higher
costs of bidding documents deter potential entrants from entering the market (Table 6). In the
negative binomial model, the coefficient is negative and significant. The implied elasticity
associated with the document price is estimated at -0.51 (Table 7). Therefore, a 10 percent

- 41 -
reduction in costs of bidding documents could increase the number of bidders by 5 percent or
invite 0.3 bidders more to public tenders.
The longer bid preparation period helps to enhance competition. The coefficient of
bidpreptime is significant and positive in the negative binomial model. The implied elasticity
is 0.64. Thus, if the bid preparation period is extended by 10 percent, 6 percent more bidders
would apply.
According to the first stage regression of the instrumental variable (IV) estimator (presented
above), more bidders would participate in the competition, if more firms are attracted at the
initial stage of the public procurement. The coefficient of bdnum turned out to be
significantly positive. This confirms a basic principle of the public procurement systems: The
competition should open and nondiscriminatory with free entry. It is important to invite as
many firms as possible to public tenders at the beginning.
Larger contracts are more attractive to potential bidders. It is not straightforward to assess the
scale effect in our model, because the size of contracts is measured by more than one variable.
But when focusing on the marginal effect of engineering cost estimates, the coefficient is
0.36. A 10 percent increase in cost estimates, holding everything else constant, would result
in a 3-4 percent increase in bidder participation. It means that too small contracts are not
profitable enough to motivate potential contractors to participate in public tendering. Recall
that that the average contract amount is relatively small at about NRs 7.7 million or $110,000
in Nepal and that bidders have to bear some (implicit) entry costs regardless of whether they
win or lose the contract.
Distance does matter to the bidder participation. According to our bid estimation results
(Table 5), the firm location does not really matter to bid prices. But it does affect the bidders’
entry strategy. The first stage of the IV regression indicates that firms located far from a
project location are less likely to decide to enter the market. The estimated elasticity is small
at -0.06 but statistically significant. If the distance between a project site and potential

- 42 -
contractors increases by 50 km―approximately, a distance between two districts in Nepal,
the expected number of bidders would decrease by about 2.5 percent. The probit model
shows the similar results. The coefficient of lndist is negative at -0.19, which is statistically
significant. Therefore, it can be concluded that the firm location does not matter directly to
bid prices but affect the bidders’ participation decisions, which could in turn increase road
procurement costs.
Security issues discourage bidder participation. In Nepal, there has been concern about
intimidation and threats by incumbent firms as well as strikes and abductions in local areas.
Our estimation results are supportive of this. The probit model has a negative and significant
coefficient on the security variable. Thus, if more security-related incidents are expected in a
project district, a fewer firms would apply.
Contrary to our expectation, ethnicity does not seem to affect the bidders’ entry decision.
This may be attributable to possible noise in our data. Our ethnicity variable, D(ethnicity), is
constructed based on the only district-level information. It is set to one if the dominant
ethnicity is the same between a project host district and a bidder’s home district. It does not
necessarily explain which ethnic group each bidding entity belongs to.

- 43 -
Table 6. Estimation of bidder participation decision
Zero truncated
negative binomial 1st stage of IV
Probit
Coef. Std. Err. Coef. Std. Err. Coef. Std. Err.
bdnum -0.002 (0.004)
0.104 (0.058) *
bdcost -0.0003 (0.0001) *** 0.178 (0.121)
0.0002 (0.0001)
bidpreptime 0.025 (0.010) *** 0.321 (0.092) *** -0.009 (0.009)
securitybefore 0.005 (0.008)
-0.022 (0.050)
-0.024 (0.007) ***
ln dist
-0.060 (0.027) ** -0.190 (0.050) ***
D(ethnicity)
-0.089 (0.136)
-0.222 (0.207)
ln cost 0.362 (0.112) *** 0.018 (0.078)
-0.102 (0.116)
ln length 0.052 (0.099)
0.029 (0.070)
0.161 (0.075) **
ln lane -0.051 (0.370)
0.001 (0.158)
0.028 (0.412)
ln thickness 0.072 (0.060)
-0.014 (0.043)
0.100 (0.058) *
ln gravel -0.010 (0.027)
-0.001 (0.012)
-0.081 (0.034) **
ln bitumen -0.010 (0.026)
0.014 (0.015)
-0.055 (0.024) **
ln earth 0.124 (0.038) *** 0.105 (0.016) *** 0.054 (0.032) *
ln brick -0.022 (0.028)
-0.045 (0.014) *** -0.021 (0.037)
ln gabion 0.054 (0.024) ** 0.031 (0.013) ** 0.038 (0.024)
ln excavate 0.006 (0.023)
0.002 (0.010)
-0.007 (0.016)
ln cement -0.126 (0.032) *** -0.079 (0.011) *** -0.071 (0.028) **
D(postqualify) -0.752 (0.218) *** -0.716 (0.161) *** 0.653 (0.245) ***
Constant -4.501 (1.330) *** -1.468 (0.763) * 0.570 (1.661)
Obs. 118
591
2119
Wald chi2 1498.88
436.39
R-squared
0.779
F-statistics
305.25
Pseudo R2
0.180
No. of dummy variables:
Project districts 18
18
17
Bidders' home districts 0 25 28
Note: The dependent variable is the number of bidders, num, for the zero truncated negative binomial
regression. For the 1st stage of the instrumental variable regression, the first four independent variables are
in logarithm. In the probit model, the dependent variable is a binary variable which is set to 1 if a potential
contractor participates in competitive bidding, and zero otherwise. Robust standard errors are shown in
parentheses. *, **, *** indicate the statistical significance at the 10%, 5% and 1%, respectively.
Table 7. Implied marginal effect on the number of bidders
Marginal
effect
Std.
Err.
bdnum -0.051 (0.088)
bdcost -0.506 (0.184) ***
bidpreptime 0.640 (0.250) ***
securitybefore 0.053 (0.086)
cost 0.362 (0.112) ***

- 44 -
Efficiency in contracting
One potential disadvantage of increasing the size of the contract to intensify competition is
that the administrative costs of evaluating bids and bidders are likely to go up. Our evidence
is supportive of this. In the contract efficiency regressions, the coefficient of engineering cost
estimates has been found positive and significant in all the models (Table 8). There are two
reasons for this. First, it takes longer to evaluate bids and bidders in large contracts; large-
scale works tend to be financially valuable and technically complex. As a result, the size of
contracts is an important determinant of the procurement efficiency.
Second, larger contracts attract more contenders, as shown above. Firms are more interested
in public tenders for large packages. Consequently, increased competition adds to the
evaluation costs of procurers. This effect may be captured partly by the coefficient on lncost,
because of the correlation between the two variables. The coefficient of the number of
bidders is insignificant in the first three specifications of Table 8. But when all the variables
representing the scale of contracts are excluded from the model, the effect of increased
competition becomes clearer; the more bidders, the less efficient contracting process. This is
simply because it takes more time to evaluate more bids and bidders.
No evidence is found that security issues would retard the bid evaluation process. In all the
regressions on dayscontracting, the coefficient of securitybefore is found insignificant. There
may be a data issue here. Recall that our security variable is constructed to represent the
general level of security concern at the district level. It may or may not be linked explicitly to
security incidents related to the public road procurement. However, as far as our data are
concerned, the bid evaluation and contract award process per se does not seem to be affected
directly by possible intimidations or any other complaints from bidders. Rather, security is a
matter of more vital concern to the bidder participation, as discussed above (Table 6).
(In)Efficiency in contract awarding crucially depends on district-specific unobservables, such
as government effectiveness and procurers’ capacity. In the models, there are significant

- 45 -
fixed effects across districts. Formally, the Wald test statistic for the first column model is
estimated at 3.28, which is greater than the F statistic with 18 numerator and 86 denominator
degrees of freedom. Using the district of Banke as a baseline, Dhading and Nuwakot are
clearly efficient than other districts. By contrast, Kapilvastu and Palpa look less efficient for
some reasons.

Table 8. OLS estimation of efficiency in contract awarding
Coef.
Std.
Err. Coef.
Std.
Err. Coef.
Std.
Err. Coef.
Std.
Err. Coef.
Std.
Err.
ln num -0.110 (0.145) -0.060 (0.118) 0.591 (0.116) *** 0.575 (0.140) ***
ln securitybefore 0.065 (0.112)
0.071 (0.113)
-0.044 (0.126)
ln cost 0.534 (0.164) *** 0.549 (0.114) *** 0.509 (0.162) ***
ln length -0.123 (0.132)
-0.249 (0.107) ** -0.125 (0.130)
ln lane -0.131 (0.375)
-0.098 (0.393)
-0.133 (0.368)
ln thickness -0.065 (0.122)
-0.129 (0.090)
-0.067 (0.125)
ln gravel 0.065 (0.059)
0.015 (0.045)
0.065 (0.059)
ln bitumen 0.020 (0.052)
0.012 (0.044)
0.022 (0.054)
ln earth -0.052 (0.058)
0.007 (0.046)
-0.060 (0.059)
ln brick 0.002 (0.054)
0.073 (0.061)
0.003 (0.054)
ln gabion 0.053 (0.039)
-0.003 (0.029)
0.048 (0.037)
ln excavate 0.022 (0.025)
0.031 (0.019)
0.019 (0.024)
ln cement -0.138 (0.042) *** -0.114 (0.031) *** -0.129 (0.038) ***
D(postqualify) -0.145 (0.411)
0.369 (0.324)
-0.065 (0.409)
1.510 (0.295) *** 1.149 (0.311) ***
Constant -4.064 (2.084) ** -4.626 (1.427) *** -3.871 (2.076) * 1.026 (0.402) ** 1.453 (0.662) **
Obs. 119 154 119 155 120
R-squared 0.710
0.719
0.708
0.463
0.496
F-statistics 19.80
24.44
20.34
13.40
23.20
No. of dummy variables:
Project districts 18 18 18 18 18
Note: The dependent variable is the number of days required to award a contract after the bid openning, dayscontracting. Robust standard
errors are shown in parentheses. *, **, *** indicate the statistical significance at the 10%, 5% and 1%, respectively.

Contract management
Security has been found the most important factor that caused ex post contract
amendments―both cost overruns and project delays. In the regressions on cost overruns, the
coefficient of ln securityduring is found significantly positive at 1.24 (Table 9). But
unexpectedsecurity does not have a significant coefficient. Thus, road projects would
experience large cost overruns, if more security-related incidents happened during the
implementation period, even though they were anticipated prior to public tendering. The
implied elasticity is about 0.33.
In addition, security incidents have a positive and significant impact on ln Delay (Table 10).
Not surprisingly, security incidents would cause project delays. While security incidents
occur, a project will be interrupted. The elasticity is estimated at about 1.1. If a contractor is
faced with 10 percent more incidents, the project would be delayed by the same percentage
or for 2-3 weeks.18
Heavy rainfall causes project delays as well. But it may not increase cost overruns. This is
consistent with our expectation. In rural road projects, which are technically simple, it is less
likely that contractors would encounter unexpected geotechnical issues. Rather, heavy rain
would likely delay civil works. In the regression on delays, rainduring has a positive and
significant coefficient of 0.32. unexpectedrain also has a significant coefficient. Thus, the
project delay would increase with precipitation during the project implementation. This is a
reasonable finding, because road work cannot be carried out when it rains. If it rains 10
percent more than usual, the project would delay additionally by 3 percent or 3 days, on top
of an average project delay of 107 days.
Intense competition in public tendering results in mitigating the risk of post contract
amendments. The number of bidders has a negative coefficient in all the specifications. The
18
In the sample, the original project duration is about 185 days on average, and the actual project duration is
about 290 days. The average project delay is about 107 days.

- 48 -
coefficient is particularly significant in the regressions on cost overruns. It is interpreted as
one of the positive benefits from competitive pressure in the market. Contractors that were
selected through intense competitive bidding are more likely to be well disciplined and
therefore less likely to provoke renegotiation about costs or miss the project completion date.
The work is more likely to be delivered on schedule, except in the case that exogenous
factors, such as security events and weather, occur.
Notably, this finding contradicts the winner’s curse hypothesis that excessive competition
would result in more ex post contract amendments. Our finding suggests that intense
competition is conducive to avoiding post contract adjustment. This is more consistent with
the independent private value paradigm of auction theory, in which competition plays an
important role in lowering the equilibrium bid. In addition, contracts are unlikely to be
amended, because bidders know their own values attached to an object.19
The low-balling strategy will end up with a retard of projects. The coefficient of lowball is
found significant and positive in the regressions on project delays. Recall that lowball is
defined by the difference between the winning bids and the second lowest bids. Thus, a
positive coefficient means that more delays will happen if the winning bid undercuts the
second price significantly. On the other hand, there is no evidence that the low-balling
strategy would cause cost overruns. The coefficient is positive but not significant.
The coefficient of dayscontracting, a proxy of inefficiency in contracting, is found positive
and significant in both cost overrun and project delay equations. This is inconsistent with the
view that procurers would be bothered with post contract adjustments if the qualities of bids
and bidders are not carefully assessed before the contract award. Worse, many post
adjustments will happen even if procurers spend more time for the bid evaluation.
19
By contrast, under the common value paradigm, bidders do not ex ante know the true value of an object. As a
result, bidders may over- or under-estimate the value, initiating ex post contract amendments (e.g., Kagel and
Levin, 1986; Klemperer, 1998; Hong and Shum, 2002; Athias and Nunez, 2006). With such a case anticipated,
the equilibrium bid may first decrease with the number of bidders, reflecting increased competition, but with
more competition, bidders will recognize the risk of underestimating the true project costs and raise their bids
(Paarsch, 1992).

- 49 -
Underlying reasons remain open to discussion. One possibility is that poor governance would
likely loosen contractors’ incentives and at the same time increase the risk of corruption and
collusion in the procurement process. As discussed, the lengthy contract process is a yellow
flag signaling weak governance in public procurement systems. At the same time, poor
governance would allow contractors to exploit the opportunities of strategic cost overruns
and project delays.
Overall, security stands out as the most important factor to explain ex post contract
adjustments. Security issues cause both cost overruns and project delays. Competitive
pressure will help to prevent post contract amendments, especially cost overruns. The low-
balling strategy will increase the risk of project delays.
Regarding non-institutional variables, the estimation results consistently show that two inputs
would bring about cost overruns: bitumen and earthworks. Bitumen is a relatively expensive
input in rural road projects of Nepal, and its costs may be sensitive to external factors, such
as energy prices. As a result, bitumen would emerge as an important cost overrun factor. In
our sample, about half of the works used some bitumen. Earthworks are preparatory works,
including land grading and leveling, for roads. They are one of the main work activities in
our rural road projects. Depending on project site conditions, unanticipated additional
earthworks may be required. In the sample, almost all contracts include some earthworks,
except for 6 contracts. The implication is that the quality of the bidding documents is
important. If a project is predefined correctly with proper specifications, these cost overruns
will be less likely to occur.
Larger contracts would bring about larger post-award adjustments, particularly project delays.
This may be simply because larger projects are technically complex. The coefficient of lncost
in the last column model of Table 10 is significantly positive at 0.71. Hence, larger contracts
would undergo more delays. A 10 percent larger contract would result in increasing project
delays by 7 percent, assuming that everything else is constant,

Table 9. OLS estimation of cost overruns
Coef. Std. Err. Coef. Std. Err. Coef. Std. Err. Coef. Std. Err. Coef. Std. Err. Coef. Std. Err. Coef. Std. Err. Coef. Std. Err.
ln securityduring 1.245 (0.645) **
2.022 (0.698) ***
ln unexpectedsecurity
-0.157 0.5009
ln rainduring
-0.316 (0.265)
-1.094 (0.336) ***
ln unexpectedrain
-0.193 (0.204)
ln num
-2.046 (0.710) ***
-3.701 (0.975) ***
ln lowbid
0.050 (0.097)
0.024 (0.092)
ln dayscontracting
1.460 (0.600) ** 0.617 (0.755)
ln cost -0.032 (0.821)
0.1131 0.866
0.945 (0.755)
0.842 (0.735)
0.990 (0.658)
0.834 (0.758)
0.029 (0.755)
0.846 (0.869)
ln length -1.821 (0.727) ** -1.563 0.7743 ** -1.899 (0.687) *** -1.749 (0.691) ** -1.671 (0.649) *** -1.629 (0.863) * -1.395 (0.702) ** -1.727 (0.750) **
ln lane 1.072 (3.606)
0.0911 4.6242
2.028 (3.540)
2.409 (3.575)
1.485 (3.448)
1.705 (3.632)
2.410 (3.477)
0.262 (3.918)
ln thickness -0.241 (0.493)
0.3371 0.6176
-0.372 (0.508)
-0.227 (0.509)
-0.229 (0.482)
-0.738 (0.522)
-0.170 (0.513)
-0.128 (0.496)
ln gravel -0.163 (0.220)
0.1492 0.2943
-0.038 (0.203)
-0.085 (0.221)
-0.053 (0.217)
-0.151 (0.219)
-0.089 (0.218)
-0.231 (0.210)
ln bitumen 0.941 (0.242) *** 0.9046 0.2979 *** 0.966 (0.271) *** 0.924 (0.263) *** 0.903 (0.249) *** 1.008 (0.265) *** 0.928 (0.269) *** 0.909 (0.246) ***
ln earth 0.676 (0.299) ** 0.4198 0.3362
0.505 (0.250) ** 0.515 (0.253) ** 0.691 (0.260) *** 0.621 (0.260) ** 0.527 (0.248) ** 0.855 (0.325) ***
ln brick -0.242 (0.396)
0.0338 0.5058
0.103 (0.399)
0.119 (0.401)
0.008 (0.377)
-0.013 (0.431)
-0.002 (0.391)
-0.343 (0.416)
ln gabion -0.071 (0.232)
0.2795 0.3225
-0.097 (0.231)
-0.127 (0.226)
0.004 (0.229)
-0.163 (0.238)
-0.108 (0.222)
0.014 (0.234)
ln exavate -0.199 (0.131)
-0.041 0.1624
-0.168 (0.135)
-0.186 (0.138)
-0.127 (0.128)
-0.141 (0.151)
-0.227 (0.141) * -0.191 (0.137)
ln cement 0.224 (0.234)
0.0198 0.3035
0.049 (0.240)
0.038 (0.239)
0.013 (0.224)
0.052 (0.244)
0.226 (0.252)
0.059 (0.250)
D(postqualify) 3.954 (2.329) * 0.2357 1.9315
4.056 (2.070) ** 3.693 (2.137) * 3.084 (2.075)
3.911 (2.209) * 3.037 (2.033)
4.545 (2.577) *
Constant -6.759 (9.272) -1.570 (9.934) -13.976 (8.553) * -14.052 (8.866) -14.925 (7.980) * -15.158 (9.170) * -7.742 (8.766) -12.152 (9.071)
Obs. 152 95
155
154 155 142 154 138
R-squared 0.558
0.638
0.540
0.542
0.559
0.544
0.556
0.624
F-statistics 9.68
38.17
9.29
8.77
9.61
8.54
8.14
10.58
No. of dummy
variables:
Project districts 18 18 18 18 18 18 18 18
Note: The dependent variable is the cost overrun rate, overrun. Robust standard errors are shown in parentheses. *, **, *** indicate the statistical significance at the 10%, 5% and 1%, respectively.
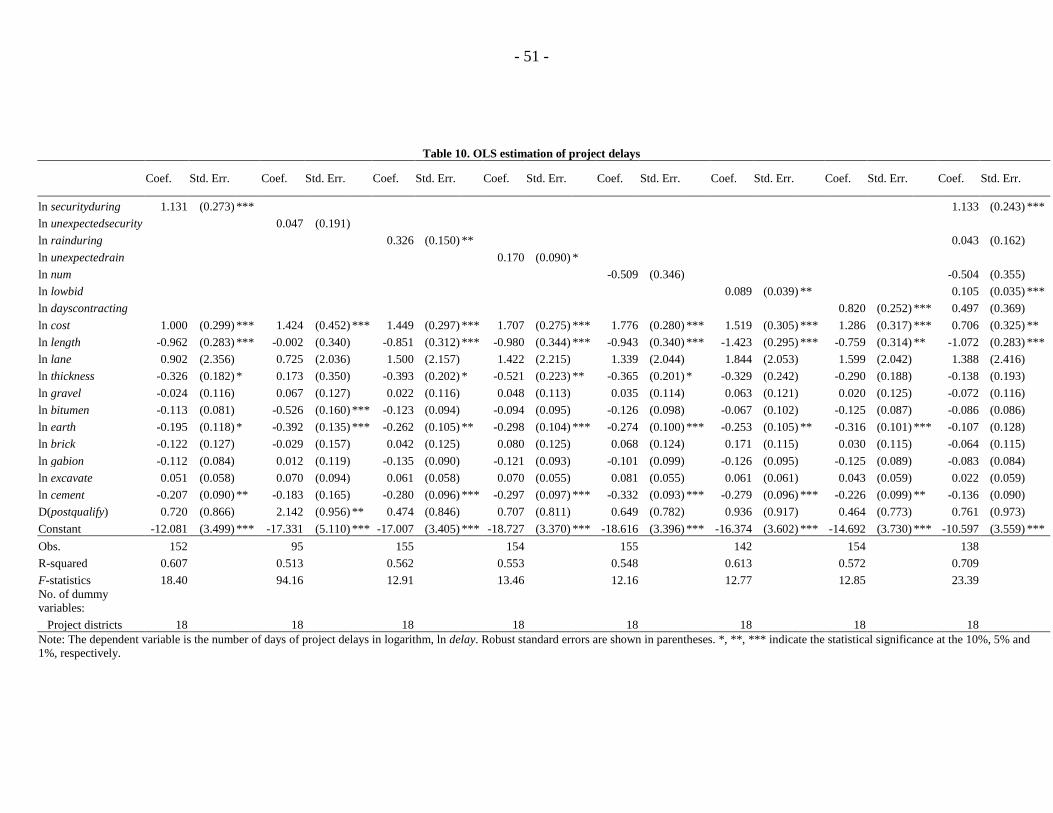
- 51 -
Table 10. OLS estimation of project delays
Coef. Std. Err. Coef. Std. Err. Coef. Std. Err. Coef. Std. Err. Coef. Std. Err. Coef. Std. Err. Coef. Std. Err. Coef. Std. Err.
ln securityduring 1.131 (0.273) ***
1.133 (0.243) ***
ln unexpectedsecurity
0.047 (0.191)
ln rainduring
0.326 (0.150) **
0.043 (0.162)
ln unexpectedrain
0.170 (0.090) *
ln num
-0.509 (0.346)
-0.504 (0.355)
ln lowbid
0.089 (0.039) **
0.105 (0.035) ***
ln dayscontracting
0.820 (0.252) *** 0.497 (0.369)
ln cost 1.000 (0.299) *** 1.424 (0.452) *** 1.449 (0.297) *** 1.707 (0.275) *** 1.776 (0.280) *** 1.519 (0.305) *** 1.286 (0.317) *** 0.706 (0.325) **
ln length -0.962 (0.283) *** -0.002 (0.340)
-0.851 (0.312) *** -0.980 (0.344) *** -0.943 (0.340) *** -1.423 (0.295) *** -0.759 (0.314) ** -1.072 (0.283) ***
ln lane 0.902 (2.356)
0.725 (2.036)
1.500 (2.157)
1.422 (2.215)
1.339 (2.044)
1.844 (2.053)
1.599 (2.042)
1.388 (2.416)
ln thickness -0.326 (0.182) * 0.173 (0.350)
-0.393 (0.202) * -0.521 (0.223) ** -0.365 (0.201) * -0.329 (0.242)
-0.290 (0.188)
-0.138 (0.193)
ln gravel -0.024 (0.116)
0.067 (0.127)
0.022 (0.116)
0.048 (0.113)
0.035 (0.114)
0.063 (0.121)
0.020 (0.125)
-0.072 (0.116)
ln bitumen -0.113 (0.081)
-0.526 (0.160) *** -0.123 (0.094)
-0.094 (0.095)
-0.126 (0.098)
-0.067 (0.102)
-0.125 (0.087)
-0.086 (0.086)
ln earth -0.195 (0.118) * -0.392 (0.135) *** -0.262 (0.105) ** -0.298 (0.104) *** -0.274 (0.100) *** -0.253 (0.105) ** -0.316 (0.101) *** -0.107 (0.128)
ln brick -0.122 (0.127)
-0.029 (0.157)
0.042 (0.125)
0.080 (0.125)
0.068 (0.124)
0.171 (0.115)
0.030 (0.115)
-0.064 (0.115)
ln gabion -0.112 (0.084)
0.012 (0.119)
-0.135 (0.090)
-0.121 (0.093)
-0.101 (0.099)
-0.126 (0.095)
-0.125 (0.089)
-0.083 (0.084)
ln excavate 0.051 (0.058)
0.070 (0.094)
0.061 (0.058)
0.070 (0.055)
0.081 (0.055)
0.061 (0.061)
0.043 (0.059)
0.022 (0.059)
ln cement -0.207 (0.090) ** -0.183 (0.165)
-0.280 (0.096) *** -0.297 (0.097) *** -0.332 (0.093) *** -0.279 (0.096) *** -0.226 (0.099) ** -0.136 (0.090)
D(postqualify) 0.720 (0.866)
2.142 (0.956) ** 0.474 (0.846)
0.707 (0.811)
0.649 (0.782)
0.936 (0.917)
0.464 (0.773)
0.761 (0.973)
Constant -12.081 (3.499) *** -17.331 (5.110) *** -17.007 (3.405) *** -18.727 (3.370) *** -18.616 (3.396) *** -16.374 (3.602) *** -14.692 (3.730) *** -10.597 (3.559) ***
Obs. 152 95 155 154 155 142 154 138
R-squared 0.607
0.513
0.562
0.553
0.548
0.613
0.572
0.709
F-statistics 18.40
94.16
12.91
13.46
12.16
12.77
12.85
23.39
No. of dummy
variables:
Project districts 18 18 18 18 18 18 18 18
Note: The dependent variable is the number of days of project delays in logarithm, ln delay. Robust standard errors are shown in parentheses. *, **, *** indicate the statistical significance at the 10%, 5% and
1%, respectively.

Quality of projects delivered
To examine the quality of roads the ordered probit regressions are performed. The results
show that it depends on the duration of use of upgraded roads, traffic volume, precipitation
and security issues (Table 11). In the ordered probit model with age, the road quality ratings
are estimated to deteriorate over time; the coefficient is -0.57. This is interpreted as a
depreciation rate of road assets affected by various factors. The results also show that traffic
damages road surfaces; the quality ratings would decline, as the volume of traffic increases.
Precipitation is also estimated to have a negative effect on the road quality. This is simply
because precipitation also degrades road surfaces.
Security incidents have been found the most important factor. The number of security
incidents that occurred after the project completion has a negative and significant coefficient
of -0.42. In addition, when all these factors are taken into account simultaneously, the
security impact stands as a dominant determinant. This may be interpreted slightly differently
than the other variables discussed above. It implies that periodical road maintenance would
be delayed or hampered where security concern is high. As a result, the road quality would
deteriorate and be rated as poor. The finding is consistent with a view that periodical
maintenance is essential to keep the quality of roads high in the existing literature. Especially,
roads surfaces are considered vulnerable in Nepal, because of their unpaved surfaces as well
as raininess of the country.
The quality of roads also depends on road specifications. Roads built to a high specification
are more likely to be rated high. The coefficients of lane and thickness are consistently
positive and significant across the models. Thus, not surprisingly, the road conditions would
be good if the road surface is thicker. Wider roads also normally follow higher standards and
thus tend to be in good condition.

- 53 -
When the quality is measured by the average speed of the traffic, the security issue is once
again found an important constraint to maintain the road conditions (Table 12). In addition,
the road quality deteriorates with precipitation, as expected. These effects are significant in
the last column model.
One unexpected result is that the average speed increases with the traffic volume. Our prior
expectation is that the quality of roads decreases with the traffic volume. It seems that there
is an endogeneity problem in this result. A good quality road would allow to drive faster,
which would also motivate more people to use the road. As a result, the traffic volume is
positively correlated with the average driving speed.
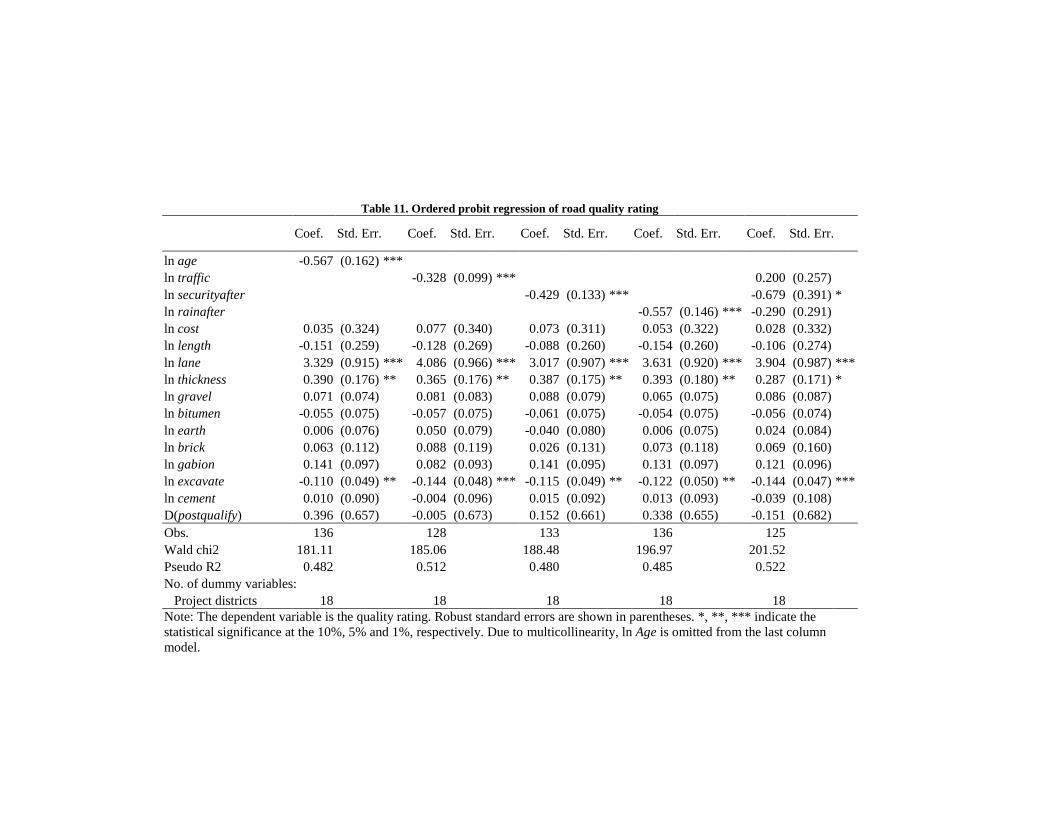
Table 11. Ordered probit regression of road quality rating
Coef. Std. Err. Coef. Std. Err. Coef. Std. Err. Coef. Std. Err. Coef. Std. Err.
ln age -0.567 (0.162) ***
ln traffic
-0.328 (0.099) ***
0.200 (0.257)
ln securityafter
-0.429 (0.133) ***
-0.679 (0.391) *
ln rainafter
-0.557 (0.146) *** -0.290 (0.291)
ln cost 0.035 (0.324)
0.077 (0.340)
0.073 (0.311)
0.053 (0.322)
0.028 (0.332)
ln length -0.151 (0.259)
-0.128 (0.269)
-0.088 (0.260)
-0.154 (0.260)
-0.106 (0.274)
ln lane 3.329 (0.915) *** 4.086 (0.966) *** 3.017 (0.907) *** 3.631 (0.920) *** 3.904 (0.987) ***
ln thickness 0.390 (0.176) ** 0.365 (0.176) ** 0.387 (0.175) ** 0.393 (0.180) ** 0.287 (0.171) *
ln gravel 0.071 (0.074)
0.081 (0.083)
0.088 (0.079)
0.065 (0.075)
0.086 (0.087)
ln bitumen -0.055 (0.075)
-0.057 (0.075)
-0.061 (0.075)
-0.054 (0.075)
-0.056 (0.074)
ln earth 0.006 (0.076)
0.050 (0.079)
-0.040 (0.080)
0.006 (0.075)
0.024 (0.084)
ln brick 0.063 (0.112)
0.088 (0.119)
0.026 (0.131)
0.073 (0.118)
0.069 (0.160)
ln gabion 0.141 (0.097)
0.082 (0.093)
0.141 (0.095)
0.131 (0.097)
0.121 (0.096)
ln excavate -0.110 (0.049) ** -0.144 (0.048) *** -0.115 (0.049) ** -0.122 (0.050) ** -0.144 (0.047) ***
ln cement 0.010 (0.090)
-0.004 (0.096)
0.015 (0.092)
0.013 (0.093)
-0.039 (0.108)
D(postqualify) 0.396 (0.657)
-0.005 (0.673)
0.152 (0.661)
0.338 (0.655)
-0.151 (0.682)
Obs. 136 128 133 136 125
Wald chi2 181.11
185.06
188.48
196.97
201.52
Pseudo R2 0.482
0.512
0.480
0.485
0.522
No. of dummy variables:
Project districts 18 18 18 18 18
Note: The dependent variable is the quality rating. Robust standard errors are shown in parentheses. *, **, *** indicate the
statistical significance at the 10%, 5% and 1%, respectively. Due to multicollinearity, ln Age is omitted from the last column
model.

- 55 -
Table 12. OLS estimation of average traffic speed
Coef. Std. Err. Coef. Std. Err. Coef. Std. Err. Coef. Std. Err. Coef. Std. Err.
ln Age 0.007 (0.042)
ln Traffic
0.044 (0.017) **
0.207 (0.042) ***
ln securityafter
0.0002 (0.037)
-0.271 (0.070) ***
ln rainafter
-0.005 (0.032)
-0.044 (0.023) *
ln cost 0.082 (0.057)
0.068 (0.058)
0.081 (0.057)
0.082 (0.057)
0.042 (0.055)
ln length 0.120 (0.038) *** 0.160 (0.039) *** 0.114 (0.037) *** 0.115 (0.037) *** 0.181 (0.032) ***
ln lane 0.244 (0.267)
0.286 (0.248)
0.224 (0.270)
0.248 (0.269)
0.333 (0.164) **
ln thickness 0.010 (0.032)
0.053 (0.029) * 0.008 (0.032)
0.009 (0.031)
0.051 (0.029) *
ln gravel 0.014 (0.015)
0.010 (0.014)
0.015 (0.016)
0.014 (0.015)
0.003 (0.016)
ln bitumen -0.031 (0.013) ** -0.037 (0.013) *** -0.030 (0.013) ** -0.030 (0.013) ** -0.032 (0.012) ***
ln earth -0.019 (0.017)
-0.022 (0.017)
-0.019 (0.020)
-0.018 (0.017)
-0.018 (0.017)
ln brick -0.014 (0.018)
0.004 (0.018)
-0.019 (0.018)
-0.014 (0.017)
0.015 (0.016)
ln gabion 0.001 (0.014)
-0.003 (0.014)
0.002 (0.013)
0.002 (0.013)
0.006 (0.013)
ln excavate -0.004 (0.010)
-0.008 (0.009)
-0.004 (0.010)
-0.004 (0.010)
-0.008 (0.009)
ln cement 0.015 (0.014)
0.016 (0.014)
0.016 (0.014)
0.015 (0.014)
0.011 (0.014)
D(postqualify) -0.081 (0.104)
-0.028 (0.109)
-0.100 (0.107)
-0.085 (0.104)
0.004 (0.094)
Constant 1.754 (0.738) ** 1.128 (0.747)
1.850 (0.699) *** 1.849 (0.734) ** 0.400 (0.812)
Obs. 148 141 145 148 138
R-squared 0.478
0.714
0.675
0.678
0.759
F-statistics 12.86
13.48
13.33
12.97
19.41
No. of dummy variables:
Project districts 18 18 18 18 18
Note: The dependent variable is the average speed in logarithm. Robust standard errors are shown in parentheses. *, **, ***
indicate the statistical significance at the 10%, 5% and 1%, respectively. Due to multicollinearity, ln Age is omitted from the last
column model.

V. POLICY DISCUSSION
There are a variety of findings in our estimation results. Important, our empirical analysis
provides quantitative assessment to suggest possible policy options for improving the
performance of public road procurement and contracting. Some important policy
implications are as follows:
Competition needs to be enhanced particularly in government owned projects
Competition is the most important factor to bring down road procurement costs. The level of
competition is clearly insufficient in some public tenders in Nepal. In particular in
government owned projects, the average competition is about 4.5, unfavorably compared to
an average of 7.3 in World Bank financed projects (Table 13). Greater efforts are required to
invite more potential contractors in the government’s projects. If the competition is increased
to the same level as the World Bank projects, the procurement costs of government-financed
roads are estimated to decline by about 20 percent.20
If this is applied uniformly to our
sample projects, which is composed of 155 road upgrading works, about NRs220 million or
$3 million could be saved.
The optimal level of competition may be seven bidders or more in the Nepal case. How many
bidders are required for an auction to be sufficiently competitive is a difficult question. It
must depend on individual cases and policy objectives to be achieved. If we apply one
analytical approach that defines competition as sufficient when the number of bids exceeds
(Estache and Iimi, 2011), the optimal level that could generate a statistically significant
impact on the equilibrium bid strategy is estimated at seven bidders or more in our case. The
IV estimation with a partially nonlinear specification for the number of bidders, in which
num is replaced with a set of the dummy variables for individual num,21
shows that the
20
This is calculated based on the IV result. 21
This is considered as the most flexible functional form to specify the competition effect.

- 57 -
equilibrium bid broadly decreases with the number of bidders and that the statistical
significance would taper off once the number of bidders reaches seven (Figure 36). About
half of World Bank financed projects do not reach this level of competition. Nearly 80
percent of government financed projects are estimated to have insufficient competition
(Figure 37). Too small contracts are often less attractive to firms, because of high transaction
costs, which would be incurred regardless of the size of projects.
Table 13. Average number of bidders
Obs Mean Std. Dev. Min Max
World Bank project 82 7.28 3.78 3 16
Government project 74 4.51 3.50 1 15
Figure 36. Coefficients of numbers of bidders estimated by partially nonlinear IV regression
Figure 37. Levels of competition in World Bank or government financed road projects
-1.0
-0.5
0.0
0.5
1.0
1.5
2.0
1 2 3 4 5 6 7 8 9
Number of bidders
Estimated coefficientCoef. + 1.6 Std. Err.Coef. - 1.6 Std. Err.
Note: The number of bidders equal to 10 or more is used as a baseline.
0.00
0.05
0.10
0.15
0.20
0.25
0.30
0.35
0.40
1 2 3 4 5 6 7 8 9 10 11 12 13 14 15 16
Fra
ctio
n
Number of bidders
World Bank financed projectsGovernment financed projects

- 58 -
Wider distribution of public tender information at cheaper costs will increase competition
as well as improve transparency and accountability
Our findings indicate that attracting more interest at the initial stage of competition is
important to enhance actual competition. To attract more interest and bidders, tender notices
should be distributed widely. One measure is to advertize public tenders on national
newspapers, rather than local ones. In our data, it is clear that more firms showed interest
when tenders were advertized on national newspapers (Figure 38). If the media is changed
from local to national newspapers, bidders are estimated to increase by about 20 percent,
which would contribute to decreasing the procurement costs by 6-7 percent. 22
Figure 38. Average number of bidders by tender announcement domain
E-bidding or e-procurement can contribute to distributing tender information even more
widely and timely. The Nepal government has recently introduced the e-submission system
in the road sector.23
This is now being applied to other procuring agencies, such as the
Department of Irrigation. The Government has decided to make e-procurement mandatory in
public procurement estimated over NRs20 million in 2011 and intends to expand it to all
procurement from the next year. These efforts are clearly consistent with our findings.
22
This is calculated based on the IV result. 23
In our sample data, the road contracts were advertized through traditional mass media, such as newspapers, e-
bidding can reduce the entry cost of firms.
22.6
19.9
7.26.0
0
5
10
15
20
25
National newspaper Local newspaper
Number of firms buying bidding documents
Number of applying bidders
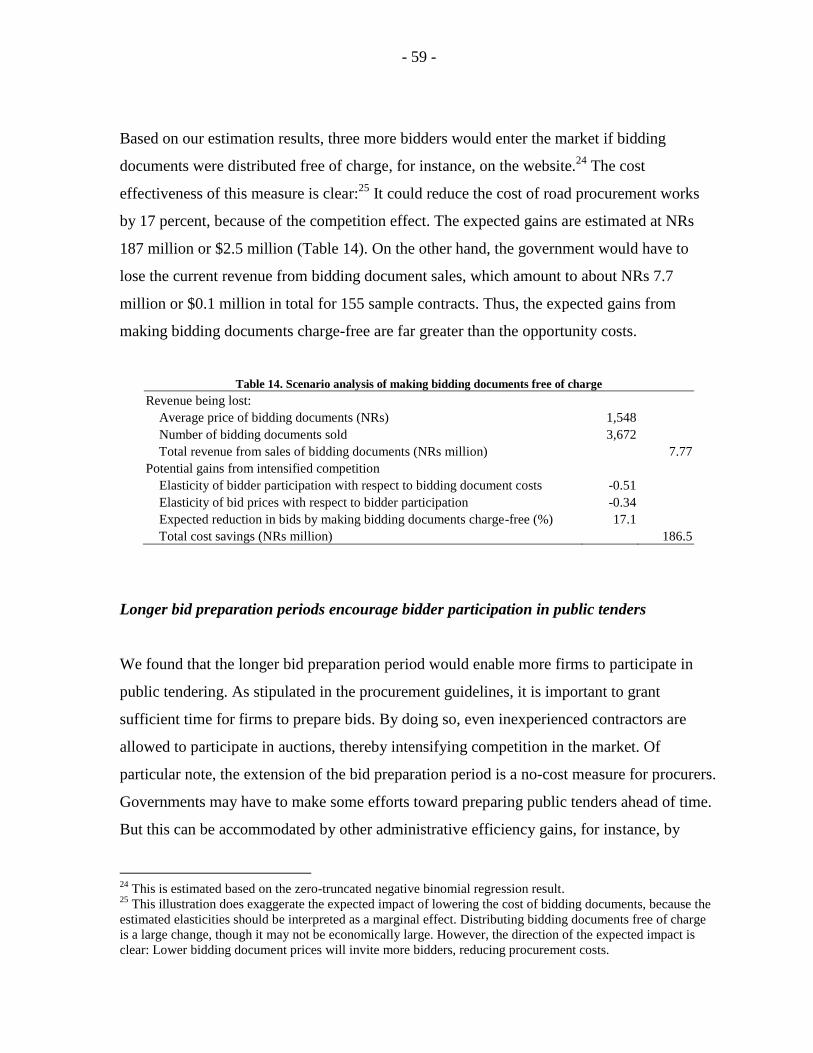
- 59 -
Based on our estimation results, three more bidders would enter the market if bidding
documents were distributed free of charge, for instance, on the website.24
The cost
effectiveness of this measure is clear:25
It could reduce the cost of road procurement works
by 17 percent, because of the competition effect. The expected gains are estimated at NRs
187 million or $2.5 million (Table 14). On the other hand, the government would have to
lose the current revenue from bidding document sales, which amount to about NRs 7.7
million or $0.1 million in total for 155 sample contracts. Thus, the expected gains from
making bidding documents charge-free are far greater than the opportunity costs.
Table 14. Scenario analysis of making bidding documents free of charge
Revenue being lost:
Average price of bidding documents (NRs) 1,548
Number of bidding documents sold 3,672
Total revenue from sales of bidding documents (NRs million)
7.77
Potential gains from intensified competition
Elasticity of bidder participation with respect to bidding document costs -0.51
Elasticity of bid prices with respect to bidder participation -0.34
Expected reduction in bids by making bidding documents charge-free (%) 17.1
Total cost savings (NRs million) 186.5
Longer bid preparation periods encourage bidder participation in public tenders
We found that the longer bid preparation period would enable more firms to participate in
public tendering. As stipulated in the procurement guidelines, it is important to grant
sufficient time for firms to prepare bids. By doing so, even inexperienced contractors are
allowed to participate in auctions, thereby intensifying competition in the market. Of
particular note, the extension of the bid preparation period is a no-cost measure for procurers.
Governments may have to make some efforts toward preparing public tenders ahead of time.
But this can be accommodated by other administrative efficiency gains, for instance, by
24
This is estimated based on the zero-truncated negative binomial regression result. 25
This illustration does exaggerate the expected impact of lowering the cost of bidding documents, because the
estimated elasticities should be interpreted as a marginal effect. Distributing bidding documents free of charge
is a large change, though it may not be economically large. However, the direction of the expected impact is
clear: Lower bidding document prices will invite more bidders, reducing procurement costs.

- 60 -
introducing e-procurement, which can increase the efficiency in distributing the tender-
related information and collecting the bid-related information. As the result, procurers can
extend the bid preparation period without compromising anything.
In Nepal, some of the government owned projects have extremely short bid preparation
periods. While an average of 31 days are allowed for the bid preparation in World Bank
projects, 21 days are granted in the government owned projects (Table 15). As an indicative
target, 30 days may have to be given for bid preparation. About 70 percent of World Bank
contracts satisfy this target, but the majority of the government financed projects are below
the threshold. By increasing the bid preparation period by 10 days in the government projects,
1.5 bidders would additionally enter the market according to our estimation result.26
This
would then reduce the equilibrium bid by about 8 percent, which would materialize a cost
savings of NRs14.9 million or $0.2 million in the sample government projects in total.
Table 15. Average bid preparation period (days)
Obs Mean Std. Dev. Min Max
World Bank project 82 31.1 6.6 15 52
Government project 73 21.6 9.0 6 33
Local contractors’ capabilities need to be fostered to enhance competition
Our estimation results show that firm location does not matter to bid prices but influences the
bidder entry strategy. If a project site is far from firms’ locations, they are less likely to apply
for the public tender. Hence, the local contractors’ capacity will emerge as an important
challenge for the country. Clearly, more local enterprises exist in some districts than others.
Particularly, the share of local firms in the pool of potential contractors is low in the districts
of Kailali, Palpa and Rautahat (Figure 39).27
In addition, local firms do not appear
26
Ditto. 27
There is no significant difference even if the figure is calculated with the data of firms that actually
participated in the competition, because there is no systematic difference in firms’ entry decisions between local
and nonlocal firms. The probability of participation is slightly higher for local firms (0.31) than nonlocal
enterprises (0.26).
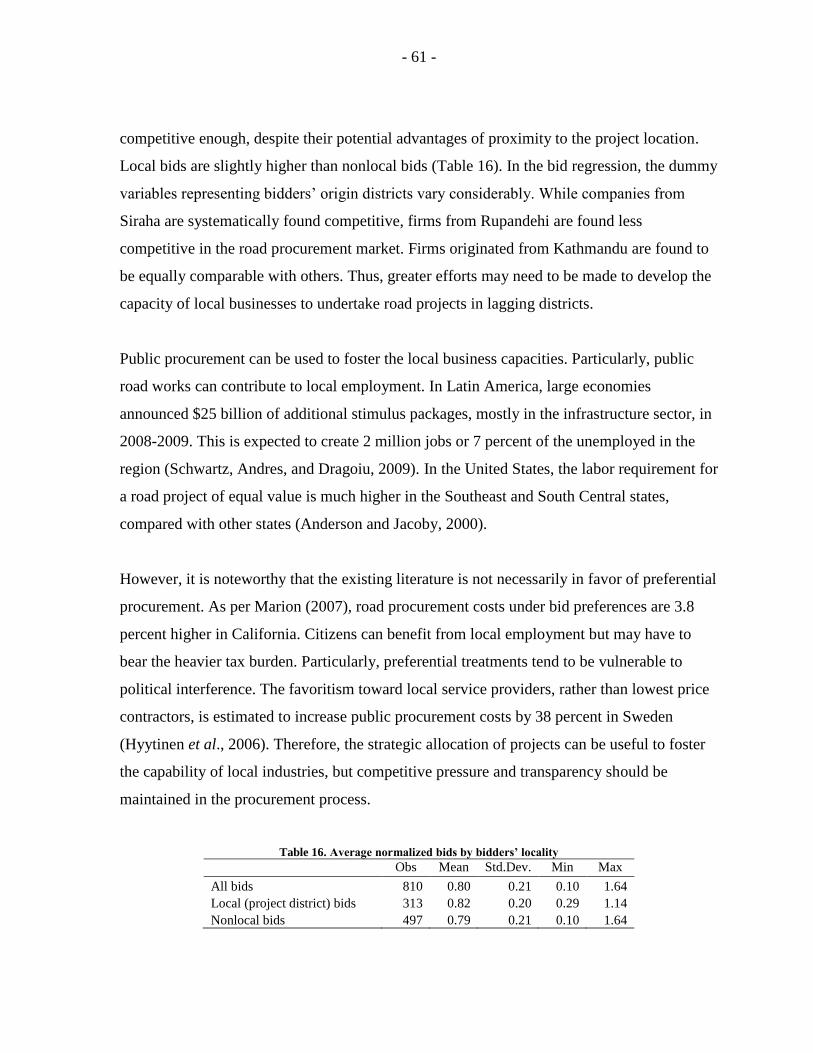
- 61 -
competitive enough, despite their potential advantages of proximity to the project location.
Local bids are slightly higher than nonlocal bids (Table 16). In the bid regression, the dummy
variables representing bidders’ origin districts vary considerably. While companies from
Siraha are systematically found competitive, firms from Rupandehi are found less
competitive in the road procurement market. Firms originated from Kathmandu are found to
be equally comparable with others. Thus, greater efforts may need to be made to develop the
capacity of local businesses to undertake road projects in lagging districts.
Public procurement can be used to foster the local business capacities. Particularly, public
road works can contribute to local employment. In Latin America, large economies
announced $25 billion of additional stimulus packages, mostly in the infrastructure sector, in
2008-2009. This is expected to create 2 million jobs or 7 percent of the unemployed in the
region (Schwartz, Andres, and Dragoiu, 2009). In the United States, the labor requirement for
a road project of equal value is much higher in the Southeast and South Central states,
compared with other states (Anderson and Jacoby, 2000).
However, it is noteworthy that the existing literature is not necessarily in favor of preferential
procurement. As per Marion (2007), road procurement costs under bid preferences are 3.8
percent higher in California. Citizens can benefit from local employment but may have to
bear the heavier tax burden. Particularly, preferential treatments tend to be vulnerable to
political interference. The favoritism toward local service providers, rather than lowest price
contractors, is estimated to increase public procurement costs by 38 percent in Sweden
(Hyytinen et al., 2006). Therefore, the strategic allocation of projects can be useful to foster
the capability of local industries, but competitive pressure and transparency should be
maintained in the procurement process.
Table 16. Average normalized bids by bidders’ locality
Obs Mean Std.Dev. Min Max
All bids 810 0.80 0.21 0.10 1.64
Local (project district) bids 313 0.82 0.20 0.29 1.14
Nonlocal bids 497 0.79 0.21 0.10 1.64

- 62 -
Figure 39. Proportion of local firms purchasing bidding documents
Security is great concern for not only procurement costs but also road management
Security issues were found to push up bid prices and discourage the market entry of potential
firms. Both will end up with a heavy burden on the economy. Improved security would bring
about multiple benefits for the public road procurement. First, improved security would bring
down bid price, thereby government’s procurement costs. As an indicative target, to reduce
the procurement costs by 10 percent, security incidents need to be halved.28
This cost savings
can be interpreted as the increased confidence of contractors about project locations and
general business environment. In addition, the improved security could induce more firms to
participate in the competition, which would in turn contribute to reducing road procurement
costs further.
Second, security incidence results in cost overruns and project delays. As an indicative target,
to halve the project delays (as opposed to an average delay of 107 days), security incidents
need to be halved. This would also mitigate cost overruns by some 15 percent of the overrun
ratio.
Security issues would likely hamper road maintenance required, deteriorating the quality of
roads. As an indicative target, for instance, to increase the average driving speed by 5 km per
hour (some 20 percent of the average speed in our data), security incidents need to be more
than halved. Our estimation results suggest that vehicles could drive 20 percent faster if the
28
This is based on the estimated coefficient of lnsecuritybefore in the IV bid estimation.
.
Share of local firms that purchased
bidding documents
0.05 - 0.09
0.10 - 0.25
0.26 - 0.32
0.33 - 0.46
0.47 - 0.54

- 63 -
number of security incidents would decline by 70 percent. This can be interpreted as the
effect of the improved maintenance conditions around road locations.
Weather will cause project delays
The government should be aware of the risk of project delays caused by weather conditions.
It rains a lot in Nepal. Increased precipitation is likely to cause project delays, which often
result in cost overruns and undermine fiscal efficiency. The project risk related to weather is
region-specific and clouded with uncertainty, as shown in Figure 9. Therefore, the road
procurement planning and budget formulation need to have certain flexibility to incorporate
possible project delays, with possible exogenous factors taken into account.
Our estimation results suggest that about 5 percent of project delays may need to be expected
in the budget formulation and project preparation. This would allow to accommodate about
10-15 percent of unusual precipitation causing road project works. Too tight procurement
plans will undermine the credibility and efficiency of the budget execution. If a project is
implemented where it rains heavily, the government needs to be cautious about the budget
formulation.
Proper and solid project design and preparation help to avoid unnecessary contract
amendments and improve efficiency of the whole project cycle
Our evidence suggests that proper project specifications are important to avoid unnecessary
contract amendments and minimize the risk of contractors’ opportunistic behavior. Some
work activities and inputs are found to be systematically prone to ex post contract
amendments. Bitumen and earthworks are typical items that would cause cost overruns.
Hence, it is important to design a project with proper technical specifications and make sure
that all the information is reflected in the bidding documents.
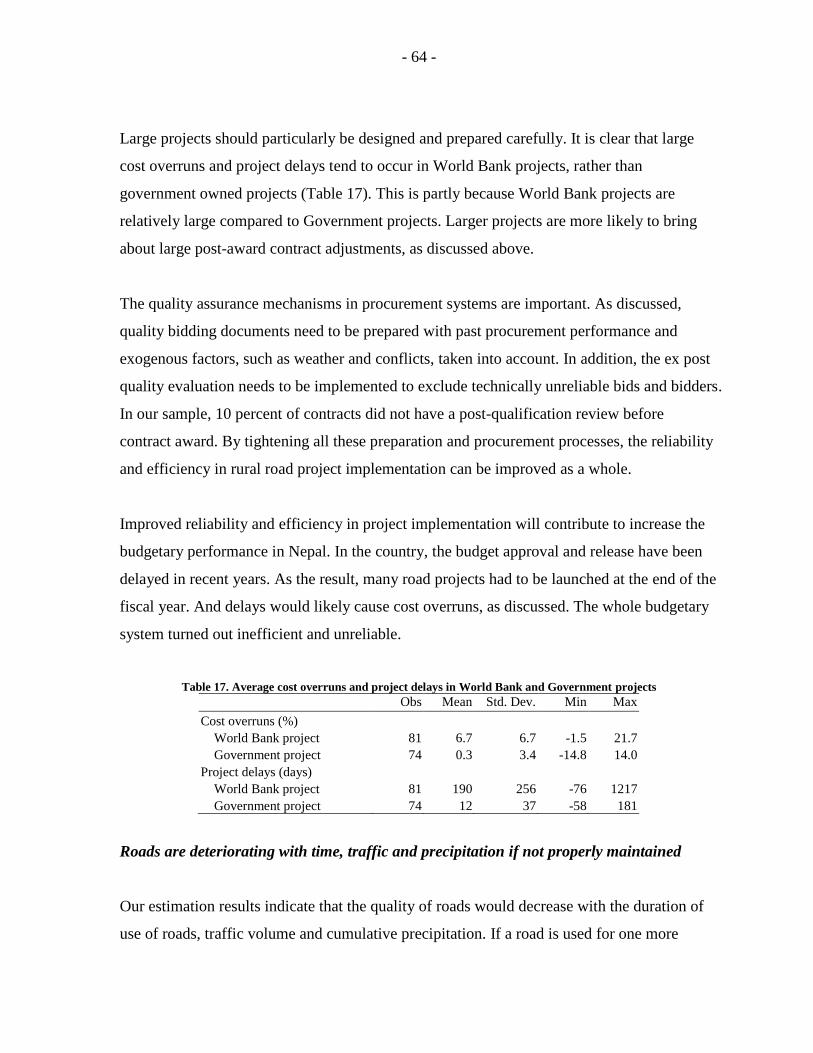
- 64 -
Large projects should particularly be designed and prepared carefully. It is clear that large
cost overruns and project delays tend to occur in World Bank projects, rather than
government owned projects (Table 17). This is partly because World Bank projects are
relatively large compared to Government projects. Larger projects are more likely to bring
about large post-award contract adjustments, as discussed above.
The quality assurance mechanisms in procurement systems are important. As discussed,
quality bidding documents need to be prepared with past procurement performance and
exogenous factors, such as weather and conflicts, taken into account. In addition, the ex post
quality evaluation needs to be implemented to exclude technically unreliable bids and bidders.
In our sample, 10 percent of contracts did not have a post-qualification review before
contract award. By tightening all these preparation and procurement processes, the reliability
and efficiency in rural road project implementation can be improved as a whole.
Improved reliability and efficiency in project implementation will contribute to increase the
budgetary performance in Nepal. In the country, the budget approval and release have been
delayed in recent years. As the result, many road projects had to be launched at the end of the
fiscal year. And delays would likely cause cost overruns, as discussed. The whole budgetary
system turned out inefficient and unreliable.
Table 17. Average cost overruns and project delays in World Bank and Government projects
Obs Mean Std. Dev. Min Max
Cost overruns (%)
World Bank project 81 6.7 6.7 -1.5 21.7
Government project 74 0.3 3.4 -14.8 14.0
Project delays (days)
World Bank project 81 190 256 -76 1217
Government project 74 12 37 -58 181
Roads are deteriorating with time, traffic and precipitation if not properly maintained
Our estimation results indicate that the quality of roads would decrease with the duration of
use of roads, traffic volume and cumulative precipitation. If a road is used for one more
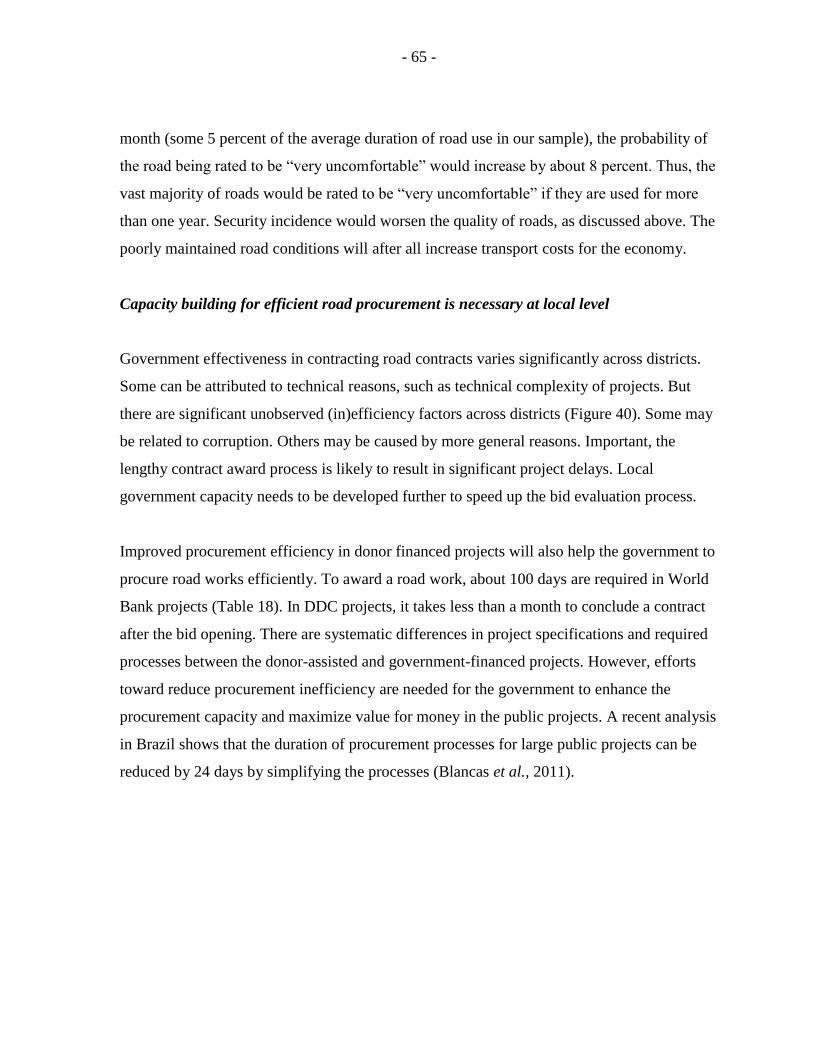
- 65 -
month (some 5 percent of the average duration of road use in our sample), the probability of
the road being rated to be ―very uncomfortable‖ would increase by about 8 percent. Thus, the
vast majority of roads would be rated to be ―very uncomfortable‖ if they are used for more
than one year. Security incidence would worsen the quality of roads, as discussed above. The
poorly maintained road conditions will after all increase transport costs for the economy.
Capacity building for efficient road procurement is necessary at local level
Government effectiveness in contracting road contracts varies significantly across districts.
Some can be attributed to technical reasons, such as technical complexity of projects. But
there are significant unobserved (in)efficiency factors across districts (Figure 40). Some may
be related to corruption. Others may be caused by more general reasons. Important, the
lengthy contract award process is likely to result in significant project delays. Local
government capacity needs to be developed further to speed up the bid evaluation process.
Improved procurement efficiency in donor financed projects will also help the government to
procure road works efficiently. To award a road work, about 100 days are required in World
Bank projects (Table 18). In DDC projects, it takes less than a month to conclude a contract
after the bid opening. There are systematic differences in project specifications and required
processes between the donor-assisted and government-financed projects. However, efforts
toward reduce procurement inefficiency are needed for the government to enhance the
procurement capacity and maximize value for money in the public projects. A recent analysis
in Brazil shows that the duration of procurement processes for large public projects can be
reduced by 24 days by simplifying the processes (Blancas et al., 2011).

- 66 -
Figure 40. Unobserved district-specific inefficiency in contract awarding
Table 18. Average time required to award a road contract after the bid opening (days)
Obs Mean Std. Dev. Min Max
World Bank project 81 99.9 32.9 27 190
Government project 73 24.6 24.1 1 171
VI. CONCLUSION
Transport infrastructure is important for economic growth. In particular in rural areas, the
lack of access to reliable transport infrastructure remains a significant constraint for people’s
daily life and local businesses. In Nepal, about 20 percent of rural residents have to spend
more than 3 hours to go to the nearest marketplace or agriculture center. Over the world,
about 900 million rural dwellers are estimated to have no access to all-weather road within
two kilometers―typically equivalent to a walk of 20-25 minutes.
Public procurement is an important instrument to use resources wisely and efficiently. How
to design an efficient procurement system is still a challenge in the infrastructure sector,
because infrastructure projects are often technically complex, highly customized and
politically sensitive. Therefore, the markets tend to be vulnerable to collusive bidding and
corruption. The bid evaluation process tend to take long time. Contracts tend to be far from
complete; many infrastructure projects undergo massive cost overruns and project delays. In
addition, road assets will deteriorate quickly if not well maintained.
.
District specific fixed effects on inefficiency
in contracting a contract
-0.72 - -0.55
-0.56 - -0.34
-0.35 - 0.15
0.16 - 0.48
0.49 - 1.00

- 67 -
As a result, a series of policy challenges, from procurement design to contract management
and project quality assurance, are interrelated to each other and need to be addressed in
concert. New data were collected from 155 rural road upgrading contracts in Nepal, on which
about 820 bids were submitted. Various important findings were discussed. However, in
order to achieve the cost efficiency in public road procurement, competition is found the
single most important factor. In addition, competition will prevent alleged collusion and
corruption as well as foster local businesses.
To increase competition, it is essential to remove various entry barriers―both explicit and
implicit ones. Public tender notices can be advertized more widely. Bidding documents can
be distributed free of charge. E-procurement can be a good way to take these measures. It can
also offer a one-stop service to publish all the information on business opportunities related
to public works. In addition, e-procurement will be conducive to promoting accountability
and transparency in public procurement systems. The capacity of local businesses also is also
crucial to increase competition, because security issues are hampering the firms’ participation
in the market. Moreover, firms are found less willing to undertake public works far from
their locations. Hence, local businesses are essential.
Enlarging contract packages may help to attract more potential bidders. But the government
should be aware of the risk of increasing the bid evaluation costs. It takes longer to evaluate
larger contracts. In addition, more firms are expected to apply. The efficiency in contract
awarding seems to vary significantly across regions. To make the evaluation process short,
capacity building may be necessary at the local level. This will also help to reduce the risk of
collusion and corruption caused by the lengthy bid evaluation and contract award process.
To mitigate cost overruns and project delays, security issues need to be addressed. Weather
conditions are also one determinant. Particularly where it rains a lot, careful project and
procurement planning is necessary. Otherwise, the efficiency of the budget execution will be
undermined. Finally, roads deteriorate over time anyway. Traffic and precipitation will affect
road conditions. However, security issues seem to be the most critical to implement timely

- 68 -
routine road maintenance. Without proper maintenance, road assets would be depreciated
quickly.
ANNEX I. ISSUES IN PUBLIC ROAD FINANCING
Good transport infrastructure is essential not only for people’s life but also to increase the
economy’s efficiency in production and transaction. Better access to roads can help firms to
minimize inventory and distribution costs (Shirley and Winston, 2004). Good road
infrastructure can also attract foreign direct investment and increase exports (Cieślik and
Ryan, 2004; Boudier-Bensebaa, 2005; Qureshi, 2008; World Bank, 2009b). Exporting firms
generally prefer to be located close to motorways and accessibility to interregional demand
(Holl, 2004).
However, available resources that can be used for infrastructure development are limited in
many developing countries. Governments typically spend 1-3 percent of GDP for transport
infrastructure. Low-income countries seem to invest on average 1.5 percent of GDP in the
transport sector (Figure 41). In Bangladesh, about 0.7 percent of GDP of public resources are
allocated to the transport sector. India is estimated to have been spending 1.4 percent of GDP
for roads alone in recent years. Nepal spent $105 million or 1.2 percent of GDP for road
development, of which 80 percent were supported by foreign aid (World Bank, 2005). These
are often not sufficient compared to the remaining infrastructure deficits. The needs estimates
vary across developing countries, ranging from 1.3 percent to 7.5 percent of GDP.

- 69 -
Figure 41. Transport infrastructure needs and spending in selected low-income countries
Sources: Briceno-Garmendia, Smits and Foster, 2008; Robin and Krishnamani, 2009; Bhattacharyay, 2010; Africa
Infrastructure Country Diagnostic Database; Bangladesh Annual Development Program 2007/08; India 10th 5-Year Plan
2002-07.
The road sector particularly faces difficulties in ensuring financial sustainability. First, roads
are de facto subsidized by governments, and the public finance remains a dominant source of
funding in the transport sector (Figure 42). Except for a few cases, such as toll roads and
cities adopting cordon pricing, roads are almost free of charge. Even in the United States, 277
toll roads, bridges and tunnels, totaling about 5,000 miles, account for only 0.2 percent of
total road network, generating less than 10 percent of total highway funding required
(NSTIFC 2009). Fuel levies and vehicle-related fees and taxes can partly finance public
roads. But they are insufficient. Rather, fossil-fuel-related consumption is often heavily
subsidized in developing countries. Energy subsidies in the developing world are estimated at
$312 billion in 2009 (IEA, 2010).
Figure 42. Public infrastructure investment in Sub-Saharan Africa
Source: Foster and Briceno-Garmendia, 2010.
7.5
6.2 6.05.7
4.94.4 4.2
3.8
3.0 2.9 2.7 2.5 2.5
1.5
3.0
0.3
1.81.4
0.7
1.9
0.7
3.12.6
1.71.3
0.6
1.9
0.4
0
1
2
3
4
5
6
7
8
9
Mad
agas
car
Ch
ad
Mo
zam
biq
ue
Ind
ia
Ban
gla
des
h
Tan
zan
ia
Nig
er
Zam
bia
Mal
awi
Gh
ana
Ben
in
Ug
and
a
Ken
ya
Rw
and
a
% o
f G
DP
NeedsSpending

- 70 -
Second, related to the above, private financing in transport infrastructure has been limited.
Private participation in infrastructure continues to play an important role even in developing
countries. It has reached close to $160 billion per annum in 2009. However, private
participation remains selective by sector and country. The transport sector accounts for about
15 percent of total private investments in infrastructure for the past two decades. The vast
majority were invested in the ICT and energy sectors (Figure 43).
It is noteworthy that private financing cannot substitute for public financing. Governments’
strong commitment and other legal and institutional frameworks in the infrastructure sector
are important to catalyze more private investments, as experienced in Latin America during
the 1990s. While Chile and Colombia, in which public investment has remained high,
attracted many private investments, private participation in infrastructure also tends to be
marginalized, as in Argentina and Mexico where the public spending was also tightened
under the fiscal pressure (Calderón and Servén, 2004; Fay and Morrison, 2007).
Figure 43. Private participation in infrastructure in developing countries
Source: PPI database.
However, the current public procurement systems may not work well to improve efficiency
in spending resources in the infrastructure sector. Public procurement is normally sizeable in
the economy. The public sector often account for 20 to 25 percent of GDP in developing
countries. A large portion of this goes through public procurement systems (OECD, 2005c).
-
20
40
60
80
100
120
140
160
180
200
19
90
19
91
19
92
19
93
19
94
19
95
19
96
19
97
19
98
19
99
20
00
20
01
20
02
20
03
20
04
20
05
20
06
20
07
20
08
20
09
Pri
vat
e p
arti
cip
atio
n in
infr
astr
uct
ure
in
dev
elo
pin
g c
ou
ntr
ies
($ 2
00
9 c
on
stan
t bil
lion
) Water
Telecom
Energy
Transport

- 71 -
Thus, well-designed public procurement systems could save a lot of public resources.
Conversely, a small flaw in the procurement design could result in significant losses of the
economy.
It remains a challenge to design an efficient procurement system. Competition has been
limited in infrastructure procurement auctions. In theory, competitive bidding is a powerful
device that can induce potential contractors to reveal their true costs, thereby finding the
lowest possible procurement price. However, the literature shows the average number of
bidders is about 3 to 5 in infrastructure projects (Gupta, 2002; De Silva, Dunne, and
Kosmopoulou, 2003; Alexeeva, Padam, and Queiroz, 2008).
Another concern is that infrastructure procurement is susceptible to corruption and collusion.
The literature particularly points many alleged collusive cases in the road sector all over the
world (e.g., Porter and Zona, 1993; Gupta, 2002; Price, 2008). This is because the size of
road procurement markets is often significant. In addition, the market competition is repeated
periodically. Thus, firms are easily motivated to collude with each other. Collusive
arrangements can be sustained (e.g., Saijo et al., 1996; Thomas, 2005; Ware et al., 2007).
Particularly in developing countries, the validity or enforceability of rules of conduct and
other laws remains weak and the capability of detecting misconduct is far from perfect. In
addition, sanctions may not be significant even if misconduct is detected.
In general, weak governance remains an important challenge to public procurement. This
could possibly impose additional large costs on governments and thereby taxpayers. About
35 percent of firms are estimated to offer informal payment to public officials to secure
public contracts in Africa; about 62 percent in Nepal (World Bank, 2009). In Indonesia
construction materials for roads were stolen or misused during the project implementation,
resulting in additional costs of 20 to 30 percent of total procurement costs (Olken, 2007).
Auriol (2006) estimates the cost of corruption to be between 4 and 10 percent of world
procurement spending. In Uganda, about 1.5 percent of GDP per year is estimated to be lost
because of widespread corruption, mostly in public procurement (Mellemfolkeligt Samvirke,

- 72 -
2005). In Africa as a whole, one-fourth of GDP may be lost to corruption every year
(Thachuk, 2005).
As a result, public roads are often underinvested and poorly maintained in developing
countries. Road maintenance is particularly to be neglected. In Africa, about 30 percent of
the infrastructure assets are estimated to need rehabilitation. In the road sector, only 37
percent of the road network in African low-income countries is in good condition. For feeder
or rural roads, the share is even lower. 17 percent of the tertiary roads are in good condition
(Foster and Briceno-Garmendia, 2010). Therefore, there remain the significant needs for road
investment and maintenance that have not been met.
Important, road assets deteriorate exponentially without proper maintenance. According to a
case study based on highway development software, HDM4, road roughness would increase
over time and exceed a usual maintenance standard of IRI 4.5 in 5 to 6 years.29
Generally,
maintaining roads assets is more cost-effective than letting them deteriorated and
reconstructing them. In Africa it is estimated that about $40 to $45 billion of road assets were
lost because of inadequate maintenance, which would have cost only $12 billion, during the
1970s and 1980s (Harral and Faiz, 1988). Moreover, climate change may increase the
importance of road maintenance, because poorly maintained roads are even more vulnerable
to severe weather conditions. Potholes, clacks and wide joints are the places where water
infiltrates in the road, accelerating deterioration. In developing countries, many roads remain
to be paved (Figure 44). This could add to the risk of road deterioration and thus the cost of
rehabilitating damaged road surfaces.
Therefore, the challenges for sustainable public road financing are complex and interrelated.
Governance will affect not only the bidding behavior at competitive bidding but also post-
29
In this particular case, a 10-km primary bituminous road with 2 lanes in a tropical area is examined using the
software HDM4. The project life is assumed 35 years. The discount rate is set at 12 percent. Two maintenance
options are compared: (i) do minimum (reconstruction when IRI reaches 10, with routine pothole patching and
edge treatment), and (ii) GASO4.5 (structural overlay at IRI 4.5, with routine pothole patching and edge
treatment).
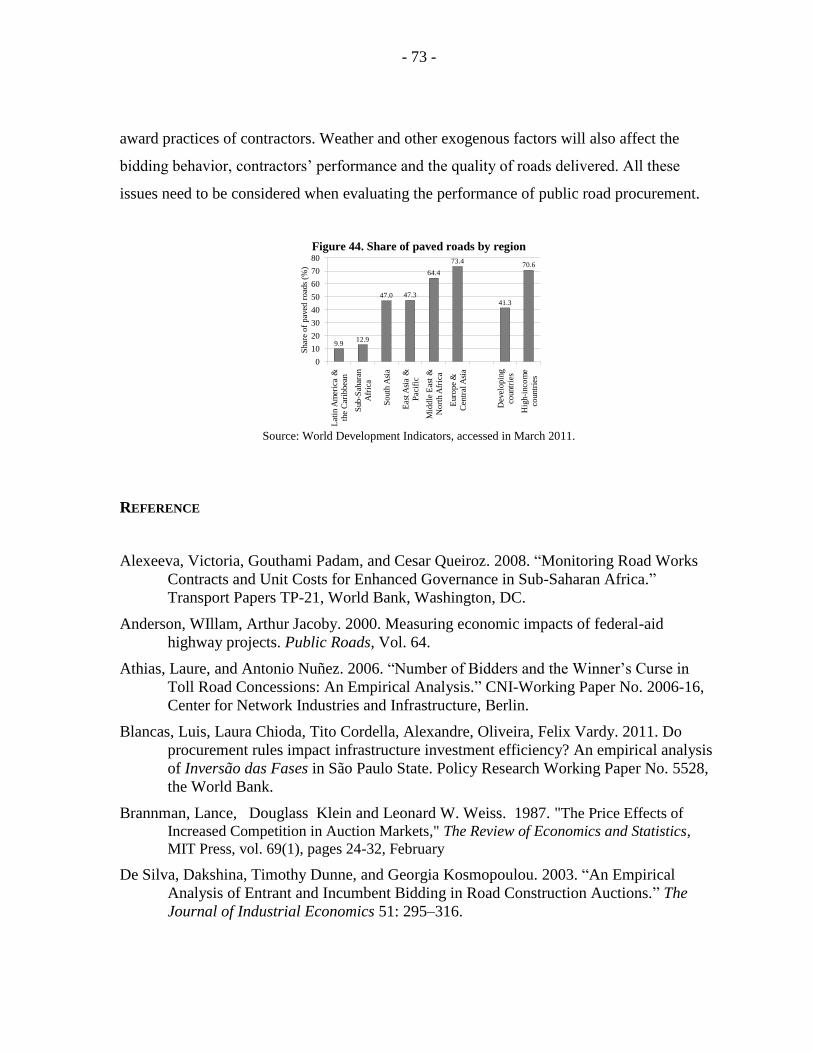
- 73 -
award practices of contractors. Weather and other exogenous factors will also affect the
bidding behavior, contractors’ performance and the quality of roads delivered. All these
issues need to be considered when evaluating the performance of public road procurement.
Figure 44. Share of paved roads by region
Source: World Development Indicators, accessed in March 2011.
REFERENCE
Alexeeva, Victoria, Gouthami Padam, and Cesar Queiroz. 2008. ―Monitoring Road Works
Contracts and Unit Costs for Enhanced Governance in Sub-Saharan Africa.‖
Transport Papers TP-21, World Bank, Washington, DC.
Anderson, WIllam, Arthur Jacoby. 2000. Measuring economic impacts of federal-aid
highway projects. Public Roads, Vol. 64.
Athias, Laure, and Antonio Nuñez. 2006. ―Number of Bidders and the Winner’s Curse in
Toll Road Concessions: An Empirical Analysis.‖ CNI-Working Paper No. 2006-16,
Center for Network Industries and Infrastructure, Berlin.
Blancas, Luis, Laura Chioda, Tito Cordella, Alexandre, Oliveira, Felix Vardy. 2011. Do
procurement rules impact infrastructure investment efficiency? An empirical analysis
of Inversão das Fases in São Paulo State. Policy Research Working Paper No. 5528,
the World Bank.
Brannman, Lance, Douglass Klein and Leonard W. Weiss. 1987. "The Price Effects of
Increased Competition in Auction Markets," The Review of Economics and Statistics,
MIT Press, vol. 69(1), pages 24-32, February
De Silva, Dakshina, Timothy Dunne, and Georgia Kosmopoulou. 2003. ―An Empirical
Analysis of Entrant and Incumbent Bidding in Road Construction Auctions.‖ The
Journal of Industrial Economics 51: 295–316.
9.912.9
47.0 47.3
64.4
73.4
41.3
70.6
0
10
20
30
40
50
60
70
80
Lat
in A
mer
ica
&
the
Car
ibbea
n
Sub
-Sah
aran
Afr
ica
South
Asi
a
Eas
t A
sia
&
Pac
ific
Mid
dle
Eas
t &
Nort
h A
fric
a
Euro
pe
&
Cen
tral
Asi
a
Dev
elopin
g
countr
ies
Hig
h-i
nco
me
countr
ies
Shar
e of
pav
ed r
oad
s (%
)

- 74 -
De Silva, Dakshina, Timothy Dunne, Anuruddha Kankanamge, and Georgia Kosmopoulou.
2008. ―The Impact of Public Information on Bidding in Highway Procurement
Auctions.‖ European Economic Review 52: 150–81.
Estache, Antonio, Atsushi Iimi. 2009. ―Joint Bidding, Governance and Public Procurement
Costs: A Case of Road Projects.‖ Annals of Public and Cooperative Economics 80:
393–429.
Estache, Antonio, Atsushi Iimi. 2010. ―Bidder Asymmetry in Infrastructure Procurement:
Are There Any Fringe Bidders?‖ Review of Industrial Organization 36: 136–87.
Estache, Antonio, Atsushi Iimi. 2011. The Economics of Public Infrastructure Procurement
in Developing Countries: Theory and Evidence. Center of Economic Policy Research:
London.
Fay, Marianne, and Tito Yepes. 2003. ―Investing in Infrastructure: What Is Needed from
2000 to 2010?‖ Policy Research Working Paper No. 3102, World Bank, Washington,
DC.
Flyvbjerg, Bent, Mette Skamris Holm, and Søren Buhl. 2002. ―Underestimating Costs in
Public Works Projects: Error or Lie?‖ Journal of the American Planning Association
68: 279-295.
Flyvbjerg, Bent, Mette Skamris Holm, Søren Buhl. 2004. What causes cost overrun in
transport infrastructure project? Transport Review, Vol. 24, pp. 3-18.
Foster, Vivien, Cecilia Briceno-Garmendia. 2010. Africa's Infrastructure: A Time for
Transformation. The World Bank.
Grimm, Veronika, Riccardo Pacini, Giancarlo Spagnolo, and Matteo Zanza. 2006. ―Division
into Lots and Competition in Procurement.‖ In Handbook of Procurement, ed. Nicola
Dimitri, Gustavo Piga, and Giancarlo Spagnolo, 168–192. Cambridge University
Press.
Guasch, Luis. 2004. Granting and Renegotiating Infrastructure Concessions: Doing It Right.
Washington, DC: World Bank.
Gupta, Srabana. 2002. ―Competition and Collusion in a Government Procurement Auction
Market.‖ Atlantic Economic Journal 30: 13–25.
Haile, P. 2001. ―Auctions with Resale Markets: An Application to U.S. Forest Service Timber Sales.‖
The American Economic Review, 91(3): 399-427.
Hong, Han and Matthew Shum. 2002. "Increasing Competition and the Winner's Curse:
Evidence from Procurement," Review of Economic Studies, Blackwell Publishing, vol.
69(4), pages 871-98, October.
Hyytinen, Ari, Sofia Lundberg, Otto Toivanen. 2006. Favoritism in public procurement:
Evidence from Sweden. International Public Procurement Conference Proceedings,
September 2006, pp. 279-327.
Iimi, Atsushi. 2006. ―Auction Reforms for Effective Official Development Assistance.‖
Review of Industrial Organization 28: 109-128.

- 75 -
Kagel, John H. and Dan Levin. 1986. "The Winner' s Curse and Public Information in
Common Value Auctions." American Economic Review, December, 76(5), pp. 894-
920.
Kessel, Reuben. 1971. ―A Study of the Effects of Competition in the Tax-Exempt Bond
Market.‖ The Journal of Political Economy 79: 706–38.
Klemperer, Paul. 1998. Auctions with almost common values: The 'Wallet Game' and its
applications," European Economic Review, Elsevier, vol. 42(3-5), pages 757-769,
May
Levin, Dan and James Smith. 1994. ―Equilibirum Auctions with Entry‖, The American
Economic Review, Vol. 84, No. 3. (Jun., 1994), pp. 585-599.
Li, Tong, and Isabelle Perrigne. 2003. ―Timber Sale Auctions with Random Reserve Prices.‖
Review of Economics and Statistics 85: 189–200.
Li, Tong, and Xiaoyong Zheng. 2006. ―Entry and Competition Effects in First-Price
Auctions: Theory and Evidence from Procurement Auctions. Cemmap working paper
CWP13/06, University College London.
McAfee, Preston, and John McMillan. 1987. ―Auctions with a Stochastic Number of Bidders.‖
Journal of Economic Theory 43: 1–19.
Menezes Paulo K. and Flavio M. Menezes, 2000. "Auctions with endogenous participation,"
Review of Economic Design, Springer, vol. 5(1), pages 71-89.
Milgrom, Paul and Robert Weber. 1982. A Theory of Auctions and Competitive Bidding ,
Econometrica, 50, 1982, 1089-1122.
Nepal Central Bureau of Statistics. 2004. Nepal Living Standards Survey: Statistical Report.
Nepal Central Bureau of Statistics.
Ohashi, Hiroshi. 2009. ―Effects of Transparency in Procurement Practices on Government
Expenditure: A Case Study of Municipal Public Works.‖ Review of Industrial
Organization 34: 26785.
Paarsch, Harry J. 1992. "Deciding between the common and private value paradigms in
empirical models of auctions," Journal of Econometrics, Elsevier, vol. 51(1-2), pages
191-215
Paarsch, Harry J. 1997. ―Deriving an Estimate of the Optimal Reserve Price: An Application to
British Columbian Timber Sales.‖ Journal of Econometrics, 78(2): 333-357.
Porter, Robert, and Douglas Zona. 1993. ―Detection of Bid Rigging in Procurement
Auctions.‖ Journal of Political Economy 101: 518–38.
Price, Michael. 2008. ―Using the Spatial Distribution of Bidders to Detect Collusion in the
Marketplace: Evidence from Timber Auctions, Journal of Regional Science 48: 399-
417.
Rezende, L. 2005. Auction econometrics with least squares. Mimeograph, University of
Illinois, Urbana-Champlain, IL.

- 76 -
Schwartz, Jordan, Luis Andres, and Georgeta Dragoiu. 2009. ―Crisis in Latin America:
Infrastructure Investment, Employment and the Expectations of Stimulus.‖ Policy
Research Working Paper No. 5009, World Bank, Washington, DC.
United Nations. 2011. Final Report: United Nations Development Assistance Framework for
Nepal 2008-2010. Available at
http://www.un.org.np/sites/default/files/report/united_nations_development_assistanc
e_framework_2008-2010_-_evaluation_report.pdf
Ware, Glenn, Shaun Moss, Edgardo Campos, and Gregory Noone. 2007. ―Corruption in
Public Procurement: A Perennial Challenge.‖ In The Many Faces of Corruption:
Tracking Vulnerabilities at the Sector Level, ed. Edgardo Campos and Sanjay
Pradhan, 295–334. Washington, DC: World Bank.
Wilson, Robert. 1977. ―A Bidding Model of Perfect Competition.‖ The Review of Economic
Studies 44: 511–18.
Wolfstetter, Elmar. 1996. ―Auctions: An Introduction.‖ Journal of Economic Surveys 10:
367–421.
World Bank. 2005a. Project Appraisal Document: Rural Access Improvement and
Decentralization Project. Report No. 31624-NP. The World Bank.
World Bank. 2005b. Infrastructure and the World Bank: A Progress Report. World Bank:
Washington, DC.
World Bank. 2007. Nepal Public Finance Management Review: Managing Public Finances
for a New Nepal (No. 43384-NP).
World Bank. 2008a. Procurement under World Bank-Financed Projects: FY07 Annual
Report. Operations Policy and Country Services. Washington, DC: World Bank.
World Bank. 2009. Project Paper on Nepal Rural Access Improvement and Decentralization
Project, 2009 (No. 50766-NP).
World Bank. 2009. Enterprise Survey: 2009 Nepal. Available at
http://www.enterprisesurveys.org/ExploreEconomies/?economyid=136&year=2009


