
Effects of Various Levels of Fatigue on the Speed and ...
83
Louisiana State University LSU Digital Commons LSU Historical Dissertations and eses Graduate School 1979 Effects of Various Levels of Fatigue on the Speed and Accuracy of Visual Recognition. Robert Lewis Johnson Louisiana State University and Agricultural & Mechanical College Follow this and additional works at: hps://digitalcommons.lsu.edu/gradschool_disstheses is Dissertation is brought to you for free and open access by the Graduate School at LSU Digital Commons. It has been accepted for inclusion in LSU Historical Dissertations and eses by an authorized administrator of LSU Digital Commons. For more information, please contact [email protected]. Recommended Citation Johnson, Robert Lewis, "Effects of Various Levels of Fatigue on the Speed and Accuracy of Visual Recognition." (1979). LSU Historical Dissertations and eses. 3442. hps://digitalcommons.lsu.edu/gradschool_disstheses/3442
Transcript of Effects of Various Levels of Fatigue on the Speed and ...

Louisiana State UniversityLSU Digital Commons
LSU Historical Dissertations and Theses Graduate School
1979
Effects of Various Levels of Fatigue on the Speedand Accuracy of Visual Recognition.Robert Lewis JohnsonLouisiana State University and Agricultural & Mechanical College
Follow this and additional works at: https://digitalcommons.lsu.edu/gradschool_disstheses
This Dissertation is brought to you for free and open access by the Graduate School at LSU Digital Commons. It has been accepted for inclusion inLSU Historical Dissertations and Theses by an authorized administrator of LSU Digital Commons. For more information, please [email protected].
Recommended CitationJohnson, Robert Lewis, "Effects of Various Levels of Fatigue on the Speed and Accuracy of Visual Recognition." (1979). LSU HistoricalDissertations and Theses. 3442.https://digitalcommons.lsu.edu/gradschool_disstheses/3442

INFORMATION TO USERS
This was produced from a copy of a document sent to us for microfilming. While the most advanced technological means to photograph and reproduce this document have been used, the quality is heavily dependent upon the quality of the material submitted.
The following explanation of techniques is provided to help you understand markings or notations which may appear on this reproduction.
1. The sign or “ target” for pages apparently lacking from the document photographed is “Missing Page(s)” . If it was possible to obtain the missing page(s) or section, they are spliced into the film along with adjacent pages. This may have necessitated cutting through an image and duplicating adjacent pages to assure you of complete continuity.
2. When an image on the film is obliterated with a round black mark it is an indication that the film inspector noticed either blurred copy because of movement during exposure, or duplicate copy. Unless we meant to delete copyrighted materials that should not have been filmed, you will find a good image of the page in the adjacent frame.
3. When a map, drawing or chart, etc., is part of the material being photographed the photographer has followed a definite method in “sectioning” the material. It is customary to begin filming at the upper left hand comer of a large sheet and to continue from left to right in equal sections with small overlaps. If necessary, sectioning is continued again—beginning below the first row and continuing on until complete.
4. For any illustrations that cannot be reproduced satisfactorily by xerography, photographic prints can be purchased at additional cost and tipped into your xerographic copy. Requests can be made to our Dissertations Customer Services Department.
5. Some pages in any document may have indistinct print. In all cases we have filmed the best available copy.
UniversityMicrollrns
International3 0 0 N. Z EE B ROA D. ANN A R B O R . Ml 4 8 1 0 6 18 B E D F O R D ROW. L O ND O N WC1R 4 E J . E NG LA N D

8013123
JOHNSON, ROBERT LEWIS
EFFECTS OF VARIOUS LEVELS OF FATIGUE ON THE SPEED AND ACCURACY OF VISUAL RECOGNITION
The Louisiana State University and Agricultural and Mechanical Col.University ph.d. 1979
MicrofilmsInternational 300 N. Zeeb Road, Ann Arbor, MI 48106 18 Bedford Row, London WC1R 4EJ, England

EFFECTS OF VARIOUS LEVELS OF FATIGUE
ON THE SPEED AND ACCURACY OF VISUAL RECOGNITION
A Dissertation
Submitted to the Graduate Faculty of the Louisiana State University and
Agricultural and Mechanical College in partial fulfillment of the
requirements for the degree of Doctor of Philosophy
in
The Department of Health, Physical, and Recreation Education
by"Robert Lewis Johnson
B.A., Lenoir Rhyne College, 1973 M.A., University of South Carolina, 1974
December, 1979

ACKNOWLEDGEMENTS
The author wishes to thank Dr. Jerry Thomas, Dr. Mike Stone, Dr. Dick Magill, and Dr. Bob Mathews for the time and effort put into this investigation.
A special thanks to Dr. Jack Nelson whose leadership and guidance in this endeavor were invaluable.
ii
TABLE OF CONTENTS
PageACKNOWLEDGEMENTS................................. ■........... iiLIST OF T A B L E S ..................... vLIST OF FIGURES...................................... vi
ABSTRACT..................................................... viiCHAPTER I - INTRODUCTION.................................... 1
Review of Literature.................................... 3Theories of Selected or Devided Attention........ 3Memory Load and Reaction Time..................... 5Physical Exercise and Vision ..................... 7Arousal and Mental Performance ................... 8Sleep Deprivation and Mental Performance ........ 8Exertion and Mental Performance................... 9Pattern Recognition............................... 12Summary of Related Literature..................... 13
Statement of the Problem................................ 16Research Hypothesis .................................... 16Operational Definitions ............................... 17Assumptions............................................ 18Limitations................ 19Significance of the S t u d y............................. 19
CHAPTER II - METHODS........................................ 22
Selection of Subjects .................................. 22Apparatus.............................................. 22Procedures.............................................. 24
Establishment of Groups........................... 25Experimental Treatments ......................... 26
Statistical Analysis of Data.................. 28
CHAPTER III - RESULTS............... ..................... 30
Correctness of Response................................. 30Statistical Analysis............. ..................... 30
Response Time...................................... 31Analysis of Regression for Response T i m e ....... 34Fatigue and Correctness of Response............. 37
iii

Pedal RatePage39
CHAPTER IV - DISCUSSION................................ 40
Effect of Fatigue on Recognition ................. 41Effect of Item Type on Response T i m e .............. 43Effect of Set Size on Response Time................. 44Summary............................................ 44
REFERENCES............................................ 47APPENDIX A ............................................ 52
APPENDIX B ............................................ 55APPENDIX C ............................................ 58APPENDIX D ............................................ 66V I T A .................................................. 71
Iv

LIST OF TABLES
TABLE NO. Page
1 SUMMARY OF ANALYSIS OF VARIANCE AND ORTHOGONALCOMPARISONS FOR DEPENDENT VARIABLE RESPONSETIME........................................ 32
Cl TABLE OF OVERALL CORRECTNESS OF RESPONSE . . . . 59C2 MEANS AND STANDARD DEVIATIONS ACROSS ALL FATIGUE
LEVELS...................................... 60C3 MEANS AND STANDARD DEVIATIONS BY ITEM TYPE FOR
RESPONSE T I M E ............................. 61C4 MEANS AND STANDARD DEVIATIONS BY ITEM TYPE FOR
LOW FATIGUE G R O U P ......................... 62C5 MEANS AND STANDARD DEVIATIONS BY ITEM TYPE FOR
INTERMEDIATE FATIGUE GROUP................. 63C6 MEANS AND STANDARD DEVIATIONS BY ITEM TYPE FOR
HIGH FATIGUE GROUP......................... 64C7 PERCENTAGES OF CORRECT RESPONSES BY FATIGUE
L E V E L ...................................... 65Dl SUMMARY OF ANALYSIS OF VARIANCE FOR DEPENDENT
VARIABLE PEDAL R A T E ....................... 67D2 SUMMARY OF ANALYSIS OF REGRESSION FOR LOW FATIGUE
G R O U P .............................. 68D3 SUMMARY OF ANALYSIS OF REGRESSION FOR INTERMEDIATE
FATIGUE GROUP ............................. 69D4 SUMMARY OF ANALYSIS OF REGRESSION FOR HIGH FATIGUE
G R O U P ...................................... 70
v

LIST OF FIGURES
Figure No. Page1 Flow model of the limited channel theory........... 32 Flow model of the limited channel theory proposed
by Deustch and D e u s t c h ....................... 43 Capacity model...................................... 64 Changes in mean correctness across fatigue levels . 33
5 Changes in mean correctness times for all types ofitems between groups.............................. 35
6 Mean response times for all types of slides acrosslevels.............................................36
7 Regression lines for fatigue levels ................ 38
vi

ABSTRACT
Thirty-six volunteer subjects participated in an investigation to examine the effects of various levels of fatigue on recognition memory. The subjects, who were required to learn certain items, were divided into two groups based on memory set size. The memory set items consisted of dot patterns of the Garner-Clement variety. These memory set items as well as alternates (items never seen by the subjects) were presented via a tachistoscopic slide projector. The items were of five types; (1) target items of high goodness, (2) target items of low goodness, (3) alternate items of high similarity to target items of high goodness, (4) alternate items of high similarity to target items of low goodness, and, (5) alternate items of low similarity to both types of target items. Upon presentation of each item a digital response time counter would begin to register.The subjects responded to each item by depressing a telegraph key which stopped the response time counter. Correctness of response as well as response times were recorded for each item. All subjects completed the above procedure while under the influence of fatigue induced by pedaling a cycle ergometer. Fatigue levels were no fatigue, 80% of PW C ^ q for six minutes, and 100% of PWC^ q for six minutes. The subjects responded to each item presentation concurrent with the pedaling of the cycle ergometer.
The results indicated that fatigue of the type and intensity employed does not significantly effect overall recognition time.There was, though, a significant difference in response times between
vii
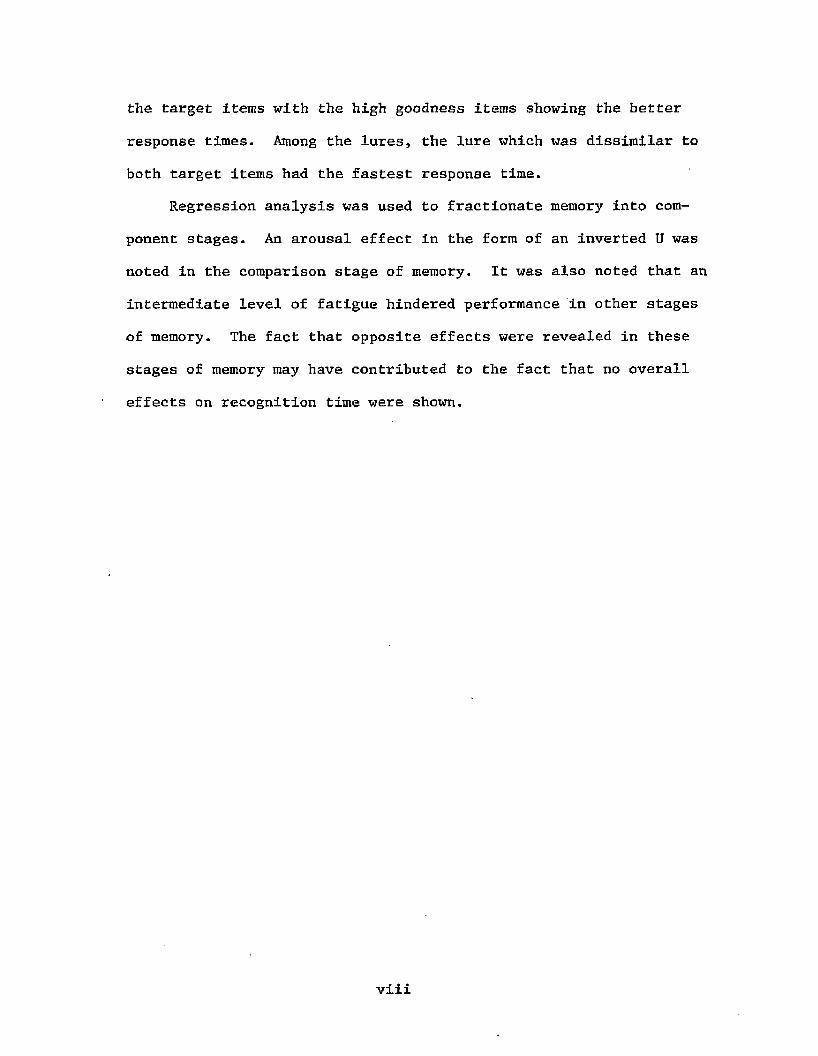
the target items with the high goodness items showing the better response times. Among the lures, the lure which was dissimilar to both target items had the fastest response time.
Regression analysis was used to fractionate memory into component stages. An arousal effect in the form of an inverted U was noted in the comparison stage of memory. It was also noted that an intermediate level of fatigue hindered performance in other stages of memory. The fact that opposite effects were revealed in these stages of memory may have contributed to the fact that no overall effects on recognition time were shown.
viii
CHAPTER I
INTRODUCTION
Success in motor performance is dependent upon many variables. One such variable is how quickly the performer recognizes stimuli and
processes information about the stimuli. Assitionally, the performer must separate the relevant from the irrelevant stimuli which may be
presented simultaneously.Snodgrass, Luce, and Galanter (1967) maintain that the major
portion of the increased time and variability of complex reaction time scores over that of simple reaction time scores is caused by an increase in the amount of time for the process of recognition. Recogni
tion of stimuli is internal and falls within the framework of human information processing. There are currently several models or flow charts which depict the human information processing system (Crowder, 1976, ch. 2; Martiniuk, 1976, p. 5; Singer, 1975, ch. 3). While these conceptualizations differ in both design and terminology, they possess basic similarities in that they all utilize the sensory, perceptual,
decision, and effector central control mechanisms.The human has innate difficulty in processing excessive amounts
of information simultaneously. Difficulty or delay in processing time has been determined to be of central origin and may be due to the increasing complexity of the task which affects either the perceptual
or decision mechanisms (Welford, 1959). A delay at either of these two functions would have a detrimental effect on the response time of
the performer.1

Task complexity may be increased if either the difficulty of a
single task is increased or the performer is required to complete two
or more tasks simultaneously. In both cases, a greater demand is
placed on the total processing capacity of the performer.The ability to perform is an interaction between one’s physical
and mental capabilities. Thus, along with competing mental tasks one
often has to cope with the demands of physical tasks with regard to
available processing space. Kahneman (1973) pointed out that when an
individual is performing concurrent physical and mental tasks no decre
ment will be shown in either task until the processing capacity of the
individual is exhausted, but as the demands of one task increase and
begin to exceed certain limits the performance on one or both of the
tasks begins to deteriorate.In athletics and other forms of physical activity, the performer
is often required to perform certain mental tasks while under stressful
physiological conditions such as different levels of fatigue. The
stress imposed by the physiological demands may interfere with the recog
nition of stimuli, both relevant and irrelevant. Since recognition
demands increase with increased complexity of stimuli, perceptual demands plus the added demands of rigorous physical exercise may exceed the total
processing limits of the individual in certain situations. This could
be detrimental to performance of the physical task, the mental task, or
both depending upon the circumstances. It was the purpose of this study
to investigate the effects of physical fatigue on the speed and accuracy
of visual recognition.

3
Review of Literature
Theories of Selected or Divided AttentionOne of the earliest theories of divided attention was the lim
ited channel theory (Davis, 1957, 1959; Welford, 1959). The basic assumption underlying the limited channel theory is that there is a single channel through which one signal can be cleared at a time. It Is assumed that (1) there are a number of sensory input mechanisms capable of receiving and storing data for a short period; (2) a number of effector mechanisms contain both control and perceptual elements capable of carrying out a series of actions; and, (3) most importantly, there
exists a single channel decision mechanism between the two (see Fig
ure 1) ,According to this theory, sensory data may be collected and
stored for a brief period until the channel is cleared. When two stimuli are presented simultaneously, the increase in reaction time latencies are accounted for by the brief storage period (Welford, 1959).Delay of refractory period is experienced regardless of whether the inputs are of the same or of different modality (Davis, 1959).
.. . _____ Sensory _______ Perceptual _______ Responsemu us Registration Analysis Selection
Stimulus 2 ----- StorageFigure 1. Flow model of the limited channel theory.
(From Kahneman, 1973, p. 6.)Deustch and Deustch (1963), while still following the single,
limited channel concept, proposed that the bottleneck in processing was
not between the sensory registration and storage as proposed earlier,

but between the perceptual analysis and the response selection (see Figure 2). Consequently, the perceptual mechanism performs the function
of separating the relevant stimuli from the irrelevant stimuli.
„ . „ Sensory Perceptual ResponseStimulus 1 ------ Q , J _ ------- * i j -------Registration _______ AnalysisStimulus 2 ------ Storage
Figure 2. Flow model of the limited channel theory proposed by Deustch and Deustch. (From Kahneman, 1973.)
An alternative to the single limited channel theory is the multichannel theory (Allport, Antonis, & Reynolds, 1972). The multi-channel theory postulates that there are special purpose computers termed processors and stores, which operate in parallel fashion. In some cases, the computers are capable of accepting only one message at a time. In this paradigm, processing will be suppressed only to the extent that the same processors are involved in dual processing. While hypothesizing a multi-channel mode of information processing the multi-channel theory
does not deny the single channel capacity of the brain. The single
channel capacity of the brain will be enhanced to the extent the subject
is concentrating on just one particular task.Dissatisfaction with the preceding models led to the postulation
of the limited channel model (Kahneman, 1973; Moray, 1967). The previously mentioned theories assumed the existence of structural bottlenecks within the system. A capacity model (see Figure 3) assumes that there is a general limit on man's ability to perform mental work and that the limited capacity can be allocated with considerable freedom among concurrent activities. Different activities impose different
demands on the limited capacity of the system. When the demands placed
on the system exceed its capacity, performance falters or fails entirely.
The activity can fail either because there is not enough capacity to
meet the demands or because the allocation policy channels available capacity to other activities (Kahneman, 1973).
Physiological factors may have direct influence on the system.The allocation policy may be influenced by these physiological factors. Fatigue and sleep deprivation apparently increase the difficulty of continuous performance and the motivated subject compensates by increased effort (Kahneman, 1973). High arousal within the subject causes allocation to be concentrated on the dominant aspects of the situation at the
expense of other aspects (Kahneman, 1973, p. 38).Allocation of attention with the limited capacity model is of
prime consideration in dealing with motor performances. The variability
of responses when dealing in a dual task paradigm may be accounted for
within this allocation policy.
Memory Load and Reaction TimeSternberg (1969) has shown that reaction time increases linearly
with increasing numbers of items in the memory set. Using from one to six items, Sternberg concluded that reaction time increases by approximately 38 msecs with the addition of each new item into the memory set. Sternberg (1969) regressed response time across memory set load and concluded that the resultant slope represented the comparison stage of memory and the Intercept represented all those events which occur just once, such as the encoding of stimuli and the organization and execution

MI S C E LL A NE O USDETERMINANTS
MI S C E LL A NE O US M A N I F E S T A T I O N S O F AROUSAL
AROUSAL
E N D U R I N GD I S P O S I T I O N S
A L L O C A T I O NP O L I C Y
M O M E N T A R Yi n t e n t i o n s E V A L U A T I O N
O F D E M A N D S O N
V C A P A C I T Y ,POSSIBLE ACTIVITIES
Figure 3. Capacity model. (From Kahneman, 1973, p. 10.)
6

of the motor response. Sternberg (1969) further explained that when two or more regression lines (each constructed using different types of stimuli) were compared differences in slopes would be interpreted as the effects these different stimuli had on the comparison stage of memory. Also, any difference in the slopes would reflect the effects the stimuli had on the other events associated with memory.
Physical Exercise and VisionVision has been shown to be affected by physical activity.
Krestovnikov (1951), citing a series of Russian studies, reported a
significant increase in visual acuity and field of vision following a
1,000 meter run. Maximum increase in acuity was noted immediately fol
lowing the run in a majority of the individuals participating in a
follow-up study. Krestovnikov (1951) also reported that athletes, specifically basketball, soccer, and hockey players had an increased visual field following competition. These findings are somewhat in conflict with the findings of Tussing (1940) who noted both a marked improvement and a marked impairment of vision in athletes following a football practice. A more recent study Vlahov (1977) supports the reports made by Krestovnikov (1951). Vlahov, using the Harvard Step Test as the mode of exercise, determined that following the completion of this test visual acuity was improved.
Tachistoscopic detection is also influenced by various levels of
physical exercise (Goldwater & Zirul, 1973). Tachistoscopic detection was affected in an inverted U fashion following various periods of side
straddle hops up to a maximum of 100 seconds. It was suggested that

physical activity may serve as an attention diverting device.
Arousal and Mental PerformancePerformance in different activities has been studied within at
least two conceptual frameworks, the inverted U (Hebb, 1949) and the signal detection framework (Welford, 1975). It has generally been concluded that arousal induced by increased muscular tension or white noise has a facilitating effect on the performance of various mental tasks (Dornic & Stelmach, 1974; Hamilton, Hockey, & Quinn, 1972; Hockey & Hamilton, 1970; Welford, 1963). A Hebbian or inverted U relationship
has also been demonstrated between performance on a mental task and the
level of arousal within the subject (Stennett, 1958) . Auditory stimula
tion or arousal by the use of white noise also facilitates the percep
tion of stimuli presented on a tachistoscope (Andraessi, 1965).
Sleep Deprivation and Mental PerformanceFatigue due to sleep deprivation has been found to affect various
types of mental performance. Immediate recall of word lists showed a significant impairment after one night sleep loss while a delayed picture recognition task showed no significant deficit (Williams, Giesking, & Lubin, 1966). This finding led the authors to deduce that the sleep loss caused difficulty in the formation of the memory trace rather than in storage or retrieval of the material.
Two nights of sleep loss impaired the speed but not the accuracy of mathematical problems (Loveland & Williams, 1963; Williams & Lubin,
1967). The subjects completed the required mathematical addition and
subtraction problems after sleep loss with approximately the same

accuracy as during a trial prior to sleep loss, but their speed at this task was significantly hampered. After three complete days of sleep loss, both the speed and the accuracy of these mental tasks were significantly undermined (Wilkinson, 1962).
The complexity of the mental task has also been shown to be an important variable when measuring the effects of sleep loss. The more
complex the task, whether it is a card sorting task or choice reaction
task, the greater the deterioration in performance when compared to less complex tasks measured over the same period of sleep deprivation
(Daftuar & Sinaa, 1972; Wilkinson, 1964).
Exertion and Mental PerformanceThe research pertaining to exertion and mental performance has
involved a variety of tasks and different levels of exertion. The Hebbian or inverted U hypothesis has been used as a framework or basis for much of this research.
Physical exertion has been shown to have an effect on mental performance. For instance, light physical effort has been determined to enhance short memory (Domic, Borg, & Ohllson, 1973). Although no reference was made to fatigue, the results may be an indicator of how the early stages of fatigue affect mental performance. Burgess and Hokanson
(1964) determined that lifting the same amount of weight for various periods of time under various levels of exertion affected performance on a digit symbol task in an inverted U fashion. More complex tasks have
also been affected in the same manner. An inverted U relationship was found when mathematical problems were worked under various levels of

10
exertion on a bicycle ergometer (Stockfeldt, 1970). The subjects per
formed at different percentages of their previously determined maximum workloads. The subjects pedaled for five min. at these predetermined percentages before being tested. It was determined that the best performance resulted when the subjects performed at a level equal to 45 percent of their maximum and poorest when they worked at 85 percent of their maximum. Davey's (1973) results were in agreement, indicating a significant improvement in mental performance following moderate exercise and a significant decrease in performance with severe exertion. Davey also concluded that intermediate levels of exertion affected different people in different ways, i.e., mental performance is related
to subject or personality variables, and these may affect performance also. Stauffacher (1937), on the other hand, noted a linear relation
ship between increased exercise and decreased mental performance. As
the load of concomitant exercise (pulling weights) increased, the per
formance on memorizing nonsense syllables decreased.Exception to the above findings was taken by Flynn (1972), who
found no significant differences in treatments when various levels of exertion were used in conjunction with a mathematical task. However, Flynn used elementary school boys as subjects instead of adults which
had been used in the preceding studies.Girondo and Pellegrini (1976) hypothesized that medium effort
may act as an attention diverting device. The researchers determined that certain levels of physical exercise do not affect levels of attention. In this study one group of subjects viewed a film at rest and
another group viewed the same film while pedaling a cycle ergometer.

11Both groups were tested for recall at the completion of the film. No
significant difference was shown between the two groups in the amount of information recalled and the authors concluded that exercise at this
level did not serve as an attention diverting device.
Exhaustion has been shown to produce a significant negative effect
on the performance of certain mental tasks. Gutin and Digennaro (1968)
found that extreme exhaustion from treadmill walking had a significant
negative effect on accuracy performance in long addition. No adverse effects were noted on the speed of computation.
The physical condition of the subjects apparently is related to mental performance during periods of exertion. Gutin and DiGennaro (1968) and Stockfeldt (1970) noted that there was a tendency for the unconditioned subjects to perform worse than the conditioned subjects while under the same exercise conditions.
The complexity of the task has been shown to have an effect on the performance of mental tasks under fatiguing situations. Simple tasks such as pressing a button to a visual stimulus are not affected by
various levels of exertion (Meyers, et al., 1969; Shore, 1958). Con- versely, Levitt and Butin (1971) found that when the heart rate exceeds
175 beats per minute the performance on a five choice reaction time task deteriorated. The authors concluded that tasks using considerable information processing will be performed best at a low exercise induced activation while those requiring little or no information processing will be performed best at a high exercise induced activation. Sjoberg (1977) noted essentially the same phenomenon. Sjorberg had subjects pedal on a cycle ergometer at prescribed workloads for a period of 10.5 minutes.

Reaction time measures were taken the last five minutes of each bout.It was determined that more complex reaction time tasks were performed best at lower heart rates (workloads) and that simple tasks were performed best at higher heart rates. Generally, the inverted U was shown for all levels of task difficulty over various exercise levels.
Pattern RecognitionChekosky and Whitlock (1973) have shown that pattern goodness and
pattern similarity are significant factors in the recognition of learned patterns. Chekosky and Whitlock used patterns which had been previously classified as to their goodness (Garner & Clement, 1963). Pattern goodness was determined by having subjects classify and arrange, based on a prearranged criteria, a group of 90 dot patterns into groups based on similarity. These dot patterns consisted of five dots each with no more than three dots going either horizontally or vertically (see Appendix A). It was determined that the better patterns were those that were classified into the smaller groups by the subjects. This was due to the
fact that they were less related to other patterns. Conversely, those patterns found to be of poorer quality were those that were placed into
larger groups. Basically, these patterns placed into the larger groups
were difficult to distinguish from others in that group. Also, the
better patterns were found to have fewer alternatives. That is, when a
basic pattern is rotated 90 degrees or reflected in a mirror, the better patterns have fewer changes. For example, the pattern . . . is considered good because no matter how it is rotated or reflected the same pattern still exists. At the other end of the continium, when the

13* #
pattern . . Is rotated and reflected, eight different patterns are
yielded. Garner and Clement (1963) found a correlation of .83 between the size of the pattern groups and the goodness rating given by the
subjects.Chekosky and Whitlock (1973) found that response times for good
patterns were significantly faster than for poor patterns for correct
yes responses when used in a recognition paradigm. When an alternate
pattern was presented, the response times were faster for those patterns
which were dissimilar to the target item than for highly similar alternates.
Summary of Related LiteratureThree theories of divided attention were postulated. All three
address the problem of competing activities and too much information bombarding the system at one time. Of the three, the limited channel model (Kahneman, 1973; Moray, 1967) appears to have the most credence due to its consideration of allocations of attention. This theory discounts the more structured hypothesis of bottlenecks within the system and advocates a more flexible method of distribution of attention. This
theory also takes into account physiological effects on the total amount
of attention available.Arousal by other means such as white noise or mild muscular ten
sion has a facilitory effect on mental performance (Dornic & Stelmach, 1974; Hamilton, Hockey & Quinn, 1972; Hockey & Hamilton, 1972; Welford, 1963). Auditory stimulation also enhances the perception of visual stimuli (Andraessi, 1965). A Hebbian or inverted U relationship was

14
found when various levels of arousal were employed in a mental task
(Stennett, 1957).
Fatigue, induced by either sleep loss or physical exertion, af
fects mental performance. The finding that a treadmill run to exhaustion
had a negative effect on the accuracy but not the speed of a mathematical
task (Loveland & Williams, 1963; Williams & Lubin, 1967). The disagreement may be explained in at least two ways: one, it may be that thefatigue incurred from sleep loss is quite different from physical fatigue induced by treadmill running; secondly, the methodology in the studies differed. Subjects in the Gutin and DiGennaro study were allowed only a certain amount of time to complete the task, thus, the speed of performance was held constant while the accuracy was allowed
to fluctuate.Light physical effort facilitates memory (Dornic, Borg, & Ohllson,
1973) and the inverted U relationship was found when the same mental
work was performed at various levels of exertion. On the other hand,
Stauffacher (1937) found a linear relationship between levels of physi
cal exercise and decreasing mental performance and Girodo and Pelegrini (1976) found that concomitant physical exercise has no effect on recall memory. Davey (1973) also concluded that an intermediate amount of exertion had different effects on different people, hypothesizing that mental performance is directly related to personality and subject variables. Physical exertion as a variable was considered by Gutin and Di- Gennaro (1968) and Stockfeldt (1970). Both studies concluded that the better conditioned subjects performed mental tasks better than the poorer conditioned subjects during the period of exertion.

Task complexity has also been shown to affect performance. Simple reaction time was not affected during various levels of exertion (Meyers et al., 1969; Shore, 1958; Sjoberg, 1977), but the performance on a five choice reaction time task significantly decreased at heart rates about
175 beats per minute (Levitt & Gutin, 1971). It was further concluded that tasks requiring little information processing may be better per- formed at a high level of exercise induced activation (EIV) while those
requiring considerable information processing are performed best at a low level of EIA (Levitt & Gutin, 1971). Along the line of task complexity was the work of Chekosky and Whitlock (1973). These researchers, using dot patterns, found that the better patterns were recognized faster than the poorer patterns and that the reaction time for highly similar stimuli was poorer than that of less similar stimuli. Task complexity may be increased by adding more items. Sternberg (1969) reported a linear relationship between reaction time and the number of
items in memory.Lastly, many mental tasks require the use of vision. Krestovni
kov (1951) and Vlahov (1977) have shown that heavy exercise has the temporary effect of improving visual acuity. Various levels of physical activity affect tachistoscopic detection. Goldwater and Zirul (1973)
found the inverted U relationship when tachistoscopic detection was completed at various levels of exercise.
It may be said that a relationship does exist between physical activity and mental performance. This relationship shows that various levels of exertion may affect mental performance. Physical exertion has been shown to both facilitate and hinder mental performance. The

16literature concerning physical activity and mental performance is somewhat confusing and there appear to be discrepancies in the findings.The discrepancies center around the effects, if any, of physical exercise on mental performance, which may be explained in two ways. First, various methods or tasks were employed to activate the subjects and the
methods employed different frequencies and durations. Secondly, dif
ferent mental tasks were employed, which may involve different mechan
isms of the brain and thus not be measuring the same phenomenon.
Statement of the Problem
The literature contains many studies concerning mental performance and physical exercise. There is some difficulty in comparing the results of these studies primarily due to differing methodology employed. It was the primary purpose of this study to investigate the effects of physical fatigue on the visual recognition of previously learned material. Within this framework was an examination of varying memory set size and complexity of the mental task in conjunction with the varying
levels of physical exertion.
Research Hypotheses
1. An arousal effect in response time will be demonstrated as
the level of fatigue increases and there will be a significant decrease
in response time between the control subjects and those exercising for
the 100% of PWC^yg level.2. There will be no significant decrease in correctness as a
result of fatigue.3. There will he a significant difference in target response

17time with the target pattern classified as "good" showing the better response time.
4. There will be a significant difference in response time of the target pattern lures with the lure which is highly dissimilar having the faster response time.
5. There will be a significant difference in the overall response time with regard to number of items in memory group with the two-item showing faster response time than the six-item group.
Operational Definitions Visual Recognition Task - In this study the visual recognition task involved the identification of previously learned dot patterns of the Garner-Clement variety (Garner & Clement, 1963) presented via a slide
presentation (see Appendix A).Physical Fatigue Task - Physical fatigue is a rather nebulous term.There is no specific definition of this term but there is general agreement as to what it encompasses (Astrand & Rodahl, 1977; Bartlett, 1963; Christensen, 1960; Dill, 1942; Simonson, 1971). Bartlett (1953) proposes an idea which appears to include the considerations of the above mentioned researchers. Bartlett states:
Fatigue is a terra used to cover all those discernable changes in the expression of an activity which can be traced to the continuing exercise of that activity under its normal conditions, which can be shown to lead, either immediately or after delay, to deterioration in the expression of that activity, or more simply, to results within the activity that are not wanted.

Physical fatigue is not an all-or-none proposition in that it may
occur to various degrees, and the results of this fatigue may not be
readily observable. Within the framework of this definition the sub
jects will be fatigued. This fatigue task will be administered by
having the subjects pedal a cycle ergometer at a prescribed workload
for a set period of time.Response Time - The response time was the total time between the presen
tation of the slides and the pressing of the telegraph key to stop the
response timer.Correctness of Response - Correctness of response was defined as to
whether the subjects correctly identified the target items as ones that
had been previously learned and identified the lures as items that had
never been seen.Physical Working Capacity 170 - Physical Working Capacity 170 was defined
as the amount of work on a bicycle ergometer necessary to elicit a heart
rate of 170 beats per minute.
Assumptions
1. The mental capacities of the subjects were within the nor
mal range for university students.2. All subjects understood the directions.3. The mental task employed was representative of the type of
mental task utilized in actual athletic performances,4. The physical task employed was representative of the levels
of exertion commonly experienced in athletic situations.
5. All subjects were equally motivated.

19Limitations
1, The subjects may not have had equal knowledge of the learned
material,2. There may have been difference in learning of the target
items.
Significance of the StudyThe study of response selection has been used in the past largely
to substantiate, refute, or add to theories- concerning human information processing. The theories have been studied using single input, more than one input of the same modality, and more than one input of differing modalities. One of the methods used in certain cross modality studies in the manipulation of the strength or intensity of one or more of the inputs. A rise in the strength or intensity of one or more of the inputs has been shown in certain instances to have a detrimental effect on tasks concerning alternate inputs.
The detrimental performance on alternate tasks may be explained
quite well by the allocation theory (Kahneman, 1973) in that the limits
of an individual's processing capacity have been exceeded. An indivi
dual may optimally perform two concomitant tasks so long as his pro
cessing capacity is not exceeded; but once this capacity is overloaded possibly by an increase in intensity of one of the two tasks, performance decreased on both tasks (Kahneman, 1973). This processing capacity may be exceeded not only by an increase in intensity of mental inputs or tasks but also by an increase in intensity of physical inputs or tasks.

20The implications are widespread. There are numerous times when
individuals need to function mentally at a high level while under some
form of physical stress, particularly in the form of various levels of fatigue. In this case, the physical demands of the situation are in competition with the mental demands of the situation for allocation of
attention.Specifically, in the case of athletics, mental demands are in
constant competition with the physical demands of the activity (Kahne
man, 1973). For the most part, the mental tasks remain constant while the physical demands increase. In many athletic situations, the performer must first recognize a situation (mental) and then react to it (physical) (Martiniuk, 1974). The fact that a performer is slow to react may be due to several factors, one of which is physical fatigue. However, the increase in reaction time may also be a sign of decreased mental performance. The performer may be physically able to react appropriately to a situation if he were able to recognize it in time. Visual recognition of stimuli plays a vital role in all athletic events and it is necessary to learn what effects, if any, physical fatigue has
on the visual recognition of items previously learned.Lastly, the literature surveyed made no reference to recognition
and physical fatigue of the type employed in this study. In previous studies other mental tasks were employed in conjunction with physical
fatigue or exertion (Burgess & Hokanson, 1964; Davey, 1973; Dornic,Borg, & Ohllson, 1973; ^tockfeldt, 1970). It may be that previously employed mental tasks are not the equivalent of item recognition or require the same type of mental processing, and thus are not affected

21by physical exercise in the same manner. This study will add to the literature concerning the relationship of physical performance to mental performance.

CHAPTER II
METHODS
Selection of Subjects Subjects for this study were 36 students (15 male and 21 female)
enrolled in basic activity classes in the Department of Health, Physi
cal, and Recreation Education Education at Louisiana State University,
Baton Rouge, Louisiana, during the spring of 1979. Mean physical char-
acteristics of the male subjects were: age, 22.00 (-2.47) yrs; height, 179.48 (-5.78) cm; and weight 74.65 (-6.58) kg. For females the mean
values were: age, 22.05 (-3.77) yrs; height, 165.29 (-5.06) cm; and +weight, 56.81 (-5.68) kg. As far as could be determined, all subjects
had 20/20 vision and had no physical or mental impairment which would
have affected performance.
Apparatus
The materials used in this study consisted of the following:
Slide ProjectorA Lafayette Instruments Company 41610 slide projector, equipped
with a special tachistoscopic lens, was utilized. Kodak Ektachrome
slides were made of all dot patterns used. These were shown via the
slide projector.Reaction Timer
A Lafayette Instruments Company KT 800 Reaction Timer model
22

2363051 was used. This reaction timer adapts to the model 4160 slide pro
jector and provides a measurement of the correctness of response given and a digital reading of the response time measured to .01 seconds. The reaction timer starts simultaneously with the presentation of each slide.
Telegraph Key SetA Lafayette Instruments Company telegraph key set was used. The
left key was marked with a "no" and the right key with a "yes." The
telegraph key set was attached to the cycle ergometer and connected to
the reaction timer. Depressing either of the two keys following the presentation of a slide stopped the reaction timer.
Cycle ErgometerA Monark cycle ergometer was used to administer the P W C ^ q test
to each subject, and to induce the different fatigue levels.Metronome
An electric metronome was used to establish and maintain a pedaling rate on the cycle ergometer.Snellen Eye Chart
A Snellen Eye Chart was used to test the vision of each subject.
Projection ScreenA projection screen was used positioned in front of the bicycle
ergometer for the presentation of dot patterns.Stopwatch
A stopwatch accurate to .01 seconds was used to time the subjects each minute while on the cycle ergometer.Digital Counter
A digital counter was used to measure the rate (pedal revolutions

24per minute) at which the sub j ects pedaled the cycle ergometer.
Procedures
fitness Evaluation and Establishment of WorkloadPrior to the actual testing, the subjects (n = 36) were admin
istered a PWC1?0 test. The administration of this test was in accordance with previously established methods (deVries, 1971) (see Appendix B). Physical Working Capacity of PWC is defined as the maximum level of work of which an individual is capable, and the P W C ^ q test is a
valid method of predicting this level from submaximal heart rate mea
sures (deVries, 1974). It has been known that heart rate increases
linearly with increasing workloads. The PWC17q test estimates the maximum level of work of an individual by having the individual work at
two separate submaximal workloads and obtaining a heart rate measure at each workload. These two points are recorded on a graph (deVries, 1974) and a straight line drawn between the two. This line is extrapolated to a point on the graph corresponding to a heart rate of 170. From this point a workload which would elicit this heart rate of 170 is obtained.
It has been previously established that an individual's cardiovascular fitness level affects mental performance when working during periods of exertion (Gutin & DeGennaro, 1968; Stockfeldt, 1970). To control this factor, the present study employed three percentages of the workload that would elicit a heart rate of 170. The percentages
0, 80, and 100 were used.

25
Establishment of GroupsThe subjects (n = 36) were randomly divided into two equal groups.
The two groups performed similarly with one exception. The two item group (n « 18) had two items (dot patterns) in memory and the six item group (n = 18) had six items (dot patterns) in memory. The two item group had one item in memory with a high goodness rating and one item in memory with a low goodness rating while the six item group had three of each. The goodness of the items was in. accordance with Garner and Clement, 1963 (see Appendix A).
On the morning of the testing both groups were presented the items
they were required to learn and asked to study them. The two item group
was allowed three minutes of study (1.5 minutes per item) and the six
item group was allowed nine minutes for study. The subjects were pro
vided a pencil and a sheet of paper for self testing.At the end of the first study session, the study items were col
lected and the subjects given a blank sheet of paper. The subjects in the two item group were given 20 seconds to correctly recall and reconstruct the previously learned items; and the subjects in the six item group were given 60 seconds. This test was considered a measure of learning. All subjects who correctly completed the recall task in the allotted time were allowed to leave. Subjects making errors were given an additional two minutes of study and again required to complete the recall task. All but six subjects completed the learning task in the initial learning period. The time for study and learning was held con
stant to account for effects of overlearning (Singer, 1975).
Later on the same day the subjects reported to the testing area.

26Prior to the testing, the subjects read and signed an informed consent
form. Information pertaining to height, weight, age, and vision were
recorded at this time. The subjects were again tested on recall.
Experimental TreatmentsThree treatments with regard to level of fatigue were used with
the two item group and the six item group. Low fatigue consisted of having the subjects pedal for six minutes with no resistance; intermediate fatigue consisted of the subjects pedaling for six minutes at a workload of 80 percent of that which would elicit a heart rate of 170; and high fatigue consisted of having subjects pedal for six minutes at the workload that would elicit a heart rate of 170 (100%). A fourth treatment, consisting of nine randomly selected subjects randomly selected from the original 36, was conducted in order to determine if
having to complete a mental task while concurrently pedaling a cycle
ergometer at a prescribed rate had a detrimental effect on the pedal
rate. These nine subjects pedaled for eight minutes at a workload equal to that of the high fatigue level group but without having to respond to visual stimuli.
All 18 subjects in either group were exposed to all fatigue levels with the order of presentation counterbalanced using all possible combinations to avoid a learning or order effect. The items used in the two item presentation consisted of one target item of high goodness, presented 12 times; one target item of low goodness, presented 12 times; two lures which are of low similarity to both targets, presented three times each; three lures highly similar to the good item, shown three

27times each; and three lures which are of low similarity to the poor item, shown three times each. This resulted in a total of 48 slides.
The slides used for presentation to the six item group consisted
of three targets of high goodness and three targets of low goodness, each shown four times; two lures of low similarity to all of the target
items, each shown three times; and one lure of high similarity to each
one of the targets, each shown three times. This methodology also
involved a total of 48 items. All items for both groups were randomly
arranged in the slide tray for presentation. Since the same items were used in all three exertion level treatments, the order of the slides
was randomly arranged twice more.The subjects were individually tested on the visual recognition
task. First, the seat on the ergometer was adjusted to fit each subject’s limb length. The telegraph key was attached to the handle bars of the cycle ergometer. Each subject was instructed to take note of the' keys marked "yes" and "no." The subject was instructed to place his or her dominant hand equidistant between the two keys and told that upon commencement of testing, slides would appear on the screen and that
one of the two telegraph keys was to be depressed as soon as the subject recognized the slide. A verbal warning preceded each slide by approxi
mately one second and the slides were presented as rapidly as possible.
All were given the same verbal instructions:Respond as quickly as possible by depressing the "yes" key or the "no" key as soon as you are sure you do or do not recognize the slide.
For the low fatigue group the slide presentation commenced upon

28completion of the verbal instructions. For the intermediate and high fatigue group slide presentation started during the last 2.5 minutes of the ergometer exercise. Response time and correctness of response for each slide was recorded. A micro-switch connected to the impulse center placed under one of the pedals of the cycle ergometer enabled the recording cumulative pedal RPM at the completion of every minute of ergometer work for the duration of each treatment.
Heart rates were recorded at the completion of Treatment Three.
These were obtained by palpatation of the carotid artery. The mean
heart rate for Treatment Three was 166.75 (-5.50) beats per minute.
This value reflected a satisfactory P W C ^ q measure.
Statistical Analysis of DataMeans and standard deviations were computed for all variables.
For statistical analysis, the correctness of response data were arranged in a series of 12, 3 x 3 Latin squares. The first six squares represented the two item group and the last six squares represented the twelve item group. Each square contained all three fatigue levels for three subjects. This design was utilized to reduce any effects of the order in which each subject was tested as well as the day on which each subject was tested. The columns within squares represented the day that the subjects were tested and the rows within squares represented the order of the fatigue levels. A 5 x 3 x 36 split plot analysis of variance was used on the dependent variables response time to assess the
effects that took place as a result of the fatigue. Significant effects
were later tested using orthogonal comparisons. A 2 x 8 factorial

analysis of variance was used to determine if any difference existed
between the high fatigue group who had a concurrent mental task and the
high fatigue group who had no concurrent task. Lastly, analysis of
regression using response time as the dependent variable was used to establish regression lines between the two item group and the six item group. The slope and intercept for each regression line were estimated
for treatments one through three.

CHAPTER III
RESULTS
Correctness of Response Data Table 1, Appendix C presents the data concerning the percentages
of correct responses. Since the percentage of correct responses was 88.9% as compared to 11.1% for incorrect responses, it was assumed that random guessing did not occur. As a result, both correct and in
correct responses were considered together.
Statistical Analysis
Two similar 3 x 5 x 36 split plot analyses of variance were used
to analyze the dependent variables of response time and correctness of response. The data were arranged in 12 separate 3 x 3 Latin Squares with squares 1-6 representing the two item group and squares 7-12 representing the six item group. Any significance differences in either analysis were tested using orthogonal comparisons.
Three separate but similar analyses of regression were used to obtain slope and intercept for each of the three fatigue levels between the two item group and the six item group. Independent J: tests
were used to test differences between intercepts.Analysis of variance was employed to determine if any difference
existed between the pedal rates of the high fatigue group with mental task (100% of PWC17Q concurrent with item identification) and the
high fatigue group without mental task (100% of P W C ^ q with no con-
30

31
current task).
Response TimeA summary of the analysis of variance and appropropriate orthog
onal comparisons for the dependent variable response time is presented in Table 1. Response times were shown to be significantly differ
ent when the 12 Latin Squares ( two item group compared to six item group with day and order effects collapsed ) were compared F_ (11,24) =
7.80, p£.05. Orthogonal comparison revealed that there was a significant difference between the two item group (squares 1-6) and the six item group (squares 7-12) F (1,24) = 11.81, p i.Ql with the slower mean response time evidenced in the six item group. This indicates that response time is affected by the number of items in memory. The
fatigue effect as well as the Group X Fatigue interaction were found to be non-significant (see Appendix C, Table 2 for means and standard
deviations of response times for each fatigue level). The changes in mean response time across fatigue levels is shown graphically in
Figure 4.A significant difference was found between the types of items
presented F (4,288) = 74.00, p i . 01 indicating that task complexity affects recognition time. Using orthogonal comparisons, significant differences were noted between item Types 1 and 2 F (1,470) = 49.53, p i . 01 with Type 1 having the faster response time and between Types 4 and 5 F (1,470) = 6.43, p^.01 with Type 4 having the faster response time. When the targets (Types 1 and 2) were compared to the
lures (Types 3,4,5) a significant difference was also shown F_ (1,470)=

TABLE 1 32
SUMMARY OF ANALYSIS OF VARIENCE AND ORTHOGONAL COMPARISONS
FOR DEPENDENT VARIABLE RESPONSE TIME
Source as MS 7
+Square (A) ii .20 2.80*Order 24 .004 .04
Day 24 .08 1.14
Fatigue Level (B) 2 .15 2.12
A X B 22 .07 .92
Error A 24 .07
Type (C) 4 .59 74.00**
A X C 44 .01 1.73**
B X C 8 .02 2.37
A X B X C 88 .005 . 65
Error B 288 .008
Orthogonal Comparisons *p .05**p .01
Comparison df MS F
2 item vs 6 item group 1 .85 11.81**Item Type 1 vs Item Type 2 1.02 49.53**Item Type 4 vs Item Type 5 1 .14 6.43*Types 1,2 vs Types 3,4,5 1 .141 6.73**
+ Squares are 12 Latin Squares. Squares 1-6 represent the 2 item group and squares 7-12 represent the 6 item group.

Means
Response Tim
e (sec)
33
.78 "
.77 ~
.76 ~
.75 "
.74 "
.73 "
.72 '
XControl 80% of PWC,_n 100% of PWC,170 1/0
Fatigue Levels
Figure 4. Changes in mean response time across fatigue levels.

34
6.73, p 5.01 with the targets demonstrating the faster response time
(see Table 1 for a summary of all orthogonal comparisons). Means and standard deviations for all item types are presented in Appendix C,
Table 3.A significant Group X Type interaction was found X (44,288) =
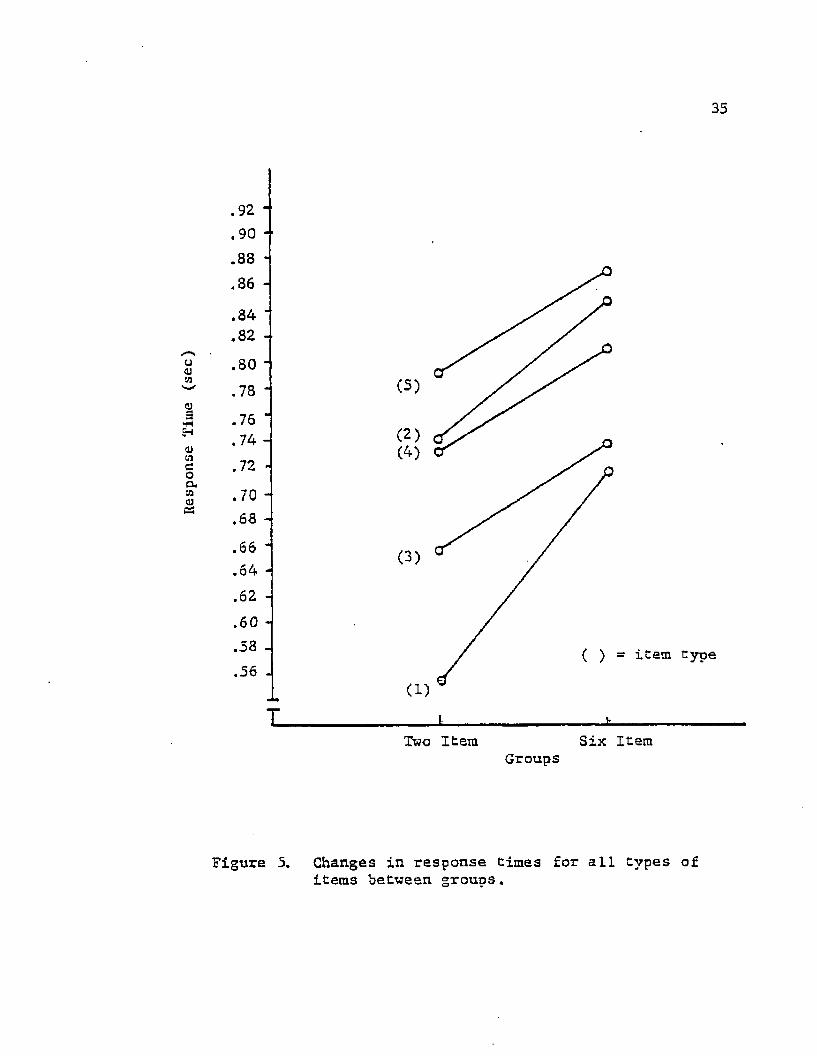
1.73, p 5.01. Figure 5 illustrates this interaction. It can be seen that although all response times increase from the two item group to
the six item group, they do not increase equally. The response time for item Type 1 (target item of high goodness) increases at a greater rate than the other items. A significant Fatigue X Type interaction
was also found IF (8,288) = 2.37, p 5..05. This interaction is shown graphically if Figure 6. Figure 6 shows that item response time for item Type 5 (lure of high similarity to target of low goodness) increases almost linearly across treatments while all other items improve at the intermediate level of fatigue before getting worse. Al-
“ so, item Type 2 (target item of low goodness) shows a greater increase
in response time between the intermediate and high levels of fatigue than does any other item. Means and standard deviations for each item
type by fatigue level are shown in Appendix C, Tables 4, 5, 6.
Analysis of Regression for Response TimeAnalysis of regression was employed for each of the three fa
tigue levels in order to obtain slope and intercept. Response time was used as the dependent variable and regression lines were constructed between the two item group and the six item group. A summary of these analyses appears in Appendix D, Tables 2, 3, 4. The low fatigue
Response Tim
e (sec)
35
.92 -
.90 -
.38 -
.86 -
84 ■ 82 -80 *
76 ‘ 74 -
70 - 68 -
(3)6462 -60 - 58 - 56 -
( ) = item type
CD
Two Item Six ItemGroups
Figure 5. Changes in response times for all types of items between groups.

e Ti
me
36
3101
01£30 a.01 <uCS
.96,94.92.90.88.86.84.82.80.78.76.74.72.70.68.66.64.62
T
(5)(4)(2)
(3)
(1)
( ) = item type
Control 80% of PWC17Q 100% of PWC170
Fatigue Levels
Figure 6. Mean response times for all types of slides across levels.

37
group demonstrated the lowest Intercept (.58 sec) with the high fatigue group next (.68 sec) and the intermediate fatigue group having the highest (.71 sec). The lower the intercept the faster the time for those activities in memoi^r which occur only once (Sternberg, 1969). The
slopes for the low, intermediate, and high fatigue groups were .035, .002, and .022, respectively. The regression lines for each of the three fatigue treatments appear in Figure 7. Independent _t tests were performed to determine if the interceptes were significantly dif
ferent. The intercepts for the low fatigue group and the intermediate fatigue group demonstrated the only significant difference _t (1,178) =
3.84, p5.05, indicating that the intercepts for all other groups were essentially the same. Mean differences in response time for the comparison stage in memory (Sternberg, 1969) for each treatment were obtained by subtracting the mean response time, value for the two item group from that of the six item group. The values for the low fatigue group, the intermediate fatigue group, and the high fatigue group were
.14 sec., .01 sec., and .09 sec., respectively.
Fatigue and Correctness of ResponsePercentages of correct responses were calculated for each of the
three fatigue levels. The percentage of correct responses for the low fatigue group (pedaling at no resistance), the intermediate fatigue
group (80% of P W C ^ q ) , and the high fatigue group (100% of P W C ^ q ) were 90%, 89%, and 88% respectively (see Appendix C, Table 7 for a sum
mary of correct and incorrect responses). These data indicate that for all fatigue levels the subjects followed the verbal direction given

38
84.82 - .80 J
.76
.74
70<u68
low fatigue intermediate
fatigue high fatigue
.66 -
.64 -
.62 -
.60 -
.58 -
.56 -
.54 -
a)H)Co
TTwo Item Six Item
Groups
Figure Regression lines for fatigue levels.

39and that fatigue of the levels employed in this study has a minimal effect on correctness of response.
Pedal RateA summary of the analysis of variance for the dependent variable
pedal rate is presented in Appendix D, Table 1. Pedal rates were shown
to be signifacantly different between the group pedaling the cycle at the 100% of level while responding to sitmuli and the group pedaling at the same rate but without having to respond to stimuli _F (1.344) = 27.3, p .05 in favor of the non-responding group. The mean pedal rate of the responding group was 56.89 rpm's and for the nonresponding group 58.72 rpm’s. A significant difference was also shown between the times the rates were measured F_ (7,344) = 5.03, p i.05.The pedal rates were measured at the completion of each minute of pedaling and showed a decrease in rate as each minute elapsed. The means for minutes 1-7 were 58.28, 58.25, 58.20, 57.80, 57.02, 56.40, and 55.68 rpms, respectively. There was no significant Treatment X Time interaction. A significant interaction of this type would be evidence that the pedaling did cause a diversion of attention from the recognition task. It was shown that the pedal rates for both treatments significantly decreased the longer the subjects pedaled but they decreased at the same rate. Since this interaction did not occur, it was assumed that any decrease in pedal rate could be attributed to fatigue.

CHAPTER IV
DISCUSSION
Effect of Fatigue on Recognition The results indicate that fatigue of the type and intensity
employed in this study does not significantly affect overall visual recognition time. An alternate explanation might be that the level of fatigue was not high enough. Allocation theory (Kahneman, 1973) states that man has only so much attention capacity available to meet demands. The available attention is allocated as required by certain situations. When an individual is performing a task, performance will not decrease as long as the available attention is not exceeded. An individual performing two concurrent tasks will be able to work at optimum level so long as the attentional demands of one or the other of the tasks do not increase significantly. A significant increase is attentional demands of one task can only happen with a reduction of attention to the other task; thus, leading to a decrement in performance on the task with the decrease in attention. It is conceivable that the mental task and the physical task employed in the present study did not sufficiently overload the system and cause a drop in performance. The design of this study was such so as to closely approximate the type of fatigue experienced by individuals participating in a number of athletic endeavors. It can be stated that exercising at such a level
40

is not sufficient to affect overall response time in recognition mem
ory. Although no overall effects in recognition time performance were noted, differences were revealed when response time was broken down into component parts. Sternberg (1969) stated that when response times are regressed across memory set size that the resultant slope of this
regression represents the increase in response time as the memory set size increases, and that the resultant intercept- represents the
total time for all activities which occur just once in the memory process. Activities which occur just once in the memory process are the encoding of the stimulus and the organization and execution of the motor response. Sternberg (1969) stated that the slope of the regression line represents only the comparison process of memory and that the slope increases as each new item is added to the memory set. Individual regression analyses for each fatigue level suggest that arousal may exist in the comparison stage of memory. The slope for the inter
mediate fatigue group was considerably less than for either the low fatigue group or the high fatigue group. When the differences for time of comparison were obtained for each fatigue level an inverted U (Hebb,
1949) was demonstrated. These data indicate that is an aroused state, such as that induced by the subject's pedaling at 80% of their PWC -j.70*
less time is spent in the comparison stage of memory. Thus, time of comparison may be enhanced by arousal in the form of physical work.
The same arousal phenomenon was not exhibited in the intercepts of the three fatigue treatments in the present study. As stated pre
viously these intercepts contain activities in the memory process

42
other than the comparison of items, i.e., encoding and organization and execution of a motor response. It is noted that the low fatigue group
had the lowest intercept, the high fatigue group had the next lowest,and the intermediate fatigue group had the highest.
The comparison of the intercepts to the slopes for each fatigue
treatment is both interesting and suggestive. Numerous researchers as early as Donders have supported the notion that the time between the onset of the stimulus and the response is occupied by various stages. Stages such as encoding, comparison, and the execution of response are
basic to this notion. Modem day information processing theories also follow this line of thought. Assuming that Sternberg’s (1969) argu
ment concerning the properties of the intercepts and slopes of the regression line is valid, it is possible to investigate the effects of arousal on the various stages of memory. If arousal affected all stages
in memory the same way then one may expect to find the slopes corresponding to the intercepts at each individual fatigue treatment, i.e., the fatigue treatment with the lowest intercept would have the least amount of slope. This was not the case as no relationship of this type was noted. The fact that no such relationship existed could be taken as evidence that arousal by physical work affects the different stages in information processing in different ways. Sternberg (1969) states that the slope of the regression line represents the comparison stage of memory while the intercept represents more than one stage of the memory process. Therefore, based on present results, it can be stated
only that arousal in the form of physical fatigue affects the comparison stage of memory differently than it affects the sum total of the other

43
processes. Since the sura total of the other processes, which is represented by the intercept of the regression line, cannot be separated, it cannot be speculated as to how arousal in the form of physical
fatigue influences the individual processes that make up the intercept.
It is quite possible that one or more of the components of the intercept, i.e., encoding, selection, or execution of motor responses may have exhibited the same effect (arousal) as did the slope. It is con
ceivable that one or more of the components of the intercept may have exhibited an arousal effect.
Previous research (Burgess & Hokanson, 1964; Stennett, 1957) suggests that a performance curve in the form of an inverted U (Hebb,1949) should have occured. The fact that this phenomenon was not evidenced here may be due to a masking effect. Although the arousal curve was
evidenced in the comparison stage of memory (slope), this same effect was not evidenced in those stages which only occur once (intercept).It appears as though an intermediate level hinders certain stages in the recognition process. It is conceivable that the effects of fatigue on the intercept may have overshadowed the effects of fatigue on the
slope thus negating the arousal effect.
Effect of Item Type on Response TimeA significant difference in response time between types of items
presented was to be expected. The differences existed between the two targets, the two lures, and the targets and the lures. The differences were due to the varying complexity of the mental task at hand; i.e., Type 1 (target of high goodness) was more quickly recognized than Type

442 (target of low goodness). This is in support of previous findings (Checkosky & Whitlock, 1973; Gamer, 1974; Gamer 4 Clement, 1963).
A graph of the Fatigue x Type interaction (see Figure 6, p. 36)
illustrates the effects of fatigue on the different stimulus items.This interaction offers support to the premise that certain mental processes may be affected by various complexities of mental tasks during
an aroused state.The significant interaction between the types of items and the
number of items in memory is in support of previous research (Checkosky & Whitlock, 1973). This interaction may be viewed as evidence
that the goodness of the item presented may influence the stage involved in the processing of memory set items. It is suggested that
pattern goodness affects the time needed to process information.
Effect of Set Size on Response TimeAs expected, a significant difference was found between the two
item group and the six itme group in mean response time with the six item group having the longer response time. Sternberg (1969) concluded
that additional time was needed for the comparison process as additional items were added to the memory set. The present study utilized memory set sizes of two and six. Checkosky and Whitlock (1973), using two different set sizes, noted the same phenomenon.
Summary
The results indicate that fatigue of the type and intensity employed does not significantly affect overall recognition time. Allocation theory (Kahenman, 1973) postulates that performance will decrease

45
when the total amount of attention available is exceeded. This phe
nomenon did not occur. Possibly the physical task employed was not sufficient to produce enough diversion of attention away from the recognition task. The physical task employed was designed to resemble the type of fatigue experienced by individuals participating in athletic
endeavors. It may be that fatigue of the type experienced by partic
ipants in athletic endeavors is not sufficient to significantly hinder recognition time performance.
The recognition of various dot patterns may be considered re
presentative of mental tasks that are confronted in other situations. Some of these mental tasks are simple and some are quite complex. Therefore, the effects of fatigue on the recognition of dot patterns may be indicitive of fatigue effects on other mental tasks which con
front an individual in everyday occurances.It was suggested that physical fatigue may affect the comparison
stage of memory in such a way as to exhibit an arousal effect in the form of an inverted U. Those stages in memory which just occur once did not exhibit the same phenomenon. Thus, it is conceivable that a masking effect occured and an overall arousal effect which may have been noted was negated.
The present study supported the following hypotheses.1. There was no significant decrease in correctness of response
as a result of fatigue.2. There was a significant difference in target response time
with the target pattern classified as "good" showing the better response

46
time.3. There was a significant difference in response time of the
target pattern lures with the lure which is highly dissimilar having
the faster response time.4. There was a significant difference in the overall response
time with regard to number of items in memory with the two item group showing the faster response time than the six item group.

REFERENCES
Alderman, R. Influence of local fatigue on speed and accuracy in
motor learning. Research Quarterly, 1965, _3j5, 131-140.
Allport, D., Antonis, B., & Reynolds, P. On the division of atten
tion: a disproof of the single channel hypothesis. Quarterly
Journal of Experimental Psychology, 1972, 24, 225-235.
Andraessi, J. Effects of induced muscle tension and auditory stimu
lation on tachistoscopic perception. Perceptual and Motor
Skills. 1965, 20, 829-841.
Burgess, M., & Hokanson, J. Effects of increased heart rate on
intellectual performance. Journal of Abnormal and Social
Psychology, 1964, 6ji, 85-91.
Carron, A. Motor performance and learning under physical fatigue.
Medicine and Science in Sports, 1972, _4, 101-106.
Checkosky, S., & Whitlock, D. Effects of pattern goodness on re
cognition time in a memory search task. Journal of Exper
imental Psychology, 1973, 100, 341-348.
Crowder, R. Principles of learning and memory. . New York: Lawrence
Erlbaum Associates, 1976.Daftuar, C., & Sinaa, J. Sleep deprivation and mental performance.
Psychologica, 1972, 15, 122-126.
Davey, C. Physical exertion and mental performance. Ergonomics,
1973, 16, 595-599.

48Davis, R. The human operator as a single channel information system.
Quarterly Journal of Experimental Psychology, 1957, 9., 119-129.
Deutsch, J., & Deutsch, D. Attention: some theoretical considerations.
Psychological Review, 1963, 70, 80-90.
Domic, S., Borg, G., & Ohlsson, M. Physical effort and short term
memory. Reports from the Institute of Applied Psychology - The University of Stockholm, No. 40, 1973.
Domic, S., & Stelmach, G. Arousal and recall in a simple motor task.
Reports from the Institute of Applied Psychology - The University
of Stockholm, No. 40, 1973.
Ellis, H. Fundamentals of human learning, memory, and cognition.Dubuque: W. C. Brown, 1978.
Flynn, R. Numerical performance as a function of prior exercise and
aerobic capacity for elementary school boys. Research Quarterly, 1972, 43, 16-22.
Gamer, W. Good patterns have few alternatives. American Scientist, 1970, 58, 34-42.
Gamer, W. The processing of information and structure. New York:John Wiley & Sons, 1974
Gamer, W. , & Clement, D. Goodness of pattern and pattern uncertainty.Journal of Verbal Learning and Verbal Behavior, 1963, _2, 446-452.
Girodo, M., & Pellegrini, W. Exercised produced arousal, film induced
arousal and attribution of internal state. Perceptual and Motor Skills. 1976, 42, 931-935.
Godwin, M., & Schmidt, R. Muscular fatigue and learning a discreet
motor skill. Research Quarterly, 1971, 42_, 374-381.

49Goldwater, B., fit Zirul, G. Tachistoscopic detection as a function of
varying degrees of physical exercise. Perceptual and Motor
Skills, 1973, 37, 399-402.
Gutin, B. Exercise induced activation and human performance. Research
Quarterly, 1973, 44, 256-268.
Gutin, B., & DiGennaro, J. Effect of one minute and five minute step
ups on performance of simple addition. Research Quarterly,
1968, 39, 81-85.
Hamilton, P., Hockey, G., fit Quinn, J. Information selection, arousal
and memory. British Journal of Psychology, 1972, _63, 1383-1389.
Hebb, D. The organization of behavior. Hew York: John Wiley fit Sons,
1949.Hockey, G., fit Hamilton, P. Arousal and information selection in short
term memory. Nature, 1970, 226, 866-867.
Imai, S., fit Gamer, W. Structure in perceptual classification.
Psychonomic Monograph Supplements, 1968, _2, 153-172.
Kahneman, D. Attention and effort. Englewood Cliffs: Prentice-Hall,
1973.
Krestonikov, A. (ed.). Studies in physiology of physical exercise.
Moscow: State Publishing House, 1951.Levitt, S., & Gutin, B. Multiple choice reaction time and movement
during physical exertion. Research Quarterly, 1971, 42, 405-410.
Loveland, N., & Williams, H. Adding, sleep loss, and body temperature.
Perceptual and Motor Skills, 1963, 16, 923-927.
Martiniuk, R. Information processing in motor skills. New York:
Holt, Rinehart, & Winston, 1976.

50Meyers, C., Zimmerli, W., Farr, S., & Bashnagle, N. Effect of
strenous physical activity upon reaction time* Research
Quarterly, 1969, 49, 332-337.
Moray, N. Where is capacity limited? A survey and a model. Acta
Psychologies, 1967, 27^ 84-92.
Sage, G. Introduction to motor behavior: a neuropsychological approach
Reading, Mass.: Addison Wesley, 1977.
Schmidt, R. Performance and learning a gross motor skill under con
ditions of artificially induced fatigue. Research Quarterly,
1969, 40, 185-190.Shore, M. Perceptual effeciency as related to induced muscular effort
and manifest anxiety. Journal of Experimental Psychology, 1958,
55, 179-183.Singer, R. Motor learning and human performance. New York: Macmillan
1975.Snodgrass, J., Luce, R., & Galanter, E. Some experiments in simple
and choice reaction time. Journal of Experimental Psychology,
1967, 75, 1-17.Stelmach, G. Effeciency in motor learning as a function of inter-
trial rest. Research Quarterly, 1969, 4̂ 0, 198-202.
Stennett, R. The relationship of performance level to level of
arousal. Journal of Experimental Psychology, 1957, _1, 54-61.
Sternberg, S. Memory scanning: mental processes revealed by reaction
time experiments. American Scientist, 1969, 57, 421-457.

51Stockfeldt, T. Mental performance during varied physiological
exertion. In G. Kenyon (Ed.). Contemporary psychology of
sport. Chicago: The Athletic Institute, 1970.
Thomas, J., Cotten, D., Spieth, W., & Abraham, N. Effects of
fatigue on stabilometer performance and learning of males and
females. Medicine and Science in Sports, 1975, 7_* 203-206.
Tussing, L. The effect of football and basketball on vision.
Research Quarterly, 19AO, _11, 16-18.
Vlahov, E. Effect of the harvard step test on visual acuity.
Perceptual and Motor Skills. 1977, 45, 369-370.
Welford, A. Evidence of a single channel decision making mechanism
limiting performance in a serial reaction task. The Quarterly
Journal of Experimental Psychology, 1959, 11, 193-209.
Welford, A. Stress and performance. Ergonomics, 1975, _16, 567-580.
Wilkinson, R. Effects of up to 60 hours sleep deprivation on
different types of work. Ergonomics, 1964, _7, 175-186.
Williams, H., Geisking, C., & Lubin, A. Some effects of sleep
loss on memory. Perceptual and Motor Skills, 1966, 23,
1287-1293.
Williams, H., & Lubin, A. Speeded addition and sleep loss. Journal
of Experimental Psychology, 1967, 73, 313-317.

APPENDIX A
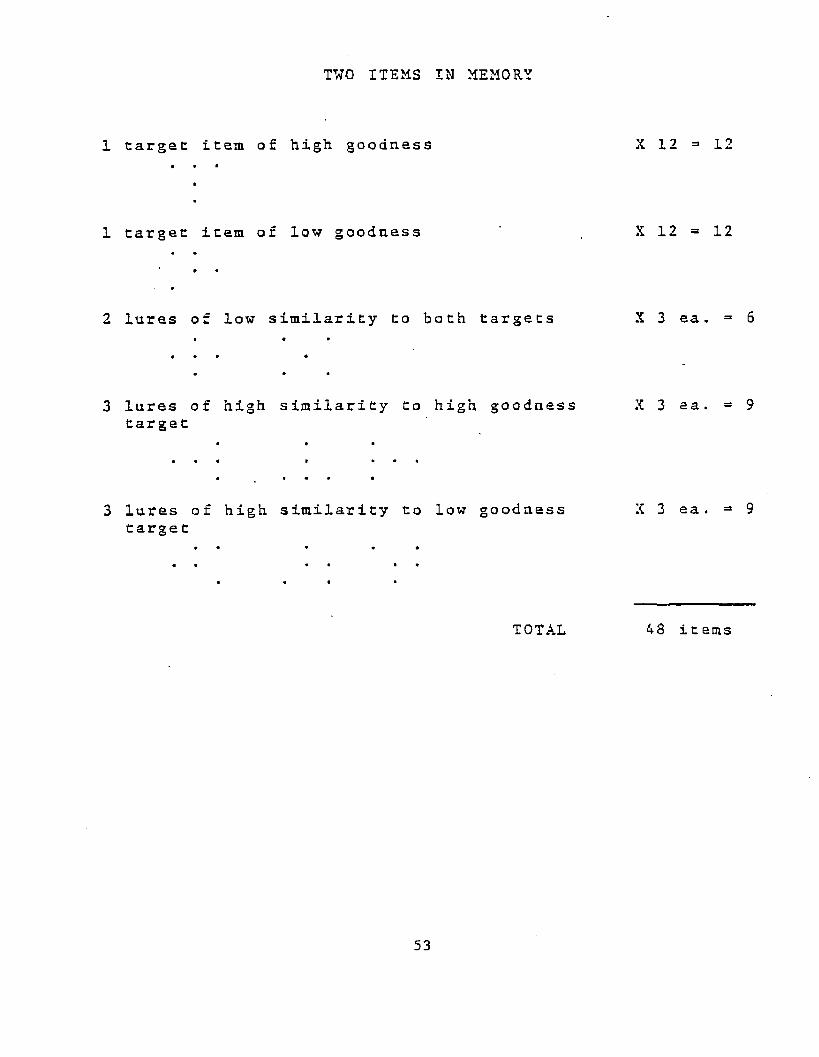
TWO ITEMS IN MEMORY
1 target item of high goodness X 12 a 12
1 target item of low goodness X 12 = 12
2 lures of low similarity to bath targets X 3 ea. = 6
3 lures of high similarity to high goodness X 3 ea. = 9target
3 lures of high similarity to low goodness X 3 e a . =• 9target
TOTAL 48 items
53
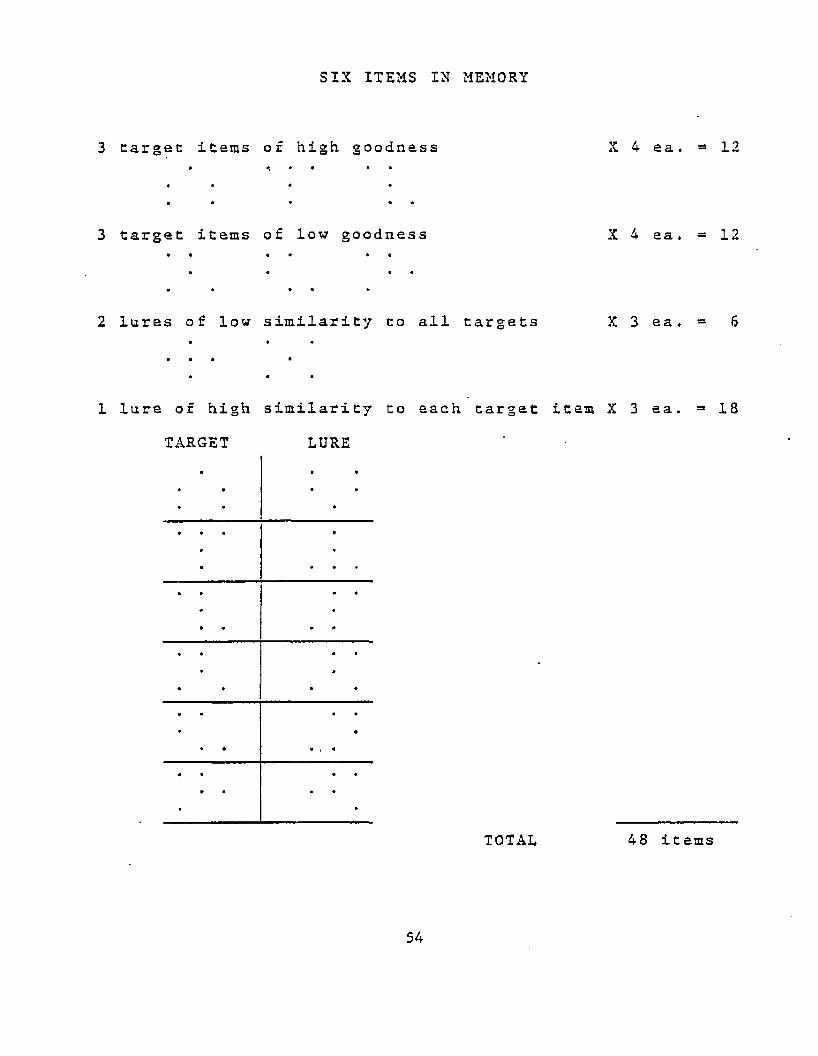
SIX ITEMS IX MEMORY
3 Garget items of high goodness X 4 ea. = 12* *, * # » •
• * * *
• • * 4 4
3 target items of low goodness X 4 ea. =* 12• • * • * m
m • • *
• * I « 4
2 lures of low similarity to all targets X 3 ea. = 6• • 4
• ■ * •
4 • *
1 lure of high similarity to each target item X 3 ea. = 18
TARGET LURE• «
TOTAL 48 items
54

APPENDIX B

The PWC^7Q Test of Physical Working Capacity
Procedure
1. Have the subjects pedal a cycle ergometer at rate of 60
rpm's for six minutes at a workload estimated to produce a heart
rate of 120-140. Record the heart rate during the sixth minute as
the first data point on the graph below.
2. At the end of the first six minute work bout, and without
stopping increase the load to one estimated to elicit a heart rate
of 150-170. Record the heart rate during the sixth minute as the
second data point on the graph below.
3. Plot the straight line through the points plotted in
items 1 and 2 above.
4. Drop a perpendicular from the intersection of the plotted
line with the 170 heart rate line; this will represent the workload
estimated to produce a heart rata of 170 or the PWC-170.
56

Heart
Kate
180
160
140
120
100
80300 600 900 1200 1500 1300 2100
Workload in KgM/min
57

APPENDIX G

TABLE Cl
TABLE OF OVERALL CORRECTNESS OF RESPONSE
Correctness* Frequency Percent Cumulative %
1 4161 88.9 88.9
2 518 11.1 100.0
*1 = correct
2 = incorrect
59

TABLE C2MEANS AND STANDARD DEVIATIONS ACROSS ALL FATIGUE LEVELS
Fatigue Level Response TimeN Mean S.D.
Low 1536 .72 .23
Intermediate 1532 .72 .25
High 1518 .78 .30
60
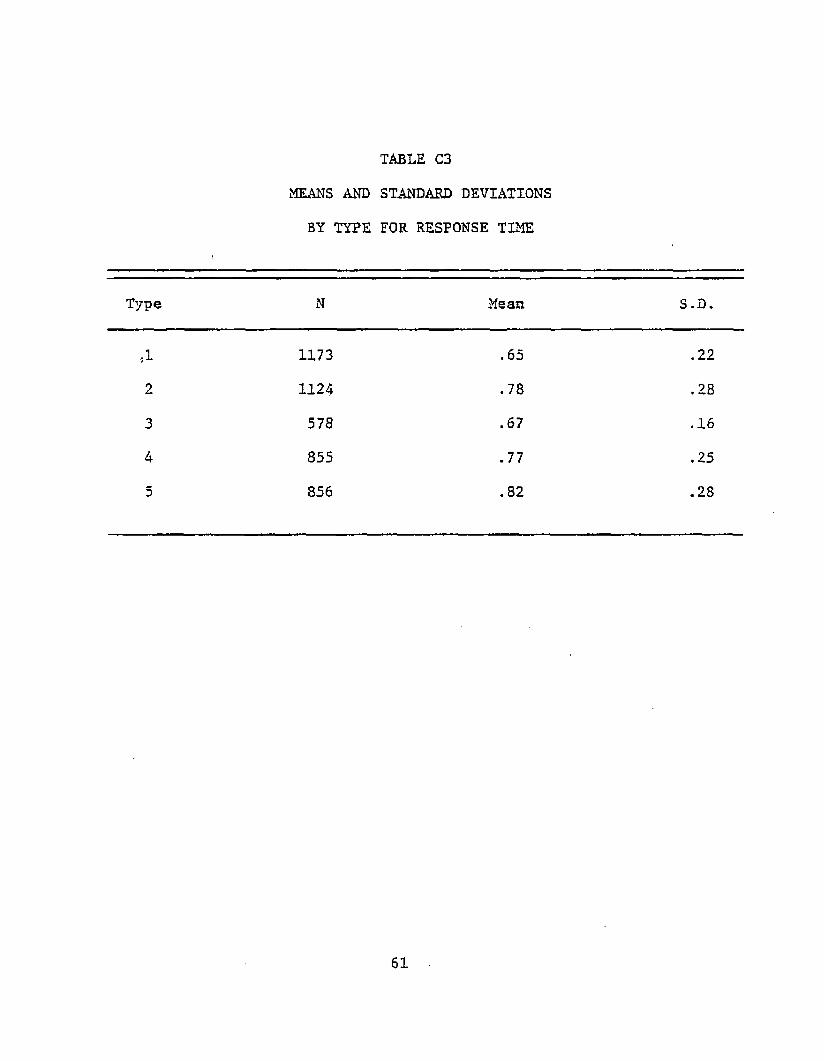
TABLE C3
MEANS AND STANDARD DEVIATIONS
BY TYPE FOR RESPONSE TIME
Type N Mean S.D.
:1 1173 . 65 .22
2 1124 .78 .28
3 57S .67 .16
4 855 .77 .25
5 856 .82 .28
61

TABLE C4
MEANS AND STANDARD DEVIATIONS BY ITEM TYPE
FOR LOW FATIGUE GROUP
Type NResponse Time (sec)
Mean S.D.
1 402 .65 .22
2 368 .76 .25
3 192 .68 .164 287 .77 .23
5 287 .78 .22
62

TABLE C5
MEANS AND STANDARD DEVIATIONS BY ITEM TYPE
FOR INTERMEDIATE FATIGUE GROUP
Type NResponse Time (sec)
Mean S.D.
1 388 .63 .20
2 373 .75 .26
3 191 .65 .15
4 293 .75 .22
5 287 .82 .25
63

TABLE C6
MEANS AND STANDARD DEVIATIONS BY ITEM TYPE
FOR HIGH FATIGUE'GROUP
Type NResponse Time (sec)
Mean S.D.
1 383 .68 .242 383 .84 .32
3 195 .69 .16
4 275 .79 .295 282 .87 .32
64

TABLE C7
PERCENTAGES OF CORRECT RESPONSES
3Y FATIGUE LEVEL
Fatigue Level Frequency Correct Incorrect
Percent Correct Incorrect
Low 1376 160 90 10Intermediate 1362 170 89 11High 1338 176 88 12
65

APPENDIX D

TABLE D1
SUMMARY OF ANALYSIS OF VARIANCE FOR THE
DEPENDENT VARIABLE PEDAL RATE
Source df MS F
Treatment (A) 1 192.86 27.32**
Time (B) 7 35.49 5.03**
A x B 7 1.88 .27Error 344 7.06
** P < .01
67'

TABLE D2
SUMMARY OF ANALYSIS OF REGRESSION FOR
LOW FATIGUE GROUP
Source df MS F
Group 1 .89 52 .3*
Error 178 .02
Total 179
* P _< .05
Parameter Estimate T
Intercept .584 26.88**
Group .035 7.24**
** P _< .01 STANDARD ERROR = .022
68

TABLE D3
SUMMARY OF ANALYSIS OF REGRESSION FOR
INTERMEDIATE FATIGUE GROUP
Source df MS F
Group 1 .208 8.67*Error 178 .024
Total 179
* p .05
Parameter Estimate T
Intercept .712 27.63*Group .002 11.26*
* p _< .05
STANDARD ERROR =» .026
69

TABLE D 4
SUMMARY OF ANALYSIS OF REGRESSION FOR
HIGH FATIGUE GROUP
Source df MS F
Group 1 .354 9.45*
Error 178 .037
Total 179
* P X -05
Parameter Estimate.-*. T
Intercept .684 21.19
Group .022 3.07
* Pjl *05STANDARD ERROR = .032
70

VITA
Robert Lewis Johnson was born on January 23, 1951 in Charlotte,
North Carolina. He graduated from East Mecklenburg High School in
Charlotte in 1969. He attended East Carolina University, Greenville,
North Carolina, from 1969 to 1970 and then transferred to Lenoir Rhyne
College, Hickory, North Carolina, where he graduated with a Bachelor
of Arts Degree in Health and Physical Education in 1973. At both
institutions, Dr. Johnson was a scholarship athlete participating in
football.
Following graduation from Lenoir Rhyne College, Dr. Johnson
accepted a graduate assistantship at the University of South Carolina,
Columbia, South Carolina, and began working toward a Master of Arts in
Teaching Degree. With the completion of this degree in 1974,
Dr. Johnson accepted a position at Lower Richland High School,
Hopkins, South Carolina. During his two year tenure at Lower Richland, Dr. Johnson was physical education instructor, assistant football
coach, and also baseball coach for the school.
Dr. Johnson enrolled in the Doctor of Philosophy Degree program
offered by the Health, Physical, and Recreation Education Department at Louisiana State University. The Doctor of Philosophy Degree was
awarded in the major area of Physical Education the Fall semester of
1979.
Dr. Johnson is married to the former Vicki Elizabeth Hyatt.
71

Candidate:
Major Field:
Title of Thesis:
EXAMINATION AND THESIS REPORT
Robert Lewis Johnson
Health, Physical and Recreation Education
Effects of Various Levels of Fatigue on the Speed and Accuracy of Visual Recognition
A p p ro v ed :
JC/L&rM a j o r P r o f e s s o r a n d C h a i r m a n
'y'l6 ^Y
D e a n o f t h e G r a d u a t e E ch o
EXAMINING COMMITTEE:
H’rul_ Ujit
Date of Examination:
July 18, 1979