Effects of Subsistence Hunting on Vertebrate Community...
14
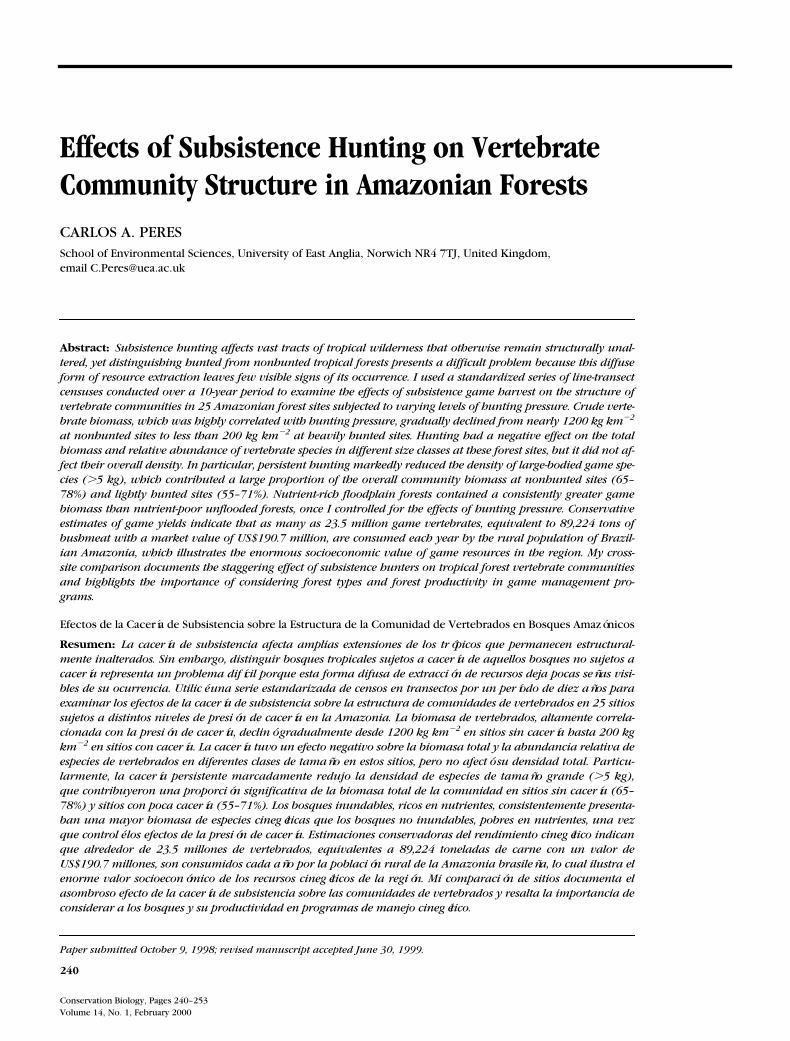
240 Conservation Biology, Pages 240–253 Volume 14, No. 1, February 2000 Effects of Subsistence Hunting on Vertebrate Community Structure in Amazonian Forests CARLOS A. PERES School of Environmental Sciences, University of East Anglia, Norwich NR4 7TJ, United Kingdom, email [email protected] Abstract: Subsistence hunting affects vast tracts of tropical wilderness that otherwise remain structurally unal- tered, yet distinguishing hunted from nonhunted tropical forests presents a difficult problem because this diffuse form of resource extraction leaves few visible signs of its occurrence. I used a standardized series of line-transect censuses conducted over a 10-year period to examine the effects of subsistence game harvest on the structure of vertebrate communities in 25 Amazonian forest sites subjected to varying levels of hunting pressure. Crude verte- brate biomass, which was highly correlated with hunting pressure, gradually declined from nearly 1200 kg km 22 at nonhunted sites to less than 200 kg km 22 at heavily hunted sites. Hunting had a negative effect on the total biomass and relative abundance of vertebrate species in different size classes at these forest sites, but it did not af- fect their overall density. In particular, persistent hunting markedly reduced the density of large-bodied game spe- cies (.5 kg), which contributed a large proportion of the overall community biomass at nonhunted sites (65– 78%) and lightly hunted sites (55–71%). Nutrient-rich floodplain forests contained a consistently greater game biomass than nutrient-poor unflooded forests, once I controlled for the effects of hunting pressure. Conservative estimates of game yields indicate that as many as 23.5 million game vertebrates, equivalent to 89,224 tons of bushmeat with a market value of US$190.7 million, are consumed each year by the rural population of Brazil- ian Amazonia, which illustrates the enormous socioeconomic value of game resources in the region. My cross- site comparison documents the staggering effect of subsistence hunters on tropical forest vertebrate communities and highlights the importance of considering forest types and forest productivity in game management pro- grams. Efectos de la Cacería de Subsistencia sobre la Estructura de la Comunidad de Vertebrados en Bosques Amazónicos Resumen: La cacería de subsistencia afecta amplias extensiones de los trópicos que permanecen estructural- mente inalterados. Sin embargo, distinguir bosques tropicales sujetos a cacería de aquellos bosques no sujetos a cacería representa un problema difícil porque esta forma difusa de extracción de recursos deja pocas señas visi- bles de su ocurrencia. Utilicé una serie estandarizada de censos en transectos por un período de diez años para examinar los efectos de la cacería de subsistencia sobre la estructura de comunidades de vertebrados en 25 sitios sujetos a distintos niveles de presión de cacería en la Amazonia. La biomasa de vertebrados, altamente correla- cionada con la presión de cacería, declinó gradualmente desde 1200 kg km 22 en sitios sin cacería hasta 200 kg km 22 en sitios con cacería. La cacería tuvo un efecto negativo sobre la biomasa total y la abundancia relativa de especies de vertebrados en diferentes clases de tamaño en estos sitios, pero no afectó su densidad total. Particu- larmente, la cacería persistente marcadamente redujo la densidad de especies de tamaño grande (.5 kg), que contribuyeron una proporción significativa de la biomasa total de la comunidad en sitios sin cacería (65– 78%) y sitios con poca cacería (55–71%). Los bosques inundables, ricos en nutrientes, consistentemente presenta- ban una mayor biomasa de especies cinegéticas que los bosques no inundables, pobres en nutrientes, una vez que controlé los efectos de la presión de cacería. Estimaciones conservadoras del rendimiento cinegético indican que alrededor de 23.5 millones de vertebrados, equivalentes a 89,224 toneladas de carne con un valor de US$190.7 millones, son consumidos cada año por la población rural de la Amazonia brasileña, lo cual ilustra el enorme valor socioeconómico de los recursos cinegéticos de la región. Mi comparación de sitios documenta el asombroso efecto de la cacería de subsistencia sobre las comunidades de vertebrados y resalta la importancia de considerar a los bosques y su productividad en programas de manejo cinegético. Paper submitted October 9, 1998; revised manuscript accepted June 30, 1999.
Transcript of Effects of Subsistence Hunting on Vertebrate Community...
240
Conservation Biology, Pages 240–253Volume 14, No. 1, February 2000
Effects of Subsistence Hunting on Vertebrate Community Structure in Amazonian Forests
CARLOS A. PERES
School of Environmental Sciences, University of East Anglia, Norwich NR4 7TJ, United Kingdom,email [email protected]
Abstract:
Subsistence hunting affects vast tracts of tropical wilderness that otherwise remain structurally unal-tered, yet distinguishing hunted from nonhunted tropical forests presents a difficult problem because this diffuseform of resource extraction leaves few visible signs of its occurrence. I used a standardized series of line-transectcensuses conducted over a 10-year period to examine the effects of subsistence game harvest on the structure ofvertebrate communities in 25 Amazonian forest sites subjected to varying levels of hunting pressure. Crude verte-brate biomass, which was highly correlated with hunting pressure, gradually declined from nearly 1200 kg km
2
2
at nonhunted sites to less than 200 kg km
2
2
at heavily hunted sites. Hunting had a negative effect on the totalbiomass and relative abundance of vertebrate species in different size classes at these forest sites, but it did not af-fect their overall density. In particular, persistent hunting markedly reduced the density of large-bodied game spe-cies (
.
5 kg), which contributed a large proportion of the overall community biomass at nonhunted sites (65–78%) and lightly hunted sites (55–71%). Nutrient-rich floodplain forests contained a consistently greater gamebiomass than nutrient-poor unflooded forests, once I controlled for the effects of hunting pressure. Conservativeestimates of game yields indicate that as many as 23.5 million game vertebrates, equivalent to 89,224 tons ofbushmeat with a market value of US$190.7 million, are consumed each year by the rural population of Brazil-ian Amazonia, which illustrates the enormous socioeconomic value of game resources in the region. My cross-site comparison documents the staggering effect of subsistence hunters on tropical forest vertebrate communitiesand highlights the importance of considering forest types and forest productivity in game management pro-grams.
Efectos de la Cacería de Subsistencia sobre la Estructura de la Comunidad de Vertebrados en Bosques Amazónicos
Resumen:
La cacería de subsistencia afecta amplias extensiones de los trópicos que permanecen estructural-mente inalterados. Sin embargo, distinguir bosques tropicales sujetos a cacería de aquellos bosques no sujetos acacería representa un problema difícil porque esta forma difusa de extracción de recursos deja pocas señas visi-bles de su ocurrencia. Utilicé una serie estandarizada de censos en transectos por un período de diez años paraexaminar los efectos de la cacería de subsistencia sobre la estructura de comunidades de vertebrados en 25 sitiossujetos a distintos niveles de presión de cacería en la Amazonia. La biomasa de vertebrados, altamente correla-cionada con la presión de cacería, declinó gradualmente desde 1200 kg km
2
2
en sitios sin cacería hasta 200 kgkm
2
2
en sitios con cacería. La cacería tuvo un efecto negativo sobre la biomasa total y la abundancia relativa deespecies de vertebrados en diferentes clases de tamaño en estos sitios, pero no afectó su densidad total. Particu-larmente, la cacería persistente marcadamente redujo la densidad de especies de tamaño grande (
.
5 kg),que contribuyeron una proporción significativa de la biomasa total de la comunidad en sitios sin cacería (65–78%) y sitios con poca cacería (55–71%). Los bosques inundables, ricos en nutrientes, consistentemente presenta-ban una mayor biomasa de especies cinegéticas que los bosques no inundables, pobres en nutrientes, una vezque controlé los efectos de la presión de cacería. Estimaciones conservadoras del rendimiento cinegético indicanque alrededor de 23.5 millones de vertebrados, equivalentes a 89,224 toneladas de carne con un valor deUS$190.7 millones, son consumidos cada año por la población rural de la Amazonia brasileña, lo cual ilustra elenorme valor socioeconómico de los recursos cinegéticos de la región. Mi comparación de sitios documenta elasombroso efecto de la cacería de subsistencia sobre las comunidades de vertebrados y resalta la importancia de
considerar a los bosques y su productividad en programas de manejo cinegético.
Paper submitted October 9, 1998; revised manuscript accepted June 30, 1999.
Conservation BiologyVolume 14, No. 1, February 2000
Peres Game Extraction in Amazonian Forests
241
Introduction
Subsistence hunting of terrestrial vertebrates is a wide-spread phenomenon in tropical forests that has recentlyattracted much attention from applied ecologists and an-thropologists (Robinson & Redford 1991; Robinson &Bennett 1999 and references therein). Yet little isknown about the community-wide consequences of per-sistent game hunting on tropical vertebrate faunas. An-ecdotal reports indicate that areas affected by game ex-traction in tropical forests range from remote headwaterregions of western Brazilian Amazonia, where smallgroups of Amerindians may still hunt sustainably, to partsof west Africa accessible through logging roads, wheremarket hunters are now trapping, snaring and shootingalmost every terrestrial vertebrate larger than 1 kg (e.g.,Johansson 1995; McRae 1997). Even small-scale subsis-
tence hunting, however, can result in marked popula-tion declines in large-bodied birds and mammals (Ter-borgh et al. 1986; Thiollay 1986; Peres 1990; FitzGibbonet al. 1995), which in turn may reverberate at othertrophic levels and eventually affect tropical forest dy-namics. For example, the demographics of plant popula-tions that have long depended on strong interactionswith large vertebrates may be disrupted in the absenceof (1) adequate treatment and dispersal of large seeds bylarge frugivores (e.g., Alexandre 1978; Chapman & Chap-man 1995; Peres & van Roosmalen 1996); (2) large grani-vores and herbivores that mediate competitive interac-tions through selective seed predation and seedlingbrowsing (Dirzo & Miranda 1991; Terborgh & Wright1994); and in some cases (3) direct physical disturbancecaused by habitat “landscapers” such as large forestmammals.
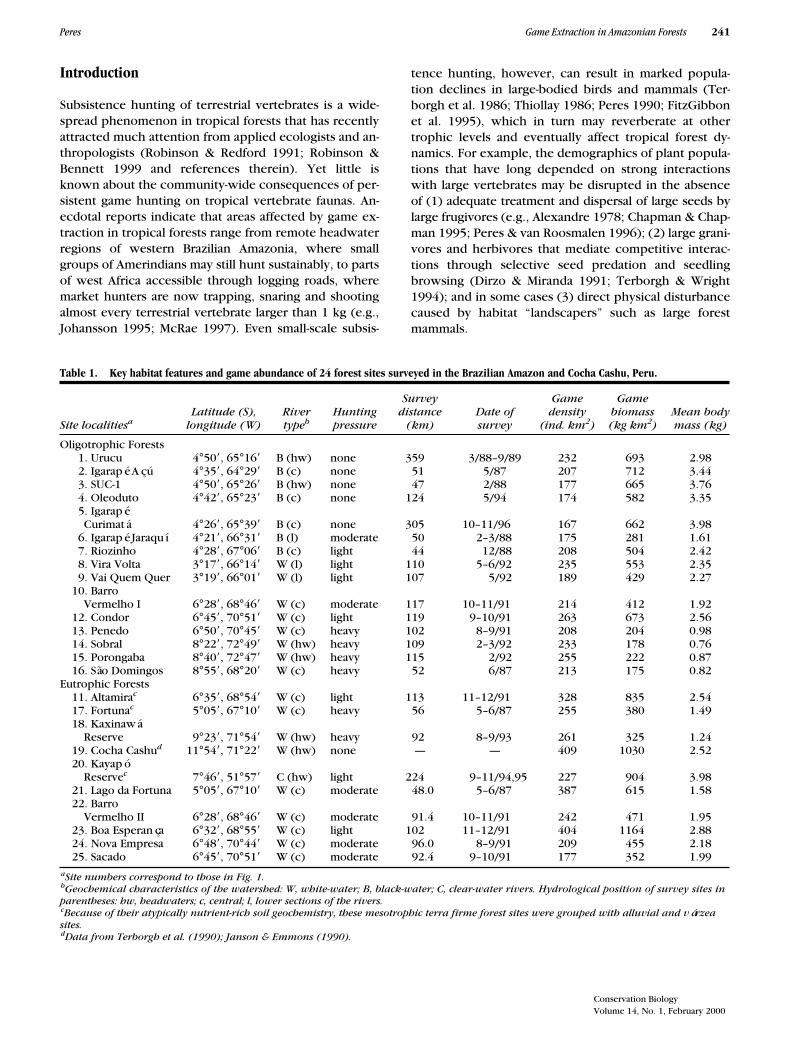
Table 1. Key habitat features and game abundance of 24 forest sites surveyed in the Brazilian Amazon and Cocha Cashu, Peru.
Site localities
a
Latitude (S), longitude (W)
Rivertype
b
Huntingpressure
Surveydistance
(km)Date ofsurvey
Gamedensity
(ind. km
2
)
Gamebiomass(kg km
2
)Mean bodymass (kg)
Oligotrophic Forests1. Urucu 4
°
50
9
, 65
°
16
9
B (hw) none 359 3/88–9/89 232 693 2.982. Igarapé Açú 4
°
35
9
, 64
°
29
9
B (c) none 51 5/87 207 712 3.443. SUC-1 4
°
50
9
, 65
°
26
9
B (hw) none 47 2/88 177 665 3.764. Oleoduto 4
°
42
9
, 65
°
23
9
B (c) none 124 5/94 174 582 3.355. IgarapéCurimatá 4
°
26
9
, 65
°
39
9
B (c) none 305 10–11/96 167 662 3.986. Igarapé Jaraquí 4
°
21
9
, 66
°
31
9
B (l) moderate 50 2–3/88 175 281 1.617. Riozinho 4
°
28
9
, 67
°
06
9
B (c) light 44 12/88 208 504 2.428. Vira Volta 3
°
17
9
, 66
°
14
9
W (l) light 110 5–6/92 235 553 2.359. Vai Quem Quer 3
°
19
9
, 66
°
01
9
W (l) light 107 5/92 189 429 2.2710. Barro
Vermelho I 6
°
28
9
, 68
°
46
9
W (c) moderate 117 10–11/91 214 412 1.9212. Condor 6
°
45
9
, 70
°
51
9
W (c) light 119 9–10/91 263 673 2.5613. Penedo 6
°
50
9
, 70
°
45
9
W (c) heavy 102 8–9/91 208 204 0.9814. Sobral 8
°
22
9
, 72
°
49
9
W (hw) heavy 109 2–3/92 233 178 0.7615. Porongaba 8
°
40
9
, 72
°
47
9
W (hw) heavy 115 2/92 255 222 0.8716. São Domingos 8
°
55
9
, 68
°
20
9
W (c) heavy 52 6/87 213 175 0.82Eutrophic Forests
11. Altamira
c
6
°
35
9
, 68
°
54
9
W (c) light 113 11–12/91 328 835 2.5417. Fortuna
c
5
°
05
9
, 67
°
10
9
W (c) heavy 56 5–6/87 255 380 1.4918. Kaxinawá
Reserve 9
°
23
9
, 71
°
54
9
W (hw) heavy 92 8–9/93 261 325 1.2419. Cocha Cashu
d
11
°
54
9
, 71
°
22
9
W (hw) none — — 409 1030 2.5220. Kayapó
Reserve
c
7
°
46
9
, 51
°
57
9
C (hw) light 224 9–11/94,95 227 904 3.9821. Lago da Fortuna 5
°
05
9
, 67
°
10
9
W (c) moderate 48.0 5–6/87 387 615 1.5822. Barro
Vermelho II 6
°
28
9
, 68
°
46
9
W (c) moderate 91.4 10–11/91 242 471 1.9523. Boa Esperança 6
°
32
9
, 68
°
55
9
W (c) light 102 11–12/91 404 1164 2.8824. Nova Empresa 6
°
48
9
, 70
°
44
9
W (c) moderate 96.0 8–9/91 209 455 2.1825. Sacado 6
°
45
9
, 70
°
51
9
W (c) moderate 92.4 9–10/91 177 352 1.99
a
Site numbers correspond to those in Fig. 1.
b
Geochemical characteristics of the watershed: W, white-water; B, black-water; C, clear-water rivers. Hydrological position of survey sites in parentheses: hw, headwaters; c, central; l, lower sections of the rivers.
c
Because of their atypically nutrient-rich soil geochemistry, these mesotrophic terra firme forest sites were grouped with alluvial and várzea sites.
dData from Terborgh et al. (1990); Janson & Emmons (1990).

242 Game Extraction in Amazonian Forests Peres
Conservation BiologyVolume 14, No. 1, February 2000
In addition to such ecological services, game verte-brates often contribute a critical direct-use resource totribal and nontribal peoples throughout the humid trop-ics (Hart 1978; Anstey 1991; Bodmer 1994; Bodmer et al.1994; Calouro 1995; Melnyk & Bell 1996; Clayton et al.1997) and have been considered a limiting factor to thepopulation growth and cultural development of Neotro-pical forest indigenous societies (Gross 1975). Selectivedefaunation of otherwise undisturbed tropical foreststhrough overhunting of large vertebrates may thus haveimportant socioeconomic consequences, reducing theextractive value of primary forests to local peoples andtheir potential ecotourism value. This, in turn, mayweaken the support from local constituencies to retainprimary forest cover as a land-use option, particularlywithin Indian reserves, which account for nearly one-fifth of Amazonia (Peres & Terborgh 1995).
In this paper, I evaluate the effect of game harvest bysubsistence hunters on the structure of Amazonian forestvertebrate communities. I provide a large-scale, cross-sitecomparison of vertebrate abundance using data from along-term series of standardized surveys conducted atforest sites under varying degrees of hunting pressure. Ifocus on community-wide rather than species-specificresponses to hunting pressure in terms of the standingdensity and biomass of forest vertebrates. In addition, I
examined the influence of forest type as defined by hy-drological regimes on abundance responses to huntingby comparing nutrient-rich (eutrophic) floodplain for-ests with nutrient-poor (oligotrophic), unflooded forests.Finally, I attempt to assess the socioeconomic impor-tance of subsistence hunting to rural people of Amazo-nia by estimating the total number and market value ofgame vertebrates killed each year in Amazonian Brazil.
Methods
Species Surveyed
This study is based on a standardized series of line-transectsurveys of diurnal vertebrates undertaken over a 10-yearperiod (1987–1996) at 25 Amazonian forest sites (Table 1;Fig. 1). Although over 100 vertebrate species with an adultbody mass greater than 100 g were recorded, I focused ona limited number of diurnal primary consumers compris-ing the most important game vertebrates, including pri-mates, ungulates, squirrels, caviomorph rodents, cracids,tinamous, trumpeters, wood-quails, and tortoises. Thesespecies were grouped into four size classes taking into ac-count their body size distribution (species names andbody weights given by Peres 1999a):
Figure 1. Location of Amazo-nian forest sites censused. Site numbers correspond to those listed in Table 1.
Conservation BiologyVolume 14, No. 1, February 2000
Peres Game Extraction in Amazonian Forests 243
(1) Small species (,1 kg): all squirrels (Microsciurus andSciurus spp.); acouchis (Myoprocta spp.); callitrichidprimates (pygmy marmosets [Cebuella pygmaea],tamarins [Saguinus spp.], and Goeldi monkeys [Cal-limico goeldii]); squirrel monkeys (Saimiri spp.);wood-quails (Odontophorus spp.); and small tina-mous (Crypturellus spp.).
(2) Medium species (1–5 kg): tortoises (Geochelonespp.); large tinamous (Tinamus spp.); trumpeters(Psophia spp.); Common and Piping Guan (Pene-lope spp. and Aburria pipile); curassows (Craxspp. and Mitu mitu); agoutis (Dasyprocta spp.);and all cebid primates other than the Atelinae (titimonkeys [Callicebus spp.], saki monkeys [Pithe-cia spp.], bearded sakis [Chiropotes satanas],uakaries [Cacajao calvus], and capuchin monkeys[Cebus spp.]).
(3) Large species (5–15 kg): howler monkeys (Alouattaspp.), woolly monkeys (Lagothrix lagotricha), andspider monkeys (Ateles spp.).
(4) Very large species (.15 kg): collared peccary (Ta-yassu tajacu), white-lipped peccary (T. pecari ), redbrocket deer (Mazama americana), gray brocketdeer (M. gouazoubira), and lowland tapir (Tapi-rus terrestris).
I refer to these taxa collectively as game vertebrates be-cause they are or could be harvested by subsistence hunt-ers in Amazonia. Although these taxa include a relativelysmall number of species, they represent the bulk of thevertebrate biomass in Neotropical forests (Eisenberg &Thorington 1973; Terborgh 1983; Terborgh et al. 1990;Peres 1999b). The diurnal line-transect surveys I con-ducted captured most game species pursued by huntersin Amazonian forests. The main exceptions are the twosloth genera (Bradypus and Choloepus), a few other spe-cies of nocturnal mammals, and a few infrequently har-vested taxa of large-bodied avian frugivores that tend tobe highly mobile in the forest canopy and notoriously dif-ficult to census.
Sampling Sites
Sampling sites consisted of 17 unflooded (hereafter terrafirme) forests, five forests predictably flooded on a sea-sonal basis (hereafter várzea), one alluvial forest inun-dated at irregular supra-annual intervals, and one transi-tional terra firme–palm forest with small enclaves ofedaphic savannas (cerrados). All sites were located inseveral major river basins of eastern (upper Rio Xingú: 1site) and western Brazilian Amazonia (Rio Juruá, Tarauacá,Jutaí, Purús, Tefé, and Urucu: 23 sites; Fig. 1). Data fromthe southern Peruvian alluvial forest of Cocha Cashu,Manu National Park, were also incorporated into theanalysis. This is the only additional Amazonian forest forwhich reliable density estimates are available for all
large-bodied bird (Terborgh et al. 1990) and mammalspecies (Terborgh 1983; Janson & Emmons 1990).
Survey sites were assigned to one of two broad catego-ries of forest types according to soil types and differ-ences in seasonal influx of alluvial sediments, which inlowland Amazonia are the primary sources of exogenoussoil macronutrients that may affect large-scale forest pro-ductivity (Irion 1978; Duivenvoorden & Lips 1995). I thusclassified all sites into either terra firme (oligotrophic) oralluvial-floodplain (eutrophic) sites according to nutrientconcentrations in 20 soil samples collected at each sitealong census transects (C. Peres, unpublished data). Theonly exceptions were the mesotrophic terra firme for-ests of Fortuna, Altamira, and Kayapó Reserve, whichwere similar in nutrient profile to alluvial forest sitessuch as Kaxinawá Reserve.
Twenty-five sites (6 nonhunted and 19 hunted) werethus considered. Nonhunted sites were defined as thoseentirely uninhabited by Amerindians, detribalized Ama-zonians (caboclos), and rubber tappers, and those thatoffered no enduring evidence of hunting activity thiscentury (e.g., ax marks on core hardwoods, old scars onthe bark of large latex trees). These sites could not beeasily reached on foot by hunters, and access to them byinvestigators was gained largely with helicopters andsmall aircraft. The term nonhunted is thus reserved forpristine forests of remote interfluvial basins and headwa-ter regions of Amazonia, rather than for areas rarely vis-ited by hunters in the last few decades. Hunting at allhunted sites was carried out with shotguns, because therapid transition from traditional weapons to firearms hasnow reached even some of the most remote parts of Am-azonia (Peres 1993), including the three Indian reservessampled (Kaxinawá Reserve, Kayapó Reserve, Penedo).
Because reliable data on game harvest were not avail-able, it was difficult to accurately reconstruct the historyof hunting at hunted sites over the last several decades. Ithus simply assigned them to one of three broad catego-ries of hunting pressure—light, moderate, and heavy—on the basis of (1) semi-structured interviews (withhunters who had lived at each hunted site for at least 2years prior to surveys) about the frequency, intensity,and species selectivity of local game harvest practices,and (2) present and past human population density anddistribution quantified on the basis of interviews and thenumber of households in each area, as revealed by high-resolution (1:250,000) maps of each census area (RADAM1973–1981).
Human population density at all but two hunted siteshad either remained stable or declined since the RADAMsurveys, because many sites along the Juruá River havebeen subject to rural exodus to urban centers. I alsotook into account the direct evidence of hunting activitythat was detectable at the time of surveys (e.g., fre-quency of shotgun sounds heard, occurrence of huntingtrails, hammock “waiting” stations, old campsites). This
244 Game Extraction in Amazonian Forests Peres
Conservation BiologyVolume 14, No. 1, February 2000
kind of evidence, however, can be a poor predictor ofthe history of hunting pressure in an area because (1)hunting activity often varies considerably on a seasonalbasis, (2) the behavior of hunters in an area was often af-fected by our presence, and (3) the effective life span ofmost residual signs of prior hunting activity is ephem-eral. Interviews with hunters, on the other hand, wereunbiased with respect to fear of disclosing illegal hunt-ing activities because interviewees in such remote areaswere unaware and did not appear to be suspicious of le-gal issues concerning game hunting.
The density of species thought to be most susceptibleto hunting was not used to infer the hunting pressure ata given site because rates of game recovery may also beaffected by other environmental gradients, such as hy-drological regime and forest type (Peres 1999a, 1999b).I therefore assumed that this crude four-point scale ofhunting pressure was the most refined this classificationcould afford in the absence of more accurate records ofgame harvest by present or past human populations.
Population Density Estimates
Surveys were conducted over an average of 113.5 678.0 km (range, 44–359 km; Table 1), for a total of 2724km walked at 24 sites. Population densities at CochaCashu were calculated from a range of methods, includ-ing home-range mapping and strip-census surveys usingthe King estimator ( Janson & Emmons 1990). Line-transect censuses were conducted from early morning tomidday (0600–1130 hours) by trained observers walkingbetween two and four transects of 4–5 km in length,which were cut and marked every 50 m. Transects withinterra firme sites abutting floodplain forests were cut in-land, perpendicularly to the river. Newly preparedtransects were left to “rest” for at least 1 day before eachsurvey was initiated. At previously hunted sites, weavoided using hunter trails and rubber-tapper trails (es-tradas) regardless of their linearity because that couldpotentially introduce detection biases resulting in den-sity underestimates. Censuses were conducted on clearor overcast but not on rainy days, at walking velocitiesof approximately 1.25 km/hour, by one observer pertransect and were usually completed within a 30-day pe-riod. The potential effects of seasonality on vertebratecommunity dynamics, which can be pronounced in sea-sonally flooded forests (Peres 1997a), were accommo-dated by surveys in this forest type being undertaken onroughly the same months of the year, coinciding withthe low-water season. Surveys taking place throughoutthe annual cycle were thus restricted to the relativelyaseasonal terra firme forests, which tend to contain sta-ble large-vertebrate assemblages throughout the year(e.g., Peres 1997a).
I derived density estimates for each species from ei-ther the hazard rate or uniform models with a cosine ad-
justment (Buckland et al. 1993) using perpendicular dis-tances from the transect to the first animal sighted. For afew highly vocal species (e.g., Alouatta spp., Callicebusspp.), observations resulting from acoustic cues (at ex-treme distances from the transect) were excluded be-cause they were detrimental to the performance ofmodel estimators. Because detection probabilities couldbe biased toward species in large, uncohesive groups, acorrection factor based on the mean group spread ofeach social species was also incorporated into the model(Peres 1997a). These models provided the best fits forspecies-specific data sets as determined by the minimumAkaike information criterion (Buckland et al. 1993). Inthe case of relatively rare species, I avoided unrealisticdistortions caused by small sample sizes by pooling allsurveys yielding fewer than 40 independent sightings(Burnham et al. 1980) and then deriving density esti-mates based on site-specific sampling efforts. This proce-dure was justified because between-site variances in per-pendicular distances, which could have resulted frompotential differences in detection probabilities, were nogreater than those within sites (analysis of variance[ANOVA], p . 0.05 in all cases).
I calculated population densities for social species us-ing mean group sizes at each site from the fraction of to-tal group counts considered accurate. Because data onthe size structure of populations of each species wereunavailable, I estimated crude population biomass usingthe mean body weight of a given species, simply definedas 80% of the average body mass of adult males and fe-males in Amazonian populations (data from Janson &Emmons 1990; Terborgh et al. 1990; Bodmer 1994; C.Peres & H. Nascimento, unpublished data). Densities(D) were assumed to be .0 if a species had been re-corded at a site either during or outside our census rou-tine. On the other hand a species was assumed locallyextinct (D 5 0) at a hunted site if local intervieweesunanimously agreed that it had once been common buthad not been sighted for at least 5 years. Further detailson the physiognomy of the sampling sites and surveymethodology can be found elsewhere (Peres 1997a,1999a, 1999b, 1999c).
Estimates of Game Harvest
Patterns of wildlife use in Neotropical forests have beenreviewed by Redford and Robinson (1987 ) in terms ofthe average number of animals consumed per capita perannum. That review was based on 19 anthropological stud-ies encompassing 23 samples documenting kills broughtinto 17 indigenous and 6 colonist settlements. Thosestudies did not take into account the game mortalityfrom animals that were fatally wounded but not re-trieved by hunters. Consumption rates, therefore, canseverely underestimate the total mortality actually result-ing from game hunting, which for some taxonomic

Conservation BiologyVolume 14, No. 1, February 2000
Peres Game Extraction in Amazonian Forests 245
groups may correspond to nearly twice the number actu-ally reaching village households (e.g., Peres 1991). Usingkill rates based on these hunting studies and human pop-ulation data from the 1980 Brazilian national census,Redford (1993) estimated that as many as 19 milliongame animals are killed each year in rural Brazilian Ama-zonia. Here I provide new estimates of the total numberof game vertebrates consumed in Brazilian Amazonia onthe basis of the 23 samples reviewed by Redford andRobinson (1987), plus eight additional game harvestprofiles spanning a sampling period of between 1 and 4years. Four of these studies targeted caboclo, rubber-tap-per, and colonist settlements of different parts of Brazil-ian (Martins 1992; Calouro 1995; Muchagata 1997 ) andPeruvian Amazonia (Bodmer 1994), whereas two stud-ies targeted Indian villages in Ecuatorian (Mena et al.1999) and Bolivian Amazonia (Townsend 1999). In addi-tion, I include two unpublished game harvest studies wehave undertaken over a sampling period of at least 2years (C. Peres & H. Nascimento, unpublished data).The first of these was obtained from a small caboclo set-tlement located at Vila Moura, upper Tefé River, Amazo-nas, Brazil (35 consumers 3 750 days) and the secondfrom the Kayapó Indian village of A’Ukre (133 consum-ers 3 542 days) located along the Riozinho River, aneastern Amazonian subtributary of the Xingú River.
On the basis of these 31 samples, estimates of the av-erage number of animals of each species consumed perperson per year were then multiplied by the size of therural population of Brazilian Amazonia in low-incomehouseholds who are most likely to depend on game re-sources (Table 2). The upper and lower limits of my esti-mates corresponded to the size of the total rural popula-tion within households with an aggregate income of ,1Brazilian minimum salary (BMS in September 1993 5US$98/month) and ,0.5 BMS (US$49/month), respec-
tively. These critical values excluded the minimum-wagepublic and private sector of the rural labor force, leavingprimarily zero-income households that must resort tohunting and fishing to meet dietary protein demands. Al-though many of the samples I compiled were intrinsi-cally biased toward areas of high game consumption,these crude, basin-wide estimates could still be highlyconservative because they exclude (1) 55% of the entirehuman population of Amazonia corresponding to urbancenters (cities, towns, and large villages), even thoughthese are often subsidized with game meat; (2) all areasdominated by agricultural landscapes in the southern Am-azonian states; (3) all areas outside the phytogeographiclimits of Amazonia (Fig. 1); (4) all households with an ag-gregate income .1 BMS, which are assumed to be farmore reliant on wage labor and food purchases, includingdomesticated animal protein rather than bushmeat; (5)several game species of more restricted geographic distri-bution for which average harvest rates remain unavail-able; and (6) all species comprising ,1.5% of the totalweight of game taken in a given sample, which were alsoexcluded by Redford and Robinson (1987).
Results
Hunting Pressure and Game Abundance
Vertebrate species censused at the 25 forest sites fallalong a size-graded continuum, ranging from pygmymarmoset (0.15 kg) to lowland tapir (160 kg). As inother Neotropical forests, the vertebrate assemblages Icensused were largely represented by small (16 species)and medium-sized taxa (18 species), rather than those inthe two largest size classes (4 and 5 species, respec-tively). Because game harvest at hunted sites was highly
Table 2. Human population of Brazilian Amazoniaa that may be heavily subsidized by subsistence game hunting of forest vertebrates.
State of Amazonia Total population Rural populationArea
(km2)Rural populationdensity (km22)
Population in rural households with a
joint income of less thanb
1 BMS 0.5 BMS
Acre 446,480 170,160 153,698 1.11 98,522 38,456Amapá 317,597 60,651 142,359 0.43 21,167 9,037Amazonas 2,269,555 647,972 1,567,954 0.41 316,210 149,682Pará 5,332,187 2,535,367 1,227,530 2.07 1,151,057 398,053Rondoniac 1,291,214 539,613 238,379 2.26 315,134 153,250Roraima 251,783 88,831 225,017 0.39 36,687 24,784Tocantinsc 990,760 419,226 277,322 1.51 27,250 10,523Maranhãoc 5,160,974 3,096,250 329,556 9.40 219,524 109,298Mato Grossoc 2,246,757 600,827 903,569 0.66 39,204 14,330Total 18,307,307 8,158,897 5,065,384 1.61 2,224,756 907,411aFundação Instituto Brasileiro de Geografia e Estatística 1996.bBrazilian minimum salary (BMS) based on wage values of September 1993 (1 BMS 5 US$98 per month).cThe low-income rural population of these southern states of “Legal Amazonia” is adjusted by excluding all areas outside the phytogeographical limits of the region.

246 Game Extraction in Amazonian Forests Peres
Conservation BiologyVolume 14, No. 1, February 2000
selective toward large-bodied taxa (Peres 1990; Bodmer1995a), however, one would expect these species totake the brunt of the effects of game hunting.
Estimates of total game density and biomass at the 25 for-est sites are presented in Table 1. Considering all speciescensused, overall biomass of the vertebrate community de-clined significantly with increasing levels of hunting pres-sure (one-way ANOVA on loge-transformed data, F3,21 518.9, p , 0.001; Fig. 2). The average body mass of the ver-tebrate fauna was therefore significantly reduced from theleast to the most hunted sites (F3,21 5 30.9, p , 0.001), butthe total number of animals occurring at different forestsites—which accounted for a small variation from 228 692 individuals km22 at nonhunted sites (n 5 6) to 237 623 individuals km22 (n 5 6) at heavily hunted sites—wasnot affected by hunting regime (F3,21 5 0.34, p 5 0.79).
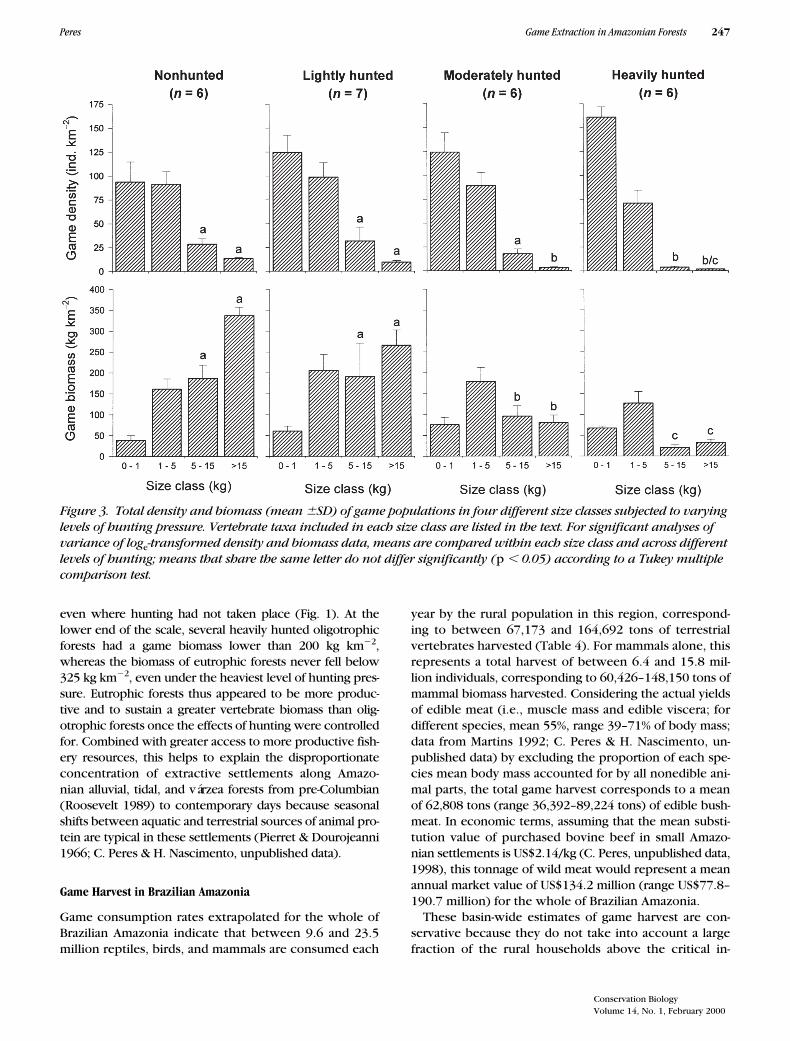
Because large-bodied taxa are by far the greatest contrib-utors to the overall community biomass of nonhunted ver-tebrate communities (Fig. 3), even slight shifts in theirdensities resulted in major changes in their biomass. Over-all community biomass at nonhunted sites (724 6 156 kgkm22, n 5 6) was virtually the same as that of lightlyhunted sites (723 6 260 kg km22, n 5 7 ) but substantiallygreater than that at moderately (431 6 114 kg km22, n 56) and heavily hunted sites (247 6 85 kg km22, n 5 6).
The combined density and biomass of species in differ-ent size classes clearly diverged across varying levels ofhunting pressure (Fig. 3). Although small and medium-sized species were not obviously affected by hunting, theoverall abundance of the two largest size classes was signif-icantly depressed at moderately and heavily hunted sitesboth in terms of density (ANOVA on loge-transformed data;species 5–15 kg: F3,21 5 7.7, p , 0.001; species .15 kg:
F3,21 5 29.7, p , 0.001) and biomass (species 5–15 kg:F3,21 5 9.0, p , 0.001; species .15 kg: F3,21 5 34.0, p ,0.001; Fig. 3). In aggregate, species in the largest sizeclasses accounted for an average density of 42 individualskm22 at either nonhunted or lightly hunted sites butsharply declined to only 21 and 5 individuals km22 at mod-erately and heavily hunted sites, respectively. In contrast,densities of small and medium-sized species, albeit rela-tively high at all sites, either remained unchanged or gradu-ally increased from nonhunted to heavily hunted sites (Fig.3), suggesting that they were either unaffected or covariedpositively with some correlate of hunting pressure.
There was a ten-fold difference between the mean un-gulate biomass at nonhunted (337 6 19 kg km22) andheavily hunted sites (32 6 8 kg km22). The large-bodiedateline primates also gradually declined from a mean bio-mass of 186 6 32 kg km22 and 191 6 80 kg km22 at non-hunted and lightly hunted sites, respectively, to 96 6 25kg km22 and 20 6 6 kg km22 at moderately and heavilyhunted sites. The pooled biomass of these two largest sizeclasses thus declined 10-fold from an average of 523 6 51kg km22 (72%) at nonhunted sites to 53 6 14 kg km22
(21%) at heavily hunted sites. Selective removal of large-bodied species was thus translated into pronouncedshifts in the mean body mass of individual vertebratespresent at different sites (Table 1), from as much as3980 g at a nonhunted site (Igarapé Curimatá) to as lowas 760 g at a heavily hunted site (Sobral).
These trends resulted in clear shifts in the overall verte-brate community structure: biomass densities were domi-nated by large-bodied frugivore-herbivores at nonhuntedsites but by small and medium-sized frugivore-insectivoresat persistently hunted sites. This can be seen in the relation-ships between hunting pressure and density and biomassthat were strongly negative for large-bodied species butpositive for small-bodied species (Fig. 4). Most noticeablewas the staggering negative relationship between huntingpressure and the relative contribution of species weighing.5 kg to the overall vertebrate biomass (rs 5 20.93, p ,0.001, n 5 25), which decreased from 65–78% and 55–71% at nonhunted and lightly hunted sites, respectively, toonly 8–29% at heavily hunted sites. Considering medium-sized species (1–5 kg), this correlation was only marginallysignificant in terms of their overall density but strongly pos-itive in terms of their biomass (Fig. 4).
Effects of Forest Type
The total vertebrate density at different sites was signifi-cantly affected by forest type but not by hunting pressure(analysis of covariance; Table 3). In contrast, both foresttypes and hunting pressure explained a comparable propor-tion of the variation in overall game biomass. In eutrophicforests subject to little or no hunting, the aggregate gamebiomass ranged from 850 to nearly 1200 kg km22, whereasthat of oligotrophic forests did not exceed 712 kg km22
Figure 2. Total game biomass (ranked in decreasing order) of 10 eutrophic and 15 oligotrophic Amazonian forest sites subjected to varying levels of hunting pres-sure. Site numbers correspond to those shown in Table 1.
Conservation BiologyVolume 14, No. 1, February 2000
Peres Game Extraction in Amazonian Forests 247
even where hunting had not taken place (Fig. 1). At thelower end of the scale, several heavily hunted oligotrophicforests had a game biomass lower than 200 kg km22,whereas the biomass of eutrophic forests never fell below325 kg km22, even under the heaviest level of hunting pres-sure. Eutrophic forests thus appeared to be more produc-tive and to sustain a greater vertebrate biomass than olig-otrophic forests once the effects of hunting were controlledfor. Combined with greater access to more productive fish-ery resources, this helps to explain the disproportionateconcentration of extractive settlements along Amazo-nian alluvial, tidal, and várzea forests from pre-Columbian(Roosevelt 1989) to contemporary days because seasonalshifts between aquatic and terrestrial sources of animal pro-tein are typical in these settlements (Pierret & Dourojeanni1966; C. Peres & H. Nascimento, unpublished data).
Game Harvest in Brazilian Amazonia
Game consumption rates extrapolated for the whole ofBrazilian Amazonia indicate that between 9.6 and 23.5million reptiles, birds, and mammals are consumed each
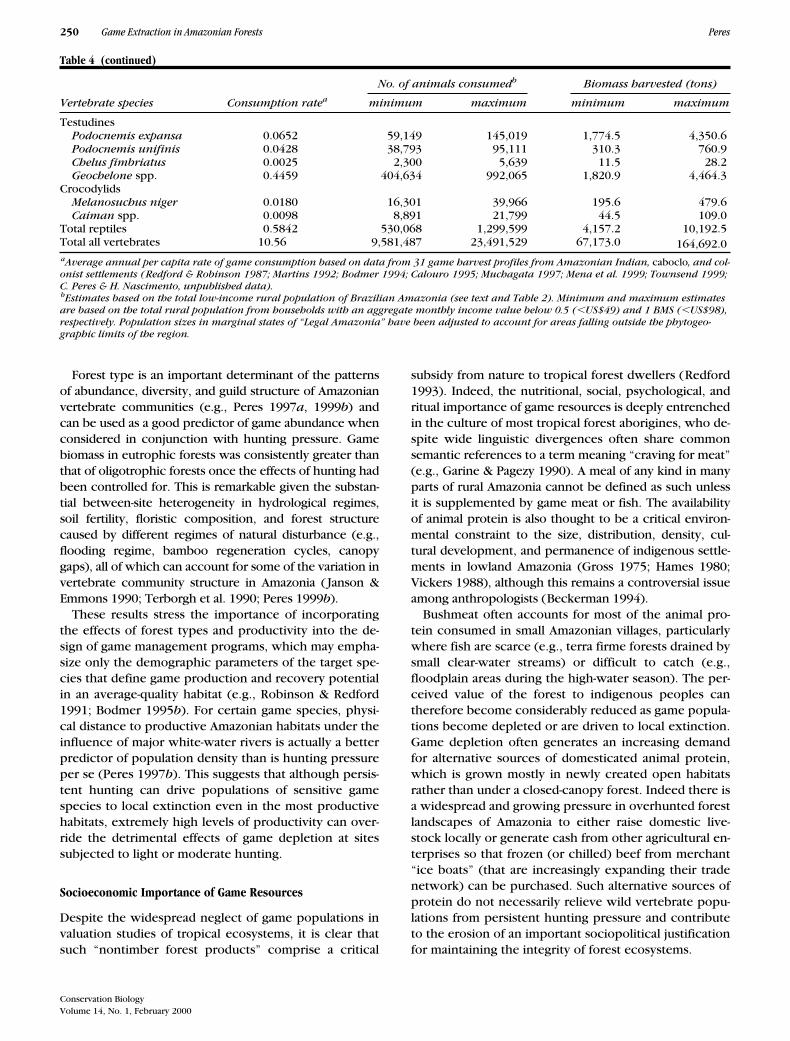
year by the rural population in this region, correspond-ing to between 67,173 and 164,692 tons of terrestrialvertebrates harvested (Table 4). For mammals alone, thisrepresents a total harvest of between 6.4 and 15.8 mil-lion individuals, corresponding to 60,426–148,150 tons ofmammal biomass harvested. Considering the actual yieldsof edible meat (i.e., muscle mass and edible viscera; fordifferent species, mean 55%, range 39–71% of body mass;data from Martins 1992; C. Peres & H. Nascimento, un-published data) by excluding the proportion of each spe-cies mean body mass accounted for by all nonedible ani-mal parts, the total game harvest corresponds to a meanof 62,808 tons (range 36,392–89,224 tons) of edible bush-meat. In economic terms, assuming that the mean substi-tution value of purchased bovine beef in small Amazo-nian settlements is US$2.14/kg (C. Peres, unpublished data,1998), this tonnage of wild meat would represent a meanannual market value of US$134.2 million (range US$77.8–190.7 million) for the whole of Brazilian Amazonia.
These basin-wide estimates of game harvest are con-servative because they do not take into account a largefraction of the rural households above the critical in-
Figure 3. Total density and biomass (mean 6SD) of game populations in four different size classes subjected to varying levels of hunting pressure. Vertebrate taxa included in each size class are listed in the text. For significant analyses of variance of loge-transformed density and biomass data, means are compared within each size class and across different levels of hunting; means that share the same letter do not differ significantly (p , 0.05) according to a Tukey multiple comparison test.

248 Game Extraction in Amazonian Forests Peres
Conservation BiologyVolume 14, No. 1, February 2000
come level that are also heavily subsidized by gamemeat. This also applies to a large number of Amazonianhunters who are relatively wealthy and well equippedand come from urban households. Nevertheless, theseestimates suggest the enormous socioeconomic impor-tance of game vertebrates to Amazonian rural people.They also roughly support Redford’s (1993) estimate of 19million vertebrates consumed (including 14 million mam-mals) based on the 1980 population of Amazonian Bra-zil. The total mortality associated with hunting is fargreater, however, because these estimates ignore all ca-sualties from lethally wounded animals left unretrieved.
Discussion
Shifts in Vertebrate Community Structure
My study shows that game harvest can have a marked ef-fect on the structure of Amazonian vertebrate communi-
ties largely because of selective overhunting, if not localextirpation, of large-bodied taxa (see also Peres 1990;1996, 1999a). Vertebrate assemblages at forest sites ex-posed to increasingly heavier hunting pressure were dom-inated by small-bodied species, which accounted for asubstantially lower crude biomass than did species in thetwo largest size classes. The enormous contribution tothe game biomass of nonhunted sites made by large-bod-ied species, which are associated with long generationtime and low fecundity, was clearly depressed at persis-tently hunted sites. Large vertebrates particularly sensitiveto hunting, as inferred from large differences in popula-tion density between hunted and nonhunted areas, in-cluded large tinamous, Piping guan, curassows, trumpet-ers, white-lipped peccaries, tapirs, and all three genera ofprehensile-tailed primates, but particularly woolly mon-keys and spider monkeys (Peres 1999a). These trends areconsistent with those found elsewhere in the Neotropics(Freese et al. 1982; Thiollay 1986; Glanz 1991; Silva &Strahl 1991; Bodmer 1995a).
Figure 4. Relationship between level of hunting pressure (N, none; L, light; M, moderate; H, heavy) and the percent con-tribution of species within three size classes to the overall density and biomass of game vertebrates at 25 Amazonian for-est sites. Spearman correlation coefficients (rs ) are shown for each scatterplot.
Table 3. Mean (6SD) density and biomass of game vertebrates for each category of hunting pressure at 25 Amazonian forest sites.
Overall game density (individual km22)
Overall game biomass(kg km22)
Hunting pressure (n) mean SD mean SD
None (6) 227.6a 92.4 723.7b 156.4Light (7) 264.9a 76.0 723.1b 260.0Moderate (6) 234.0a 79.0 431.1c 113.9Heavy (6) 237.4a 23.2 247.2d 85.1All sites (25) 241.9 69.7 538.9 262.3r2 0.417 0.919Hunting pressure, F3,20 1.034 66.325 f
Forest type, F1,20 11.917e 46.808 f
a–dAnalysis of covariance, considering the effects of hunting pressure and forest types on game abundance, following transformation of density and biomass data (x) as loge (x). Means that share letters in common do not differ significantly (p , 0.05) according to a Tukey multiple com-parison test.ep , 0.01.fp , 0.001.

Conservation BiologyVolume 14, No. 1, February 2000
Peres Game Extraction in Amazonian Forests 249
Table 4. Estimates of game vertebrate numbers and biomass harvested per year by the low-income rural population of Brazilian Amazonia.
No. of animals consumedb Biomass harvested (tons)
Vertebrate species Consumption ratea minimum maximum minimum maximum
UngulatesTayassu pecari 0.6739 611,527 1,499,318 15,655.1 38,382.5Tayassu tajacu 0.6083 551,949 1,353,248 11,039.0 27,065.0Mazama spp. 0.3071 278,704 683,317 5,351.1 13,119.7Tapirus terrestris 0.0523 47,422 116,269 6,070.0 14,882.4
RodentsCuniculus paca 0.8055 730,886 1,791,959 5,700.9 13,977.3Dasyprocta spp. 0.6649 603,312 1,479,177 2,171.9 5,325.0Myoprocta spp. 0.0437 39,674 97,270 23.8 58.4H. hydrochaeris 0.0927 84,094 206,179 1,345.5 3,298.9Sciurus spp. 0.1422 128,991 316,256 61.9 151.8Coendou spp. 0.0300 27,233 66,768 46.3 113.5
LagomorphsSylvilagus brasiliensis 0.0004 319 781 0.3 0.6
PrimatesAlouatta spp. 0.3429 311,143 762,850 1,617.9 3,966.8Ateles spp. 0.2507 227,471 557,704 1,642.3 4,026.6Lagothrix lagotricha 0.5621 510,057 1,250,539 3,555.1 8,716.3Cebus spp. 1.0720 972,707 2,384,846 2,266.4 5,556.7Pithecia spp. 0.0465 42,236 103,554 74.3 182.3Cacajao spp. 0.0093 8,416 20,663 21.3 52.2Chiropotes spp. 0.0347 31,532 77,308 68.1 167.0Callicebus spp. 0.0404 36,640 89,833 30.8 75.5Aotus spp. 0.0446 40,485 99,260 38.9 95.3Saimiri spp. 0.0074 6,711 16,454 5.0 12.3Saguinus spp. 0.0093 8,442 20,697 4.0 9.7
EdentatesBradypus spp. 0.0627 56,858 139,401 119.4 292.7Myrmecophaga tridactyla 0.0131 11,851 29,056 71.1 174.3Tamandua tetradactyla 0.0871 79,023 193,746 237.1 581.2Dasypus spp. 0.6734 611,007 1,498,045 2,138.5 5,243.2Priodontes maximus 0.0037 3,375 8,273 84.4 206.8
CarnivoresNasua nasua 0.3728 338,316 829,470 839.0 2,057.1Potos flavus 0.0140 12,670 31,064 19.0 46.6Eira barbara 0.0084 7,620 18,682 29.3 71.7Felis spp. 0.0216 19,595 48,042 98.0 240.2
Total mammals 7.0977 6,440,266 15,789,999 60,425.7 148,149.7Cracids
Crax/Mitu spp. 0.2964 268,973 659,457 726.2 1,780.5Pipile cujubi 0.1609 146,006 357,971 157.7 386.6Penelope spp. 0.5425 492,241 1,206,857 566.1 1,387.9Nothocrax urumutum 0.0082 7,409 18,166 17.8 43.6Ortalis spp. 0.0148 13,420 32,903 5.0 12.2
TinamidsTinamus spp. 0.2503 227,151 556,921 245.3 601.5Crypturellus spp. 0.2522 228,811 560,989 86.9 213.2
Wood-quailsOdontophorus spp. 0.0233 21,150 51,854 5.9 14.5
TrumpetersPsophia spp. 0.2256 204,739 501,972 221.1 542.1
Other game birdsAra spp. 0.0716 65,008 159,385 97.5 239.1Amazona spp. 0.1335 121,164 297,065 72.7 178.2Cairina moschata 0.0199 18,082 44,333 45.2 110.8Leptotila spp. 0.3150 285,872 700,890 85.8 210.3Ramphastos spp. 0.5358 486,173 1,191,982 243.1 596.0Pteroglossus spp. 0.0237 21,487 52,682 6.4 15.8Ophistocomus hoazin 0.0038 3,470 8,507 6.9 17.0
Total birds 25.1653 22,834,269 55,984,193 145,249.8 356,117.9
continued
250 Game Extraction in Amazonian Forests Peres
Conservation BiologyVolume 14, No. 1, February 2000
Forest type is an important determinant of the patternsof abundance, diversity, and guild structure of Amazonianvertebrate communities (e.g., Peres 1997a, 1999b) andcan be used as a good predictor of game abundance whenconsidered in conjunction with hunting pressure. Gamebiomass in eutrophic forests was consistently greater thanthat of oligotrophic forests once the effects of hunting hadbeen controlled for. This is remarkable given the substan-tial between-site heterogeneity in hydrological regimes,soil fertility, floristic composition, and forest structurecaused by different regimes of natural disturbance (e.g.,flooding regime, bamboo regeneration cycles, canopygaps), all of which can account for some of the variation invertebrate community structure in Amazonia ( Janson &Emmons 1990; Terborgh et al. 1990; Peres 1999b).
These results stress the importance of incorporatingthe effects of forest types and productivity into the de-sign of game management programs, which may empha-size only the demographic parameters of the target spe-cies that define game production and recovery potentialin an average-quality habitat (e.g., Robinson & Redford1991; Bodmer 1995b). For certain game species, physi-cal distance to productive Amazonian habitats under theinfluence of major white-water rivers is actually a betterpredictor of population density than is hunting pressureper se (Peres 1997b). This suggests that although persis-tent hunting can drive populations of sensitive gamespecies to local extinction even in the most productivehabitats, extremely high levels of productivity can over-ride the detrimental effects of game depletion at sitessubjected to light or moderate hunting.
Socioeconomic Importance of Game Resources
Despite the widespread neglect of game populations invaluation studies of tropical ecosystems, it is clear thatsuch “nontimber forest products” comprise a critical
subsidy from nature to tropical forest dwellers (Redford1993). Indeed, the nutritional, social, psychological, andritual importance of game resources is deeply entrenchedin the culture of most tropical forest aborigines, who de-spite wide linguistic divergences often share commonsemantic references to a term meaning “craving for meat”(e.g., Garine & Pagezy 1990). A meal of any kind in manyparts of rural Amazonia cannot be defined as such unlessit is supplemented by game meat or fish. The availabilityof animal protein is also thought to be a critical environ-mental constraint to the size, distribution, density, cul-tural development, and permanence of indigenous settle-ments in lowland Amazonia (Gross 1975; Hames 1980;Vickers 1988), although this remains a controversial issueamong anthropologists (Beckerman 1994).
Bushmeat often accounts for most of the animal pro-tein consumed in small Amazonian villages, particularlywhere fish are scarce (e.g., terra firme forests drained bysmall clear-water streams) or difficult to catch (e.g.,floodplain areas during the high-water season). The per-ceived value of the forest to indigenous peoples cantherefore become considerably reduced as game popula-tions become depleted or are driven to local extinction.Game depletion often generates an increasing demandfor alternative sources of domesticated animal protein,which is grown mostly in newly created open habitatsrather than under a closed-canopy forest. Indeed there isa widespread and growing pressure in overhunted forestlandscapes of Amazonia to either raise domestic live-stock locally or generate cash from other agricultural en-terprises so that frozen (or chilled) beef from merchant“ice boats” (that are increasingly expanding their tradenetwork) can be purchased. Such alternative sources ofprotein do not necessarily relieve wild vertebrate popu-lations from persistent hunting pressure and contributeto the erosion of an important sociopolitical justificationfor maintaining the integrity of forest ecosystems.
Table 4 (continued)
No. of animals consumedb Biomass harvested (tons)
Vertebrate species Consumption ratea minimum maximum minimum maximum
TestudinesPodocnemis expansa 0.0652 59,149 145,019 1,774.5 4,350.6Podocnemis unifinis 0.0428 38,793 95,111 310.3 760.9Chelus fimbriatus 0.0025 2,300 5,639 11.5 28.2Geochelone spp. 0.4459 404,634 992,065 1,820.9 4,464.3
CrocodylidsMelanosuchus niger 0.0180 16,301 39,966 195.6 479.6Caiman spp. 0.0098 8,891 21,799 44.5 109.0
Total reptiles 0.5842 530,068 1,299,599 4,157.2 10,192.5Total all vertebrates 10.56 9,581,487 23,491,529 67,173.0 164,692.0aAverage annual per capita rate of game consumption based on data from 31 game harvest profiles from Amazonian Indian, caboclo, and col-onist settlements (Redford & Robinson 1987; Martins 1992; Bodmer 1994; Calouro 1995; Muchagata 1997; Mena et al. 1999; Townsend 1999; C. Peres & H. Nascimento, unpublished data).bEstimates based on the total low-income rural population of Brazilian Amazonia (see text and Table 2). Minimum and maximum estimates are based on the total rural population from households with an aggregate monthly income value below 0.5 (,US$49) and 1 BMS (,US$98), respectively. Population sizes in marginal states of “Legal Amazonia” have been adjusted to account for areas falling outside the phytogeo-graphic limits of the region.
Conservation BiologyVolume 14, No. 1, February 2000
Peres Game Extraction in Amazonian Forests 251
Game Hunting versus Forest Disturbance
The Brazilian Amazon contains over one-third of the tropi-cal forest remaining worldwide, much of which is still fairlyremote. Until only a few decades ago, large-scale anthropo-genic forest disturbance was relatively minor because ac-cess to most of the region was physically prohibitive andconfined to a belt of forests not far from navigable riversand settled by small, rural populations. Since the initiationof the federally funded highways program in the 1960s, ac-cess to new forest frontiers has increased enormously, butimplementation of environmental legislation and enforce-ment of existing laws restricting resource extraction havefailed to keep pace with the improved access.
On a large scale, signs of forest disturbance are mostvisible in areas converted to agriculture and pasture,fragmented forest mosaics, uncontrolled logging, miningoperations, and hydroelectric dams (Skole & Tucker1993). Compared to these patterns of structural habitatalteration, subsistence hunting is often viewed by policymakers and conservation organizations as a benign formof human disturbance, particularly because its detrimen-tal effects are extremely difficult to detect at differentspatial scales (Redford 1992). Indeed, identifying huntedbut otherwise undisturbed tropical forest presents a dif-ficult problem because hunting is a highly inconspicu-ous form of resource extraction that leaves few visibleindicators of its occurrence. Game harvest should thusbe seen as but one extreme of a graded continuum of an-thropogenic forest disturbances that vary in the extentto which they are (1) detectable from space, (2) revers-ible, and (3) mediators of change to the entire ecosys-tem. This is reflected in current difficulties faced by in-ternational conservation organizations in distinguishingpristine tropical forests (i.e., nonhunted and structurallyundisturbed) from those that have been defaunated tovarying degrees but otherwise remain unaltered (e.g.,Dinerstein et al. 1995; Bryant et al. 1997).
Game hunting is the single most geographically wide-spread form of resource extraction in Amazonia and canaffect the core of even some of the largest and least ac-cessible nature reserves (Peres & Terborgh 1995). Noarea accessible on foot within 10 km of the nearest navi-gable river or perennial stream is safe from hunting, par-ticularly as firearms, ammunition, and outboard motorsbecome increasingly affordable. Moreover, even if thepolitical will were in place, enforcing restrictions ongame harvest is largely impractical because hunting is ahighly diffuse and undetectable form of resource extrac-tion practiced on a small scale by millions of Amazonians.
Finally, the pervasive changes in vertebrate commu-nity structure associated with game hunting are clearlybecoming more severe and widespread in Amazonia as(1) rapid rural population growth places heavier de-mands on game resources; (2) changes in land-use pat-terns degrade prime forest habitat, particularly for spe-
cies averse to second growth, small forest isolates, andforest edges (Robinson 1996); (3) changes in transportand weapon technology increase hunter mobility andgame mortality over larger catchment areas (e.g., Yost &Kelley 1983); (4) increased integration into the marketeconomy encourages sales of salted and smoked meatsurpluses, thus blurring the distinction between subsis-tence and commercial hunting (Hart 1978); and (5) tradi-tional practices break down, eliminating folklore, myths,and taboos that once served to protect forest wildlife.
Deleterious effects at the population or communitylevel that may result from persistent game hunting willtherefore be widespread and extremely difficult to con-trol. Protecting wildlife within strictly protected naturereserves thus emerges as one of the few available mech-anisms for preventing large vertebrate extirpation, atleast in Amazonia. Other measures designed to safeguardthe viability of sensitive game populations should rest on(1) the creation of game sanctuaries within indigenousand extractive reserves, which could serve as adjacent“source” areas for recolonization of overhunted “sinks,”and (2) compliance with sustainable hunting practicesthrough appropriate quota systems and hunting seasons,which could be enforced by either community-basedmanagers or outside inspectors. The short-term opportu-nity costs of deliberate restraint should be far out-weighed by the long-term benefits of a sustainable har-vest (e.g., Bodmer 1994). Although much of the technicalpracticalities of sound game management are yet to be re-fined for tropical forests, these strategies are our besthope for reversing the widespread depletion or deletionof a set of species that may have a disproportionate influ-ence on the overall forest dynamics and collectively mayrepresent truly undisturbed forests.
Acknowledgments
This study was funded by the World Wildlife Fund–U.S.(1987–1989), the Wildlife Conservation Society (1991–1995), and The Josephine Bay and Michael Paul Founda-tion (1996–1998). I am grateful to the Brazilian Oil Com-pany (Petrobrás) for providing critical logistical supportand helicopter transportation to several sampling sites. J.Pompilho, R. Nonato, L. Lopes, P. Honess, C. Toshiba, J.Pereira, E. Corrêa, P. Develey, and H. Nascimento pro-vided invaluable assistance during transect preparationand surveys. I thank J. Malcolm, J. Patton, M. N. F. daSilva, and C. Gascon for joining me in the Juruá Project. Iam grateful to the Brazilian Science and Research Coun-cil for providing a post-doctoral fellowship that madepart of the fieldwork possible. P. Judge prepared Fig. 1,and D. Nepstad, V. Passos, J. Robinson, K. Redford, andtwo anonymous reviewers provided constructive com-ments on the manuscript.
252 Game Extraction in Amazonian Forests Peres
Conservation BiologyVolume 14, No. 1, February 2000
Literature Cited
Alexandre, D.-Y. 1978. Le rôle disséminateur des éléphants en forêt deTaï, Côte d’Ivoire. La Terre et la Vie 32:47–71.
Anstey, S. 1991. Wildlife utilisation in Liberia. World Wide Fund for Na-ture and FDA Wildlife Survey, Gland, Switzerland.
Beckerman, S. 1994. Hunting and fishing in Amazonia: hold the an-swers, what are the questions? Pages 177–200 in A. Roosevelt, edi-tor. Amazonian Indians from prehistory to the present. Universityof Arizona Press, Tucson.
Bodmer, R. E. 1994. Managing wildlife with local communities: thecase of the Reserva Comunal Tamshiyacu-Tahuayo. Pages 113–134in D. Western and R. M. Wright, editors. Natural connections: per-spectives in community based conservation. Island Press, Washing-ton, D.C.
Bodmer, R. E. 1995a. Managing Amazonian wildlife: biological corre-lates of game choice by detribalized hunters. Ecological Applica-tions 5:872–877.
Bodmer, R. E. 1995b. Susceptibility of mammals to overhunting in Am-azonia. Pages 292–295 in J. Bissonnette and P. R. Krausman, edi-tors. Integrating people and wildlife for a sustainable future. TheWildlife Society, Bethesda, Maryland.
Bodmer, R. E., T. G. Fang, L. Moya, and R. Gill. 1994. Managing wildlifeto conserve Amazonian forests: population biology and economicconsiderations of game hunting. Biological Conservation 67:29–35.
Bryant, D., D. Nielsen, and L. Tangley. 1997. The last frontier forests:ecosystems and economies on the edge. World Resources Institute,Washington, D.C.
Buckland, S. T., D. R. Anderson, K. P. Burnham, and J. L. Laake. 1993.Distance sampling: estimating abundance of biological popula-tions. Chapman & Hall, London.
Burnham, K. P, D. R. Anderson, and J. L. Laake. 1980. Estimation ofdensity from line transect sampling of biological populations. Wild-life Monographs 72:1–202.
Calouro, A. M. 1995. Caça de subsistência: sustentabilidade e padrõesde uso entre seringueiros ribeirinhos e nãoribeirinhos Estado doAcre. M.S. thesis. Universidade de Brasília, Brasília, Brazil.
Chapman, C. A., and L. J. Chapman. 1995. Survival without dispersers:seedling recruitment under parents. Conservation Biology 9:675–678.
Clayton, L., M. Keeling, and E. J. Milner-Gulland. 1997. Bringing homethe bacon: a spatial model of wild pig hunting in Sulawesi, Indone-sia. Ecological Applications 7:642–652.
Dinerstein, E., D. M. Olson, D. Graham, A. L. Webster, S. A. Primm, M. P.Bookbinder, and G. Ledec. 1995. A conservation assessment of theterrestrial ecoregions of Latin America and the Caribbean. The WorldBank, Washington, D.C.
Dirzo, R., and A. Miranda. 1991. Altered patterns of herbivory and di-versity in the forest understory: a case study of the possible conse-quences of contemporary defaunation. Pages 273–287 in P. W.Price, P. W. Lewinsohn, G. W. Fernandes, and W. W. Benson, edi-tors. Plant-animal interactions: evolutionary ecology in tropical andtemperate regions. Wiley, New York.
Duivenvoorden, J. F., and J. M. Lips. 1995. A land-ecological study ofsoils, vegetation, and plant diversity in Colombia Amazonia. Tro-penbos Series 12:1–438.
Eisenberg, J. F., and R. W. Thorington Jr. 1973. A preliminary analysisof a Neotropical mammal fauna. Biotropica 5:150–161.
FitzGibbon, C. D., H. Mogaka, and J. H. Fanshawe. 1995. Subsistencehunting in Arabuko-Sokoke Forest, Kenya, and its effects on mam-mal populations. Conservation Biology 9:1116–1126.
Freese, C. H., P. G. Heltne, N. Castro, and G. Whitesides. 1982. Patternsand determinants of monkey densities in Peru and Bolivia with noteson distributions. International Journal of Primatology 3:53–90.
Fundação Instituto Brasileiro de Geografia e Estatística. 1986. Sistemade informações estatísticas e geográficas (SIEG). Rio de Janeiro.
Garine, I., and H. Pagezy. 1990. Seasonal hunger or “craving for meat.”Pages 43–47 in C. M. Hladik, S. Bahuchet, and I. de Garine, editors.Food and nutrition in the African rain forest. United Nations Educa-tional, Scientific, and Cultural Organization, Paris.
Glanz, W. E. 1991. Mammalian densities at protected versus huntedsites in central Panama. Pages 163–173 in J. G. Robinson, and K. H.Redford, editors. Neotropical wildlife use and conservation. Chi-cago University Press, Chicago.
Gross, D. R. 1975. Protein capture and cultural development in theAmazon Basin. American Anthropologist 77:526–549.
Hames, R. B. 1980. Game depletion and hunting zone rotation amongYe’kwans and Yanomamo of Amazonas, Venezuela. Working Pa-pers on South American Indians 2:31–66.
Hart, J. 1978. From subsistence to market: a case study of the Mbutinet hunters. Human Ecology 6:219–252.
Irion, G. 1978. Soil infertility in the Amazonian rain forest. Naturwis-senschaften 65:515–519.
Janson, C. H., and L. H. Emmons. 1990. Ecological structure of thenon-flying mammal community at the Cocha Cashu Biological Sta-tion, Manu National Park, Peru. Pages 314–338 in A. Gentry, editor.Four Neotropical rainforests. Yale University Press, New Haven.
Johansson, P. 1995. A bird in the pot or two in the bush? New Scientist2006:52.
Martins, E. 1992. A caça de subsistência de extrativistas na Amazônia:sustentabilidade, biodiversidade e extinção de espécies. M.S. the-sis. Universidade de Brasília, Brasília.
McRae, M. 1997. Road kill in Cameroon. Natural History 97(2):36–75.
Melnyk, M., and N. Bell. 1996. The direct-use values of tropical moistforest foods: the Huottuja (Piaroa) Amerindians of Venezuela. Am-bio 25:468–472.
Mena, P., J. R. Stallings, J. Regalado, and R. Cueva. 1999. The sustain-ability of current hunting practices by the Huaorani. Pages 57–78in J. G. Robinson and E. L. Bennett, editors. Hunting for sustainabil-ity in tropical forests. Columbia University Press, New York.
Muchagata, M. G. 1997. Forests and people: the role of forest produc-tion in frontier farming systems in eastern Amazonia. School of De-velopment Studies occasional papers. School of Development Stud-ies, University of East Anglia, Norwich, United Kingdom.
Peres, C. A. 1990. Effects of hunting on western Amazonian primatecommunities. Biological Conservation 54:47–59.
Peres, C. A. 1991. Humboldt’s woolly monkeys decimated by huntingin Amazonia. Oryx 25:89–95.
Peres, C. A. 1993. Biodiversity conservation by native Amazonians: apilot study in the Kaxinawá Indigenous Reserve of Rio Jordão,Acre, Brazil. Report. World Wildlife Fund–U.S., Washington, D.C.
Peres, C. A. 1996. Population status of white-lipped Tayassu pecariand collared peccaries T. tajacu in hunted and unhunted Amazo-nian forests. Biological Conservation 77:115–123.
Peres, C. A. 1997a. Primate community structure at twenty westernAmazonian flooded and unflooded forests. Journal of Tropical Ecol-ogy 13:381–406.
Peres, C. A. 1997b. Effects of habitat quality and hunting pressure on arbo-real folivore densities in Neotropical forests: a case study of howlermonkeys (Alouatta spp.). Folia Primatogica 68:199–222.
Peres, C. A. 1999a. Evaluating the sustainability of subsistence huntingat multiple Amazonian forest sites. Pages 31–56 in J. G. Robinsonand E. L. Bennett, editors. Hunting for sustainability in tropical for-ests. Columbia University Press, New York.
Peres, C. A. 1999b. Nonvolant mammal community structure in differ-ent Amazonian forest types. Pages 564–581 in J. F. Eisenberg andK. H. Redford, editors. Mammals of the Neotropics. Volume 3. Chi-cago University Press, Chicago.
Peres, C. A. 1999c. General guidelines for standardizing line-transectsurveys of tropical forest vertebrates. Neotropical Primates. Inpress.

Conservation BiologyVolume 14, No. 1, February 2000
Peres Game Extraction in Amazonian Forests 253
Peres, C. A., and J. W. Terborgh. 1995. Amazonian nature reserves: ananalysis of the defensibility status of existing conservation unitsand design criteria for the future. Conservation Biology 9:34–46.
Peres, C. A., and M. G. M. van Roosmalen. 1996. Avian dispersal of mi-metic seeds in Ormosia lignivalvis (Leguminosae: Papilionaceae):deceit or mutualism? Oikos 75:249–258.
Pierret, P. V., and M. J. Dourojeanni. 1966. La caza y la alimentacíon hu-mana en las riberas del Río Pachitea, Perú. Turrialba 16:271–277.
RADAM. 1973–1981. Projeto RadamBrasil: levantamento de recursosnaturais. Volumes 1–18. Departamento Nacional de Produção Min-eral, Ministério das Minas e Energia, Rio de Janeiro.
Redford, K. H. 1992. The empty forest. BioScience 42:412–422.Redford, K. H. 1993. Hunting in Neotropical forests: a subsidy from na-
ture. Pages 227–246 in C. M. Hladik, A. Hladik, O. F. Linares, H.Pagezy, A. Semple, and M. Hadley, editors. Tropical forests, peopleand foods: biocultural interactions and applications to development.United Nations Educational, Scientific and Cultural Organization,Paris.
Redford, K. H., and J. G. Robinson. 1987. The game of choice: patternsof Indian and colonist hunting in the Neotropics. American Anthro-pologist 89:650–667.
Robinson, J. G. 1996. Hunting wildlife in forest patches: an ephemeralresource. Pages 111–130 in J. Schelhas and R. Greenberg, editors.Forest patches in tropical landscapes. Island Press, Washington, D.C.
Robinson, J. G., and K. H. Redford. 1991. Sustainable harvest of Neo-tropical forest mammals. Pages 415–429 in J. G. Robinson and K.H. Redford, editors. Neotropical wildlife use and conservation. Chi-cago University Press, Chicago.
Robinson, J. G., and E. L. Bennett, editors. 1999. Hunting for sustain-ability in tropical forests. Columbia University Press, New York.
Roosevelt, A. C. 1989. Natural resource management before the con-
quest: beyond ethnographic projection. Advances in EconomicBotany 7:30–62.
Silva, J. L., and S. D. Strahl. 1991. Human impact on populations ofchachalacas, guans, and curassows (Galliformes: Cracidae) Pages37–52 in J. G. Robinson and K. H. Redford, editors. Neotropicalwildlife use and conservation. Chicago University Press, Chicago.
Skole, D., and C. Tucker. 1993. Tropical deforestation and habitat frag-mentation in the Amazon: satellite data from 1978 to 1988. Science260:1905–1910.
Terborgh, J. 1983. Five New World primates: a study in comparativeecology. Princeton University Press, Princeton, New Jersey.
Terborgh, J., and S. J. Wright. 1994. Effects of mammalian herbivores onplant recruitment in two neotropical forests. Ecology 75:1829–1833.
Terborgh, J., L. H. Emmons, and C. Freese. 1986. La fauna silvestre dela Amazonia: el despilfarro de un recurso renovable. Boletin deLima 46:77–85.
Terborgh, J., S. K. Robinson, T. A. Parker III, C. A. Munn, and N. Pier-point. 1990. Structure and organization of an Amazonian forestbird community. Ecological Monographs 6:213–238.
Thiollay, J. M. 1986. Structure comparée du peuplement avien dans troissites de forêt primaire en Guyane. Revue d’Ecologie 41:59–105.
Townsend, W. 1999. The sustainability of subsistence hunting by theSirionó Indians of Bolivia. Pages 267–281 in J. G. Robinson and E. L.Bennett, editors. Hunting for sustainability in tropical forests. Co-lumbia University Press, New York.
Vickers, W. T. 1988. The game depletion hypothesis of Amazonian ad-aptation: data from a native community. Science 239:1521–1522.
Yost, J. A., and P. M. Kelley. 1983. Shotguns, blowguns, and spears: theanalysis of technological efficiency. Pages 189–224 in R. B. Hamesand W. T. Vickers, editors. Adaptive responses of native Amazo-nians. Academic Press, London.