Effects of heat treatment atmosphere on the structure and ...
19
Effects of heat treatment atmosphere on the structure and activity of Pt 3 Sn nanoparticle electrocatalysts: a characterisation case study† Haoliang Huang, a Abu Bakr Ahmed Amine Nassr, ab Ver ´ onica Celorrio, cde S. F. Rebecca Taylor, f Vinod Kumar Puthiyapura, fg Christopher Hardacre, fg Dan J. L. Brett h and Andrea E. Russell * a Received 21st December 2017, Accepted 15th February 2018 DOI: 10.1039/c7fd00221a Comprehensive identification of the phases and atomic configurations of bimetallic nanoparticle catalysts are critical in understanding structure–property relationships in catalysis. However, control of the structure, whilst retaining the same composition, is challenging. Here, the same carbon supported Pt 3 Sn catalyst is annealed under air, Ar and H 2 resulting in variation of the extent of alloying of the two components. The atmosphere-induced extent of alloying is characterised using a variety of methods including TEM, XRD, XPS, XANES and EXAFS and is defined as the fraction of Sn present as Sn 0 (XPS and XANES) or the ratio of the calculated composition of the bimetallic particle to the nominal composition according to the stoichiometric ratio of the preparation (TEM, XRD and EXAFS). The values obtained depend on the structural method used, but the trend air < Ar < H 2 annealed samples is consistent. These results are then used to provide insights regarding the electrocatalytic activity of Pt 3 Sn catalysts for CO, methanol, ethanol and 1-butanol oxidation and the roles of alloyed Sn and SnO 2 . a Chemistry, University of Southampton, Higheld, Southampton SO17 1BJ, UK. E-mail: [email protected]. uk b Electronic Materials Research Department, Advanced Technology and New Materials Research Institute, City for Scientic Research and Technological Application (SRTA-City), New Borg Al-Arab City, Alexandria, 21934, Egypt c School of Chemistry, University of Bristol, Cantocks Close, Bristol, BS8 1TS, UK d UK Catalysis Hub, Research Complex at Harwell, RAL, Oxford, OX11 0FA, UK e Department of Chemistry, University College London, Kathleen Lonsdale Building, Gordon Street, London, WC1H 0AJ, UK f School of Chemical Engineering and Analytical Science, The University of Manchester, The Mill, Manchester, M13 9PL, UK g Centre for the Theory and Application of Catalysis (CenTACat), School of Chemistry and Chemical Engineering, Queen’s University of Belfast, Belfast, BT9 5AG, UK h Department of Chemical Engineering, University College London (UCL), London, WC1E 7JE, UK † Electronic supplementary information (ESI) available. See DOI: 10.1039/c7fd00221a This journal is © The Royal Society of Chemistry 2018 Faraday Discuss. , 2018, 208, 555–573 | 555 Faraday Discussions Cite this: Faraday Discuss. , 2018, 208, 555 PAPER Open Access Article. Published on 16 April 2018. Downloaded on 2/6/2022 3:12:16 PM. This article is licensed under a Creative Commons Attribution 3.0 Unported Licence. View Article Online View Journal | View Issue
Transcript of Effects of heat treatment atmosphere on the structure and ...

Faraday DiscussionsCite this: Faraday Discuss., 2018, 208, 555
PAPER
Ope
n A
cces
s A
rtic
le. P
ublis
hed
on 1
6 A
pril
2018
. Dow
nloa
ded
on 2
/6/2
022
3:12
:16
PM.
Thi
s ar
ticle
is li
cens
ed u
nder
a C
reat
ive
Com
mon
s A
ttrib
utio
n 3.
0 U
npor
ted
Lic
ence
.
View Article OnlineView Journal | View Issue
Effects of heat treatment atmosphere onthe structure and activity of Pt3Snnanoparticle electrocatalysts:a characterisation case study†
Haoliang Huang, a Abu Bakr Ahmed Amine Nassr, ab
Veronica Celorrio, cde S. F. Rebecca Taylor, f
Vinod Kumar Puthiyapura, fg Christopher Hardacre, fg
Dan J. L. Brett h and Andrea E. Russell *a
Received 21st December 2017, Accepted 15th February 2018
DOI: 10.1039/c7fd00221a
Comprehensive identification of the phases and atomic configurations of bimetallic
nanoparticle catalysts are critical in understanding structure–property relationships in
catalysis. However, control of the structure, whilst retaining the same composition, is
challenging. Here, the same carbon supported Pt3Sn catalyst is annealed under air, Ar
and H2 resulting in variation of the extent of alloying of the two components. The
atmosphere-induced extent of alloying is characterised using a variety of methods
including TEM, XRD, XPS, XANES and EXAFS and is defined as the fraction of Sn present
as Sn0 (XPS and XANES) or the ratio of the calculated composition of the bimetallic
particle to the nominal composition according to the stoichiometric ratio of the
preparation (TEM, XRD and EXAFS). The values obtained depend on the structural
method used, but the trend air < Ar < H2 annealed samples is consistent. These results
are then used to provide insights regarding the electrocatalytic activity of Pt3Sn catalysts
for CO, methanol, ethanol and 1-butanol oxidation and the roles of alloyed Sn and SnO2.
aChemistry, University of Southampton, Higheld, Southampton SO17 1BJ, UK. E-mail: [email protected].
ukbElectronic Materials Research Department, Advanced Technology and New Materials Research Institute, City
for Scientic Research and Technological Application (SRTA-City), New Borg Al-Arab City, Alexandria, 21934,
EgyptcSchool of Chemistry, University of Bristol, Cantocks Close, Bristol, BS8 1TS, UKdUK Catalysis Hub, Research Complex at Harwell, RAL, Oxford, OX11 0FA, UKeDepartment of Chemistry, University College London, Kathleen Lonsdale Building, Gordon Street, London,
WC1H 0AJ, UKfSchool of Chemical Engineering and Analytical Science, The University of Manchester, The Mill, Manchester,
M13 9PL, UKgCentre for the Theory and Application of Catalysis (CenTACat), School of Chemistry and Chemical
Engineering, Queen’s University of Belfast, Belfast, BT9 5AG, UKhDepartment of Chemical Engineering, University College London (UCL), London, WC1E 7JE, UK
† Electronic supplementary information (ESI) available. See DOI: 10.1039/c7fd00221a
This journal is © The Royal Society of Chemistry 2018 Faraday Discuss., 2018, 208, 555–573 | 555

Faraday Discussions PaperO
pen
Acc
ess
Art
icle
. Pub
lishe
d on
16
Apr
il 20
18. D
ownl
oade
d on
2/6
/202
2 3:
12:1
6 PM
. T
his
artic
le is
lice
nsed
und
er a
Cre
ativ
e C
omm
ons
Attr
ibut
ion
3.0
Unp
orte
d L
icen
ce.
View Article Online
Introduction
PtSn bimetallic nanoparticles (NPs) have attracted considerable attention inheterogeneous and electrocatalyst catalyst research, since the addition of Snspecies increases the selectivity of hydrogenation and dehydrogenation forcertain molecules1–3 and substantially lowers the activation energy for CO oxida-tion.4–6 The latter is key to more CO-tolerant catalysts for the anodes of reformatefuelled H2 PEM fuel cells and direct alcohol fuel cells. Fundamental studies haveshown that CO oxidation occurs at reduced overpotential at Sn and SnO2 (or itshydrated form) modied Pt7–10 and at Pt3Sn11–14 compared to Pt electrodes.Similarly, Sn modied Pt surfaces and Pt3Sn catalysts have also shown enhancedactivity over Pt for methanol,15–17 ethanol18–21 and butanol22 oxidation. In each casethe nature of the Sn species, SnO2 ormetallic Sn, and the extent of mixing of the Ptand Sn, alloy formation and the resulting Pt : Sn ratio at the surface, may playa role in determining the activities of the electrocatalysts. An understanding ofthese parameters is important in developing structure–property relationships.However, the simultaneous control of composition and structure is difficult forsuch nanoparticle bimetallic catalysts. One recent approach has been to takea parent PtxSn catalyst with a dened Pt : Sn ratio and then to subject this to heattreatment/annealing under various atmospheres, such as air, to induce surfaceoxidation or H2(g) to cause reduction.23–26
Structural characterisation of PtxSn catalysts seeks to determine the extent ofalloy formation, any variations in lattice parameters, and the extent of surfacesegregation of either of the components, and to identify the presence or absenceof a separate SnO2 phase. Various structural methods such as transmissionelectron microscopy (TEM), X-ray diffraction (XRD), X-ray photoelectron spec-troscopy (XPS) and X-ray absorption spectroscopy (XAS) may each be used, buteach will have its own limitations and will, therefore, provide a differentperspective.
An oen-noted limitation of XRD is that only the crystalline components areobserved. The SnO2 in PtSn bimetallic catalysts is sometimes found to be “XRDamorphous”. For example, Colmati et al.27 investigated a range of compositionsfor PtxSn alloy catalysts prepared via formic acid reduction and studied theirstructures via XRD. The formation of Pt–Sn alloys and extent of alloy formationwere suggested by using an expanded Pt lattice parameter, and no tin oxides werefound. Similarly, Lim et al.28 prepared PtxSn catalysts over a wider range of atomicratios using borohydride (a much stronger reductant than formic acid) reductionand subsequent hydrothermal treatment. These PtSn NPs exhibited expanded Ptlattice parameters similar to those measured by Colmati et al., implying a similarextent of alloy formation. However, a set of obvious diffraction peaks from SnO2
were also found by Lim et al. over the entire composition range explored. The“XRD amorphous” SnO2 implied from Colmati’s study is not a unique case in theliterature and can also be found in studies of Pt–SnO2 core–shell structures29 and,more commonly, for catalysts with a low Sn content.24,30,31
Kim et al.31 applied XRD, XPS, XANES and EXAFS to investigate the inuence ofSn content in carbon supported PtxSn catalysts. Like Colmati’s and Lim’s studiesabove, the expansion of the Pt lattice from XRD was found to be proportional tothe amount of Sn used in the preparation, indicating alloy formation. In contrast,
556 | Faraday Discuss., 2018, 208, 555–573 This journal is © The Royal Society of Chemistry 2018

Paper Faraday DiscussionsO
pen
Acc
ess
Art
icle
. Pub
lishe
d on
16
Apr
il 20
18. D
ownl
oade
d on
2/6
/202
2 3:
12:1
6 PM
. T
his
artic
le is
lice
nsed
und
er a
Cre
ativ
e C
omm
ons
Attr
ibut
ion
3.0
Unp
orte
d L
icen
ce.
View Article Online
only oxidised Sn was found in the XPS spectra, and the coordination number ofthe Pt–Sn scattering path from EXAFS tting did not vary systematically withcomposition. Such mismatches between techniques were also found in otherdetailed characterization studies,32,33 including our previous study,21 where wecalculated the alloying degree as the proportion of Sn present in the bimetallicparticles compared to the nominal composition of a Pt3Sn alloy NP (3–4 nm) to be�90% from the lattice parameters according to Vegard’s law,34,35 but XPS andXANES spectra indicated at least 50% of Sn atoms are oxidized.
In this work, the variation in heat treatment atmosphere approach describedabove is taken to provide a series of related PtSn catalysts with the same nominalcomposition of Pt3Sn, but with different surface compositions. A variety ofstructural characterisation methods were then employed to characterise theresulting nanoparticles and the results were compared. The alloy phase and SnO2
were preliminarily characterised via high-resolution transmission electronmicroscopy (HRTEM) and conventional XRD. XPS, XANES (X-ray absorption nearedge structure) and EXAFS (extended X-ray absorption ne structure) spectra thenwere used to acquire additional information regarding the oxidation state andatomic environment. The CO, methanol, ethanol and 1-butanol oxidation activ-ities of the catalysts were measured in H2SO4 solution. Activity enhancementsattributed to alloyed Sn and SnO2 were then discussed.
Experimental section
Pt3Sn nanoparticles were deposited on a carbon support to yield a loading of20 wt% metals via a conventional polyol method.36,37 Vulcan XC-72R carbon blackwas functionalized through reuxing in nitric acid.38 200 mg of the functionalizedcarbon black was dispersed into 50 mL of H2O/ethylene glycol (1 : 3 v/v) con-taining 200 mg of sodium hydroxide by 15 min of stirring and sonication. To thismixture, 110 mg of H2PtCl6$6H2O and 16 mg of SnCl2$2H2O were added, followedby stirring for 1 hour and then sonicating for 15 min. The suspension was heatedto 160 �C in an oil bath and maintained at this temperature for 2 hours. Themixture was then cooled down to room temperature and 50 mL of isopropanolwas added to precipitate nanoparticles. The catalyst was then collected by usinga centrifuge, washed with 50% ethanol aqueous solution and dried under vacuumat 80 �C. SEM-EDX (FEI XL30 ESEM equipped with an UltraDry detector) was usedto verify the composition, which was found to be Pt2.43Sn, which is close to thenominal ratio of Pt3Sn. The parent Pt3Sn/C catalyst was then divided into fourparts and three parts were treated by annealing at 250 �C under either air, Ar or H2
(5%, balanced with N2). The three treated samples are denoted as the air, Ar andH2 samples. Full structural characterisation for the parent Pt3Sn/C catalyst isprovided in the ESI.†
A 20 wt% Pt/C reference catalyst, supplied by JohnsonMatthey, with an averageparticle size of �2.8 nm (by TEM) was used for comparison.
Transmission electron microscopy (TEM) and high-resolution transmissionelectron microscopy (HRTEM) were performed on an FEI Tecnai 12 at 80 kV anda JEOL JEM 2010 at 200 kV (Bristol University), respectively. Power X-ray diffrac-tion (PXRD) patterns were acquired using a Bruker D2 PHASER diffractometerusing Cu Ka radiation (l ¼ 1.5418 A) at a voltage of 30 kV and a current of 10 mA.
This journal is © The Royal Society of Chemistry 2018 Faraday Discuss., 2018, 208, 555–573 | 557

Faraday Discussions PaperO
pen
Acc
ess
Art
icle
. Pub
lishe
d on
16
Apr
il 20
18. D
ownl
oade
d on
2/6
/202
2 3:
12:1
6 PM
. T
his
artic
le is
lice
nsed
und
er a
Cre
ativ
e C
omm
ons
Attr
ibut
ion
3.0
Unp
orte
d L
icen
ce.
View Article Online
X-ray photoelectron spectra (XPS) were acquired using a Kratos Axis UltraHybrid spectrometer (Queen’s University Belfast). XPS data deconvolution wasperformed using XPSPEAK 4.1. The background was corrected using the Shirleymethod39 and the percentage of Gaussian contribution in the peak shape wasxed in the range of 20–30%. XPS spectra were calibrated using the C 1s peakassociated with adventitious carbon at 284.8 eV. In the Pt 4f spectra, the spin–orbit spitting energy and the ratio of the peak area between Pt 4f7/2 and Pt 4f5/2 areconstrained to be 3.35 eV and 4 : 3, respectively. For the Sn 3d spectra, the spinorbit splitting energy and the ratio of the peak area between Sn 3d5/2 and Sn 3d3/2are constrained to be 8.4 eV and 3 : 2, respectively.
X-ray absorption (XAS) measurements were carried out using the B18 beamlineat Diamond Light Source (UK) using the Quick EXAFS mode. The samples for XASmeasurements were prepared by grinding and mixing with boron nitride to forma homogeneous mixture, and then being compressed into pellets. XAS spectra ofthese pellets were measured in transmission mode at both the Pt L3-edge and SnK-edges in air. Additional spectra were measured in an atmosphere of H2(g) atroom temperature for the H2 annealed sample. Pt or Sn foil was measured in thereference channel along with the samples to provide energy calibration. Themeasured XAS spectra were processed and analysed using the Demeter sowarepackage (ATHENA and ARTEMIS).40 The edge step of each spectrum wasnormalized by subtracting the linear pre-edge and quadratic post edge function,and the energy shi was calibrated by choosing the zero crossing in the secondderivative of all spectra to be E0 and then assigning the E0 of reference spectra tothe corresponding tabulated value provided by ATHENA. The background ofEXAFS was subtracted using the AUTOBK algorithm present in ATHENA. Atheoretical model of SnO2 was also used as a standard to guide the backgroundfunction through the XANES region at the Sn K-edge. Linear combination ttingat the Sn K-edge was also performed using ATHENA with SnO2 and Sn foil asstandards.
First-shell tting of the extended X-ray absorption ne structure (EXAFS) wasperformed in ARTEMIS. The Pt L3-edge and Sn K-edge spectra of each samplewere co-analysed with the half scattering path (R, referred as bond length fora single-scattering path) and mean square relative displacement (s2) of Pt–Sn andSn–Pt rst single scattering path (RPt–Sn ¼ RSn–Pt, sPt–Sn
2 ¼ sSn–Pt2) set to be equal
at both edges. Fits were carried out in an R-range of 1.1–3.3 A at the Pt L3-edge,and 1.1–3.1 A at the Sn K-edge. Values for amplitude reduction factor weredetermined to be 0.872 for Pt and 1.034 for Sn extracted from tting the Pt foil andSnO2 standards, respectively.
The electrochemical measurements were conducted in a standard three-electrode cell connected to a PGSTAT12 potentiostat (Metrohm Autolab). A Ptmesh electrode was used as the counter electrode, and a Hg|Hg2SO4 electrode(MMS) in 1 M H2SO4 was used as the reference electrode and equipped witha Luggin capillary. The potentials reported here are with respect to the reversiblehydrogen electrode (RHE) for convenience. The working electrode was preparedby drop casting 10 mL of catalyst ink on the surface of a glassy carbon electrode(5 mm diameter) and drying at room temperature. The catalyst ink was preparedby dispersing the sample powder, 2 mg cm�3, in a mixture of water, isopropylalcohol and Naon solution (5 wt%, Sigma Aldrich) with a volume ratio of8 : 2 : 0.01.
558 | Faraday Discuss., 2018, 208, 555–573 This journal is © The Royal Society of Chemistry 2018

Paper Faraday DiscussionsO
pen
Acc
ess
Art
icle
. Pub
lishe
d on
16
Apr
il 20
18. D
ownl
oade
d on
2/6
/202
2 3:
12:1
6 PM
. T
his
artic
le is
lice
nsed
und
er a
Cre
ativ
e C
omm
ons
Attr
ibut
ion
3.0
Unp
orte
d L
icen
ce.
View Article Online
All the electrochemical experiments were performed in O2-free (N2 purged)0.1 mol dm�3 H2SO4 solution at room temperature. The electrochemical activesurface area (ECSA) was measured using CO-stripping cyclic voltammetry. Beforethe measurement, 20 cycles between 0.05 and 0.8 V vs. RHE were performed.High-purity CO (99.9%) was then bubbled through the electrolyte for 20min whilethe potential was held at 0.2 V vs. RHE. N2 was then bubbled to remove the free COin the electrolyte. Aer that, the potential was swept to 1.0 V vs. RHE to oxidize theabsorbed CO and then cycled between 0.05 and 1.0 V vs. RHE to conrm thecomplete removal of COads. The electrochemical behaviour for alcohol oxidationwas evaluated using cyclic voltammetry in 0.1 mol dm�3 of the alcohol (methanol,ethanol, or 1-butanol) + 0.1 mol dm�3 H2SO4 electrolyte. The potential was cycledbetween 0.1 and 1 V vs. RHE for at least 20 cycles, and the peak currents for the10th cycle were used to compare the activities.
Results and discussion
The morphologies of the heat treated Pt3Sn catalysts were characterized usingTEM (Fig. 1). The images show good dispersion of the nanoparticles on thecarbon support, and that the diameters of the nanoparticles show some depen-dency on the annealing atmosphere: average particle diameters were �3 nm forthe sample annealed under air,�5 nm for Ar and�6 nm for H2. The approximatecompositions of these nanoparticles were then measured using the spacing oflattice fringes observed in HRTEM images (top inset of Fig. 1). The spacing wasinterpreted in Fourier-transformed space. The distance from the resulting brightspots to the centre, which is the reciprocal of the spacing, was measured andindexed to possible crystal facets with the help of centrosymmetric rings (bottominset of Fig. 1). Whilst the (111) plane and the (200) facet (for the air sample) offace-centric cubic (fcc) Pt or the Pt3Sn alloy are observed in all samples, the (110)facet of rutile SnO2 was only found for the Ar and air samples. Pt and the Pt3Snalloy have similar crystal structures, which cannot be distinguished from eachother in HRTEM images.
The powder XRD patterns for each of the treated catalysts are shown in Fig. 2.The Pt3Sn catalysts annealed under different atmospheres show features similarto the fcc structure of platinum, with strong diffraction peaks at�39�,�46�,�67�
and�80�, in agreement with lattice fringes observed in HRTEM images. The XRDpattern of the air annealed sample more closely matches that of Pt standard(JCPDS no. 04-0802) with additional peaks present at�29� and�34� attributed toSnO2. The latter peak is not present in the XRD pattern for the Ar and H2 annealedsamples. The peak positions for the H2 annealed sample more closely matchthose of the Pt3Sn standard (JCPDS no. 35-1360), with the positions of the peaksfor the Ar sample lying between those of the air and H2 annealed samples (inset ofFig. 2). The lattice parameters were calculated using the peak positions of the(220) plane and found to be 3.996 A for the H2 annealed sample, 3.971 A for the Arsample, and 3.951 A for the air sample.
Combining the results from HRTEM images and XRD patterns, the existenceof a SnO2 phase is still ambiguous and only clearly conrmed for the air annealedsample. The existence of SnO2 in the H2 and Ar annealed samples cannot beexcluded, as Sn is relatively dilute (�3 wt%) and amorphous SnO2 would not bedetected in the XRD pattern as previously noted in the introduction.
This journal is © The Royal Society of Chemistry 2018 Faraday Discuss., 2018, 208, 555–573 | 559

Fig. 1 TEM images of Pt3Sn nanoparticles annealed under (A) H2, (B) Ar and (C) air. Theupper insets are the corresponding HRTEM images and the bottom insets are the fast-Fourier transform patterns on the selected area (white dashed square) in the corre-sponding HRTEM images. The dashed rings are drawn to connect bright spots at the samedistance to the centre and represent the lattice fringes of the selected areas.
Faraday Discussions PaperO
pen
Acc
ess
Art
icle
. Pub
lishe
d on
16
Apr
il 20
18. D
ownl
oade
d on
2/6
/202
2 3:
12:1
6 PM
. T
his
artic
le is
lice
nsed
und
er a
Cre
ativ
e C
omm
ons
Attr
ibut
ion
3.0
Unp
orte
d L
icen
ce.
View Article Online
The presence of SnO2 and speciation of the Sn at the surface of the nano-particles was further investigated using X-ray photoelectron spectroscopy (XPS).The Sn 3d spectra (Fig. 3) show two peaks corresponding to Sn 3d3/2 and Sn 3d5/2states. These peaks are deconvoluted into two doublets of Sn0 (green) and SnIV
(blue) with some constraints (see experimental section), and a peak at the highenergy side of Sn 3d3/2 (red) related to the loss feature of metallic tin. Thedeconvoluted peaks clearly show that the Sn species present on the surface of the
560 | Faraday Discuss., 2018, 208, 555–573 This journal is © The Royal Society of Chemistry 2018

Fig. 2 XRD patterns of Pt3Sn nanoparticles annealed under H2, Ar and air. The inset showsthe magnified region of the (220) peak. The standard patterns of Pt3Sn (35-1360) and Pt(04-0802) were obtained from the JCPDS database.
Fig. 3 Sn 3d XPS spectra of samples synthesized under H2/N2, Ar or air. Peak deconvo-lution shown corresponding to Sn0 (green), SnIV (blue), and metallic Sn 3d3/2 (red).
Paper Faraday Discussions
This journal is © The Royal Society of Chemistry 2018 Faraday Discuss., 2018, 208, 555–573 | 561
Ope
n A
cces
s A
rtic
le. P
ublis
hed
on 1
6 A
pril
2018
. Dow
nloa
ded
on 2
/6/2
022
3:12
:16
PM.
Thi
s ar
ticle
is li
cens
ed u
nder
a C
reat
ive
Com
mon
s A
ttrib
utio
n 3.
0 U
npor
ted
Lic
ence
.View Article Online

Faraday Discussions PaperO
pen
Acc
ess
Art
icle
. Pub
lishe
d on
16
Apr
il 20
18. D
ownl
oade
d on
2/6
/202
2 3:
12:1
6 PM
. T
his
artic
le is
lice
nsed
und
er a
Cre
ativ
e C
omm
ons
Attr
ibut
ion
3.0
Unp
orte
d L
icen
ce.
View Article Online
nanoparticles are composed of SnIV and Sn0, with the ratio of the speciesdependent on the annealing conditions. The ratios of the peak areas for Sn0/SnIV
are summarised in Table 1. The large value, 11 : 1, for the H2 annealed sample islikely to be an overestimate of the Sn0 component as SnII was not included in thedeconvolution. The binding energies of SnII and SnIV are very similar and the 3dpeak does not discriminate between these two peaks adequately. However, thelarge ratio obtained does indicate that much less of the Sn is present as a separateSnO2 phase, in agreement with both the XRD and HRTEM results.
X-ray absorption near edge structure (XANES) spectra obtained at the Sn K-edge also provide speciation of the Sn, but on a per-atom basis. Fig. 4A showsthe Sn K-edge spectra of the heat treated samples compared to SnO2 and Sn foil asreferences. The K-edge represents the transition of Sn 1s electrons to unoccupied5p orbitals. The different electronic structures of Sn and SnO2 (Sn0: [Kr]5s25p2;Sn4+: [Kr]5s05p0) are evident as shis in the energy required to allow the K-edgetransition or edge position and a change in the intensity of the peak at theedge, which is related to the availability of suitable orbitals. The edge position,dened here as the maximum of the rst derivative of XANES spectra (inset ofFig. 4A), for the Ar and air samples is similar to that for SnO2. The derivative of theXANES spectra for the H2 sample shows a broadened maximum, with a shoulderat lower energy. This suggests that more Sn atoms are alloyed with Pt followingannealing in H2, in agreement with the Pt3Sn alloy phase detected by using XRD.The intensities of the peak at the edge for the heat treated samples approach thatof SnO2 and follow the order, air > Ar > H2.
The Sn0/SnIV atomic ratio can also be estimated by XANES linear combinationtting (LCF, Fig. 4B) using the Sn foil and SnO2 samples as the reference spectraand the results are shown in Table 1. Using Sn foil as the Sn0 reference spectrumwill provide an under estimate of the Sn0. The electronic structure of Sn in the foilis not the same as in the Pt3Sn alloy as electron transfer from Sn to Pt in the alloyincreases the d-band occupancy of Pt (Pt XANES data not shown) and also willdecrease the occupancy of the p-orbitals in Sn. To account for these effects,a second estimate was obtained using the XANES spectrum of the H2 treatedsample, collected in H2(g) to minimise the contributions of surface oxides, andthe results are also shown in Fig. 4C and Table 1. As the Sn K-edge EXAFS data(discussed further below) show the presence of oxygen neighbours, this ratio islikely to be an over estimate of the Sn0.
The EXAFS data at the Pt L3 and Sn K edges provide further characterisation ofthe average local coordination environments of each atom in the samples. The
Table 1 Atomic ratios of Sn0/SnIV determined by deconvolution of the XPS data (Fig. 3)and linear combination fitting of the Sn K-edge XANES spectra (Fig. 4B and C)
SamplesSn0/SnIV fromXPS
Sn0/SnIV from XANESusing Sn foil andSnO2 as references
Sn0/SnIV from XANESusing Pt3Sn
a andSnO2 as references
H2 11 0.54 1.4Ar 2.6 0.22 0.43Air 0.16 0.08 0.10
a The H2 treated sample collected under H2.
562 | Faraday Discuss., 2018, 208, 555–573 This journal is © The Royal Society of Chemistry 2018

Fig. 4 (A) XANES spectra and their first derivative (inset of A) of as-prepared samples andreferences on the Sn K-edge. (B and C) Linear combination fitting (LCF) of the peak. SnO2
and (B) Sn foil (red line) or (C) the Sn K-edge spectra of the H2 treated sample collectedunder H2 (cyan line) are used as references for the fittings. The goodness of fit (R-factors)for the fits with Sn foil and Pt3Sn are H2 treated 0.9% and 0.08%, Ar treated 0.1% and 0.2%,air treated 0.5% and 0.6%.
Paper Faraday DiscussionsO
pen
Acc
ess
Art
icle
. Pub
lishe
d on
16
Apr
il 20
18. D
ownl
oade
d on
2/6
/202
2 3:
12:1
6 PM
. T
his
artic
le is
lice
nsed
und
er a
Cre
ativ
e C
omm
ons
Attr
ibut
ion
3.0
Unp
orte
d L
icen
ce.
View Article Online
spectra and corresponding Fourier transforms are shown in Fig. 5 along with thecorresponding rst shell ts. The spectra were tted simultaneously at the SnK-edge and Pt L3-edge using input parameters from theoretical models (rutile tin
This journal is © The Royal Society of Chemistry 2018 Faraday Discuss., 2018, 208, 555–573 | 563
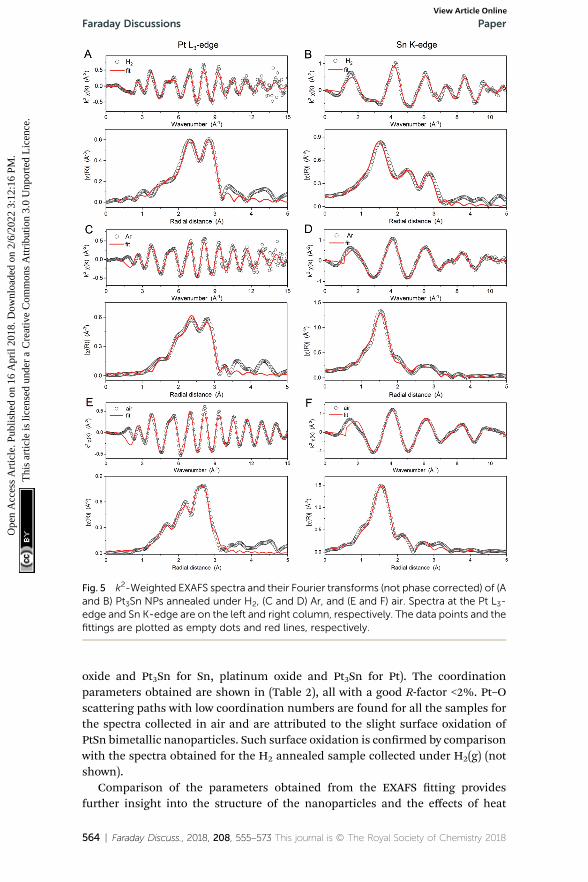
Fig. 5 k2-Weighted EXAFS spectra and their Fourier transforms (not phase corrected) of (Aand B) Pt3Sn NPs annealed under H2, (C and D) Ar, and (E and F) air. Spectra at the Pt L3-edge and Sn K-edge are on the left and right column, respectively. The data points and thefittings are plotted as empty dots and red lines, respectively.
Faraday Discussions PaperO
pen
Acc
ess
Art
icle
. Pub
lishe
d on
16
Apr
il 20
18. D
ownl
oade
d on
2/6
/202
2 3:
12:1
6 PM
. T
his
artic
le is
lice
nsed
und
er a
Cre
ativ
e C
omm
ons
Attr
ibut
ion
3.0
Unp
orte
d L
icen
ce.
View Article Online
oxide and Pt3Sn for Sn, platinum oxide and Pt3Sn for Pt). The coordinationparameters obtained are shown in (Table 2), all with a good R-factor <2%. Pt–Oscattering paths with low coordination numbers are found for all the samples forthe spectra collected in air and are attributed to the slight surface oxidation ofPtSn bimetallic nanoparticles. Such surface oxidation is conrmed by comparisonwith the spectra obtained for the H2 annealed sample collected under H2(g) (notshown).
Comparison of the parameters obtained from the EXAFS tting providesfurther insight into the structure of the nanoparticles and the effects of heat
564 | Faraday Discuss., 2018, 208, 555–573 This journal is © The Royal Society of Chemistry 2018

Table 2 EXAFS data fitting results of as-prepared samples and Pt foil. All spectra collectedas BN pellets in air unless otherwise indicateda
Samples Shell N R (A) s2 � 102 (A) JPt–Sn (%)R-factor(%)
Pt foil Pt–Pt 12.0 2.764(1) 0.50(1) N. A. 0.75H2 collected in H2(g) Pt–Pt 7.8(2) 2.779(2) 0.68(2) 60 0.56
Pt–Sn 2.0(2) 2.788(5) 1.07(9)Sn–O 1.2(3) 2.03(1) 0.6(4)Sn–Pt 8.1(8) 2.788(5) 1.07(9)
H2 Pt–O 0.4(4) 1.99(6) 0(1) 55 1.19Pt–Pt 8(2) 2.78(1) 0.9(2)Pt–Sn 1.7(7) 2.812(9) 1.0(1)Sn–O 3.0(3) 2.025(8) 0.7(2)Sn–Pt 6.9(9) 2.812(9) 1.0(1)
Ar Pt–O 0.3(3) 1.99(6) 0(1) 15 1.40Pt–Pt 8(2) 2.75(1) 0.9(2)Pt–Sn 0.4(6) 2.83(1) 0.7(2)Sn–O 4.5(3) 2.061(8) 0.6(1)Sn–Pt 2.6(7) 2.83(1) 0.7(2)
Air Pt–O 0.55(9) 1.974(9) 0.3(2) 9 1.11Pt–Pt 9.2(6) 2.739(4) 0.99(9)Pt–Sn 0.3(1) 2.856(8) 0.08(8)Sn–O 5.0(4) 2.06(1) 0.5(1)Sn–Pt 0.8(3) 2.856(8) 0.08(8)
a N, the coordination number for the absorber-backscatterer pair; R, the average absorber-backscatterer distance; s2, the mean square relative displacement.
Paper Faraday DiscussionsO
pen
Acc
ess
Art
icle
. Pub
lishe
d on
16
Apr
il 20
18. D
ownl
oade
d on
2/6
/202
2 3:
12:1
6 PM
. T
his
artic
le is
lice
nsed
und
er a
Cre
ativ
e C
omm
ons
Attr
ibut
ion
3.0
Unp
orte
d L
icen
ce.
View Article Online
treatment conditions. The coordination numbers NPt–Sn, NSn–Pt and NSn–O (wherethe rst element represents the edge and the second the neighbouring atom) andthe Pt–Pt bond length (RPt–Pt) are in agreement with the XANES analysis, NSn–O
decreases as the fraction of Sn present as SnO2 decreases in the order, air > Ar >H2. Additionally, NPt–Sn and NSn–Pt are largest for the H2 annealed sample, indi-cating greater mixing of the Pt and Sn in the nanoparticles. These results,consistent with XANES measurements, indicate that heat treatment under H2
promotes the formation of an alloy, but heat treatment under air leads to de-alloying and phase-segregation of SnO2. This conclusion is supported by exami-nation of RPt–Pt, as there is a slight increase from the air sample (2.74 A) to the Arsample (2.75 A), with the longest distance observed for the H2-treated sample(2.78 A). RPt–Pt is expected to increase from 2.77 A for metallic Pt (ICSD collectioncode 52250) to 2.83 A for Pt3Sn (ICSD collection code 105796). The shorterdistances observed for all the heat treated samples, compared to these tworeference points, are attributed to effects of the nanoparticle size of thecatalysts.41,42
The alloying degree may be quantied from the ts of the EXAFS data by usingthe alloying parameter (JPt–Sn) proposed by Hwang et al.,43
JPt�Sn ¼ Pobserved
Prandom
� 100%
where P ¼ NPt–Sn/(NPt–Sn + NPt–Pt), Pobserved are the results from EXAFS tting, andPrandom is the ratio expected for a perfectly alloyed Pt3Sn particle (ICSD collection
This journal is © The Royal Society of Chemistry 2018 Faraday Discuss., 2018, 208, 555–573 | 565

Faraday Discussions PaperO
pen
Acc
ess
Art
icle
. Pub
lishe
d on
16
Apr
il 20
18. D
ownl
oade
d on
2/6
/202
2 3:
12:1
6 PM
. T
his
artic
le is
lice
nsed
und
er a
Cre
ativ
e C
omm
ons
Attr
ibut
ion
3.0
Unp
orte
d L
icen
ce.
View Article Online
code 105796). Prandom is 1/3, as the NPt–Sn and NPt–Pt of Pt3Sn are 4 and 8,respectively. As shown in Table 2, the alloying degree of the as-prepared Pt3Snnanoparticles is 9% in the air samples and reaches a maximum of 55% in the H2-treated sample.
The extent of alloying was then also calculated from the perspective of each ofthe other various structural characterisation techniques described above. For theXPS and XANES data the extent of alloying is dened as the fraction of Sn presentas Sn0, whilst for the XRD and EXAFS data it is obtained using Vegard’s law toestimate the fractional composition of alloyed Sn (xalloyed Sn) rst,
xalloyed Sn ¼ 0:25lmeasured � lPt=C
lPt3Sn � lPt
where 0.25 is the fraction of Sn in Pt3Sn crystal, lPt3Sn and lPt are the latticeparameters of Pt3Sn standard (4.001 A) and Pt standard (3.9232 A) obtained fromJCPDS database, respectively, and lPt/C and lmeasured are the lattice parameters ofPt/C (JM) and samples measured using the (220) peak, respectively. Then, theextent of alloying is the ratio between xalloyed Sn and the atomic content of Sn inPtSn, 1/3.43, obtained from the EDX analysis, Pt2.43Sn. The ideal ratio would be1/4 for the Pt3Sn catalyst. The results of the various calculations are shown inTable 3. Whilst the trend in the extent of alloying is the same for all of themethods H2 > Ar > air annealed, the values differ signicantly, and this illustratesthat no one characterisation method yields a full picture of the structure of thecatalyst particles.
The effects of the extent of alloying on the electrocatalytic activities of theseries of heat treated Pt3Sn nanoparticles were then investigated taking theoxidation of a monolayer of CO, which is a known contaminant present in H2(g)produced by reforming hydrocarbons, and methanol, which is the simplestalcohol used as a fuel in direct alcohol fuel cells. The data are compared to thoseobtained for a 20 wt% Pt/C reference catalyst supplied by Johnson Matthey.
The CO oxidation voltammograms are shown in Fig. 6. Blocking of the Hads
sites and additional current associated with oxidation of the adsorbed COmonolayer are observed for all of the catalysts. One measure of the enhancedactivity of the bimetallic catalysts is the reduction in the onset potential for COoxidation. This is dened in the data shown as the crossing of the rst cycle (redline) with the second cycle (black line). As shown in Fig. 6, the onset potentials
Table 3 Extent of alloying calculated using the various structural characterisationmethods
Characterisationmethod H2 Ar Air
JPt–Sn from EXAFS 55% 15% 9%XPS 92% 72% 14%XANESa 35–59% 18–30% 7–9%XRD 68% 41% 19%EXAFS 79% 31% 12%
a Using the Sn foil (lower end of range) or Pt3Sn data (upper end of range) as one of thereference spectra.
566 | Faraday Discuss., 2018, 208, 555–573 This journal is © The Royal Society of Chemistry 2018
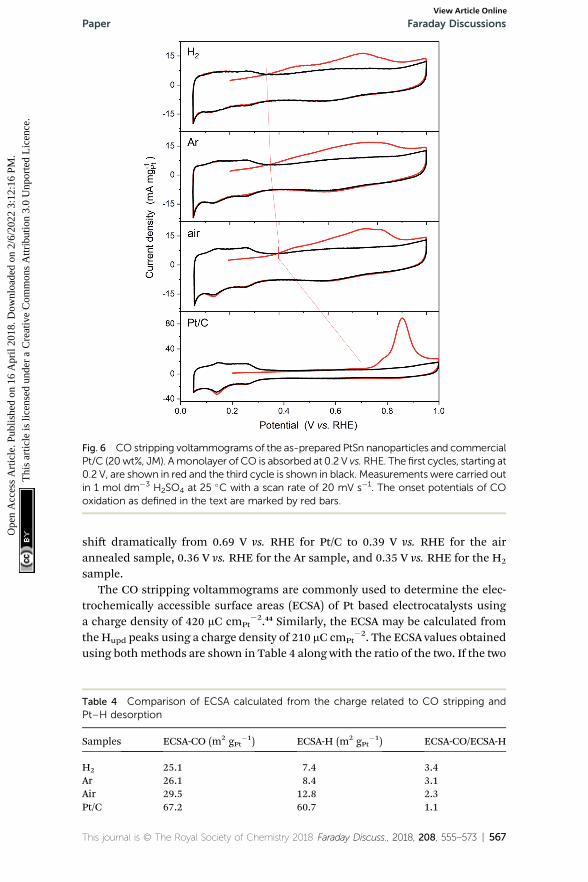
Fig. 6 CO stripping voltammograms of the as-prepared PtSn nanoparticles and commercialPt/C (20wt%, JM). Amonolayer of CO is absorbed at 0.2 V vs. RHE. The first cycles, starting at0.2 V, are shown in red and the third cycle is shown in black. Measurements were carried outin 1 mol dm�3 H2SO4 at 25 �C with a scan rate of 20 mV s�1. The onset potentials of COoxidation as defined in the text are marked by red bars.
Paper Faraday DiscussionsO
pen
Acc
ess
Art
icle
. Pub
lishe
d on
16
Apr
il 20
18. D
ownl
oade
d on
2/6
/202
2 3:
12:1
6 PM
. T
his
artic
le is
lice
nsed
und
er a
Cre
ativ
e C
omm
ons
Attr
ibut
ion
3.0
Unp
orte
d L
icen
ce.
View Article Online
shi dramatically from 0.69 V vs. RHE for Pt/C to 0.39 V vs. RHE for the airannealed sample, 0.36 V vs. RHE for the Ar sample, and 0.35 V vs. RHE for the H2
sample.The CO stripping voltammograms are commonly used to determine the elec-
trochemically accessible surface areas (ECSA) of Pt based electrocatalysts usinga charge density of 420 mC cmPt
�2.44 Similarly, the ECSA may be calculated fromthe Hupd peaks using a charge density of 210 mC cmPt
�2. The ECSA values obtainedusing bothmethods are shown in Table 4 along with the ratio of the two. If the two
Table 4 Comparison of ECSA calculated from the charge related to CO stripping andPt–H desorption
Samples ECSA-CO (m2 gPt�1) ECSA-H (m2 gPt
�1) ECSA-CO/ECSA-H
H2 25.1 7.4 3.4Ar 26.1 8.4 3.1Air 29.5 12.8 2.3Pt/C 67.2 60.7 1.1
This journal is © The Royal Society of Chemistry 2018 Faraday Discuss., 2018, 208, 555–573 | 567

Faraday Discussions PaperO
pen
Acc
ess
Art
icle
. Pub
lishe
d on
16
Apr
il 20
18. D
ownl
oade
d on
2/6
/202
2 3:
12:1
6 PM
. T
his
artic
le is
lice
nsed
und
er a
Cre
ativ
e C
omm
ons
Attr
ibut
ion
3.0
Unp
orte
d L
icen
ce.
View Article Online
methods are providing a measurement of the same surface area, the ratio of thetwo values should be 1 within the error of themeasurement, and indeed this is thecase for the Pt/C reference catalyst. Signicant deviations are observed, however,for all of the PtSn catalysts, and these increase with increasing the extent ofalloying, in agreement with H2(g) and CO(g) absorption on Sn surface-enrichedPt–Sn nanoparticles,45 the origins of which are two-fold. Firstly, as shown inFig. 6, formation of the alloy results in a decrease in the Hupd peaks, which wouldresult in an underestimate of the ECSA. This decrease may be attributed toblocking of the H adsorption sites by Sn at the surface of the nanoparticles. Rizoet al.9 have recently shown that each Sn atom adsorbed on the surface of Pt(111)single crystal electrodes blocks the H adsorption sites for three Pt atoms, sug-gesting that the Sn adsorbs in three-fold hollow sites on the Pt(111) surface inagreement with previous work.15 Secondly, CO may either adsorb on the Sn siteson the surface of the nanoparticles or not be blocked at the Pt sites by theformation of the alloy as found for H adsorption. DFT calculations by Zhenget al.46 strongly support the latter, as adsorbed CO was not found to be stable atany of the adsorption sites involving Sn atoms. The smaller ECSA-CO values ob-tained for all of the PtSn catalysts compared to the Pt/C reference catalyst areattributed to a combination of the larger average size of the nanoparticles and theproportional decrease in the Pt sites on the surface of the catalyst nanoparticleswith increased incorporation of Sn.
The broad CO oxidation peaks observed on all the Pt3Sn catalysts may becompared to the recent study by Rizo et al.,9 of Sn modied Pt(111) surfaces, whoreported two distinct CO stripping peaks, a pre-peak below 0.5 V vs. RHE anda larger main peak at approximately 0.7 V. They attributed the pre-peak to theoxidation of CO adsorbed on Pt with adjacent Sn sites at which water is activated,whilst that at higher potentials to the promotion of CO oxidation by OH adsorbedon Sn that are not in direct contact with Pt. Closer examination of the CVs in Fig. 6show a more distinct pre-peak between 0.4 and 0.5 V for the H2 annealed sample.As this sample has the greatest extent of alloying there should be a greaternumber of Sn sites at which water can be activated adjacent to Pt sites on thesurface of the nanoparticles.
Themethanol oxidation activity is similarly evaluated using cyclic voltammetryin 0.1Mmethanol with 0.1 M sulfuric acid as the electrolyte. The current densitieshave been normalised to the equivalent area of Pt using the ECSA-CO values inTable 4 in Fig. 7A and the mass of Pt in Fig. 7B, representing the specic and Ptmass activities of the catalysts, respectively. The cyclic voltammograms of the heattreated Pt3Sn NPs share the same features as Pt/C, with oxidation peaks appearingin both the forward sweep and the reverse sweep. Across the potential range ofthese peaks, the Pt3Sn NPs, particularly the H2 sample, show larger specicactivities (Fig. 7A) than that for Pt/C. The specic activity enhancement wouldappear to be even greater if the ECSA-H values had been used, but we suggest thatsuch a comparison is inappropriate, as H adsorption is unlikely to be a goodmodel of the methanol adsorption sites. In contrast, when the Pt mass activitiesare compared (Fig. 7B), only the H2 annealed sample shows enhanced activity.
The ethanol and butanol specic and mass activities of the Pt3Sn catalysts arealso shown in Fig. 7. The specic activities of all of the catalysts, assessed bycomparison of the maximum current density, for ethanol oxidation are approxi-mately half and those for 1-butanol oxidation are approximately one quarter of
568 | Faraday Discuss., 2018, 208, 555–573 This journal is © The Royal Society of Chemistry 2018

Fig. 7 Cyclic voltammograms illustrating the specific activities (A, C and E) and massactivities (B, D and E) of the heat treated Pt3Sn catalysts and the commercial Pt/C referencecatalyst in 0.1 mol dm�3 H2SO4 and 0.1 mol dm�3 (A and B) methanol, (C and D) ethanol,and (E and F) 1-butanol at 25 �C with a scan rate of 50 mV s�1.
Paper Faraday DiscussionsO
pen
Acc
ess
Art
icle
. Pub
lishe
d on
16
Apr
il 20
18. D
ownl
oade
d on
2/6
/202
2 3:
12:1
6 PM
. T
his
artic
le is
lice
nsed
und
er a
Cre
ativ
e C
omm
ons
Attr
ibut
ion
3.0
Unp
orte
d L
icen
ce.
View Article Online
those observed for methanol oxidation. Only the H2 annealed catalyst showsenhanced specic activity for ethanol and 1-butanol oxidation compared to thatfor the Pt/C reference catalyst. When the mass activities are compared, none ofthe Pt3Sn catalysts show enhanced current densities at the maximum.
The relative activities of the catalysts for oxidation of the three alcohols mayalso be assessed by comparison of the onset potential, which is the potential atwhich the current density starts to increase signicantly, with the more activecatalyst having the lowest onset potential. This is more difficult to dene for thealcohol oxidation CVs than for the case of CO shown above and should only beused to provide a ranking of catalyst activity. No improvement in onset potentialwith alloy formation is observed for methanol oxidation. A slight improvement, by
This journal is © The Royal Society of Chemistry 2018 Faraday Discuss., 2018, 208, 555–573 | 569

Faraday Discussions PaperO
pen
Acc
ess
Art
icle
. Pub
lishe
d on
16
Apr
il 20
18. D
ownl
oade
d on
2/6
/202
2 3:
12:1
6 PM
. T
his
artic
le is
lice
nsed
und
er a
Cre
ativ
e C
omm
ons
Attr
ibut
ion
3.0
Unp
orte
d L
icen
ce.
View Article Online
approximately �0.1 V, is seen for the air annealed catalyst for ethanol oxidation,and all of the Pt3Sn catalysts show a similar �0.1 V improvement for 1-butanoloxidation.
Enhancements of the activity of bimetallic Pt-based catalysts for CO oxidationhave long been attributed to a bifunctional effect in which OH adsorbed on Snprovides active O species which facilitate the oxidation of CO adsorbed on Ptsites.47 The role of this mechanism in the oxidation of small organic moleculeswas reviewed 30 years ago by Parsons and Van der Noot48 andmore recently for COand methanol oxidation on Pt–Sn catalysts by Antolini and Gonzalez.49 Thestructural characterisation data presented above indicates that a proportion ofthe Sn is present as SnO2, with SnO2 present as a separate phase for the airannealed catalyst. The adsorption of CO and alcohols requires available Pt siteson the surface of the catalyst nanoparticles, whilst the removal of CO and anypartial oxidation products of the alcohols requires nearby Sn sites.
For CO oxidation, the lowest onset potential was obtained for the H2 annealedsample, which has the greatest extent of alloying of the three. As discussed aboveand in agreement with Rizo et al.9 this result suggests that the onset of thereaction is determined by the availability of Sn atoms at which water is activated,i.e. those not present as a separate SnO2 phase, adjacent to Pt atoms on which COis adsorbed.
For methanol oxidation, no variation in the onset potential was observed,although the H2 annealed sample exhibited the largest specic activity. Thisresult is in agreement with those of Haner and Ross15 for methanol oxidation, whoshowed enhanced current density at Pt3Sn(111) compared to Pt(111), but no shiin the onset or peak potentials, and in contrast to the conclusions of the review byAntolini and Gonzalez, who found that the best methanol oxidation catalyst wasa mixture of Pt and SnO2, suggesting that the air annealed sample should havebeen best. The latter has been interpreted as the need to provide Pt sites formethanol adsorption, whilst minimising facilitating CO oxidation by the avail-ability of active Sn sites. Our results suggest that the active Sn sites need to beassociated with the Pt sites of the nanoparticles and are not easily accessible ifpresent as a separate SnO2 phase.
For ethanol oxidation, the air annealed catalyst exhibited the lowest onsetpotential, whilst the H2 annealed sample exhibits the largest specic activity.These results are in good agreement with the previously reported work by Jianget al.50 who show that the less well alloyed Pt3Sn catalyst is more active at lowcurrent densities or potentials and Godoi et al.24 who show that the oxidationcurrent increases with alloying. This suggests that, as in the case of methanol,a balance must be struck between availability of the adsorption site, dening theonset potential, and electronic or bifunctional effects that are important tosustain higher current densities.
Finally, for 1-butanol oxidation, all of the Pt3Sn catalysts exhibited similarlower onset potentials compared to the Pt/C reference catalyst, suggesting that theavailability of either adjacent Sn sites at which water activation takes place oradsorbed OH on non-adjacent Sn sites facilitates the oxidation. The observationthat only the H2 annealed Pt3Sn catalyst exhibits an increase in the specicactivity, suggests that the former is more important in determining 1-butanoloxidation activity.
570 | Faraday Discuss., 2018, 208, 555–573 This journal is © The Royal Society of Chemistry 2018

Paper Faraday DiscussionsO
pen
Acc
ess
Art
icle
. Pub
lishe
d on
16
Apr
il 20
18. D
ownl
oade
d on
2/6
/202
2 3:
12:1
6 PM
. T
his
artic
le is
lice
nsed
und
er a
Cre
ativ
e C
omm
ons
Attr
ibut
ion
3.0
Unp
orte
d L
icen
ce.
View Article Online
Conclusions
The annealing of carbon supported Pt3Sn nanoparticles under air, Ar and H2
atmospheres has provided a means of varying the extent of alloying withoutchanging the overall composition of the catalyst. The structures of the nano-particles were then characterised using TEM, XRD, XPS, XANES and EXAFS atboth the Pt L3 and Sn K edges. The extent of alloying was characterised using eachmethod and, as shown in Table 3, the values obtained are technique dependent.TEM and XRD are biased towards the more crystalline components of thesamples, XPS is biased towards the surface composition, and the XANES andEXAFS provide per-atom averages. However, the trend is the same for each of themethods with the extent of alloying increasing as air < Ar < H2 annealed, inagreement with previously published studies,23,24,50 although none of theseprevious studies provide as detailed characterisation as reported in this study.
The activity enhancements, compared to the activity of the 20 wt% Pt/Creference catalyst, observed for CO, methanol, ethanol and 1-butanol oxidationcan be understood in terms of the relative effects of active Sn atoms that are closeto (alloyed with) the Pt atoms on the surface of the catalyst nanoparticles andother Sn species such as SnO2. For CO oxidation, the lowest onset potential wasobserved for the H2 annealed catalyst, which is also the most well alloyed catalyst,with the smallest fraction of Sn present as SnO2, supporting the view that wateractivation at Sn sites provides the enhancement. For methanol oxidation, no shiin the onset potential was observed with variation in the extent of alloying, but theenhanced specic activity of the H2 annealed catalyst once again suggests that themechanism of enhancement is similar to that for CO oxidation. For ethanoloxidation, the onset potential was lowest for the air annealed catalyst, which hasmore Pt rich nanoparticles as more of the Sn is present as SnO2, but the largestspecic activity was obtained for the well-alloyed H2 annealed sample. Theseconicting results indicate that a balance must be struck between the availabilityof Pt sites (onset) and active Sn atoms to assist in more complete oxidation. Incontrast, for 1-butanol oxidation, the onset potentials of all the heat treated Pt3Sncatalysts were similar, with only the H2 annealed sample exhibiting any signi-cant increase in specic activity. This result suggests that, whilst both types of Snsites enhance activity, as observed for CO, methanol and ethanol, water activationat Sn atoms adjacent to the Pt atoms on the surface of the catalyst nanoparticles isthe dominant enhancement mechanism.
Conflicts of interest
There are no conicts to declare.
Acknowledgements
The UK Catalysis Hub is kindly thanked for resources and support provided viaour membership of the UK Catalysis Hub Consortium and funded by EPSRC(Portfolio Grants EP/K014706/2, EP/K014668/1, EP/K014854/1, EP/K014714/1, andEP/I019693/1). Open access data can be found via the University of Southamptonresearch portal. HH acknowledges Fellowship support from the China Scholar-ship Council (201608440295). TEM studies were carried out at the University of
This journal is © The Royal Society of Chemistry 2018 Faraday Discuss., 2018, 208, 555–573 | 571

Faraday Discussions PaperO
pen
Acc
ess
Art
icle
. Pub
lishe
d on
16
Apr
il 20
18. D
ownl
oade
d on
2/6
/202
2 3:
12:1
6 PM
. T
his
artic
le is
lice
nsed
und
er a
Cre
ativ
e C
omm
ons
Attr
ibut
ion
3.0
Unp
orte
d L
icen
ce.
View Article Online
Bristol Chemistry Imaging Facility with equipment funded by UoB and EPSRC(EP/K035746/1 and EP/M028216/1). XAS data were collected at Diamond on B18 aspart of the UK Catalysis Hub BAG allocation (SP10306). David Inwood (South-ampton) is thanked for assistance in tting the EXAFS data.
References
1 W. Yu, M. D. Porosoff and J. G. Chen, Chem. Rev., 2012, 112, 5780–5817.2 F. Humblot, J. P. Candy, F. Le Peltier, B. Didillon and J. M. Basset, J. Catal.,1998, 179, 459–468.
3 J. Shi, M. Zhang, W. Du, W. Ning and Z. Hou, Catal. Sci. Technol., 2015, 5, 3108–3112.
4 W. D. Michalak, J. M. Krier, S. Alayoglu, J.-Y. Shin, K. An, K. Komvopoulos,Z. Liu and G. A. Somorjai, J. Catal., 2014, 312, 17–25.
5 M. Vandichel, A. Moscu and H. Gronbeck, ACS Catal., 2017, 7, 7431–7441.6 C. Dupont, Y. Jugnet and D. Loffreda, J. Am. Chem. Soc., 2006, 128, 9129–9136.7 W.-P. Zhou, W. An, D. Su, R. Palomino, P. Liu, M. G. White and R. R. Adzic, J.Phys. Chem. Lett., 2012, 3, 3286–3290.
8 M. B. de Oliveira, L. P. R. Profeti and P. Olivi, Electrochem. Commun., 2005, 7,703–709.
9 R. Rizo, E. Pastor and M. T. M. Koper, J. Electroanal. Chem., 2017, 800, 32–38.10 B. E. Hayden, M. E. Rendall and O. South, J. Mol. Catal. A: Chem., 2005, 228, 55–
65.11 K. Wang, H. A. Gasteiger, N. M. Markovic and P. N. Ross, Electrochim. Acta,
1996, 41, 2587–2593.12 B. E. Hayden,M. E. Rendall and O. South, J. Am. Chem. Soc., 2003, 125, 7738–7742.13 V. R. Stamenkovic, M. Arenz, C. A. Lucas, M. E. Gallagher, P. N. Ross and
N. M. Markovic, J. Am. Chem. Soc., 2003, 125, 2736–2745.14 V. Stamenkovic, M. Arenz, B. B. Blizanac, K. J. J. Mayrhofer, P. N. Ross and
N. M. Markovic, Surf. Sci., 2005, 576, 145–157.15 A. N. Haner and P. N. Ross, J. Phys. Chem., 1991, 95, 3740–3746.16 G. Stalnionis, L. Tamasauskaite-Tamasiunaite, V. Pautieniene and Z. Jusys, J.
Solid State Electrochem., 2004, 8, 900–907.17 X. Lu, Z. Deng, C. Guo, W.Wang, S. Wei, S. P. Ng, X. Chen, N. Ding, W. Guo and
C. M. Wu, ACS Appl. Mater. Interfaces, 2016, 8, 12194–12204.18 H. Wang, Z. Jusys and R. J. Behm, J. Power Sources, 2006, 154, 351–359.19 T. Herranz, M. Ibanez, J. L. Gomez de la Fuente, F. J. Perez-Alonso, M. A. Pena,
A. Cabot and S. Rojas, ChemElectroChem, 2014, 1, 885–895.20 A. Velazquez-Palenzuela, F. Centellas, E. Brillas, J. A. Garrido, C. Arias,
R. M. Rodrıguez and P.-L. Cabot, Int. J. Hydrogen Energy, 2013, 38, 16418–16426.
21 L. Calvillo, L. Mendez De Leo, S. J. Thompson, S. W. T. Price, E. J. Calvo andA. E. Russell, J. Electroanal. Chem., 2018, 819, 136–144.
22 V. K. Puthiyapura, D. J. Brett, A. E. Russell, W. F. Lin and C. Hardacre, ACSAppl. Mater. Interfaces, 2016, 8, 12859–12870.
23 G. Wang, T. Takeguchi, T. Yamanaka, E. N. Muhamad, M. Mastuda andW. Ueda, Appl. Catal., B, 2010, 98, 86–93.
24 D. R. M. Godoi, J. Perez and H. M. Villullas, J. Power Sources, 2010, 195, 3394–3401.
572 | Faraday Discuss., 2018, 208, 555–573 This journal is © The Royal Society of Chemistry 2018
Paper Faraday DiscussionsO
pen
Acc
ess
Art
icle
. Pub
lishe
d on
16
Apr
il 20
18. D
ownl
oade
d on
2/6
/202
2 3:
12:1
6 PM
. T
his
artic
le is
lice
nsed
und
er a
Cre
ativ
e C
omm
ons
Attr
ibut
ion
3.0
Unp
orte
d L
icen
ce.
View Article Online
25 Y. Uemura, Y. Inada, K. K. Bando, T. Sasaki, N. Kamiuchi, K. Eguchi,A. Yagishita, M. Nomura, M. Tada and Y. Iwasawa, J. Phys. Chem. C, 2011,115, 5823–5833.
26 Y. Uemura, Y. Inada, K. K. Bando, T. Sasaki, N. Kamiuchi, K. Eguchi,A. Yagishita, M. Nomura, M. Tada and Y. Iwasawa, Phys. Chem. Chem. Phys.,2011, 13, 15833–15844.
27 F. Colmati, E. Antolini and E. R. Gonzalez, Electrochim. Acta, 2005, 50, 5496–5503.
28 D.-H. Lim, D.-H. Choi, W.-D. Lee and H.-I. Lee, Appl. Catal., B, 2009, 89, 484–493.
29 W. Du, G. Yang, E. Wong, N. A. Deskins, A. I. Frenkel, D. Su and X. Teng, J. Am.Chem. Soc., 2014, 136, 10862–10865.
30 D.-H. Kwak, Y.-W. Lee, S.-B. Han, E.-T. Hwang, H.-C. Park, M.-C. Kim andK.-W. Park, J. Power Sources, 2015, 275, 557–562.
31 J. H. Kim, S. M. Choi, S. H. Nam, M. H. Seo, S. H. Choi and W. B. Kim, Appl.Catal., B, 2008, 82, 89–102.
32 M. Zhu, G. Sun and Q. Xin, Electrochim. Acta, 2009, 54, 1511–1518.33 H. Zhu, D. H. Anjum, Q. Wang, E. Abou-Hamad, L. Emsley, H. Dong,
P. Laveille, L. Li, A. K. Samal and J.-M. Basset, J. Catal., 2014, 320, 52–62.34 L. Vegard, Z. Phys., 1921, 5, 17–26.35 L. Vegard, Z. fur Kristallogr.–Cryst. Mater., 1928, 67, 239–259.36 B. Liu, Z. W. Chia, Z. Y. Lee, C. H. Cheng, J. Y. Lee and Z. L. Liu, Fuel Cells, 2012,
12, 670–676.37 C. Bock, C. Paquet, M. Couillard, G. A. Botton and B. R. MacDougall, J. Am.
Chem. Soc., 2004, 126, 8028–8037.38 A. B. A. A. Nassr, I. Sinev, W. Grunert and M. Bron, Appl. Catal., B, 2013, 142–
143, 849–860.39 D. A. Shirley, Phys. Rev. B: Solid State, 1972, 5, 4709–4714.40 B. Ravel and M. Newville, J. Synchrotron Radiat., 2005, 12, 537–541.41 J. T. Miller, A. J. Kropf, Y. Zha, J. R. Regalbuto, L. Delannoy, C. Louis, E. Bus
and J. A. van Bokhoven, J. Catal., 2006, 240, 222–234.42 J. R. Gallagher, T. Li, H. Zhao, J. Liu, Y. Lei, X. Zhang, Y. Ren, J. W. Elam,
R. J. Meyer, R. E. Winans and J. T. Miller, Catal. Sci. Technol., 2014, 4, 3053–3063.
43 B. J. Hwang, L. S. Sarma, J. M. Chen, C. H. Chen, S. C. Shih, G. R. Wang,D. G. Liu, J. F. Lee and M. T. Tang, J. Am. Chem. Soc., 2005, 127, 11140–11145.
44 Q.-S. Chen, J. Solla-Gullon, S.-G. Sun and J. M. Feliu, Electrochim. Acta, 2010,55, 7982–7994.
45 T. Inoue, K. Tomishige and Y. Iwasawa, J. Chem. Soc., Faraday Trans., 1996, 92,461–467.
46 J. Zheng, M. Busch, L. Artiglia, T. Skala, J. Rossmeisl and S. Agnoli, J. Phys.Chem. C, 2016, 120, 25306–25316.
47 M. Watanabe, M. Shibata and S. Motoo, J. Electroanal. Chem. InterfacialElectrochem., 1985, 187, 161–174.
48 R. Parsons and T. Van der Noot, J. Electroanal. Chem., 1988, 257, 9–45.49 E. Antolini and E. R. Gonzalez, Electrochim. Acta, 2010, 56, 1–14.50 L. Jiang, Z. Zhou, W. Li, W. Zhou, S. Song, H. Li, G. Sun and Q. Xin, Energy
Fuels, 2004, 18, 866–871.
This journal is © The Royal Society of Chemistry 2018 Faraday Discuss., 2018, 208, 555–573 | 573