Effects of Deicers on Concrete Deteriorationiri/publications/SLR073.pdf1 EFFECTS OF DEICERS ON...
28
EFFECTS OF DEICERS ON CONCRETE DETERIORATION By David Darwin JoAnn Browning Lien Gong Sean R. Hughes A Report on Research Sponsored by the Structural Engineering and Materials Laboratory University of Kansas Structural Engineering and Materials Laboratory SL Report 07-3 December 2007 THE UNIVERSITY OF KANSAS CENTER FOR RESEARCH, INC. 2385 Irving Hill Road, Lawrence, Kansas 66045-7563
Transcript of Effects of Deicers on Concrete Deteriorationiri/publications/SLR073.pdf1 EFFECTS OF DEICERS ON...
EFFECTS OF DEICERS ON CONCRETE DETERIORATION
By
David Darwin JoAnn Browning
Lien Gong Sean R. Hughes
A Report on Research Sponsored by the Structural Engineering and Materials Laboratory
University of Kansas
Structural Engineering and Materials Laboratory SL Report 07-3 December 2007
THE UNIVERSITY OF KANSAS CENTER FOR RESEARCH, INC. 2385 Irving Hill Road, Lawrence, Kansas 66045-7563
1
EFFECTS OF DEICERS ON CONCRETE DETERIORATION
By
David Darwin JoAnn Browning
Lien Gong Sean R. Hughes
A Report on Research Sponsored by the
Structural Engineering and Materials Laboratory University of Kansas
Structural Engineering and Engineering Materials
SL Report 07-3
THE UNIVERSITY OF KANSAS CENTER FOR RESEARCH, INC.
LAWRENCE, KANSAS
December 2007

2
3
ABSTRACT
Concrete specimens were exposed to weekly cycles of wetting and drying in distilled
water and in solutions of sodium chloride, calcium chloride, magnesium chloride, and calcium
magnesium acetate with either a 6.04 molal ion concentration, equivalent in ion concentration to
a 15% solution of NaCl, or a 1.06 molal ion concentration, equivalent in ion concentration to a
3% solution of NaCl, for periods of up to 95 weeks. Specimens were also exposed to air only.
The effects of exposure were evaluated based on changes in the dynamic modulus of elasticity
and the physical appearance of the specimens at the conclusion of the tests.
Concretes exposed to distilled water and air show, respectively, an increase and a
decrease in dynamic modulus of elasticity, due principally to changes in moisture content;
overall, no negative impact on the concrete properties of these specimens is observed. At lower
concentrations, sodium chloride and calcium chloride have a relatively small negative impact on
the properties of concrete. At high concentrations, sodium chloride has a greater but still
relatively small negative effect. At low concentrations, magnesium chloride and calcium
magnesium acetate can cause measurable damage to concrete. At high concentrations, calcium
chloride, magnesium chloride, and calcium magnesium acetate cause significant changes in
concrete that result in loss of material and a reduction in stiffness and strength.
Key words: chlorides, concrete, deicing salts, calcium chloride, calcium magnesium acetate,
magnesium chloride, sodium chloride

4
INTRODUCTION
The application of deicing chemicals can result in the deterioration of concrete roads and
bridges by causing scaling when the concrete is subjected to cycles of freezing and thawing.
Deicing chemicals can also cause concrete to deteriorate as the result of physical and chemical
effects that occur whether or not the deicers cause significant scaling damage. Studies (Verbek
and Kleiger 1957, Marchand et al. 1999) have demonstrated that sodium chloride and calcium
chloride, the two principle deicing chemicals, cause maximum scaling under freeze-thaw
conditions at concentrations in water between 2 and 4% by weight, with NaCl having the greater
effect. Concentrations outside of this range, both lower and higher, have less effect on scaling. In
contrast, studies of concrete deterioration caused by cycles of wetting and drying show that
deterioration increases with an increasing concentration of the solution (Cody et al. 1996). The
latter observations have important implications because high concentration solutions are often
used for deicing and because the concentrated deicers will build up in concrete over time.
One drawback in studies of the effects of wetting and drying with deicers is that
comparisons are typically made using solutions that have either an equal weight of deicing
chemical or an equal molar concentration (equal number of molecules for a given volume of
solution) (Cody et al. 1996, Lee et al. 2000). The problem with this approach is that the ice
melting capability of a deicer is more closely related to the number of ions in a given quantity of
water than to either the weight or molar concentration. For example, at the same molar
concentration, CaCl2 will have 50% more ions in solution than NaCl. The test procedures used in
this study account for the number of ions produced when a deicer goes into solution.
A number of different test procedures have been used to evaluate the effects of wetting
and drying. These have included cycles at room temperature, cycles at elevated temperatures, as
2
high as 58°C (135°F), and wetting and drying cycles that include changes in temperature during
both the wet and dry cycles. Specimens are usually evaluated based on physical changes at the
macroscopic and microscopic level, as well as chemical changes that are observed using
petrographic analysis, scanning electron microscopy, and x-ray microanalysis.
Previous studies (Cody et al. 1996, Taylor 1997, Lee et al. 2000, Sutter et al. 2006) have
indicated that deicers can affect the chemistry of hardened cement paste. Chloride solutions tend
to cause the formation of calcium chloride hydrate and calcium oxychloride, while magnesium
chloride, in particular, results in the conversion of calcium silicate hydrate to non-cementitious
magnesium silicate hydrate. In mixtures of calcium and magnesium acetate (CMA), magnesium
acetate has been shown to cause the most severe damage, due to the formation of magnesium
silicate hydrate, with little negative effect demonstrated by calcium acetate (Lee et al. 2000).
The effects of CMA on concrete have been observed in on-going corrosion research at
the University of Kansas, with molal ion concentrations (based on the number of ions for a given
quantity of water) equivalent to a 15% sodium chloride solution causing severe damage, not only
to the concrete in corrosion specimens, but also to the adjacent concrete floor. CMA solutions
with molal ion concentrations equivalent to a 3% sodium chloride solution have resulted in much
less damage.
This report describes the results of a study in which the effects of four deicers, sodium
chloride, calcium chloride, magnesium chloride, and calcium magnesium acetate, on concrete are
compared using a technique that combines exposure procedures that were originally developed to
allow deicing chemicals to rapidly penetrate concrete corrosion specimens with techniques that
are used to evaluate the physical effects of cyclic freezing and thawing on concrete.
3
EXPERIMENTAL STUDY
Materials
In the study, the effects on concrete of cyclic wetting and drying with solutions
containing sodium chloride (NaCl), calcium chloride (CaCl2), magnesium chloride (MgCl2), and
calcium magnesium acetate (CMA) (4:6 molar ratio of calcium acetate to magnesium acetate)
are evaluated. The study also includes control specimens that are exposed to air or to distilled
water throughout the test period. Two concentrations are tested for each deicing chemical, a 6.04
molal ion concentration, equivalent in ion concentration to a 15% solution of NaCl, and a 1.06
molal ion concentration, equivalent to a 3% solution of NaCl. The compositions of the solutions
are shown in Table 1.
Table 1 Deicer solutions
6.04 molal ion concentration solutions NaCl 850g water*, 150g NaCl (100% solids) MgCl2 612.5g water, 579.2g MgCl2 (33.1% solution) CaCl2 1000g water, 223.5g CaCl2 (92.36% Solids) CMA 1000g water, 309.3g CMA (96% solids)
1.06 molal ion concentration solutions NaCl 970g water, 30g NaCl (100% solids) MgCl2 932.1g water, 101.5g MgCl2 (33.1% solution) CaCl2 1000g water, 42.4g CaCl2 (92.36% solids) CMA 1000g water, 54g CMA (96% solids) * distilled water used for all solutions
The concrete mixture used in the study contained Type I/II portland cement and had a
water cement ratio of 0.45 and an air content of 6 percent. Mix proportions and aggregate
properties are shown in Table 2.
Prismatic test specimens [3 in.2 × 12 in. (76 mm2 ×305 mm)] are used. The concrete is
mixed and the specimens fabricated in accordance with ASTM C 192. Specimens are cast
horizontally in two layers with each layer consolidated for 30 seconds on a vibrating table with

4
Table 2 Concrete mixture proportions (SSD basis)
Cement
Water
Fine Aggregate
Coarse Aggregate
Vinsol Resin
lb/yd3 (kg/m3) lb/yd3 (kg/m3) lb/yd3 (kg/m3) lb/yd3 (kg/m3) gal/yd3 (mL/m3) 598 (355) 270 (160) 1436 (852) 1473 (874) 0.024 (90)
Concrete Properties: w/c = 0.45, 6 ± 1% entrained air, and 3 ± 0.5 in. (76 ± 13 mm) slump Cement: Type I/II portland cement Fine Aggregate: Kansas River sand with bulk specific gravity (SSD) = 2.62, absorption = 0.78%, fineness modulus = 2.51 Coarse Aggregate: Crushed limestone from Fogle Quarry with ¾ in. (19 mm) nominal maximum size, bulk specific gravity (SSD) = 2.58, absorption = 2.27 %, and unit weight of 95.9 lb/ft3 (1536 kg/m3) Air-entraining Agent: Daravair 1400, from W. R. Grace, Inc.
an amplitude of 0.006 in. (0.15 mm) and a frequency of 60 Hz. The upper surface of the
specimens is finished using a wooden float.
After casting, the specimens are covered with plastic, cured for 24 hours at room
temperature, and then removed from the molds and cured in lime-saturated water at 73 ± 3°F (23
± 1.7°C) for six days. After six days, the specimens are removed from the curing tank and
allowed to dry at a temperature of 73 ± 3°F (23 ± 1.7°C) and a relative humidity of 50% ± 4%
for 48 days.
The control specimens were cast separately from those exposed to deicers. For the
specimens exposed to air, specimens 1 through 4 were cast in one batch and specimens 5 and 6
in another. For the specimens exposed to distilled water, specimens 1 and 2 were cast in one
batch and specimens 3 through 6 in another. To limit variations in performance that might occur
due to differences in concrete properties, the specimens exposed to deicers were cast in groups of
four, eight, or 16 specimens, with equal numbers of specimens from each batch exposed to one
of the four deicers. For the 6.04 molal ion deicer concentrations, specimens 1 and 2 were cast in
batches of four, while specimens 3 through 16 were cast in a single batch of 16. For the 1.06
molal ion deicer concentrations, specimens 1 and 2, 3 and 4, and 5 and 6 were cast in batches of
eight.
5
Test Procedure
The test procedure involves wet/dry exposure similar to that used for Southern Exposure
corrosion test specimens (McDonald et al., 1998, Darwin et al. 2007a, 2007b), while the effect of
the cycles is evaluated by measuring changes in the dynamic modulus of elasticity in accordance
to the ASTM C 215, as used for freeze-thaw specimens in ASTM C 666.
Six specimens are used for each of the solutions shown in Table 1, along with six
specimens each in air and distilled water. The specimens are submerged in the solutions (or
distilled water) for four days at a temperature of 73 ± 4°F (23 ± 2°C). After four days, they are
removed from the solution and dried in air at a temperature of 100 ± 3°F (38 ± 1.7°C) for three
days under a portable heating tent. The deicer solutions and distilled water are replaced every
five weeks. Specimens exposed to air are subjected to the temperature cycles. Cycles are
repeated for up to a maximum of 95 weeks. Based on chloride concentrations obtained at a depth
of 1 in. (25 mm) in the corrosion specimens (Ji et al. 2005, Darwin et al. 2007b) and on bridge
decks (Lindquist et al. 2006), exposure to cyclic wetting and drying using this regimen simulates
10 years of exposure for bridge decks within the first 30 weeks and 30 years within the 95-week
maximum duration of the test.
The fundamental transverse resonance frequency of each specimen is measured at the
initiation of the tests and every five weeks thereafter (after the three-day drying period) using the
procedures described in ASTM C 215. The dynamic modulus of elasticity (Dynamic E) can be
calculated based on the fundamental transverse frequency, the mass, and dimensions of the test
specimens [Equation (1) is taken directly from ASTM C 215]:
Dynamic E = CMn2 (1)
where:
6
M = mass of specimen, kg
n = fundamental transverse frequency, Hz
C = 0.9464(L3T/bt3), N•s2 (kg•m2)
L = length of specimen, m
t, b = dimensions of cross section of prism, m, t being the direction in which it is driven
T = a correction factor which depends on the ratio of the radius of gyration, K (= t/3.464),
to the length of the specimen, L, and on Poisson’s ratio. Values of T for Poisson’s ratio of 1/6
may be obtained from Table 1 in ASTM C 215.
The masses M of specimens 3 through 6 exposed to the 6.04 molal ion deicer
concentrations were not measured. For the calculation in Eq. (1), M for these specimens is
replaced by a value calculated using the dimensions of the specimens and the average density of
the 24 specimens subjected to the 1.06 molal ion deicer concentrations.
A total of 60 specimens were subjected to cycles of wetting and drying, temperature
change, or both. As noted above, these included six specimens subjected to the same temperature
history as the others while remaining in air throughout the test period. Changes in concrete
properties are evaluated based on the ratio of the dynamic modulus of elasticity at the given
number of cycles to the dynamic modulus of elasticity at the initiation of the wet/dry cycles. This
ratio is referred to as the relative dynamic modulus of elasticity (wet-dry), or Pw/d, to distinguish
it from the value of P obtained using ASTM C 666 for specimens subjected to cycles of freezing
and thawing. Wet/dry cycles continue for a total of 95 weeks or until the Pw/d drops below 0.9, at
which point the tests are terminated.
7
TEST RESULTS
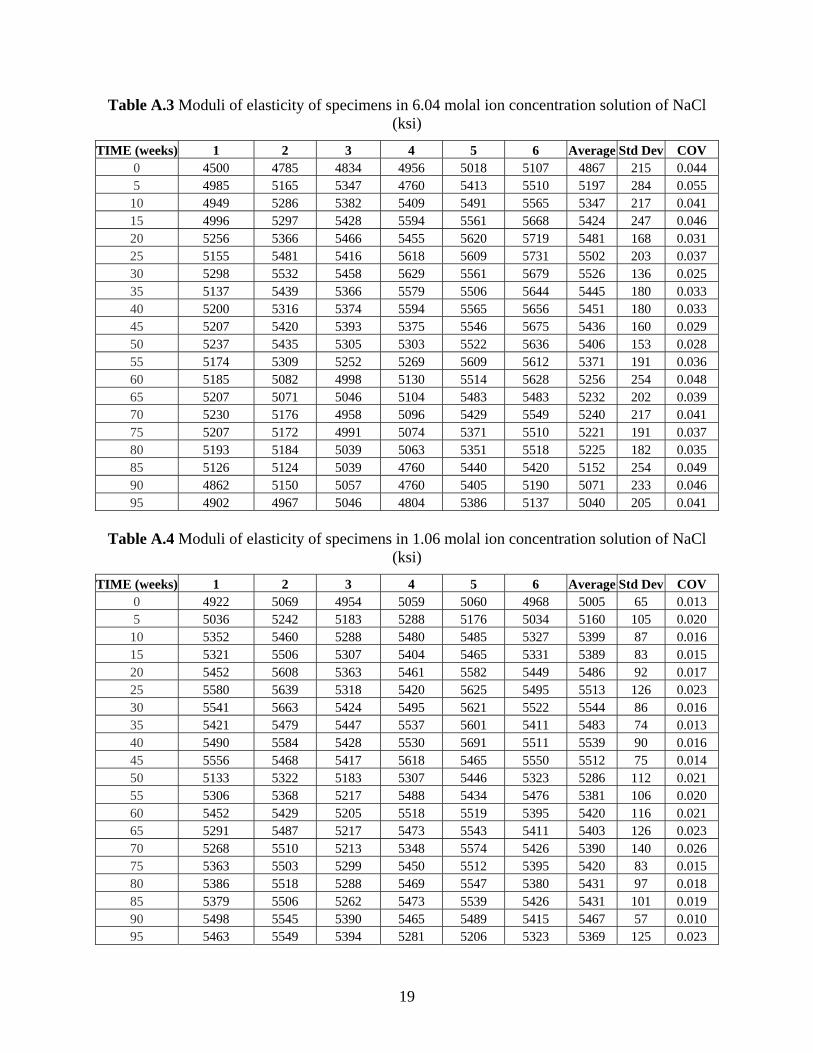
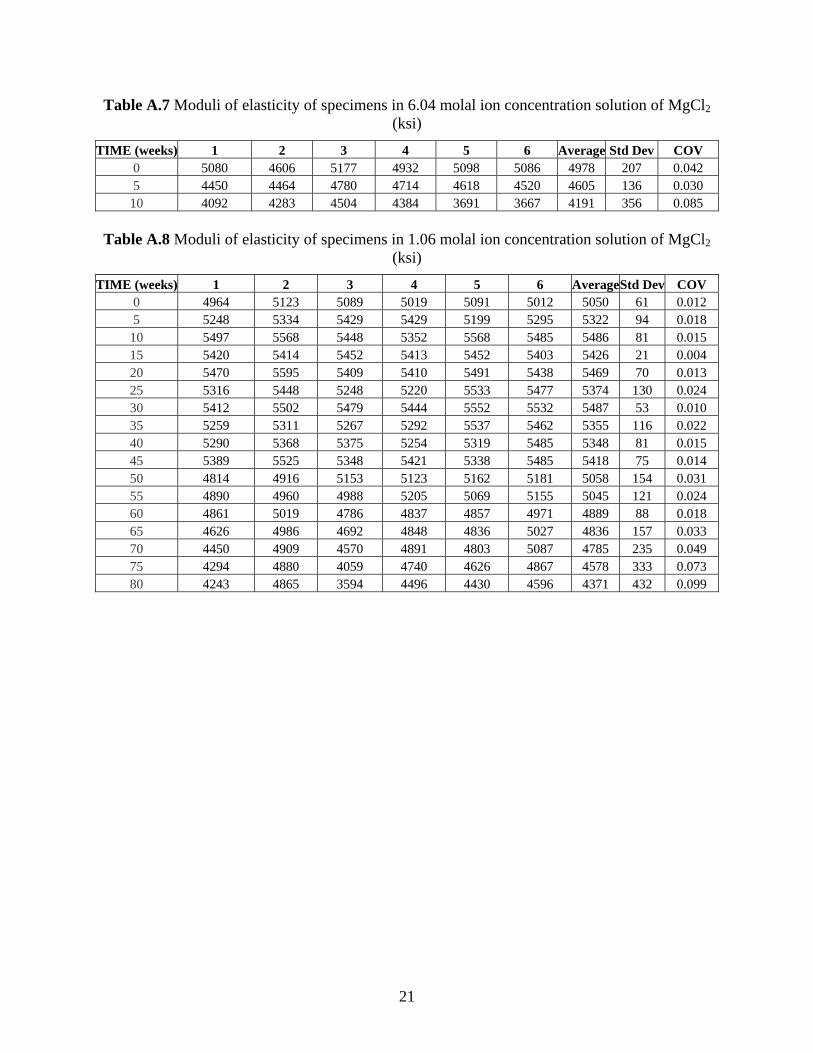
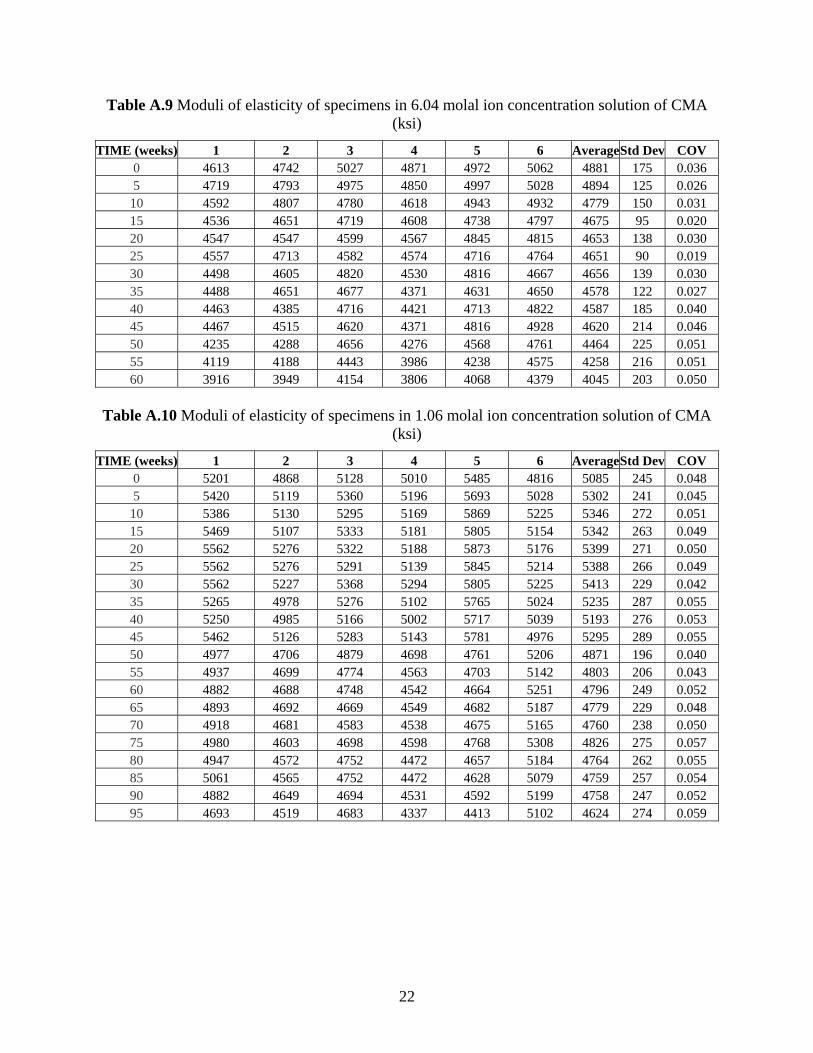
The moduli of elasticity of the specimens are tabulated in Appendix A (Tables A.1
through A.10). The tables include the individual values, along with the average, standard
deviation, and coefficient of variation for specimens of each type at five week intervals. The
average values are used to calculate Pw/d. The consistency of the procedure is supported by the
low coefficients of variation, which are generally at or below 4% except for specimens
undergoing significant damage. The latter specimens exhibit coefficients of variation between
7.5 and 10% for values of Pw/d below 0.9. The average relative dynamic moduli of elasticity
(wet-dry) are presented in Fig. 1 and 2, which show the values of Pw/d for specimens exposed to
6.04 and 1.06 molal ion concentration deicer solutions, respectively. The figures also include the
results for specimens subjected to wet/dry temperature cycles in distilled water and temperature
cycles in air.
Control Specimens
The specimens subjected to wet/dry cycles with distilled water exhibited an increase in
the Pw/d from 1.0 at the beginning of the test to approximately 1.1 at week 5, increased to 1.2 at
week 35, and then remained approximately constant through week 95. The increase in the
dynamic modulus of elasticity may be attributed in part to an increase in the degree of hydration
but most likely resulted from the absorption of water. The specimens subjected to the
temperature variations, but otherwise stored in air, exhibited a small but consistent drop in the
dynamic modulus of elasticity throughout the test due to the loss in water (with accompanying
microcracking), reaching a Pw/d of 0.95 at 95 weeks.
8
0.8
0.9
1.0
1.1
1.2
1.3
0 20 40 60 80 100
Weeks
Rel
ativ
e D
ynam
ic M
odul
us
Distilled water Air CaCl2MgCl2 NaCl CMA
0.8
0.9
1.0
1.1
1.2
1.3
0 20 40 60 80 100
Weeks
Rel
ativ
e D
ynam
ic M
odul
us
Distilled water Air CaCl2MgCl2 NaCl CMA
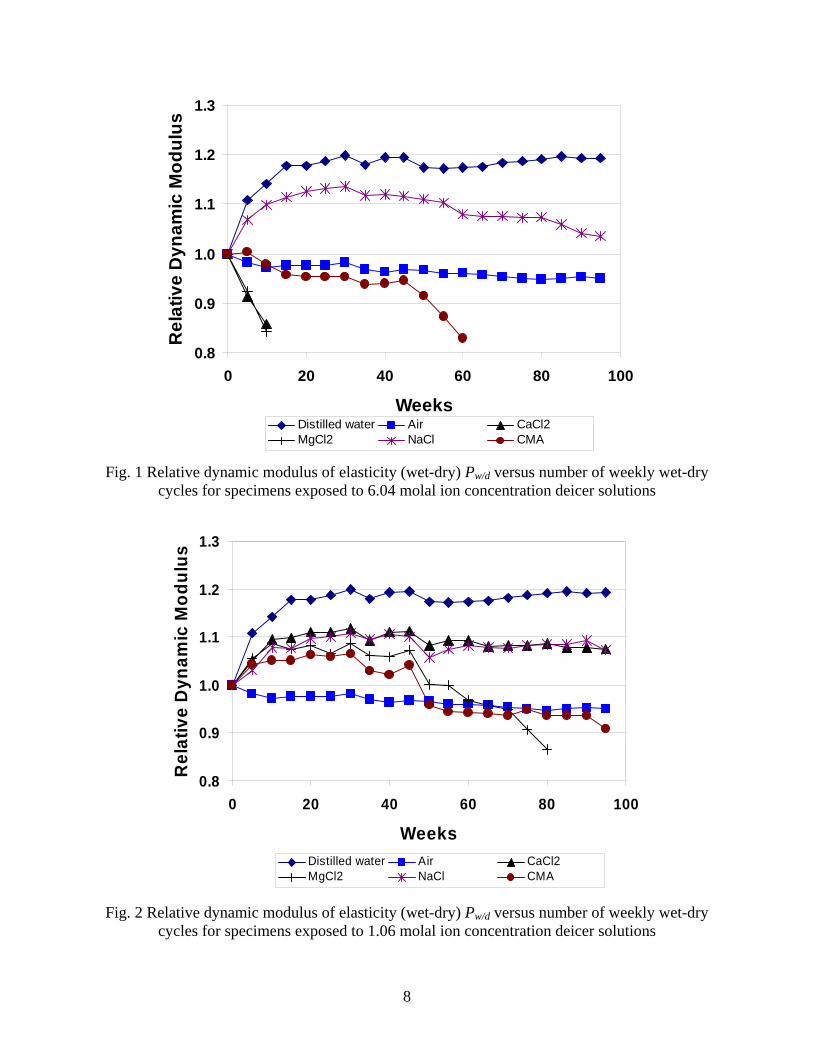
Fig. 1 Relative dynamic modulus of elasticity (wet-dry) Pw/d versus number of weekly wet-dry cycles for specimens exposed to 6.04 molal ion concentration deicer solutions
Fig. 2 Relative dynamic modulus of elasticity (wet-dry) Pw/d versus number of weekly wet-dry cycles for specimens exposed to 1.06 molal ion concentration deicer solutions
9
High Concentration of Deicers
As shown in Fig. 1, the specimens exposed to the high concentrations of calcium chloride
(CaCl2) and magnesium chloride (MgCl2) deteriorated rapidly, with the Pw/d dropping below 0.9
by week 10. The specimens exposed to calcium magnesium acetate (CMA) deteriorated more
slowly, with the Pw/d dropping below 0.9 by week 55; in this case, the wet/dry cycles were
continued for another five weeks. The concrete subjected to the high concentration NaCl solution
exhibited a rise in the Pw/d through week 30, to 1.14, likely due to the absorption of water and
perhaps the formation of salt crystals, which filled some of the pore space within the cement
paste, followed by a gradual drop to a value of 1.04 at week 95, indicating damage, also likely
due to salt crystal formation (see Visual Evaluation).
Low Concentration of Deicers
As shown in Fig. 2, the use of lower concentrations of deicers reduced the negative
effects of all four deicers compared to that obtained at the high concentration, in some cases
significantly. During the early weeks of the tests, all specimens submerged in the lower
concentration deicer solutions exhibited an increase Pw/d, as described for the specimens exposed
to distilled water. The specimens exposed to CaCl2 and NaCl exhibited the greatest increase,
with peak values of Pw/d of 1.11. After week 45, Pw/d for these specimens began to drop very
slowly, indicating some damage, reaching a value of 1.07 at week 95. Pw/d of 1.07 is higher than
that observed for the higher concentration solutions (0.86 at week 10 for CaCl2 and 1.04 at week
95 for NaCl). The peak value of Pw/d for the high concentration NaCl specimens (1.14) was
slightly higher than the value observed at the lower concentration (1.11). The difference may be
due to the effects of increased crystallization within the pores for the specimens exposed to the
higher concentration solution.
10
Pw/d for specimens exposed to CMA and MgCl2 reached values as high as 1.07 and 1.09,
respectively, remaining nearly constant through week 45 and then dropping thereafter. Pw/d for
the CMA specimens dropped below 1.0 at week 50, reaching a value of 0.91 at week 95. The
MgCl2 specimens, which initially exhibited a slightly higher value of Pw/d than the CMA
specimens and maintained Pw/d above 1.0 until week 55, exhibited a more rapid drop in dynamic
modulus after week 70, reaching a value of Pw/d below 0.9 by week 80.
Visual Evaluation
The specimens were evaluated for physical damage and photographs were taken at the
conclusion of the tests. The appearance of the specimens is largely in agreement with the
performance represented in Fig. 1 and 2.
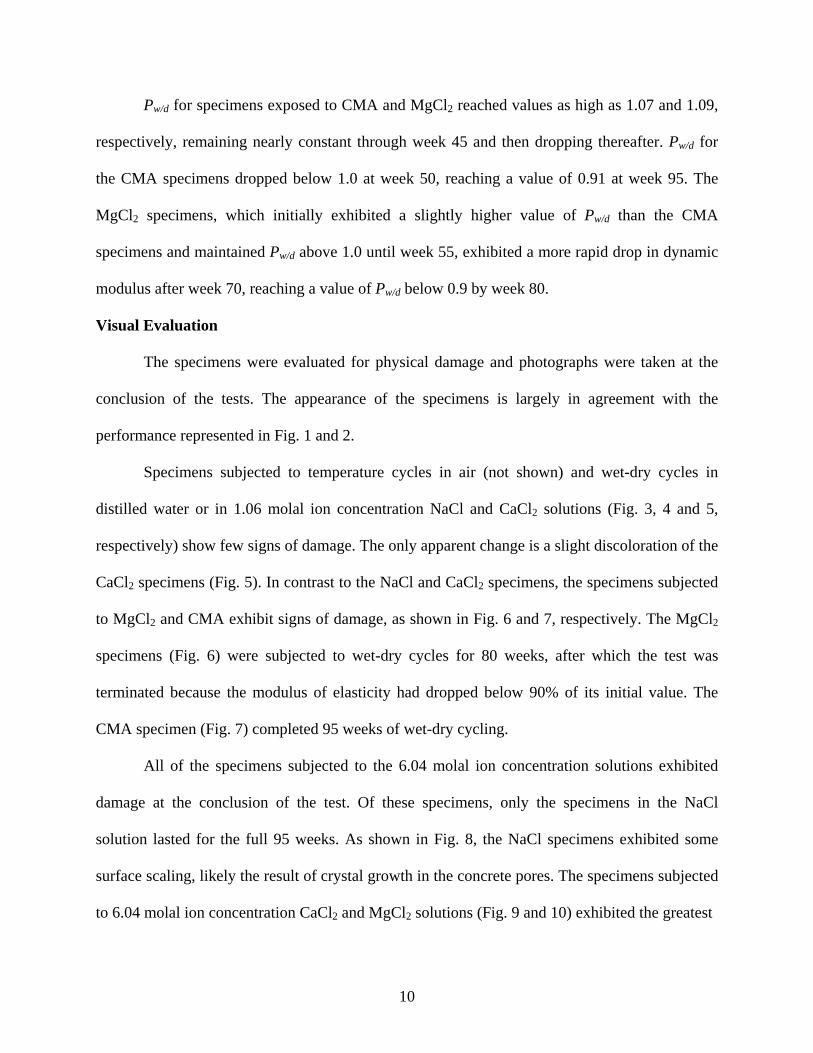
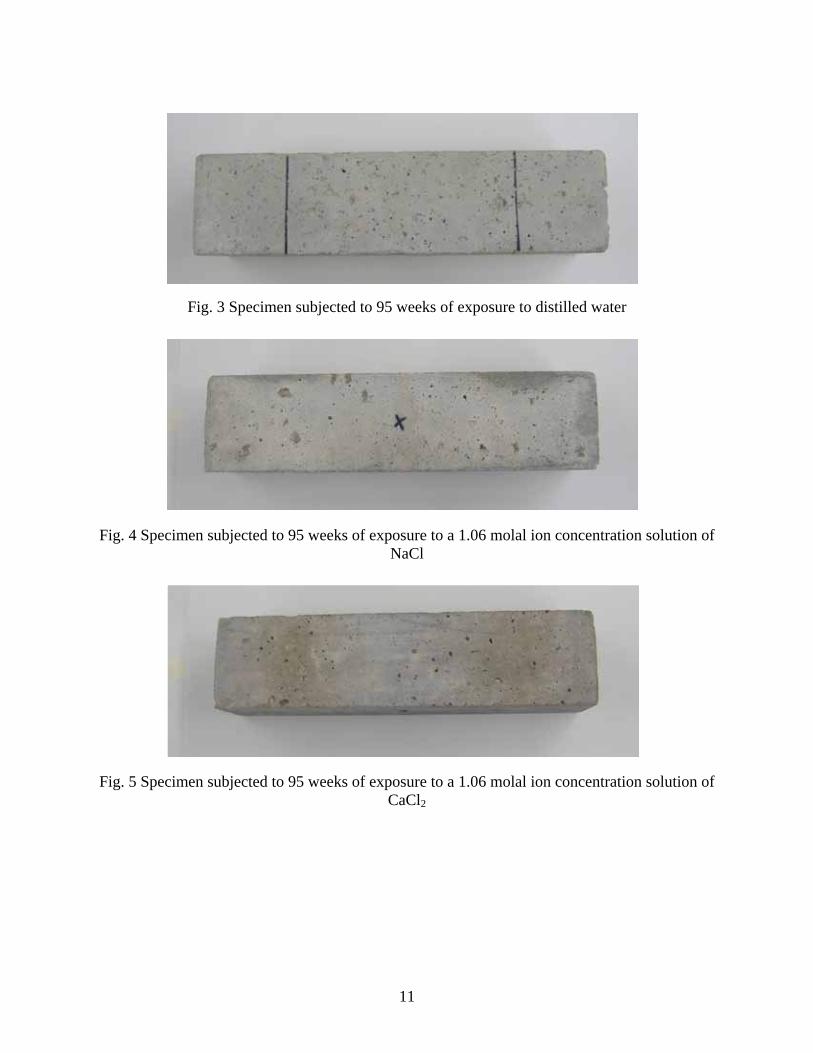
Specimens subjected to temperature cycles in air (not shown) and wet-dry cycles in
distilled water or in 1.06 molal ion concentration NaCl and CaCl2 solutions (Fig. 3, 4 and 5,
respectively) show few signs of damage. The only apparent change is a slight discoloration of the
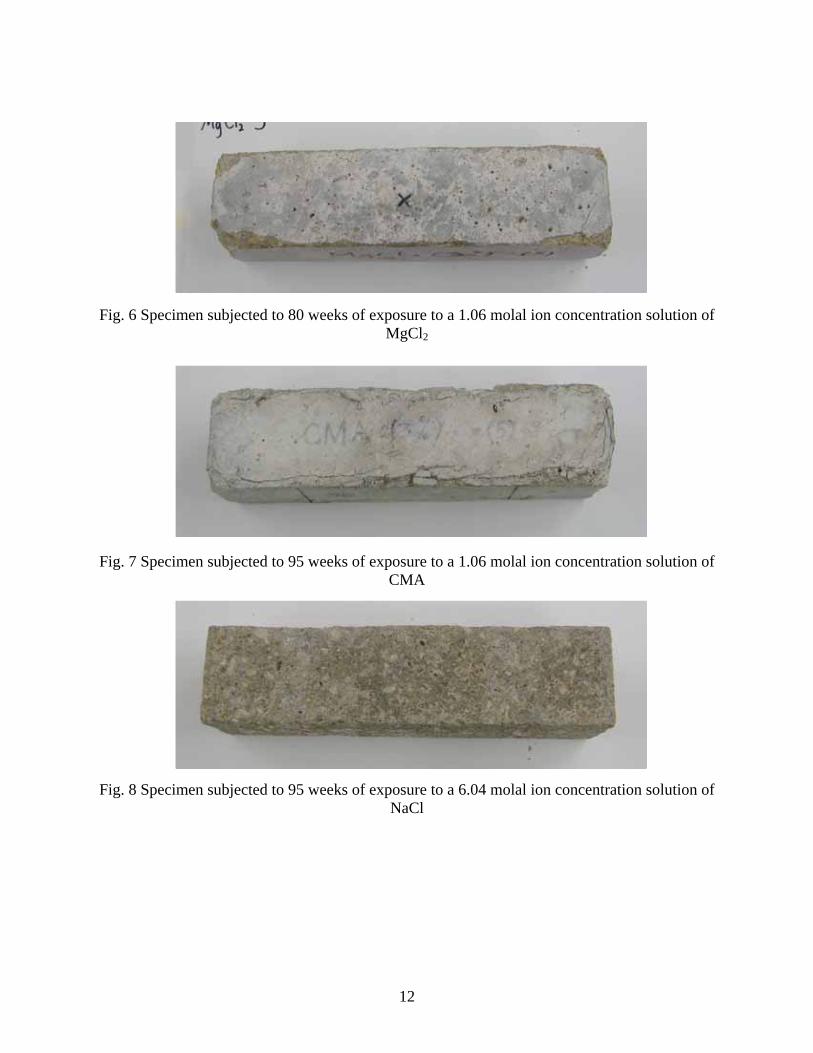
CaCl2 specimens (Fig. 5). In contrast to the NaCl and CaCl2 specimens, the specimens subjected
to MgCl2 and CMA exhibit signs of damage, as shown in Fig. 6 and 7, respectively. The MgCl2
specimens (Fig. 6) were subjected to wet-dry cycles for 80 weeks, after which the test was
terminated because the modulus of elasticity had dropped below 90% of its initial value. The
CMA specimen (Fig. 7) completed 95 weeks of wet-dry cycling.
All of the specimens subjected to the 6.04 molal ion concentration solutions exhibited
damage at the conclusion of the test. Of these specimens, only the specimens in the NaCl
solution lasted for the full 95 weeks. As shown in Fig. 8, the NaCl specimens exhibited some
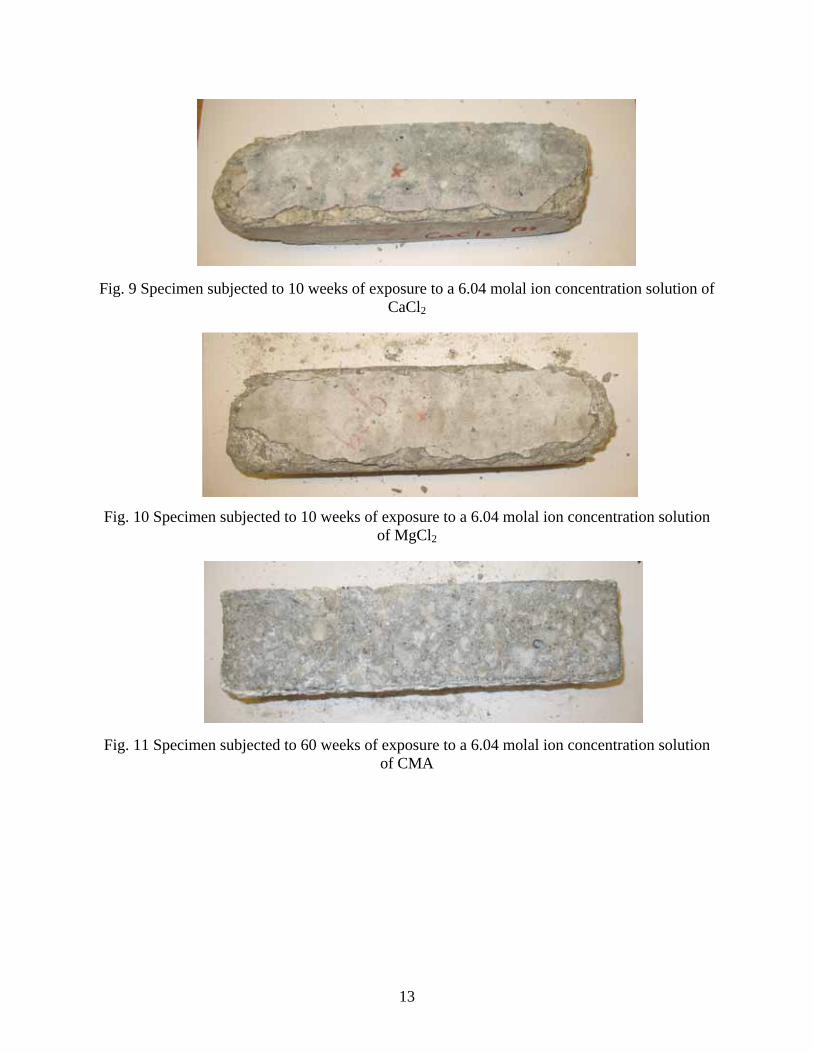
surface scaling, likely the result of crystal growth in the concrete pores. The specimens subjected
to 6.04 molal ion concentration CaCl2 and MgCl2 solutions (Fig. 9 and 10) exhibited the greatest
11
Fig. 3 Specimen subjected to 95 weeks of exposure to distilled water
Fig. 4 Specimen subjected to 95 weeks of exposure to a 1.06 molal ion concentration solution of NaCl
Fig. 5 Specimen subjected to 95 weeks of exposure to a 1.06 molal ion concentration solution of CaCl2
12
Fig. 6 Specimen subjected to 80 weeks of exposure to a 1.06 molal ion concentration solution of MgCl2
Fig. 7 Specimen subjected to 95 weeks of exposure to a 1.06 molal ion concentration solution of CMA
Fig. 8 Specimen subjected to 95 weeks of exposure to a 6.04 molal ion concentration solution of NaCl
13
Fig. 9 Specimen subjected to 10 weeks of exposure to a 6.04 molal ion concentration solution of CaCl2
Fig. 10 Specimen subjected to 10 weeks of exposure to a 6.04 molal ion concentration solution of MgCl2
Fig. 11 Specimen subjected to 60 weeks of exposure to a 6.04 molal ion concentration solution of CMA

14
degree of damage, with a loss of material from the ends and edges of the specimens, as well as
some delamination. As suggested in earlier studies (Cody et al. 1996, Taylor 1997, Lee et al.
2000, Sutter et al. 2006), the damage to the CaCl2 and MgCl2 specimens appears to be the result
of both physical damage due to crystal formation in the concrete pores and chemical changes in
the cement paste. The CaCl2 and MgCl2 specimens also exhibited the greatest reduction in
modulus of elasticity, with the tests terminating at 10 weeks, as shown in Fig. 1. The specimens
subjected to the 6.04 molal ion concentration CMA solution (Fig. 11) exhibited a nearly uniform
loss of material on all exposed surfaces – a change that appears to result primarily from chemical
changes in the cement paste (Lee et al. 2000). The relative dynamic modulus of these specimens
dropped below 1.0 at week 55 (Fig. 1).
Overall, the results of this study, as represented by the measured changes in modulus of
elasticity and observable damage to the test specimens, indicate that calcium chloride,
magnesium chloride, and calcium magnesium acetate have a negative impact on the long-term
durability of concrete. As shown in Fig. 2, 7, and 8, the effects of magnesium chloride and CMA
should become apparent at an earlier age than the effects of calcium chloride (Fig. 6). In the
longer-term, all three deicers will significantly weaken concrete (Fig. 1, 9-11). Sodium chloride,
the most widely used deicer in U.S. practice, has a more benign impact in both the short and long
term.
SUMMARY AND CONCLUSIONS
Concrete specimens were exposed to weekly Southern Exposure-type cycles of wetting
and drying in distilled water and in solutions of sodium chloride, calcium chloride, magnesium
chloride, and calcium magnesium acetate with either a 6.04 molal ion concentration, equivalent
15
in ion concentration to a 15% solution of NaCl, or a 1.06 molal ion concentration, equivalent in
ion concentration to a 3% solution of NaCl, for periods of up to 95 weeks. Specimens were also
exposed to air only. The effects of exposure were evaluated based on changes in the dynamic
modulus of elasticity and the physical appearance of the specimens at the conclusion of the tests.
The following conclusions are based on the tests and analyses presented in this report.
1. Concretes exposed to distilled water and air show, respectively, an increase and a decrease in
dynamic modulus of elasticity, due principally to changes in moisture content. Overall, no
negative impact on concrete properties is observed.
2. At lower concentrations, sodium chloride and calcium chloride have a relatively small
negative impact on the properties of concrete. At high concentrations, sodium chloride has a
greater but still relatively small negative effect. Damage appears to be primarily due to the
effects of crystal growth within concrete pores.
3. At low concentrations, magnesium chloride and calcium magnesium acetate can cause
measurable damage to concrete.
4. At high concentrations, calcium chloride, magnesium chloride, and calcium magnesium
acetate cause significant changes in concrete that result in loss of material and a reduction in
stiffness and strength. The damage caused by calcium chloride and magnesium chloride
appears to be the result of both physical damage, due to crystal formation in the concrete
pores, and chemical changes in the cement paste. The damage caused by calcium magnesium
acetate appears to be primarily caused by chemical changes in the cement paste.
5. The application of significant quantities of calcium chloride, magnesium chloride, and
calcium magnesium acetate over the life of a structure or pavement will negatively impact
the long-term durability of concrete.
16
ACKNOWLEDGMENTS
The research described in this report was supported by the Structural Engineering and
Materials Laboratory of the University of Kansas.
REFERENCES
ASTM C 192/C 192M-07, 2007, “Standard Practice for Making and Curing Concrete Test Specimens in the Laboratory,” American Society for Testing and Materials, West Conshohocken, PA. ASTM C 215-02, 2002, “Standard Test Method for Fundamental Transverse, Longitudinal, and Torsional Frequencies of Concrete Specimens,” American Society for Testing and Materials, West Conshohocken, PA. ASTM C 666/C 666M-03, 2003, “Standard Test Method for Resistance of Concrete to Rapid Freezing and Thawing,” American Society for Testing and Materials, West Conshohocken, PA. Cody, R. D., Cody, A. M., Spry, P. G., and Gan, G.-L., 1996, “Concrete Deterioration by Deicing Salts: An Experimental Study,” Proceedings, Semisequicentennial Transportation Conference, May, Iowa State University, Ames, Iowa, http://www.ctre.iastate.edu/pubs/semisesq/session1/cody/index.htm Darwin, D., Browning, J., Nguyen, T. V., and Locke, C. E., 2007a, “Multiple Corrosion Protection Systems for Reinforced Concrete Bridge Components,” Publication No. FHWA-HRT-07-043, Federal Highway Administration, July, 92 pp., also SM Report No. 84, University of Kansas Center for Research, Inc., Lawrence, Kansas Darwin, D., Browning, J., Nguyen, T. V., and Locke, C. E., 2007b, “Evaluation of Metallized Stainless Steel Clad Reinforcement,” South Dakota Department of Transportation Report, SD2002-16-F, July, 156 pp., also SM Report No. 90, University of Kansas Center for Research, Inc., Lawrence, Kansas Ji, J., Darwin, D., and Browning, J., 2005, “Corrosion Resistance of Duplex Stainless Steels and MMFX Microcomposite Steel for Reinforced Concrete Bridge Decks,” SM Report No. 80, University of Kansas Center for Research, Inc., Lawrence, Kansas, December, 453 pp. Lee, H., Cody, A. M., Cody, R. D., and Spry, P. G., 2000, “Effects of Various Deicing Chemicals on Pavement Concrete Deterioration,” Proceedings, Mid-Continent Transportation Symposium, Center for Transportation Research and Education, Iowa State University, Ames, Iowa, pp. 151-155. Lindquist, W. D., Darwin, D., Browning, J., and Miller, G. G., 2006, “Effect of Cracking on Chloride Content in Concrete Bridge Decks,” ACI Materials Journal, Vol. 103, No. 6, Nov.-
17
Dec., pp. 467-473. Marchand, J., Pigeon, M., Bager, D., and Talbot, C., 1999, “Influence of Chloride Solution Concentration on Deicer Salt Scaling Deterioration of Concrete,” ACI Materials Journal, Vol. 96, No. 4, July-Aug., pp. 429-435. McDonald, D.B., Pfeifer, D.W., and Sherman, M.R., 1998, Corrosion Evaluation of Epoxy-Coated, Metallic Clad and Solid Metallic Reinforcing Bars in Concrete, Publication Number FHWA-RD-98-153, U.S. Department of Transportation Federal Highway Administration, 127 pp. Sutter, L., Peterson,, K., Touton, S., Van Dam, T., and Johnston, D., 2006, “Petrographic Evidence of Calcium Oxychloride Formation in Mortars Exposed to Magnesium Chloride Solution,” Cement and Concrete Research, Vol. 36, No. 6, Aug., pp. 1533-1541. Taylor, H. F. W., 1997, Cement Chemistry, 2nd Ed., Thomas Telford Publishing, London, 459 pp. Verbeck, G. and Klieger, P., 1957, “Studies of ‘Salt’ Scaling,” Research Department Bulletin 83, Portland Cement Association, Chicago, Illinois, June, 13 pp.
18
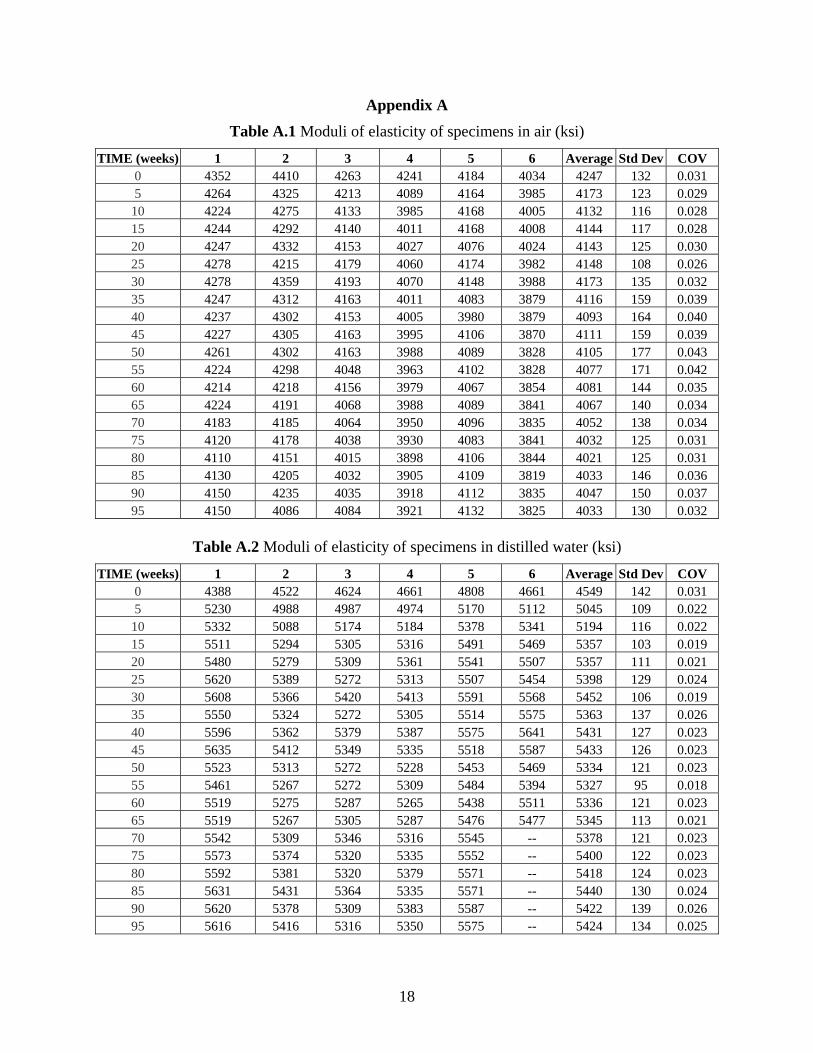
Appendix A Table A.1 Moduli of elasticity of specimens in air (ksi)
TIME (weeks) 1 2 3 4 5 6 Average Std Dev COV 0 4352 4410 4263 4241 4184 4034 4247 132 0.031 5 4264 4325 4213 4089 4164 3985 4173 123 0.029
10 4224 4275 4133 3985 4168 4005 4132 116 0.028 15 4244 4292 4140 4011 4168 4008 4144 117 0.028 20 4247 4332 4153 4027 4076 4024 4143 125 0.030 25 4278 4215 4179 4060 4174 3982 4148 108 0.026 30 4278 4359 4193 4070 4148 3988 4173 135 0.032 35 4247 4312 4163 4011 4083 3879 4116 159 0.039 40 4237 4302 4153 4005 3980 3879 4093 164 0.040 45 4227 4305 4163 3995 4106 3870 4111 159 0.039 50 4261 4302 4163 3988 4089 3828 4105 177 0.043 55 4224 4298 4048 3963 4102 3828 4077 171 0.042 60 4214 4218 4156 3979 4067 3854 4081 144 0.035 65 4224 4191 4068 3988 4089 3841 4067 140 0.034 70 4183 4185 4064 3950 4096 3835 4052 138 0.034 75 4120 4178 4038 3930 4083 3841 4032 125 0.031 80 4110 4151 4015 3898 4106 3844 4021 125 0.031 85 4130 4205 4032 3905 4109 3819 4033 146 0.036 90 4150 4235 4035 3918 4112 3835 4047 150 0.037 95 4150 4086 4084 3921 4132 3825 4033 130 0.032
Table A.2 Moduli of elasticity of specimens in distilled water (ksi)
TIME (weeks) 1 2 3 4 5 6 Average Std Dev COV 0 4388 4522 4624 4661 4808 4661 4549 142 0.031 5 5230 4988 4987 4974 5170 5112 5045 109 0.022
10 5332 5088 5174 5184 5378 5341 5194 116 0.022 15 5511 5294 5305 5316 5491 5469 5357 103 0.019 20 5480 5279 5309 5361 5541 5507 5357 111 0.021 25 5620 5389 5272 5313 5507 5454 5398 129 0.024 30 5608 5366 5420 5413 5591 5568 5452 106 0.019 35 5550 5324 5272 5305 5514 5575 5363 137 0.026 40 5596 5362 5379 5387 5575 5641 5431 127 0.023 45 5635 5412 5349 5335 5518 5587 5433 126 0.023 50 5523 5313 5272 5228 5453 5469 5334 121 0.023 55 5461 5267 5272 5309 5484 5394 5327 95 0.018 60 5519 5275 5287 5265 5438 5511 5336 121 0.023 65 5519 5267 5305 5287 5476 5477 5345 113 0.021 70 5542 5309 5346 5316 5545 -- 5378 121 0.023 75 5573 5374 5320 5335 5552 -- 5400 122 0.023 80 5592 5381 5320 5379 5571 -- 5418 124 0.023 85 5631 5431 5364 5335 5571 -- 5440 130 0.024 90 5620 5378 5309 5383 5587 -- 5422 139 0.026 95 5616 5416 5316 5350 5575 -- 5424 134 0.025
19
Table A.3 Moduli of elasticity of specimens in 6.04 molal ion concentration solution of NaCl (ksi)
TIME (weeks) 1 2 3 4 5 6 Average Std Dev COV 0 4500 4785 4834 4956 5018 5107 4867 215 0.044 5 4985 5165 5347 4760 5413 5510 5197 284 0.055
10 4949 5286 5382 5409 5491 5565 5347 217 0.041 15 4996 5297 5428 5594 5561 5668 5424 247 0.046 20 5256 5366 5466 5455 5620 5719 5481 168 0.031 25 5155 5481 5416 5618 5609 5731 5502 203 0.037 30 5298 5532 5458 5629 5561 5679 5526 136 0.025 35 5137 5439 5366 5579 5506 5644 5445 180 0.033 40 5200 5316 5374 5594 5565 5656 5451 180 0.033 45 5207 5420 5393 5375 5546 5675 5436 160 0.029 50 5237 5435 5305 5303 5522 5636 5406 153 0.028 55 5174 5309 5252 5269 5609 5612 5371 191 0.036 60 5185 5082 4998 5130 5514 5628 5256 254 0.048 65 5207 5071 5046 5104 5483 5483 5232 202 0.039 70 5230 5176 4958 5096 5429 5549 5240 217 0.041 75 5207 5172 4991 5074 5371 5510 5221 191 0.037 80 5193 5184 5039 5063 5351 5518 5225 182 0.035 85 5126 5124 5039 4760 5440 5420 5152 254 0.049 90 4862 5150 5057 4760 5405 5190 5071 233 0.046 95 4902 4967 5046 4804 5386 5137 5040 205 0.041
Table A.4 Moduli of elasticity of specimens in 1.06 molal ion concentration solution of NaCl
(ksi)
TIME (weeks) 1 2 3 4 5 6 Average Std Dev COV 0 4922 5069 4954 5059 5060 4968 5005 65 0.013 5 5036 5242 5183 5288 5176 5034 5160 105 0.020
10 5352 5460 5288 5480 5485 5327 5399 87 0.016 15 5321 5506 5307 5404 5465 5331 5389 83 0.015 20 5452 5608 5363 5461 5582 5449 5486 92 0.017 25 5580 5639 5318 5420 5625 5495 5513 126 0.023 30 5541 5663 5424 5495 5621 5522 5544 86 0.016 35 5421 5479 5447 5537 5601 5411 5483 74 0.013 40 5490 5584 5428 5530 5691 5511 5539 90 0.016 45 5556 5468 5417 5618 5465 5550 5512 75 0.014 50 5133 5322 5183 5307 5446 5323 5286 112 0.021 55 5306 5368 5217 5488 5434 5476 5381 106 0.020 60 5452 5429 5205 5518 5519 5395 5420 116 0.021 65 5291 5487 5217 5473 5543 5411 5403 126 0.023 70 5268 5510 5213 5348 5574 5426 5390 140 0.026 75 5363 5503 5299 5450 5512 5395 5420 83 0.015 80 5386 5518 5288 5469 5547 5380 5431 97 0.018 85 5379 5506 5262 5473 5539 5426 5431 101 0.019 90 5498 5545 5390 5465 5489 5415 5467 57 0.010 95 5463 5549 5394 5281 5206 5323 5369 125 0.023

20
Table A.5 Moduli of elasticity of specimens in 6.04 molal ion concentration solution of CaCl2
(ksi)
TIME (weeks) 1 2 3 4 5 6 Average Std Dev COV 0 4704 4637 5235 4725 5093 5119 4879 258 0.053 5 4181 4361 4677 4387 4663 4488 4454 191 0.043
10 3536 4222 4475 4270 4398 4470 4180 355 0.085
Table A.6 Moduli of elasticity of specimens in 1.06 molal ion concentration solution of CaCl2 (ksi)
TIME (weeks) 1 2 3 4 5 6 AverageStd Dev COV 0 5069 5075 5175 5221 4956 4939 5072 113 0.022 5 5285 5268 5456 5523 5244 5231 5334 123 0.023
10 5564 5514 5598 5639 5536 5466 5553 62 0.011 15 5598 5465 5661 5702 5548 5435 5568 106 0.019 20 5645 5530 5681 5722 5638 5566 5630 71 0.013 25 5653 5645 5645 5624 5642 5581 5632 27 0.005 30 5641 5634 5729 5777 5646 5577 5667 72 0.013 35 5521 5503 5621 5749 5486 5378 5543 128 0.023 40 5537 5584 5701 5714 5689 5577 5634 76 0.014 45 5676 5649 5729 5726 5618 5462 5643 99 0.018 50 5483 5468 5653 5616 5332 5401 5492 123 0.022 55 5606 5488 5629 5639 5455 5439 5543 92 0.017 60 5802 5434 5598 5608 5439 5355 5539 162 0.029 65 5456 5396 5598 5632 5424 5370 5479 109 0.020 70 5483 5446 5605 5624 5431 5389 5496 97 0.018 75 5460 5449 5590 5608 5466 5386 5493 87 0.016 80 5471 5465 5609 5639 5486 5427 5516 86 0.016 85 5448 5392 5590 5620 5420 5382 5475 103 0.019 90 5448 5453 5574 5604 5416 5355 5475 95 0.017 95 5441 5423 5574 5600 5397 5276 5452 120 0.022
21
Table A.7 Moduli of elasticity of specimens in 6.04 molal ion concentration solution of MgCl2 (ksi)
TIME (weeks) 1 2 3 4 5 6 Average Std Dev COV 0 5080 4606 5177 4932 5098 5086 4978 207 0.042 5 4450 4464 4780 4714 4618 4520 4605 136 0.030
10 4092 4283 4504 4384 3691 3667 4191 356 0.085
Table A.8 Moduli of elasticity of specimens in 1.06 molal ion concentration solution of MgCl2 (ksi)
TIME (weeks) 1 2 3 4 5 6 AverageStd Dev COV 0 4964 5123 5089 5019 5091 5012 5050 61 0.012 5 5248 5334 5429 5429 5199 5295 5322 94 0.018
10 5497 5568 5448 5352 5568 5485 5486 81 0.015 15 5420 5414 5452 5413 5452 5403 5426 21 0.004 20 5470 5595 5409 5410 5491 5438 5469 70 0.013 25 5316 5448 5248 5220 5533 5477 5374 130 0.024 30 5412 5502 5479 5444 5552 5532 5487 53 0.010 35 5259 5311 5267 5292 5537 5462 5355 116 0.022 40 5290 5368 5375 5254 5319 5485 5348 81 0.015 45 5389 5525 5348 5421 5338 5485 5418 75 0.014 50 4814 4916 5153 5123 5162 5181 5058 154 0.031 55 4890 4960 4988 5205 5069 5155 5045 121 0.024 60 4861 5019 4786 4837 4857 4971 4889 88 0.018 65 4626 4986 4692 4848 4836 5027 4836 157 0.033 70 4450 4909 4570 4891 4803 5087 4785 235 0.049 75 4294 4880 4059 4740 4626 4867 4578 333 0.073 80 4243 4865 3594 4496 4430 4596 4371 432 0.099
22
Table A.9 Moduli of elasticity of specimens in 6.04 molal ion concentration solution of CMA (ksi)
TIME (weeks) 1 2 3 4 5 6 AverageStd Dev COV 0 4613 4742 5027 4871 4972 5062 4881 175 0.036 5 4719 4793 4975 4850 4997 5028 4894 125 0.026
10 4592 4807 4780 4618 4943 4932 4779 150 0.031 15 4536 4651 4719 4608 4738 4797 4675 95 0.020 20 4547 4547 4599 4567 4845 4815 4653 138 0.030 25 4557 4713 4582 4574 4716 4764 4651 90 0.019 30 4498 4605 4820 4530 4816 4667 4656 139 0.030 35 4488 4651 4677 4371 4631 4650 4578 122 0.027 40 4463 4385 4716 4421 4713 4822 4587 185 0.040 45 4467 4515 4620 4371 4816 4928 4620 214 0.046 50 4235 4288 4656 4276 4568 4761 4464 225 0.051 55 4119 4188 4443 3986 4238 4575 4258 216 0.051 60 3916 3949 4154 3806 4068 4379 4045 203 0.050
Table A.10 Moduli of elasticity of specimens in 1.06 molal ion concentration solution of CMA
(ksi)
TIME (weeks) 1 2 3 4 5 6 AverageStd Dev COV 0 5201 4868 5128 5010 5485 4816 5085 245 0.048 5 5420 5119 5360 5196 5693 5028 5302 241 0.045
10 5386 5130 5295 5169 5869 5225 5346 272 0.051 15 5469 5107 5333 5181 5805 5154 5342 263 0.049 20 5562 5276 5322 5188 5873 5176 5399 271 0.050 25 5562 5276 5291 5139 5845 5214 5388 266 0.049 30 5562 5227 5368 5294 5805 5225 5413 229 0.042 35 5265 4978 5276 5102 5765 5024 5235 287 0.055 40 5250 4985 5166 5002 5717 5039 5193 276 0.053 45 5462 5126 5283 5143 5781 4976 5295 289 0.055 50 4977 4706 4879 4698 4761 5206 4871 196 0.040 55 4937 4699 4774 4563 4703 5142 4803 206 0.043 60 4882 4688 4748 4542 4664 5251 4796 249 0.052 65 4893 4692 4669 4549 4682 5187 4779 229 0.048 70 4918 4681 4583 4538 4675 5165 4760 238 0.050 75 4980 4603 4698 4598 4768 5308 4826 275 0.057 80 4947 4572 4752 4472 4657 5184 4764 262 0.055 85 5061 4565 4752 4472 4628 5079 4759 257 0.054 90 4882 4649 4694 4531 4592 5199 4758 247 0.052 95 4693 4519 4683 4337 4413 5102 4624 274 0.059


![[R. I. Gilbert] Time Effects in Concrete Structure](https://static.fdocuments.net/doc/165x107/55cf8ff0550346703ba16fe9/r-i-gilbert-time-effects-in-concrete-structure.jpg)