Effect of Chloride-based Deicers on Reinforced Concrete ...can pose on the concrete strength, even...
174
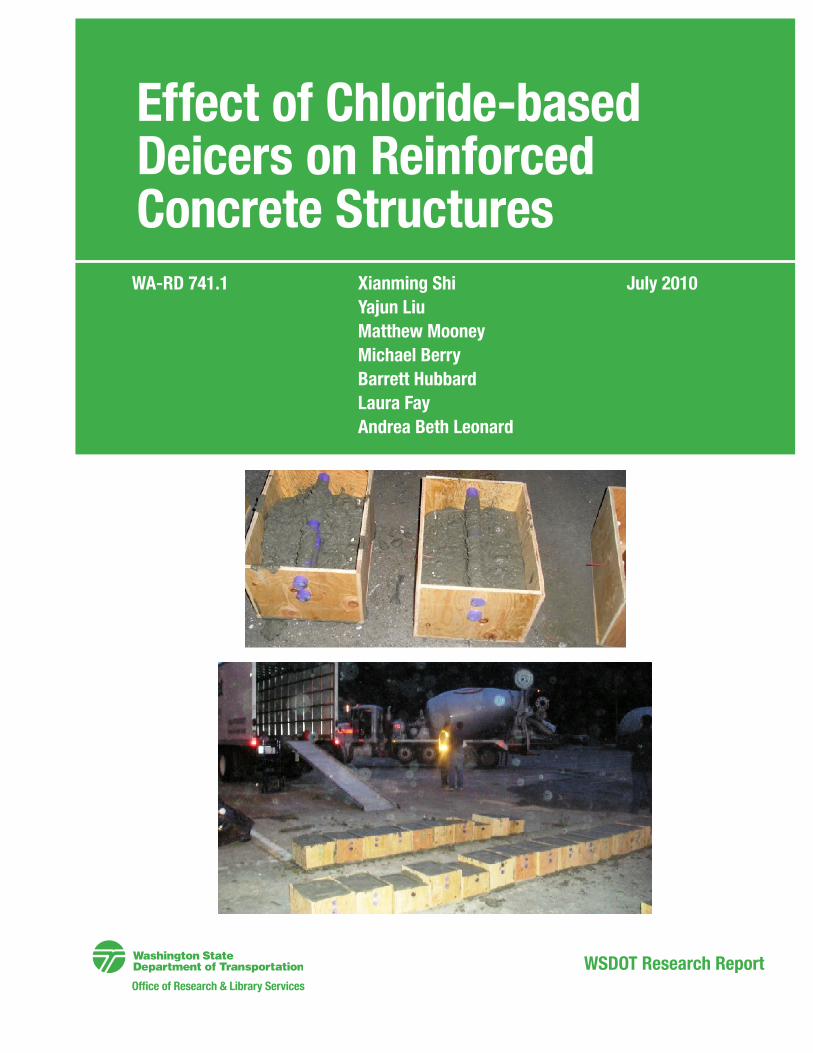
July 2010 Xianming Shi Yajun Liu Matthew Mooney Michael Berry Barrett Hubbard Laura Fay Andrea Beth Leonard WA-RD 741.1 Office of Research & Library Services WSDOT Research Report Effect of Chloride-based Deicers on Reinforced Concrete Structures
Transcript of Effect of Chloride-based Deicers on Reinforced Concrete ...can pose on the concrete strength, even...
July 2010Xianming Shi Yajun LiuMatthew Mooney Michael Berry Barrett HubbardLaura FayAndrea Beth Leonard
WA-RD 741.1
Office of Research & Library Services
WSDOT Research Report
Effect of Chloride-based Deicers on Reinforced Concrete Structures

i
E F F E C T OF C H L OR I DE -B A SE D DE I C E R S ON R E I NF OR C E D C ONC R E T E ST R UC T UR E S
Final Report
Prepared for the
by
Xianming Shi, Ph.D., P.E. (Principal Investigator)
Yajun Liu, Ph.D.
Matthew Mooney
Michael Berry, Ph.D.
Barrett Hubbard
Laura Fay, M.Sc.
Andrea Beth Leonard
Corrosion & Sustainable Infrastructure Laboratory
Western Transportation Institute
Montana State University, Bozeman, MT 59717
Last revised: July 15, 2010
ii
DISCLAIMER
The contents of this report reflect the views of the authors, who are responsible for the facts and the accuracy of the data presented herein. The contents do not necessarily reflect the official views or policies of the Washington State Department of Transportation or the Federal Highway Administration. This report does not constitute a standard, specification, or regulation.
Reference herein to any specific commercial products, process, or service by trade name, trademark, manufacturer, or otherwise, does not necessarily constitute or imply its endorsement, recommendation, or favoring by the authors or the project sponsors.
Alternative accessible formats of this document will be provided upon request. Persons with disabilities who need an alternative accessible format of this information, or who require some other reasonable accommodation to participate, should contact Catherine Heidkamp, Assistant Director for Communications and Information Systems, Western Transportation Institute, Montana State University, PO Box 174250, Bozeman, MT 59717-4250, telephone number 406-994-7018, e-mail: [email protected].
.
ACKNOWLEDGEMENTS
The authors acknowledge the financial support provided by the Washington State Department of Transportation as well as the Research & Innovative Technology Administration (RITA) at the U.S. Department of Transportation for this project. The authors would like to thank the WSDOT Research Manager Kim Willoughby and the technical panel consisting of Rico Baroga, Tom Root, DeWayne Wilson, Linda M. Pierce, Jeff S. Uhlmeyer, and Douglas Pierce, for providing the continued support throughout this project. We owe our thanks to Felix Chandra, Mike Weeks, and Greg Mckinnon at the Stoneway Concrete Inc. (Renton, WA) for assisting with the fabrication and quality assurance of all the concrete specimens used in this study. We appreciate the following professionals who provided assistance to this research: Jim Weston (WSDOT), Mary Gilmore (WSDOT), and Mark Peterson (Montana Department of Transportation). We also thank our collaborators at the Montana State University (MSU): Dr. Recep Avci of the Imaging and Chemical Analysis Laboratory for the use of FESEM/EDX instrumentation; Dr. Ed E. Adams of the Civil Engineering Department for the use of environmental chamber. Finally, we owe our thanks to the following individuals at the Western Transportation Institute for providing help in various stages of the laboratory investigation: Marijean M. Peterson, Dr. Tuan Anh Nguyen, Dr. Tongyan Pan, Dr. Wei Chu, Steven Anderson, Justin P. Hauck, Andrew Gilbert, Brian Herting, Eric Schon, and Tristan J. Dunlap.
iii
1. REPORT NO. 2. GOVERNMENT ACCESSION NO. 3. RECIPIENTS CATALOG NO WA-RD 741.1
4. TITLE AND SUBTITLE 5. REPORT DATE Effect of Chloride-based Deicers on Reinforced Concrete Structures
July 2010 6. PERFORMING ORGANIZATION CODE
7. AUTHOR(S) 8. PERFORMING ORGANIZATION REPORT NO. Xianming Shi, Yajun Liu, Matthew Mooney, Michael Berry, Barrett Hubbard, Laura Fay, Andrea Beth Leonard
9. PERFORMING ORGANIZATION NAME AND ADDRESS 10. WORK UNIT NO. Western Transportation Institute PO Box 174250, Montana State University Bozeman, MT 59717-4250
11. CONTRACT OR GRANT NO.
12. CO-SPONSORING AGENCY NAME AND ADDRESS 13. TYPE OF REPORT AND PERIOD COVERED Washington State Department of Transportation - Research 310 Maple Park Avenue SE PO Box 47372, Olympia WA 98504-7372 Research Manager: Kim Willoughby 360-705-7978
Final Report, Dec. 1995-July 2010 14. SPONSORING AGENCY CODE
15. SUPPLEMENTARY NOTES Conducted in cooperation with the U.S. Department of Transportation, Federal Highway Administration. 16. ABSTRACT We conducted an extensive literature review and performed laboratory tests to assess the effect of chloride-based deicers on the rebars and dowel bars in concrete and to determine whether or not deicer corrosion inhibitors help preserve the transportation infrastructure. The laboratory investigation exposed concrete samples to four common chloride-based deicers for approximately one year or less, for natural diffusion at room temperature or for cyclic exposure with wet/dry and temperature cycling. Under the experimental conditions in this study, the corrosion inhibitors in deicers helped to preserve the strength of concrete undergoing temperature and wet/dry cycles. While they also slowed down the chloride ingress and subsequent corrosion initiation of steel in concrete, such benefits seem to diminish once the active corrosion of the rebar is initiated. There were small differences in the corrosion behavior of various dowel bars investigated, limited by the short duration of this study. Corrosion inhibitors and other additives in deicers did not show significant benefit in inhibiting the chemical changes of concrete induced by cations and/or anions in deicers. Agencies should be aware of the deleterious effects magnesium chloride deicers can pose on the concrete strength, even though the inhibited magnesium chloride deicers can pose less corrosion risk for steel in concrete, relative to sodium-chloride-based deicers with or without inhibitor. To anticipate better return on investment regarding the preservation of reinforced concrete, agencies should focus on improved concrete mix designs with less permeability instead of procuring the more costly (inhibited) deicers. 17. KEY WORDS 18. DISTRIBUTION STATEMENT Winter maintenance, snow and ice control, deicing chemicals, rebar corrosion, dowel bar corrosion, reinforced concrete, chloride ingress, sodium chloride, magnesium chloride, calcium chloride
No restrictions. This document is available to the public through the National Technical Information Service, Springfield, VA 22161; www.ntis.gov
19. SECURITY CLASSIF. (of this report) 20. SECURITY CLASSIF. (of this page) 21. NO. OF PAGES 22. PRICE None None

iv
This page was intentionally left blank.
v
Table of Contents
ACKNOWLEDGEMENTS ......................................................................................................... II
LIST OF TABLES ......................................................................................................................... X
ABBREVIATIONS AND ACRONYMS ................................................................................... XI
E X E C UT I V E SUM M A R Y ........................................................................................................1
C H A PT E R 1. I NT R ODUC T I ON ...............................................................................................1
1.1. PROBLEM STATEMENT ...........................................................................................5
1.2. BACKGROUND .................................................................................................5
1.2.1. Chemicals for Winter Road Maintenance .......................................................5 1.2.2. Corrosion of Steel in Concrete and Concrete Permeability ............................7 1.2.3. Mechanisms of Steel Corrosion in Concrete ...................................................8 1.2.4. Transport of Chlorides and Inhibitors in Concrete: The State of
Knowledge ..................................................................................................9 1.2.5. Deicer Impact on Concrete Performance and Durability ...............................9 1.2.6. Deicer Corrosion to Metals in Transportation Infrastructure ........................9
1.3. STUDY OBJECTIVES ..............................................................................................10
1.4. HOW THIS REPORT IS ORGANIZED .....................................................................11
1.5. REFERENCES .........................................................................................................11
C H A PT E R 2. M E T H ODOL OG Y ............................................................................................13
2.1. EXPERIMENTAL ....................................................................................................13
2.1.1. Deicers of Interest ........................................................................................ 13 2.1.2. Design of Deicing Ponding Experiments ..................................................... 15 2.1.3. Concrete Samples: Materials and Preparation ............................................ 16 2.1.4. Chloride Sensors .......................................................................................... 21 2.1.5. Deicing Ponding Experiments ...................................................................... 23 2.1.6. Compression Testing of Concrete Core Samples ......................................... 29 2.1.7. FESEM/EDX Measurements ........................................................................ 29 2.1.8. Estimating the Apparent Chloride Diffusion Coefficient Using the EDX
Data ......................................................................................................... 30 2.2. PREDICTIVE MODELS BASED ON ARTIFICIAL NEURAL NETWORKS ..................31
2.3. REFERENCES .........................................................................................................33
vi
C H A PT E R 3. L A B OR A T OR Y I NV E ST I G A T I ON A ND NE UR A L NE T W OR K S M ODE L I NG
OF DE I C E R I NG R E SS I NT O POR T L A ND C E M E NT C ONC R E T E A ND I T S
C OR R OSI ON I M PL I C A T I ONS .........................................................................34
3.1. CHLORIDE DIFFUSION COEFFICIENT OF DEICERS IN CONCRETE ......................34
3.2. EFFECT OF DEICER PONDING EXPERIMENTS ON THE CONCRETE
STRENGTH ....................................................................................................36
3.2. DATA ANALYSIS FOR DEICER PONDING EXPERIMENTS AND RELATED
ANN-BASED PREDICTIVE MODELS .............................................................38
3.2.1. ANN Model for the Chloride Sensor Potential ............................................. 40 3.2.2. ANN Model for the Top Bar OCP ................................................................ 46 3.2.3. ANN Model for the Macro-cell Current ....................................................... 53 3.2.4. ANN Model for the Top Bar Corrosion Rate ............................................... 55
3.3. CONCLUSIONS .......................................................................................................64
3.4. REFERENCES .........................................................................................................66
CHAPTER 4. CHEMICAL CHANGE OF PORTLAND CEMENT CONCRETE EXPOSED TO
DEICERS ........................................................................................................67
4.1. INTRODUCTION .....................................................................................................67
4.2. RESULTS AND DISCUSSION ...................................................................................68
4.2.1. Effect of Non-Inhibited NaCl on the Chemistry of PCC .............................. 69 4.2.2. Effect of Inhibited NaCl on the Chemistry of PCC ...................................... 73 4.2.3. Effect of the Inhibited CaCl2 Deicer on the Chemistry of PCC ................... 75 4.2.4. Effect of the Inhibited MgCl2 Deicer on the Chemistry of PCC .................. 78
4.3. CONCLUSIONS .......................................................................................................80
4.4. REFERENCES .........................................................................................................80
C H A PT E R 5. C ONC L USI ONS, R E SE A R C H NE E DS A ND R E C OM M E NDA T I ONS F OR
I M PL E M E NT A T I ON ........................................................................................83
5.1. CONCLUSIONS .......................................................................................................83
5.2. RESEARCH NEEDS .................................................................................................83
5.3. RECOMMENDATIONS FOR IMPLEMENTATION .....................................................86
vii
List of Figures
Figure 1. Relative corrosivity of the four deicers used in this study, based on the PNS/NACE method. ....................................................................................... 14
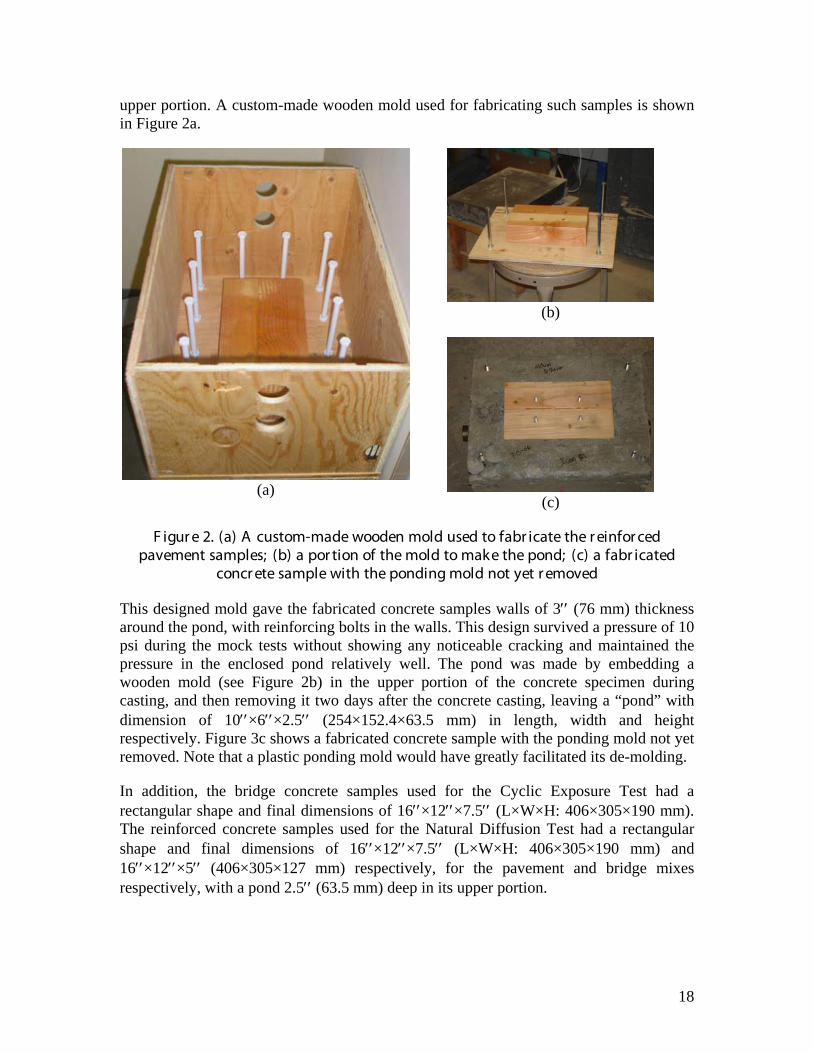
Figure 2. (a) A custom-made wooden mold used to fabricate the reinforced pavement samples; (b) a portion of the mold to make the pond; (c) a fabricated concrete sample with the ponding mold not yet removed .............................. 18
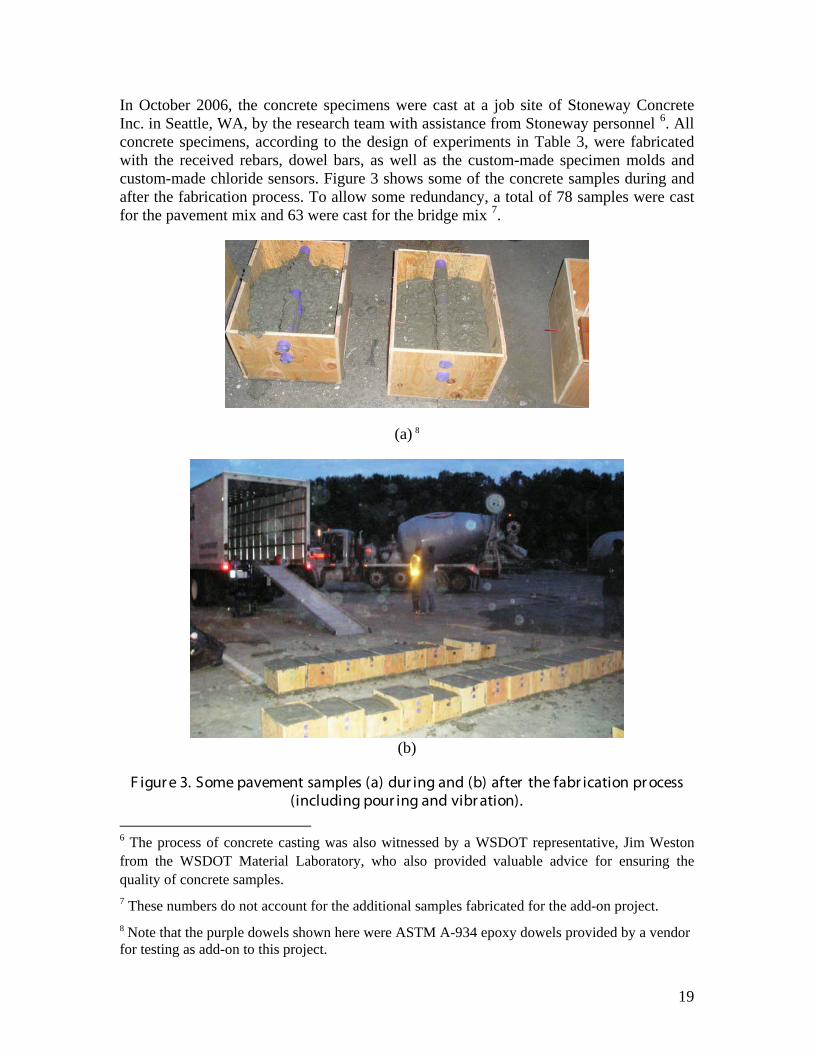
Figure 3. Some reinforced pavement samples (a) during and (b) after the fabrication process (including pouring and vibration). ..................................................... 19
Figure 4. Quality control of fabricated concrete samples: (a) slump test; (b) air content test; and (c) cylinder molds for fabricating compressive strength test specimens. ................................................................................................ 20
Figure 5. Custom-made chloride sensors (dark color) welded to copper wires (red color), before being embedded in the concrete samples. ................................ 21
Figure 6. Electrochemical potential of custom-made chloride sensors as a function of chloride concentration in (a) neutral solutions; (b) highly-alkaline simulated concrete pore solutions. .................................................................. 22
Figure 7. Electrochemical potential of custom-made chloride sensors as a function of NaCl concentration in 28-day concrete samples. ............................................ 23
Figure 8. (a) Schematics and (b) experimental setup for the pressurized transport of deicers into concrete ....................................................................................... 24
Figure 9. (a) The environmental chamber used for this study; (b) The reinforced concrete samples for the Cyclic Exposure Test on the shelves inside the chamber. .......................................................................................................... 25
Figure 10. Temperature and wet/dry cycles experienced by the reinforced concrete samples during the Cyclic Exposure Test ....................................................... 26
Figure 11. Time-dependent behavior of macro-cell current [2] ....................................... 27
Figure 12. Equivalent electric circuit used in the EIS data analysis ................................. 29
Figure 13. Typical multi-layer feed-forward neural network architecture ....................... 32
Figure 14. Chloride diffusion coefficient as a function of deicer type and mix design .... 35
Figure 15. A typical predicted chloride profile in concrete .............................................. 36
Figure 16. Average compressive strength of concrete samples as a function of deicer type and mix design: after the Natural Diffusion Test .................................... 37
Figure 17. Average compressive strength of concrete samples as a function of deicer type and mix design: after the Cyclic Exposure Test ..................................... 38
Figure 18. Relationship between experimental and modeled chloride sensor potential ... 41
Figure 19. Predicted chloride sensor reading as a function of deicer type, test type and mix design ....................................................................................................... 42
viii
Figure 20. Predicted response surface of chloride sensor reading in pavement mix as a function of: (a) exposure duration and wet percent time; (b) reading temperature and daily average exposure temperature ..................................... 44
Figure 21. Predicted response surface of chloride sensor reading in bridge mix as a function of: (a) exposure duration and wet percent time; (b) reading temperature and daily average exposure temperature ..................................... 45
Figure 22. Relationship between experimental and modeled top bar OCP ...................... 46
Figure 23. Predicted top bar OCP as a function of deicer type, test type and bar type in the (a) bridge mix; (b) pavement mix ......................................................... 48
Figure 24. Predicted response surface of OCP of epoxy coated dowel bar in pavement mix as a function of: (a) daily average Cl- concentration and wet percent time; (b) reading temperature and daily average exposure temperature ......... 50
Figure 25. Predicted response surface of OCP of uncoated rebar in bridge mix as a function of: (a) daily average Cl- concentration and wet percent time; (b) reading temperature and daily average exposure temperature ........................ 52
Figure 26. Relationship between experimental and modeled macro-cell current ............. 54
Figure 27. Predicted macro-cell current as a function of deicer type, mix design, and bar type............................................................................................................ 55
Figure 28. Relationship between experimental and modeled corrosion rate of top bar in concrete ....................................................................................................... 56
Figure 29. Predicted top bar icorr as a function of deicer type, test type and bar type in the (a) bridge mix; (b) pavement mix ......................................................... 57
Figure 30. Predicted response surface of icorr of epoxy-coated dowel bar in pavement mix as a function of: (a) daily average Cl- concentration and wet percent time; (b) exposure duration and daily average exposure temperature ............ 60
Figure 31. Predicted response surface of icorr of stainless steel tube in pavement mix as a function of: (a) daily average Cl- concentration and wet percent time; (b) exposure duration and daily average exposure temperature ..................... 61
Figure 32. Predicted response surface of icorr of uncoated rebar in bridge mix as a function of: (a) daily average Cl- concentration and wet percent time; (b) exposure duration and daily average exposure temperature ........................... 62
Figure 33. Predicted response surface of icorr of uncoated rebar in bridge mix with embedded steel strip, as a function of: (a) daily average Cl- concentration and wet percent time; (b) exposure duration and daily average exposure temperature ..................................................................................................... 63
Figure 34. Ca elemental concentration of PCC samples following the Natural Diffusion Test with various solutions, with box plots illustrating the EDX data collected from multiple locations on the sample at two depths. ............. 69
Figure 35. Chemical composition of PCC samples following the Natural Diffusion Test with various solutions, with box plots illustrating the EDX data
ix
collected from multiple locations on the sample at two depths. (a) Si/Ca; (b) Al/Ca ......................................................................................................... 70
Figure 36. Chemical composition of PCC samples following the Natural Diffusion Test with various solutions, with box plots illustrating the EDX data collected from multiple locations on the sample at two depths. (a) S/Al; (b) S/Ca. .......................................................................................................... 71
Figure 37. Representative SEM image of PCC sample following the Natural Diffusion Test with non-inhibited NaCl. (a) pavement mix, 1 mm; (b) pavement mix, 12 mm; (c) and (d): both bridge mix, 12 mm, with magnification of 3510 times. .......................................................................... 72
Figure 38. Representative EDX spectrum and relevant elemental ratios of a pavement concrete sample following the Natural Diffusion Test with non-inhibited NaCl. Corresponding to area shown in Figure 36a, with magnification of 500 times. ........................................................................................................ 73
Figure 39. SEM image of PCC sample following the Natural Diffusion Test with inhibited NaCl. (a) pavement mix, 1 mm; (b) pavement mix, 12 mm; (c) and (d): both bridge mix, 12 mm, with magnification of 3510 times. ............ 74
Figure 40. Representative EDX spectrum and relevant elemental ratios of a pavement concrete sample following the Natural Diffusion Test with the inhibited NaCl. Corresponding to area shown in Figure 38a, with magnification of 500 times. ........................................................................................................ 75
Figure 41. SEM image of PCC sample following the Natural Diffusion Test with inhibited CaCl2. (a) pavement mix, 1 mm; (b) pavement mix, 12 mm; (c) and (d): both bridge mix, 12 mm, all with magnification of 3510 times except (a) at 500 times. ................................................................................... 76
Figure 42. A pavement concrete sample following the Natural Diffusion Test with the inhibited CaCl2, with magnification of 500 times: (a) SEM image; (b) corresponding EDX spectrum and relevant elemental ratios of the area. ....... 77
Figure 43. SEM image of PCC sample following the Natural Diffusion Test with inhibited MgCl2. (a) pavement mix, 1 mm; (b) pavement mix, 12 mm; (c) and (d): both bridge mix, 12 mm, all with magnification of 3510 times. ....... 79
Figure 44. Representative EDX spectrum and relevant elemental ratios of a pavement concrete sample following the Natural Diffusion Test with the inhibited MgCl2. Corresponding to area shown in Figure 42a, with magnification of 500 times. ........................................................................................................ 80
x
List of Tables
Table 1. Comparison of eutectic and effective temperatures for common deicers [12] ..... 7
Table 2. Information related to the actual liquids used for deicer ponding experiments .. 13
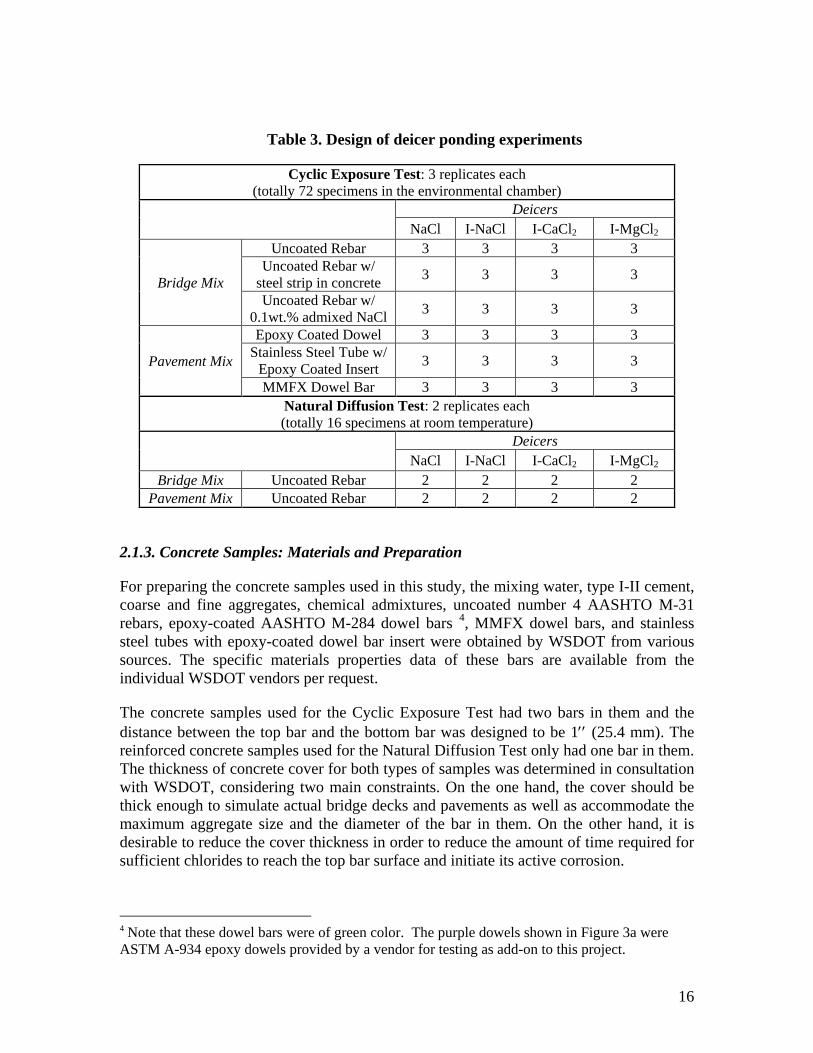
Table 3. Design of deicer ponding experiments ............................................................... 16
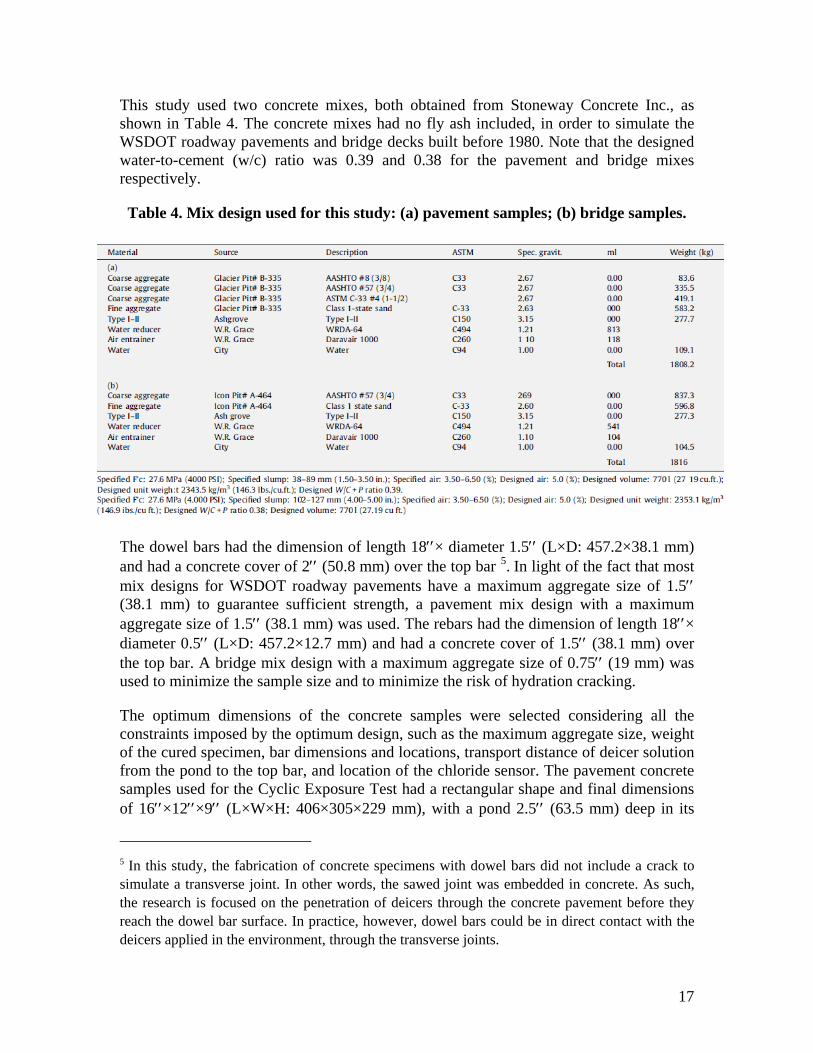
Table 4. Mix design used for this study: (a) pavement samples; (b) bridge samples. ...... 17
Table 5. Parameters and performance of the ANN models in this study .......................... 39
Table 6. Index values used to quantify the various influential factors ............................. 40
xi
Abbreviations and Acronyms
AASHTO American Association of State Highway and Transportation Officials ACR alkali-carbonate reaction AFm aluminate monosulfate hydrates AFt aluminate trisulfate hydrates
AgCl silver chloride
ANN artificial neural network ASR alkali-silica reaction ASTM American Society of Testing and Materials BP back-propagation °C degrees Celsius C3A tricalcium aluminate C4AF Friedel’s salt, 3CaO•Al2O3•CaCl2•10H2O
Ca(OH)2 calcium hydroxide CaCl2 calcium chloride CMA calcium magnesium acetate CP cathodic protection C-S-H calcium silicate hydrate Dapp apparent diffusion coefficient Deff effective diffusion coefficient DI de-ionized water DOT Department of Transportation ECE electrochemical chloride extraction
Ecorr corrosion potential EDX energy dispersive x-ray spectroscopy EICI electrical injection of corrosion inhibitors EIS electrochemical impedance spectroscopy FDM Finite Difference Method FEM Finite Element Method °F degrees Fahrenheit FESEM field emission scanning electron microscopy FHWA Federal Highway Administration FN Friction Number HPC high performance concrete
icorr corrosion current density
ITS indirect tensile strength ITZ interfacial transition zone KAc potassium acetate
KCl potassium chloride
xii
KFm potassium formate
L/D length/diameter ratio
LP linear polarization
LPR linear polarization resistance
MCI migrating corrosion inhibitor
MFP monofluorophosphate
Mg(OH)2 magnesium hydroxide
MgCl2 magnesium chloride MPY milli-inches per year M-S-H magnesium silicate hydrate NaAc sodium acetate NACE National Association of Corrosion Engineers NaCl sodium chloride NaFm sodium formate NCHRP National Center for Highway Research Program RCPT rapid chloride permeability test RMT rapid migration test SHRP Strategic Highway Research Program SMSE sum of mean square error OCP open circuit potential OGBM open-graded base material OGFM open-graded friction course OGM open-graded mix OGP open-graded pavement OH- hydroxyl OPC ordinary Portland Cement PAH polycyclic aromatic hydrocarbon PCC Portland cement concrete PCR percent corrosion rate PNS Pacific Northwest Snowfighters SAE Society of Automotive Engineers SCC self-compacting concrete SCE saturated calomel electrode SEM scanning electron microscopy SHRP Strategic Highway Research Program SMA stone matrix asphalt w/c water-to-cement ratio WTI Western Transportation Institute XPS X-ray photoelectron spectroscopy
1
E X E C UT I V E SUM M A R Y
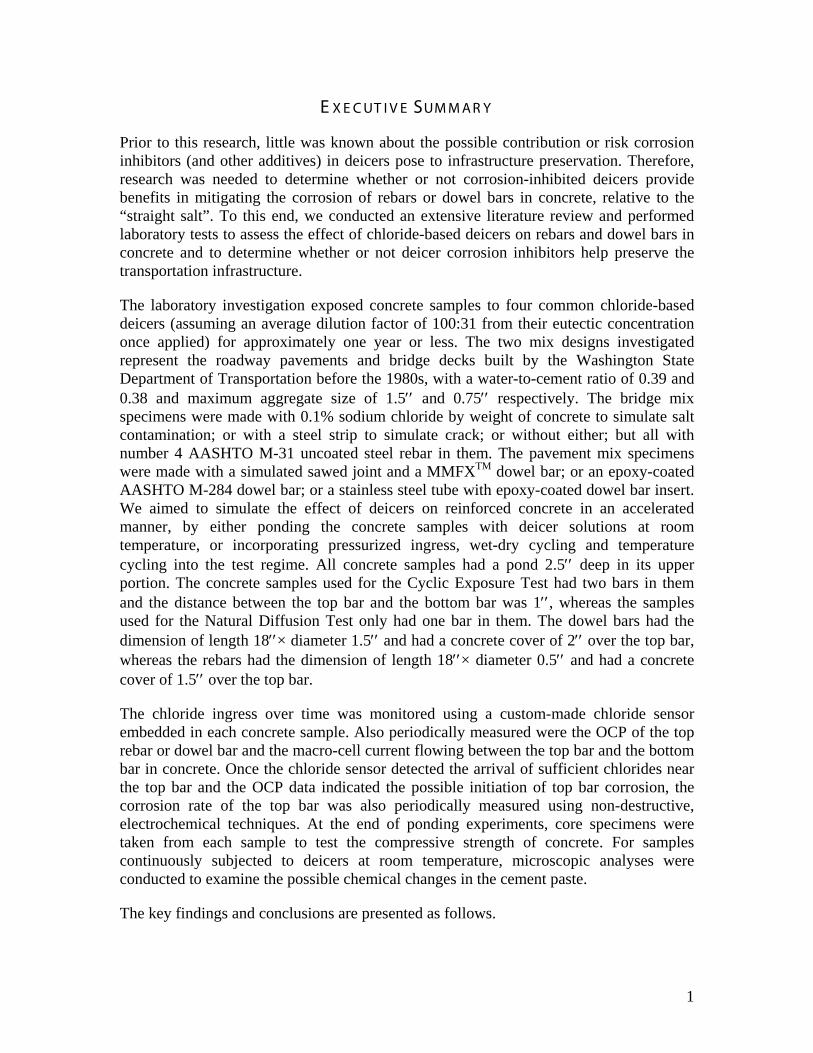
Prior to this research, little was known about the possible contribution or risk corrosion inhibitors (and other additives) in deicers pose to infrastructure preservation. Therefore, research was needed to determine whether or not corrosion-inhibited deicers provide benefits in mitigating the corrosion of rebars or dowel bars in concrete, relative to the “straight salt”. To this end, we conducted an extensive literature review and performed laboratory tests to assess the effect of chloride-based deicers on rebars and dowel bars in concrete and to determine whether or not deicer corrosion inhibitors help preserve the transportation infrastructure.
The laboratory investigation exposed concrete samples to four common chloride-based deicers (assuming an average dilution factor of 100:31 from their eutectic concentration once applied) for approximately one year or less. The two mix designs investigated represent the roadway pavements and bridge decks built by the Washington State Department of Transportation before the 1980s, with a water-to-cement ratio of 0.39 and 0.38 and maximum aggregate size of 1.5′′ and 0.75′′ respectively. The bridge mix specimens were made with 0.1% sodium chloride by weight of concrete to simulate salt contamination; or with a steel strip to simulate crack; or without either; but all with number 4 AASHTO M-31 uncoated steel rebar in them. The pavement mix specimens were made with a simulated sawed joint and a MMFXTM dowel bar; or an epoxy-coated AASHTO M-284 dowel bar; or a stainless steel tube with epoxy-coated dowel bar insert. We aimed to simulate the effect of deicers on reinforced concrete in an accelerated manner, by either ponding the concrete samples with deicer solutions at room temperature, or incorporating pressurized ingress, wet-dry cycling and temperature cycling into the test regime. All concrete samples had a pond 2.5′′ deep in its upper portion. The concrete samples used for the Cyclic Exposure Test had two bars in them and the distance between the top bar and the bottom bar was 1′′, whereas the samples used for the Natural Diffusion Test only had one bar in them. The dowel bars had the dimension of length 18′′× diameter 1.5′′ and had a concrete cover of 2′′ over the top bar, whereas the rebars had the dimension of length 18′′× diameter 0.5′′ and had a concrete cover of 1.5′′ over the top bar.
The chloride ingress over time was monitored using a custom-made chloride sensor embedded in each concrete sample. Also periodically measured were the OCP of the top rebar or dowel bar and the macro-cell current flowing between the top bar and the bottom bar in concrete. Once the chloride sensor detected the arrival of sufficient chlorides near the top bar and the OCP data indicated the possible initiation of top bar corrosion, the corrosion rate of the top bar was also periodically measured using non-destructive, electrochemical techniques. At the end of ponding experiments, core specimens were taken from each sample to test the compressive strength of concrete. For samples continuously subjected to deicers at room temperature, microscopic analyses were conducted to examine the possible chemical changes in the cement paste.
The key findings and conclusions are presented as follows.
2
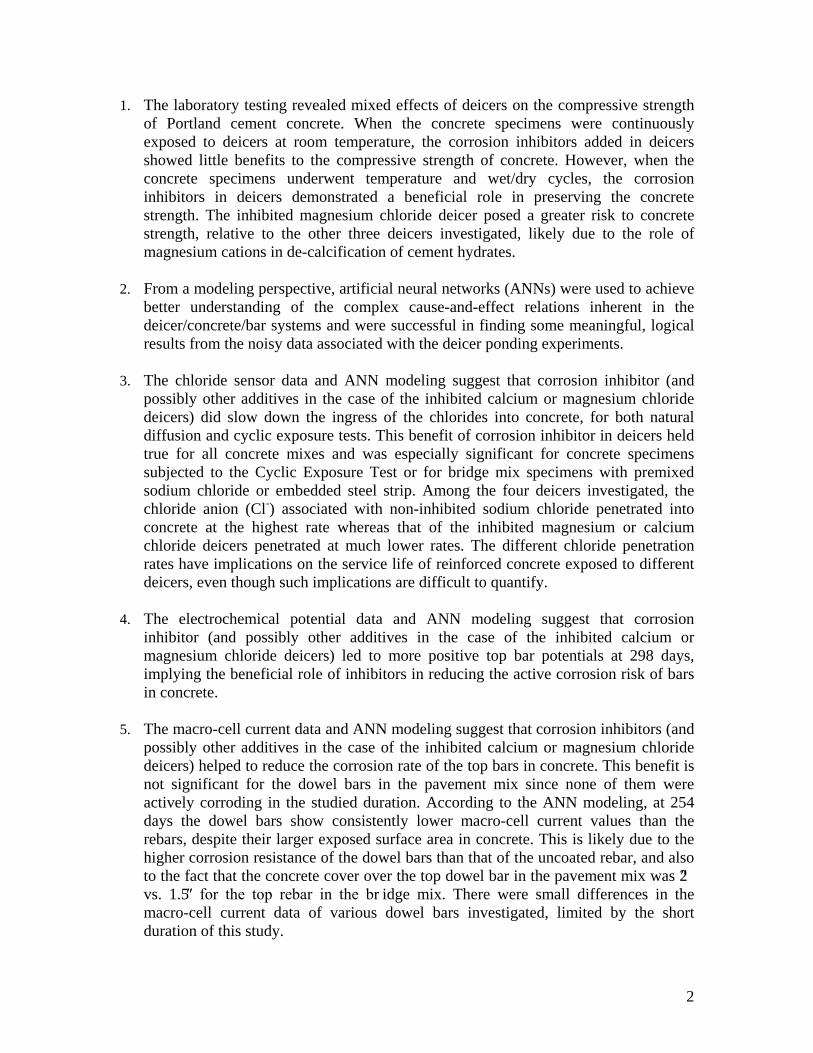
1. The laboratory testing revealed mixed effects of deicers on the compressive strength of Portland cement concrete. When the concrete specimens were continuously exposed to deicers at room temperature, the corrosion inhibitors added in deicers showed little benefits to the compressive strength of concrete. However, when the concrete specimens underwent temperature and wet/dry cycles, the corrosion inhibitors in deicers demonstrated a beneficial role in preserving the concrete strength. The inhibited magnesium chloride deicer posed a greater risk to concrete strength, relative to the other three deicers investigated, likely due to the role of magnesium cations in de-calcification of cement hydrates.
2. From a modeling perspective, artificial neural networks (ANNs) were used to achieve better understanding of the complex cause-and-effect relations inherent in the deicer/concrete/bar systems and were successful in finding some meaningful, logical results from the noisy data associated with the deicer ponding experiments.
3. The chloride sensor data and ANN modeling suggest that corrosion inhibitor (and
possibly other additives in the case of the inhibited calcium or magnesium chloride deicers) did slow down the ingress of the chlorides into concrete, for both natural diffusion and cyclic exposure tests. This benefit of corrosion inhibitor in deicers held true for all concrete mixes and was especially significant for concrete specimens subjected to the Cyclic Exposure Test or for bridge mix specimens with premixed sodium chloride or embedded steel strip. Among the four deicers investigated, the chloride anion (Cl-) associated with non-inhibited sodium chloride penetrated into concrete at the highest rate whereas that of the inhibited magnesium or calcium chloride deicers penetrated at much lower rates. The different chloride penetration rates have implications on the service life of reinforced concrete exposed to different deicers, even though such implications are difficult to quantify.
4. The electrochemical potential data and ANN modeling suggest that corrosion
inhibitor (and possibly other additives in the case of the inhibited calcium or magnesium chloride deicers) led to more positive top bar potentials at 298 days, implying the beneficial role of inhibitors in reducing the active corrosion risk of bars in concrete.
5. The macro-cell current data and ANN modeling suggest that corrosion inhibitors (and
possibly other additives in the case of the inhibited calcium or magnesium chloride deicers) helped to reduce the corrosion rate of the top bars in concrete. This benefit is not significant for the dowel bars in the pavement mix since none of them were actively corroding in the studied duration. According to the ANN modeling, at 254 days the dowel bars show consistently lower macro-cell current values than the rebars, despite their larger exposed surface area in concrete. This is likely due to the higher corrosion resistance of the dowel bars than that of the uncoated rebar, and also to the fact that the concrete cover over the top dowel bar in the pavement mix was 2″ vs. 1.5″ for the top rebar in the br idge mix. There were small differences in the macro-cell current data of various dowel bars investigated, limited by the short duration of this study.
3
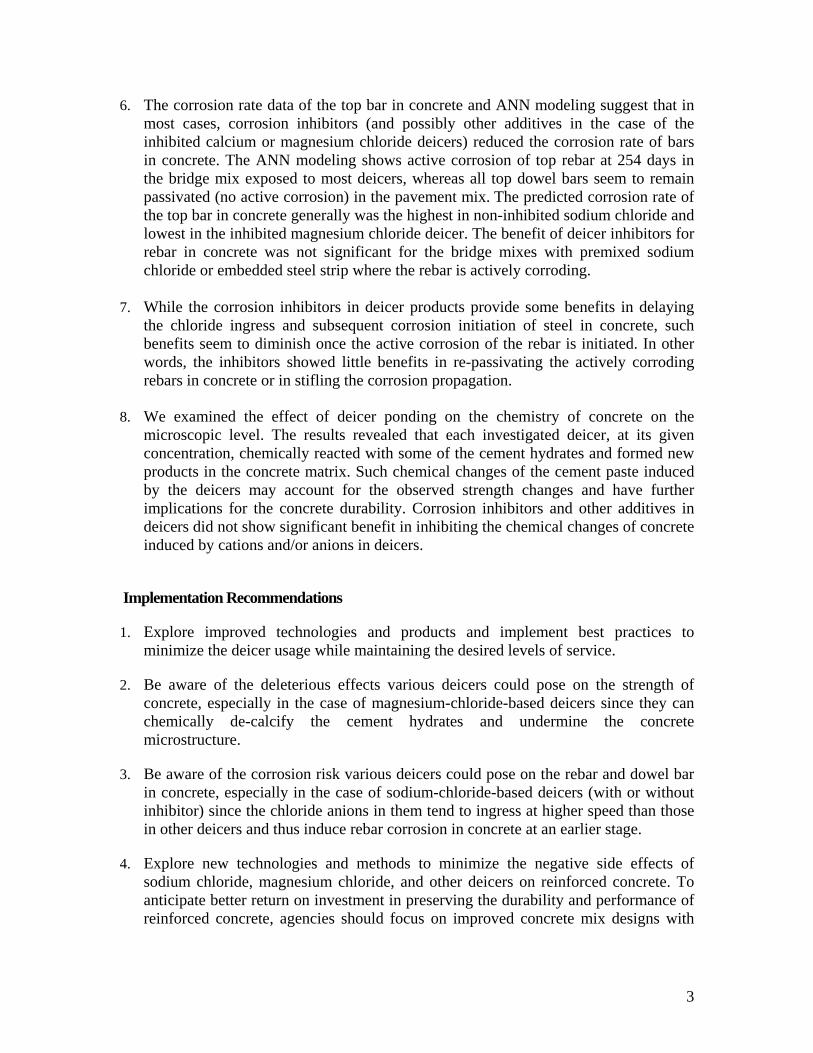
6. The corrosion rate data of the top bar in concrete and ANN modeling suggest that in most cases, corrosion inhibitors (and possibly other additives in the case of the inhibited calcium or magnesium chloride deicers) reduced the corrosion rate of bars in concrete. The ANN modeling shows active corrosion of top rebar at 254 days in the bridge mix exposed to most deicers, whereas all top dowel bars seem to remain passivated (no active corrosion) in the pavement mix. The predicted corrosion rate of the top bar in concrete generally was the highest in non-inhibited sodium chloride and lowest in the inhibited magnesium chloride deicer. The benefit of deicer inhibitors for rebar in concrete was not significant for the bridge mixes with premixed sodium chloride or embedded steel strip where the rebar is actively corroding.
7. While the corrosion inhibitors in deicer products provide some benefits in delaying
the chloride ingress and subsequent corrosion initiation of steel in concrete, such benefits seem to diminish once the active corrosion of the rebar is initiated. In other words, the inhibitors showed little benefits in re-passivating the actively corroding rebars in concrete or in stifling the corrosion propagation.
8. We examined the effect of deicer ponding on the chemistry of concrete on the
microscopic level. The results revealed that each investigated deicer, at its given concentration, chemically reacted with some of the cement hydrates and formed new products in the concrete matrix. Such chemical changes of the cement paste induced by the deicers may account for the observed strength changes and have further implications for the concrete durability. Corrosion inhibitors and other additives in deicers did not show significant benefit in inhibiting the chemical changes of concrete induced by cations and/or anions in deicers.
Implementation Recommendations
1. Explore improved technologies and products and implement best practices to minimize the deicer usage while maintaining the desired levels of service.
2. Be aware of the deleterious effects various deicers could pose on the strength of concrete, especially in the case of magnesium-chloride-based deicers since they can chemically de-calcify the cement hydrates and undermine the concrete microstructure.
3. Be aware of the corrosion risk various deicers could pose on the rebar and dowel bar in concrete, especially in the case of sodium-chloride-based deicers (with or without inhibitor) since the chloride anions in them tend to ingress at higher speed than those in other deicers and thus induce rebar corrosion in concrete at an earlier stage.
4. Explore new technologies and methods to minimize the negative side effects of sodium chloride, magnesium chloride, and other deicers on reinforced concrete. To anticipate better return on investment in preserving the durability and performance of reinforced concrete, agencies should focus on improved concrete mix designs with

4
less permeability (e.g., replacing Portland cement with fly ash, silica fume, and slag), instead of procuring the more costly (inhibited) deicers.
5. Encourage the inclusion of a test method for deicer impact on reinforced concrete into the existing test matrix used to evaluate and qualify deicer products, to facilitate a more holistic approach to selecting snow and ice control chemicals through performance-based specifications.
5
C H A PT E R 1. I NT R ODUC T I ON
1.1. Problem Statement
For northern United States, Canada and other cold-climate regions, snow and ice control operations are essential to maintain roadway safety, mobility and productivity by providing safe driving surfaces in the winter season. Depending on the severity of winter, the Washington State Department of Transportation (WSDOT) typically spends $25-30 million dollars for the winter maintenance operations, and millions of pounds of deicers1
It is a popular practice to add corrosion inhibitors and other additives to deicer products, and the WSDOT Salt Pilot project has field evaluated the relative corrosivity of non-inhibited and inhibited chloride deicers to bare metals [1]. However, little is known about the possible contribution or risk deicer inhibitors (and other additives) pose to infrastructure preservation. Chloride ingress into concrete is a complex process, which in the highway environment is further complicated by the freeze-thaw cycles and wet-dry cycles experienced by roadways and bridges. Therefore, research is needed to determine whether or not corrosion-inhibited deicers provide benefits in mitigating the corrosion of rebars or dowel bars in concrete, relative to the “straight salt” (non-inhibited sodium chloride).
(mainly sodium chloride and corrosion-inhibited sodium/magnesium/calcium chlorides) are applied on the roadways every winter. Like in many northern states, there are growing concerns in the state of Washington over the corrosive effects that deicers pose on its multi-billion-dollar transportation infrastructure, including thousands of miles of roadways (especially concrete pavements with dowel bars) and thousands of bridges exposed to deicer applications.
1.2. Background
1.2.1. Chemicals for Winter Road Maintenance
Deicers applied onto highways often contain chlorides as freezing-point depressants because of their cost-effectiveness, including mainly sodium chloride (NaCl), magnesium chloride (MgCl2), and calcium chloride (CaCl2), sometimes blended with proprietary corrosion inhibitors. A recent survey of highway maintenance agencies conducted by the Western Transportation Institute (WTI) indicated that NaCl was the most frequently used deicer, followed by abrasives, then MgCl2, agriculture-based products, CaCl2, and others. Less than 25% of the survey respondents used alternative deicers such as potassium acetate (KAc), sodium acetate (NaAc), calcium magnesium acetate (CMA), and potassium formate [2].
NaCl is the most widely used chemical due to its abundance and low cost, whereas MgCl2 brines are often used in place of NaCl because laboratory tests have demonstrated their better ice-melting performance at lower temperatures [3]. Field studies have shown
1 For simplicity, the term deicer will refer to all chemicals for anti-icing, de-icing, and pre-wetting operations.
6
CaCl2 to be more effective than NaCl, owing to its ability to attract moisture and stay on the roads [4]. However, some agencies choose not to use CaCl2 as it does not dry and can cause roads to become slippery under certain conditions [5]. Chlorides are generally considered the most corrosive winter maintenance chemicals. Acetates such as KAc and CMA have also been used for highway anti-icing applications. While generally much more expensive, KAc and CMA can be more effective, less corrosive to carbon steel, and pose less environmental risks than chlorides [2]. Also available are a variety of agriculture-based chemicals used either alone or as additives for other winter maintenance chemicals [6]. Agriculture-based additives increase cost but may provide enhanced ice-melting capacity, and/or last longer than standard chemicals when applied on roads [7]. However, while some studies indicate that such products reduce corrosion [8], our recent study of a specific product (which had significant amount of chlorides in it) showed that it can be as corrosive as traditional deicers [2].
Maintenance agencies are continually challenged to provide a high level of service (LOS) and improve safety and mobility of winter roads in a cost-effective manner while minimizing corrosion and other adverse effects to the environment. In 2007 the U.S. sold approximately 20.2 million tons of deicing salts for use in winter maintenance [9]. The growing use of deicers has raised concerns over their effects on motor vehicles, transportation infrastructure, and the environment [2]. Over five billion dollars are spent each year by state and local agencies to repair infrastructure damage caused by snow and ice control operations. When using chloride-based deicers for road maintenance, the average cost due to corrosion and environmental effects are estimated to be at least three times as high as the nominal cost [10]. A recent National Cooperative Highway Research Program (NCHRP) report identified the deicer corrosion to steel rebar as the primary concern, followed by detrimental effects to vehicles, concrete in general, structural steel, and roadside structures [11].
Dowel bars are used to provide a mechanism to transfer wheel loads from one concrete pavement slab to the next in a reliable and cost-effective manner, in order to reduce joint deflection and minimize distresses such as faulting, pumping and cracking. Chloride-based deicers also pose a significant risk for the durability, serviceability and performance of concrete pavements with dowel bars embedded.
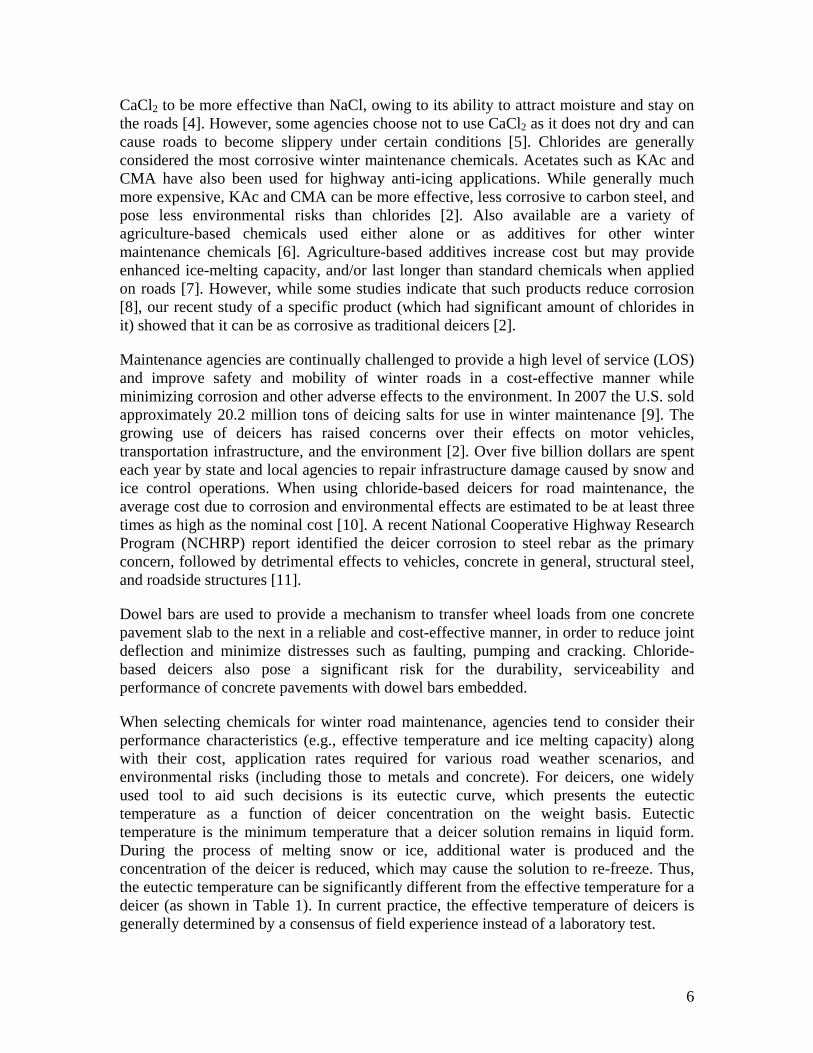
When selecting chemicals for winter road maintenance, agencies tend to consider their performance characteristics (e.g., effective temperature and ice melting capacity) along with their cost, application rates required for various road weather scenarios, and environmental risks (including those to metals and concrete). For deicers, one widely used tool to aid such decisions is its eutectic curve, which presents the eutectic temperature as a function of deicer concentration on the weight basis. Eutectic temperature is the minimum temperature that a deicer solution remains in liquid form. During the process of melting snow or ice, additional water is produced and the concentration of the deicer is reduced, which may cause the solution to re-freeze. Thus, the eutectic temperature can be significantly different from the effective temperature for a deicer (as shown in Table 1). In current practice, the effective temperature of deicers is generally determined by a consensus of field experience instead of a laboratory test.
7
Table 1. Comparison of eutectic and effective temperatures for common deicers [12]
Deicer
Eutectic Temperature, Teut
Minimum Effective Temperature, Teff
Source °C °F °C °F CaCl2 -51.6 -60.9 -35.0 -31.0 1 CaCl2 -51.1 -60 -28.9 -20 2 MgCl2 -33.3 -27.9 -20.0 -4.0 1 MgCl2 -33.3 -28 -15.0 5 2 Urea -11.7 10.9 -9.0 15.8 1 Urea -12.2 10 -3.9 25 2
Formamide -45.0 -49.0 -18.0 -0.4 1 NaCl -21.1 -6 -9.4 15 2 KAc -60.0 -76 -26.1 -15 2
CMA -27.2 -17 -6.1 21 2 CMA -10 14.0 -10 14.0 1
C2H6O2 (ethylene glycol) -51 -59.8 -23.3 -9.9 1
1 Resource Concepts Inc (1992) 2 Anonymous (2003)
1.2.2. Corrosion of Steel in Concrete and Concrete Permeability
For highway bridges and other reinforced concrete structures, the corrosion of reinforcing steel in concrete has been a major problem with serious economic and safety implications. Corrosive agents, liquid or gaseous, may penetrate the concrete through capillary absorption, hydrostatic pressure, or diffusion. The ingress of gases, water or ions in aqueous solutions into concrete takes place through pore spaces in the cement paste matrix and paste-aggregate interfaces or microcracks. For the durability of concrete, permeability is believed to be the most important characteristic [13], which is related to its microstructural properties, such as the size, distribution, and interconnection of pores and microcracks [14].
For reinforced concrete structures exposed to salt-laden environments, the chloride-induced corrosion of reinforcing steel is the major cause for their premature deterioration and degradation. Chloride ingress is one of the major forms of environmental attack for reinforced concrete bridges [15], which may induce corrosion of the reinforcing steel and a subsequent reduction in the strength, serviceability, and aesthetics of the structure. Chloride-induced corrosion of dowel bars is also a serious concern for reinforced pavements. Therefore, the chloride permeability of concrete has been recognized as a critical intrinsic property of the concrete [16].
There is a general agreement that the most effective measure for durability can be achieved at the design and materials selection stages by using adequate concrete cover and high quality concrete. Usually, an increase in concrete cover thickness leads to improved durability of reinforced concrete, as it enhances the barrier to the various aggressive species moving towards the reinforcement and increases the time for corrosion to initiate. In reality, however, the cover thickness cannot exceed certain limits, for mechanical and practical reasons [17].
8
1.2.3. Mechanisms of Steel Corrosion in Concrete
Concrete normally provides both chemical and physical protection for the steel reinforcement embedded in concrete. The cement hydration leads to the highly alkaline (pH 13-14) pore solution of concrete, which promotes the formation of an oxide/hydroxide film at the steel surface, a passive film of about 10 nanometers thick [18]. This protective film effectively insulates the steel and electrolytes so that the corrosion rate is negligible. In addition, the concrete cover prevents or at least retards the ingress of aggressive substances.
For the transportation infrastructure exposed to salt-laden environments, chloride ingress into concrete is of primary concern in terms of concrete durability. While the chloride ion (Cl-) has only a small influence on pore water pH, concentrations as low as 0.6 kilograms per cubic meter (kg/m3) (concrete weight basis) have been projected to compromise steel passivity [18]. Furthermore, the protection of steel by concrete is compromised by the gradual ingress of atmospheric carbon dioxide into the concrete, a process known as carbonation, which reduces the pore solution pH of carbonated concrete to the range of 8 to 9. The corrosion due to carbonation progresses at a much lower rate that that due to chloride ingress [19]. Concrete exposure to acids, sulfates and freeze-thaw cycles may also compromise the protection of steel.
Corrosion-induced concrete deterioration in the presence of Cl- generally proceeds in the following steps:
1. Ingress of chloride into the concrete, to a point where a critical concentration of Cl- results at the embedded reinforcement depth, known as the threshold chloride concentration, CT;
2. Local disruption of the passive film and onset of active corrosion, in the form of corrosion cells between the active corrosion zones (anode) and the surrounding still passive areas (cathode) [18,20];
Anode: Fe → Fe+2 + 2 e- (or: Fe + 2Cl- → FeCl2 + 2 e-)
Fe+2 + 2H2O → Fe(OH)2 + 2 H+
Cathode: O2 + 2H2O + 4 e- → 4OH-
Other possible reactions: Fe+2 + 2OH- → Fe(OH)2
4Fe(OH)2 + O2 → 4γ-FeOOH + 2H2O
4Fe(OH)2 + 2H2O + O2 → 4Fe(OH)3
2Fe(OH)3 → Fe2O3 + 3H2O
9
3. Accumulation of solid corrosion products (oxides/hydroxides) in the concrete pore space near the reinforcement and buildup of tensile hoop stresses around steel; and
4. Cracking or spalling of the concrete cover above the reinforcement.
Because of step 4, moisture, oxygen, and chlorides will gain more direct access to the embedded steel, and corrosion rate is further accelerated [21]. In step 2, for stable pit growth to be sustained, the relative concentrations of aggressive Cl- and inhibitive OH- should be above a certain ratio, otherwise repassivation will occur [22].
1.2.4. Transport of Chlorides and Inhibitors in Concrete: State of the Knowledge
This work started with a comprehensive literature review on topics relevant to this study. As detailed in Appendix A, we synthesized the information on existing research related to the transport of chlorides and inhibitors in concrete, which is valuable for understanding the chloride-induced corrosion of rebar or dowel bar in concrete. The various sections cover the measurement of chloride ingress into concrete, the challenges in assessing concrete durability from its chloride diffusivity, the inhibitor penetration into concrete, the computational models to simulate the transport of species in aqueous solution, water-unsaturated and water-saturated cementitious materials, and the service life modeling of reinforced concrete in salt-laden environments.
1.2.5. Deicer Impact on Concrete Performance and Durability
Both chloride-based and non-chloride-based deicers may pose detrimental effects on concrete infrastructure and thus reduce concrete integrity (as indicated by expansion, mass change and loss in the dynamic modulus of elasticity) and strength. Such risks of deicers on the durability of Portland Cement Concrete (PCC) structures and pavements exist through three main pathways: 1) physical deterioration of the concrete through such effects as salt scaling; 2) chemical reactions between deicers and cement paste (a cation-oriented process, especially in the presence of Mg2+ and Ca2+); and 3) deicers aggravating aggregate-cement reactions (including an anion-oriented process in the case of chlorides, acetates, and formates affecting alkali-silica reaction - ASR; and a cation-oriented process in the case of CaCl2 and MgCl2 affecting alkali-carbonate reaction - ACR). The use of proper air entrainment, high-quality cementitious materials and aggregates, and mineral admixtures is promising in mitigating the deicer impact on PCC. More details are provided in Appendix B and reference [23].
1.2.6. Deicer Corrosion to Metals in Transportation Infrastructure
Chemical deicers, especially those based on chlorides, may cause corrosion damage to the transportation infrastructure such as reinforced or pre-stressed concrete structures and steel bridges. One study has estimated that the use of road salts impose infrastructure corrosion costs of at least $615 per ton, vehicular corrosion costs of at least $113 per ton, aesthetic costs of $75 per ton if applied near environmentally sensitive areas, in addition to uncertain human health costs [24]. The estimated cost of installing corrosion protection measures in new bridges and repairing old bridges in the Snowbelt states is between $250
10
million and $650 million annually [25]. Parking garages, pavements, roadside hardware, and non-highway objects near winter maintenance activities are also exposed to the corrosive effects of road salts. It should be noted that any repairs to the infrastructure translate to costs for the user in terms of construction costs, traffic delays and lost productivity. Indirect costs are estimated to be greater than ten times the cost of corrosion maintenance, repair and rehabilitation [26].
For practical purposes, all chloride-based deicers were ranked equally high in terms of corrosion risk to the reinforcing steel in a recent NCHRP report [11], even though hygroscopic chlorides of magnesium and calcium can be more aggressive to the exposed metals than NaCl because of the longer time of wetness. The cation (Na+, Ca2+, or Mg2+) associated with Cl- also affects the pH value of the electrolyte and the chloride diffusion coefficient in concrete poses different levels of corrosion risk to the rebar in concrete. The relative corrosivity of deicers is dependent on many details related to the metal/deicer system. Therefore, no general conclusions should be made when ranking corrosion risks of different deicer products. Instead, it is important to note the test protocol employed, the metal coupons tested, the deicer concentrations, the test environment, etc. It is also extremely difficult to relate laboratory test results of corrosion resistance to the actual field performance of metals. There are many ways to manage the corrosive effects of deicers, such as: selection of high-quality concrete, adequate concrete cover and alternative reinforcement, control of the ingress and accumulation of deleterious species, injection of beneficial species into concrete, and use of non-corrosive deicer alternatives and optimal application rates. More details are provided in Appendix C and reference [27].
1.3. Study Objectives
The objectives of this research are to assess the effect of chloride-based deicers on rebars and dowel bars in concrete and to determine whether or not deicer corrosion inhibitors help preserve the transportation infrastructure. To this end, this research includes a comprehensive literature review on relevant topics and a laboratory investigation using reinforced concrete samples exposed to deicers (sodium chloride and corrosion-inhibited sodium/magnesium/calcium chlorides, assuming an average dilution factor of 100:31 from their eutectic concentration once applied). The laboratory investigation aims to simulate the effect of deicers on reinforced concrete in an accelerated manner, by either ponding the concrete samples with deicer solutions at room temperature, or incorporating pressurized ingress, wet-dry cycling and temperature cycling into the test regime. The chloride ingress over time will be monitored using a custom-made chloride sensor embedded in each concrete sample. Also periodically measured are the open circuit potential (OCP) of the top rebar or dowel bar and the macro-cell current flowing between the top bar and the bottom bar in concrete. Once the chloride sensor detects the arrival of sufficient chlorides near the top bar and the OCP data indicate the possible initiation of top bar corrosion, the corrosion rate of the top bar will also be periodically measured using non-destructive, electrochemical techniques. At the end of ponding experiments, core specimens will be taken from each sample to test the compressive strength of concrete. For samples continuously subjected to deicers at room temperature,
11
microscopic analyses will be conducted to examine the possible chemical changes in the cement paste.
1.4. How This Report Is Organized
The following chapter will discuss the methodology used in gathering and analyzing data from the laboratory investigation. Chapter 3 presents the chloride diffusion coefficient of various deicers in concrete, the compressive strength data of deicer-contaminated concrete and the laboratory testing results from deicer ponding experiments and associated analyses based on predictive models. Chapter 4 presents the Scanning Electron Microscopy/Energy-dispersive X-ray Spectroscopy (SEM/EDX) data for the concrete samples subjected to natural diffusion of deicers and the subsequent analysis of chemical changes of the cement paste. In general, each chapter is dedicated to a single theme. Finally, Chapter 5 summarizes the key findings from the previous five chapters and presents research needs identified from this project, followed by suggestions and recommendations for implementation by WSDOT. Appendices conclude this report.
1.5. References
[1] E.V. Baroga, 2002-2004 Salt Pilot Project. Final Report for the Washington State Department of Transportation. 2005.
[2] Shi, X., Fay, L., Gallaway, C., Volkening, K., Peterson, M.M., Pan, T., Creighton, A., Lawlor, C., Mumma, S., Liu, Y., and Nguyen, T.A. Evaluation of Alternate Anti-icing and Deicing Compounds Using Sodium Chloride and Magnesium Chloride as Baseline Deicers. Final Report for the Colorado Department of Transportation. Denver, CO. Report No. CDOT-2009-01. Feb. 2009.
[3] Ketcham, S.A., L.D. Minsk, R.R. Blackburn, and E.J. Fleege (1996). Manual of Practice for an Effective Anti-Icing Program: A Guide for Highway Winter Maintenance Personnel. Publication No. FHWA-RD-9-202. Army Cold Regions Research and Engineering Laboratory.
[4] Warrington, P.D (1998). Roadsalt and Winter Maintenance for British Columbia Municipalities. Best Management Practices to Protect Water Quality. Environmental Protection Agency, December 1998.
[5] Perchanok, M.S., D.G. Manning and J.J. Armstrong (1991). Highway De-Icers: Standards, Practices, and Research in the Province of Ontario. Research and Development Branch MOT. Mat-91-13.
[6] Nixon, W.A. and A.D. Williams (2001). A Guide for Selecting Anti-icing Chemicals. Ver. 1.0. IIHR Technical Report No. 420.
[7] Fischel, M. (2001). Evaluation of Selected Deicers Based on a Review of the Literature. The SeaCrest Group. Louisville, CO. Report Number CDOT-DTD-R-2001-15.
[8] Kahl, S. (2004).Agricultural By-Products for Anti-Icing and De-Icing Use in Michigan. SNOW04-009. Sixth International Symposium on Snow Removal and Ice Control Technology. Transportation Research Circular E-C063: Snow and Ice Control Technology. June 2004. pp 552-555.
[9] Salt Institute. http://www.saltinstitute.org/Production-industry/Facts-figures/U.S.-salt-production-sales. Accessed in July 2010.
12
[10] Shi, X. The Use of Road Salts for Highway Winter Maintenance: An Asset Management Perspective. 2005 ITE District 6 Annual Meeting. Kalispell, Montana. July 10-13, 2005.
[11] Levelton Consultants Ltd, Guidelines for the selection of snow and ice control materials to mitigate environmental impacts, NCHRP REPORT 577, National Cooperative Highway Research Program, Transportation research board of the national academies, Washington, D.C.
[12] Akin, M., and Shi, X. Development of Standardized Test Procedures for Evaluating Deicing Chemicals. Final report prepared for the Wisconsin Department of Transportation and the Clear Roads Program. March 2010.
[13] Baykal, M., Implementation of Durability Models for Portland Cement Concrete into Performance-Based Specifications. Austin, TX: The University of Texas at Austin. 2000.
[14] Savas, B., Effects of Microstructure on Durability of Concrete. Raleigh, NC: North Carolina State University. 1999.
[15] Samples, L. and J. Ramirez, Methods of Corrosion Protection and Durability of Concrete Bridge Decks Reinforced with Epoxy-Coated Bars, Phase I. FHWA/IN/JTRP-98/15. Purdue University, IN. 1999.
[16] Wee, T., A. Suryavanshi, and S. Tin, ACI Materials Journal, 97(2000): 221. [17] Bertolini L., B. Elsener, P. Pedeferri, and R. Polder. Corrosion of Steel in Concrete:
Prevention, Diagnosis, Repair. Wiley-VCH, Verlag GmbH & Co. KgaA, Weinheim. 2004.
[18] Hartt, W. and J. Nam, Critical Parameters for Corrosion Induced Deterioration of Marine Bridge Substructures in Florida, prepared for the Florida Department of Transportation. 2004.
[19] Basheer L., J. Kropp, and D.J. Cleland. Construction and Building Materials 15(2001): 93.
[20] Hausmann, D., Materials Performance 37(1998): 64. [21] Hartt, W., S. Charvin, and S. Lee, Influence of Permeability Reducing and
Corrosion Inhibiting Admixtures in Concrete upon Initiation of Salt Induced Embedded Metal Corrosion, prepared for the Florida Department of Transportation. 1999.
[22] Page C.L., N.R. Short, and W.R. Holden, Cement and Concrete Research 16(1986): 79.
[23] Shi, X., Akin, M., Pan. T., Fay, L., Liu, Y., and Yang, Z., The Open Civil Engineering Journal, 3(2009): 16-27.
[24] D. Vitaliano, J. Policy Anal. Mgmt. 11(3) (1992), 397-418. [25] Transportation Research Board, Highway de-icing: comparing salt and calcium
magnesium acetate. National Research Council. Special Report 235, 1991. [26] M. Yunovich, N.G. Thompson, T. Balvanyos, and L. Lave, Corrosion costs of
highway bridges, 2002. http://www.corrosioncost.com/pdf/highway.pdf, accessed in July 2007.
[27] Shi, X., Fay, L., Yang, Z., Nguyen, T.A., and Liu, Y. Corrosion Reviews, 27(1-2)(2009): 23-52.
13
C H A PT E R 2. M E T H ODOL OG Y
2.1. Experimental
2.1.1. Deicers of Interest
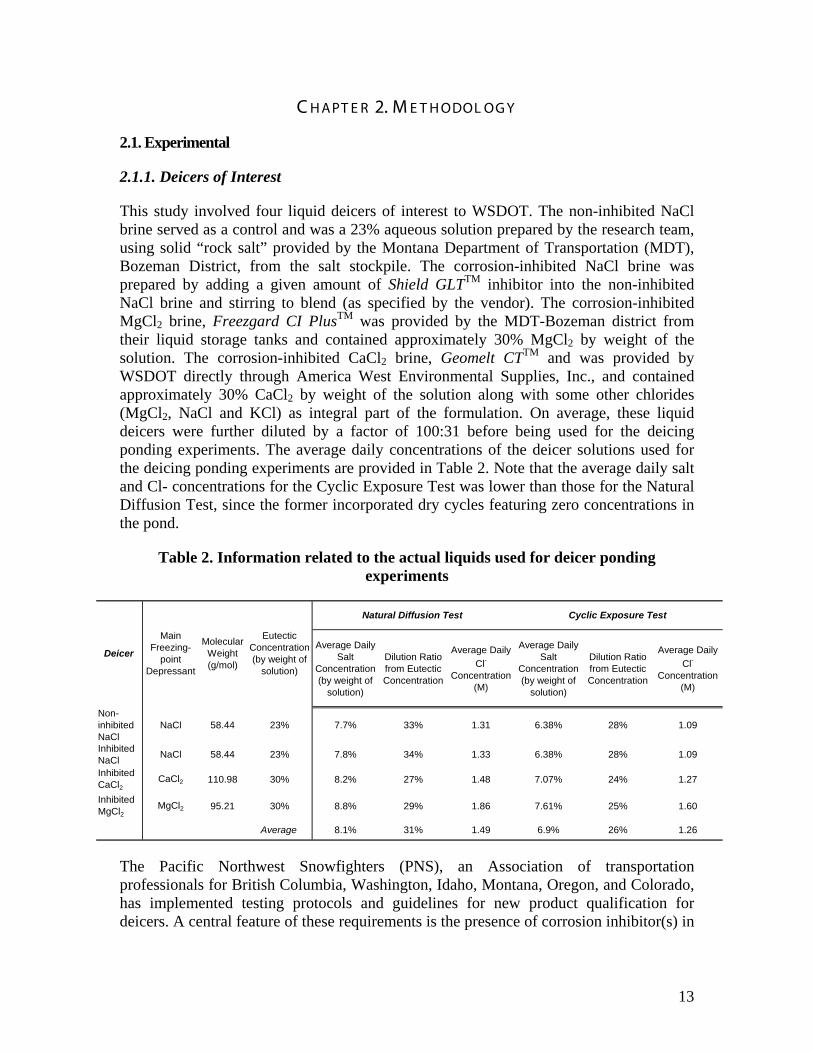
This study involved four liquid deicers of interest to WSDOT. The non-inhibited NaCl brine served as a control and was a 23% aqueous solution prepared by the research team, using solid “rock salt” provided by the Montana Department of Transportation (MDT), Bozeman District, from the salt stockpile. The corrosion-inhibited NaCl brine was prepared by adding a given amount of Shield GLTTM inhibitor into the non-inhibited NaCl brine and stirring to blend (as specified by the vendor). The corrosion-inhibited MgCl2 brine, Freezgard CI PlusTM was provided by the MDT-Bozeman district from their liquid storage tanks and contained approximately 30% MgCl2 by weight of the solution. The corrosion-inhibited CaCl2 brine, Geomelt CTTM and was provided by WSDOT directly through America West Environmental Supplies, Inc., and contained approximately 30% CaCl2 by weight of the solution along with some other chlorides (MgCl2, NaCl and KCl) as integral part of the formulation. On average, these liquid deicers were further diluted by a factor of 100:31 before being used for the deicing ponding experiments. The average daily concentrations of the deicer solutions used for the deicing ponding experiments are provided in Table 2. Note that the average daily salt and Cl- concentrations for the Cyclic Exposure Test was lower than those for the Natural Diffusion Test, since the former incorporated dry cycles featuring zero concentrations in the pond.
Table 2. Information related to the actual liquids used for deicer ponding experiments
Average Daily Salt
Concentration (by weight of
solution)
Dilution Ratio from Eutectic Concentration
Average Daily Cl-
Concentration (M)
Average Daily Salt
Concentration (by weight of
solution)
Dilution Ratio from Eutectic Concentration
Average Daily Cl-
Concentration (M)
Non-inhibited NaCl
NaCl 58.44 23% 7.7% 33% 1.31 6.38% 28% 1.09
Inhibited NaCl NaCl 58.44 23% 7.8% 34% 1.33 6.38% 28% 1.09
Inhibited CaCl2
CaCl2 110.98 30% 8.2% 27% 1.48 7.07% 24% 1.27
Inhibited MgCl2
MgCl2 95.21 30% 8.8% 29% 1.86 7.61% 25% 1.60
Average 8.1% 31% 1.49 6.9% 26% 1.26
Natural Diffusion Test Cyclic Exposure Test
Deicer
Main Freezing-
point Depressant
Molecular Weight (g/mol)
Eutectic Concentration (by weight of
solution)
The Pacific Northwest Snowfighters (PNS), an Association of transportation professionals for British Columbia, Washington, Idaho, Montana, Oregon, and Colorado, has implemented testing protocols and guidelines for new product qualification for deicers. A central feature of these requirements is the presence of corrosion inhibitor(s) in
14
deicers, and the qualification and evaluation of all deicers by a modified National Association of Corrosion Engineers (NACE) corrosion test.
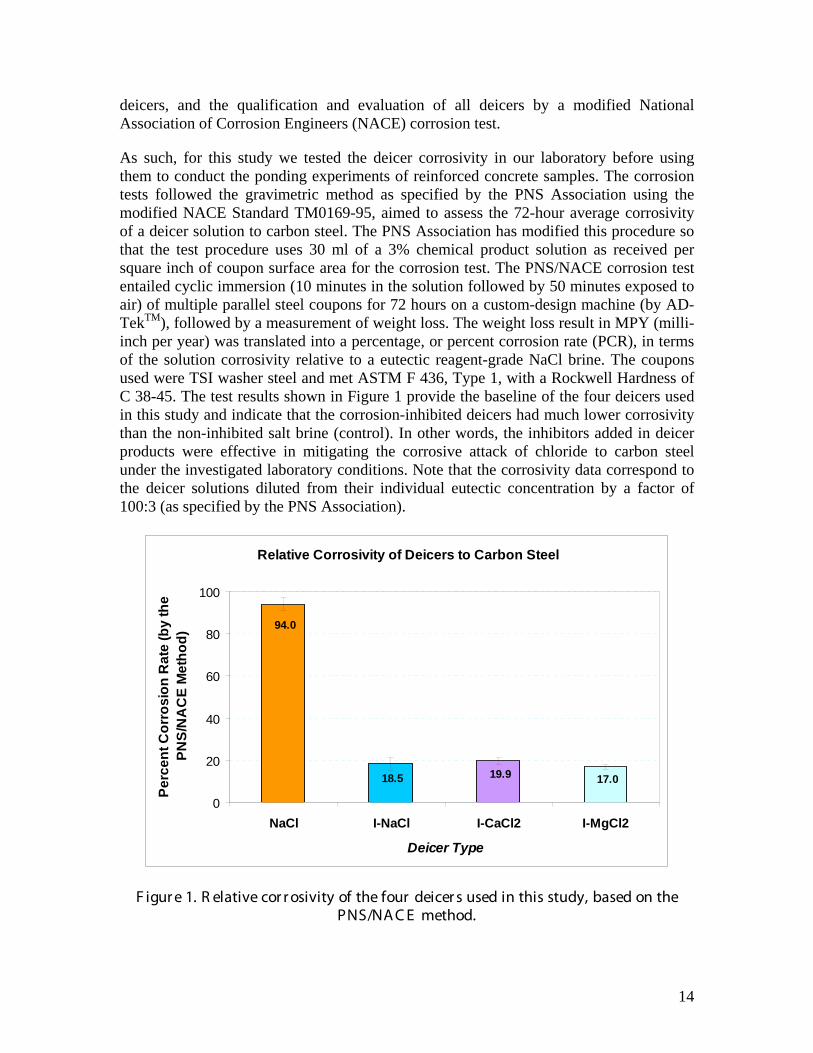
As such, for this study we tested the deicer corrosivity in our laboratory before using them to conduct the ponding experiments of reinforced concrete samples. The corrosion tests followed the gravimetric method as specified by the PNS Association using the modified NACE Standard TM0169-95, aimed to assess the 72-hour average corrosivity of a deicer solution to carbon steel. The PNS Association has modified this procedure so that the test procedure uses 30 ml of a 3% chemical product solution as received per square inch of coupon surface area for the corrosion test. The PNS/NACE corrosion test entailed cyclic immersion (10 minutes in the solution followed by 50 minutes exposed to air) of multiple parallel steel coupons for 72 hours on a custom-design machine (by AD-TekTM), followed by a measurement of weight loss. The weight loss result in MPY (milli-inch per year) was translated into a percentage, or percent corrosion rate (PCR), in terms of the solution corrosivity relative to a eutectic reagent-grade NaCl brine. The coupons used were TSI washer steel and met ASTM F 436, Type 1, with a Rockwell Hardness of C 38-45. The test results shown in Figure 1 provide the baseline of the four deicers used in this study and indicate that the corrosion-inhibited deicers had much lower corrosivity than the non-inhibited salt brine (control). In other words, the inhibitors added in deicer products were effective in mitigating the corrosive attack of chloride to carbon steel under the investigated laboratory conditions. Note that the corrosivity data correspond to the deicer solutions diluted from their individual eutectic concentration by a factor of 100:3 (as specified by the PNS Association).
Relative Corrosivity of Deicers to Carbon Steel
94.0
18.5 19.9 17.0
0
20
40
60
80
100
NaCl I-NaCl I-CaCl2 I-MgCl2
Deicer Type
Perc
ent C
orro
sion
Rat
e (b
y th
e PN
S/N
AC
E M
etho
d)
F igur e 1. R elative cor r osivity of the four deicer s used in this study, based on the PNS/NA C E method.
15
2.1.2. Design of Deicing Ponding Experiments
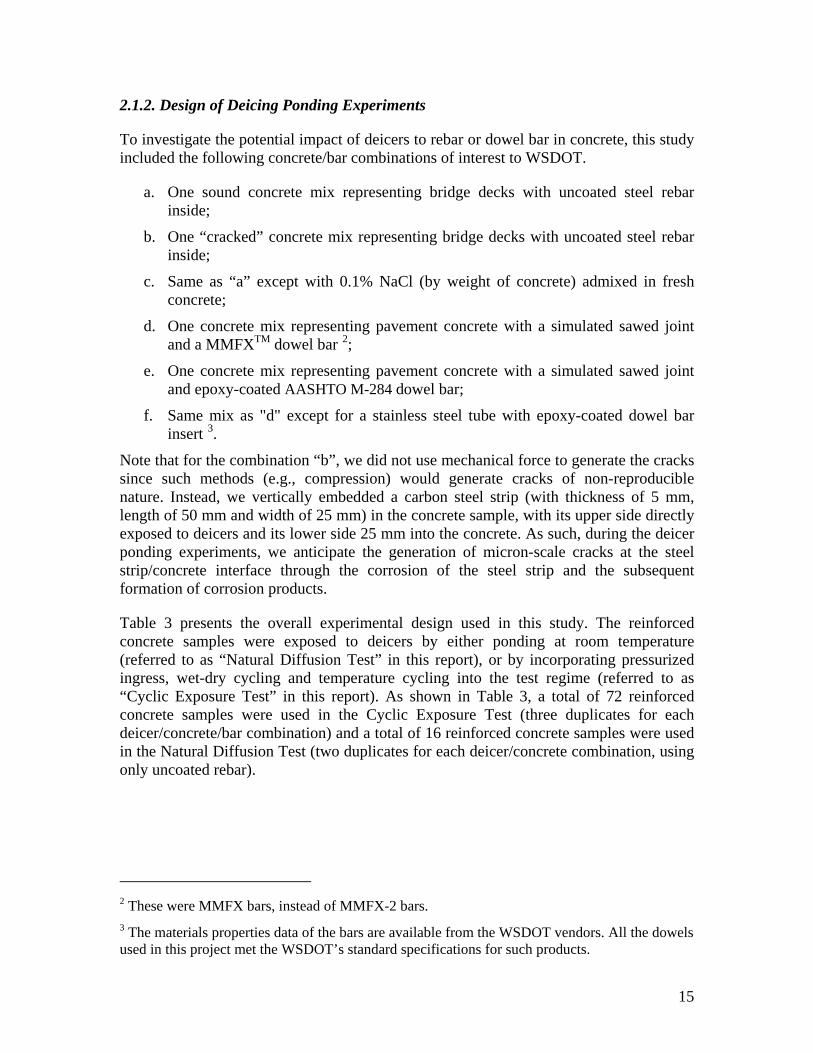
To investigate the potential impact of deicers to rebar or dowel bar in concrete, this study included the following concrete/bar combinations of interest to WSDOT.
a. One sound concrete mix representing bridge decks with uncoated steel rebar inside;
b. One “cracked” concrete mix representing bridge decks with uncoated steel rebar inside;
c. Same as “a” except with 0.1% NaCl (by weight of concrete) admixed in fresh concrete;
d. One concrete mix representing pavement concrete with a simulated sawed joint and a MMFXTM dowel bar 2
e. One concrete mix representing pavement concrete with a simulated sawed joint and epoxy-coated AASHTO M-284 dowel bar;
;
f. Same mix as "d" except for a stainless steel tube with epoxy-coated dowel bar insert 3
Note that for the combination “b”, we did not use mechanical force to generate the cracks since such methods (e.g., compression) would generate cracks of non-reproducible nature. Instead, we vertically embedded a carbon steel strip (with thickness of 5 mm, length of 50 mm and width of 25 mm) in the concrete sample, with its upper side directly exposed to deicers and its lower side 25 mm into the concrete. As such, during the deicer ponding experiments, we anticipate the generation of micron-scale cracks at the steel strip/concrete interface through the corrosion of the steel strip and the subsequent formation of corrosion products.
.
Table 3 presents the overall experimental design used in this study. The reinforced concrete samples were exposed to deicers by either ponding at room temperature (referred to as “Natural Diffusion Test” in this report), or by incorporating pressurized ingress, wet-dry cycling and temperature cycling into the test regime (referred to as “Cyclic Exposure Test” in this report). As shown in Table 3, a total of 72 reinforced concrete samples were used in the Cyclic Exposure Test (three duplicates for each deicer/concrete/bar combination) and a total of 16 reinforced concrete samples were used in the Natural Diffusion Test (two duplicates for each deicer/concrete combination, using only uncoated rebar).
2 These were MMFX bars, instead of MMFX-2 bars. 3 The materials properties data of the bars are available from the WSDOT vendors. All the dowels used in this project met the WSDOT’s standard specifications for such products.
16
Table 3. Design of deicer ponding experiments
Cyclic Exposure Test: 3 replicates each (totally 72 specimens in the environmental chamber)
Deicers
NaCl I-NaCl I-CaCl2 I-MgCl2
Bridge Mix
Uncoated Rebar 3 3 3 3 Uncoated Rebar w/
steel strip in concrete 3 3 3 3
Uncoated Rebar w/ 0.1wt.% admixed NaCl 3 3 3 3
Pavement Mix
Epoxy Coated Dowel 3 3 3 3 Stainless Steel Tube w/
Epoxy Coated Insert 3 3 3 3
MMFX Dowel Bar 3 3 3 3 Natural Diffusion Test: 2 replicates each (totally 16 specimens at room temperature)
Deicers
NaCl I-NaCl I-CaCl2 I-MgCl2 Bridge Mix Uncoated Rebar 2 2 2 2
Pavement Mix Uncoated Rebar 2 2 2 2
2.1.3. Concrete Samples: Materials and Preparation
For preparing the concrete samples used in this study, the mixing water, type I-II cement, coarse and fine aggregates, chemical admixtures, uncoated number 4 AASHTO M-31 rebars, epoxy-coated AASHTO M-284 dowel bars 4
The concrete samples used for the Cyclic Exposure Test had two bars in them and the distance between the top bar and the bottom bar was designed to be 1′′ (25.4 mm). The reinforced concrete samples used for the Natural Diffusion Test only had one bar in them. The thickness of concrete cover for both types of samples was determined in consultation with WSDOT, considering two main constraints. On the one hand, the cover should be thick enough to simulate actual bridge decks and pavements as well as accommodate the maximum aggregate size and the diameter of the bar in them. On the other hand, it is desirable to reduce the cover thickness in order to reduce the amount of time required for sufficient chlorides to reach the top bar surface and initiate its active corrosion.
, MMFX dowel bars, and stainless steel tubes with epoxy-coated dowel bar insert were obtained by WSDOT from various sources. The specific materials properties data of these bars are available from the individual WSDOT vendors per request.
4 Note that these dowel bars were of green color. The purple dowels shown in Figure 3a were ASTM A-934 epoxy dowels provided by a vendor for testing as add-on to this project.
17
This study used two concrete mixes, both obtained from Stoneway Concrete Inc., as shown in Table 4. The concrete mixes had no fly ash included, in order to simulate the WSDOT roadway pavements and bridge decks built before 1980. Note that the designed water-to-cement (w/c) ratio was 0.39 and 0.38 for the pavement and bridge mixes respectively.
Table 4. Mix design used for this study: (a) pavement samples; (b) bridge samples.
The dowel bars had the dimension of length 18′′× diameter 1.5′′ (L×D: 457.2×38.1 mm) and had a concrete cover of 2′′ (50.8 mm) over the top bar 5
The optimum dimensions of the concrete samples were selected considering all the constraints imposed by the optimum design, such as the maximum aggregate size, weight of the cured specimen, bar dimensions and locations, transport distance of deicer solution from the pond to the top bar, and location of the chloride sensor. The pavement concrete samples used for the Cyclic Exposure Test had a rectangular shape and final dimensions of 16′′×12′′×9′′ (L×W×H: 406×305×229 mm), with a pond 2.5′′ (63.5 mm) deep in its
. In light of the fact that most mix designs for WSDOT roadway pavements have a maximum aggregate size of 1.5′′ (38.1 mm) to guarantee sufficient strength, a pavement mix design with a maximum aggregate size of 1.5′′ (38.1 mm) was used. The rebars had the dimension of length 18′′× diameter 0.5′′ (L×D: 457.2×12.7 mm) and had a concrete cover of 1.5′′ (38.1 mm) over the top bar. A bridge mix design with a maximum aggregate size of 0.75′′ (19 mm) was used to minimize the sample size and to minimize the risk of hydration cracking.
5 In this study, the fabrication of concrete specimens with dowel bars did not include a crack to simulate a transverse joint. In other words, the sawed joint was embedded in concrete. As such, the research is focused on the penetration of deicers through the concrete pavement before they reach the dowel bar surface. In practice, however, dowel bars could be in direct contact with the deicers applied in the environment, through the transverse joints.
18
upper portion. A custom-made wooden mold used for fabricating such samples is shown in Figure 2a.
(a)
(b)
(c)
F igur e 2. (a) A custom-made wooden mold used to fabr icate the r einfor ced pavement samples; (b) a por tion of the mold to make the pond; (c) a fabr icated
concr ete sample with the ponding mold not yet r emoved
This designed mold gave the fabricated concrete samples walls of 3′′ (76 mm) thickness around the pond, with reinforcing bolts in the walls. This design survived a pressure of 10 psi during the mock tests without showing any noticeable cracking and maintained the pressure in the enclosed pond relatively well. The pond was made by embedding a wooden mold (see Figure 2b) in the upper portion of the concrete specimen during casting, and then removing it two days after the concrete casting, leaving a “pond” with dimension of 10′′×6′′×2.5′′ (254×152.4×63.5 mm) in length, width and height respectively. Figure 3c shows a fabricated concrete sample with the ponding mold not yet removed. Note that a plastic ponding mold would have greatly facilitated its de-molding.
In addition, the bridge concrete samples used for the Cyclic Exposure Test had a rectangular shape and final dimensions of 16′′×12′′×7.5′′ (L×W×H: 406×305×190 mm). The reinforced concrete samples used for the Natural Diffusion Test had a rectangular shape and final dimensions of 16′′×12′′×7.5′′ (L×W×H: 406×305×190 mm) and 16′′×12′′×5′′ (406×305×127 mm) respectively, for the pavement and bridge mixes respectively, with a pond 2.5′′ (63.5 mm) deep in its upper portion.
19
In October 2006, the concrete specimens were cast at a job site of Stoneway Concrete Inc. in Seattle, WA, by the research team with assistance from Stoneway personnel 6
Figure 3
. All concrete specimens, according to the design of experiments in Table 3, were fabricated with the received rebars, dowel bars, as well as the custom-made specimen molds and custom-made chloride sensors. shows some of the concrete samples during and after the fabrication process. To allow some redundancy, a total of 78 samples were cast for the pavement mix and 63 were cast for the bridge mix 7.
(a) 8
(b)
F igur e 3. Some pavement samples (a) dur ing and (b) after the fabr ication pr ocess (including pour ing and vibr ation).
6 The process of concrete casting was also witnessed by a WSDOT representative, Jim Weston from the WSDOT Material Laboratory, who also provided valuable advice for ensuring the quality of concrete samples. 7 These numbers do not account for the additional samples fabricated for the add-on project. 8 Note that the purple dowels shown here were ASTM A-934 epoxy dowels provided by a vendor for testing as add-on to this project.
20
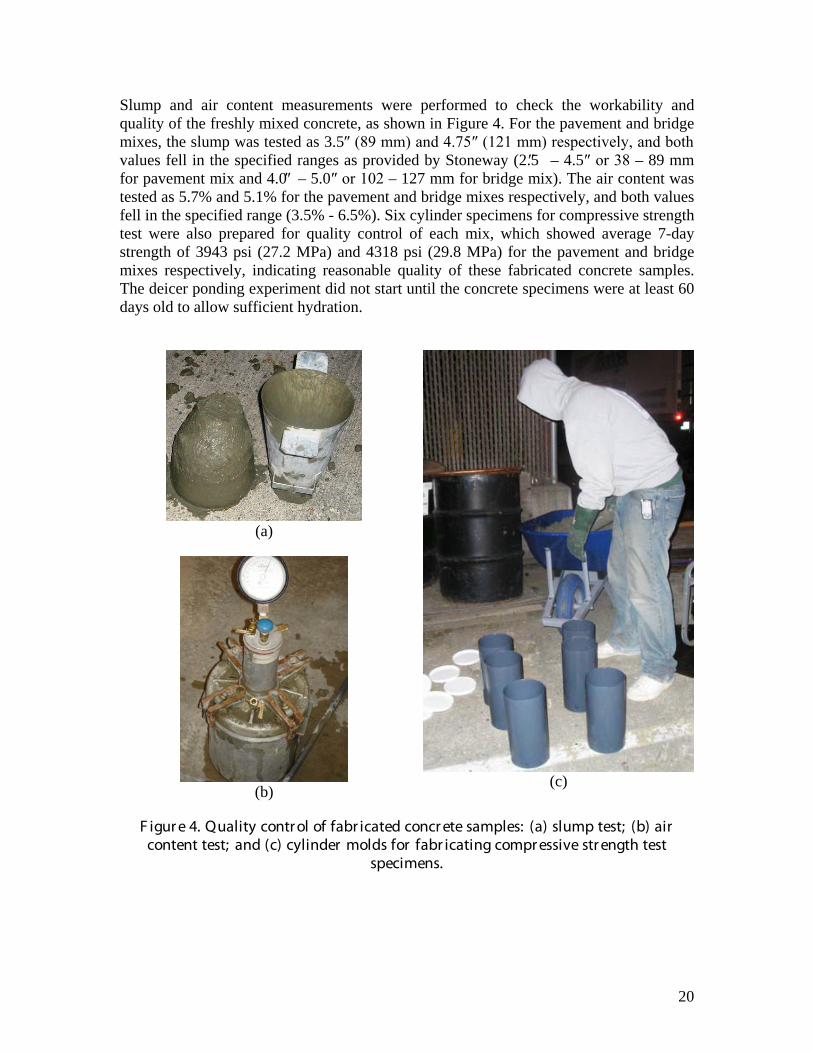
Slump and air content measurements were performed to check the workability and quality of the freshly mixed concrete, as shown in Figure 4. For the pavement and bridge mixes, the slump was tested as 3.5″ (89 mm) and 4.75″ (121 mm) respectively, and both values fell in the specified ranges as provided by Stoneway (2.5″ – 4.5″ or 38 – 89 mm for pavement mix and 4.0″ – 5.0″ or 102 – 127 mm for bridge mix). The air content was tested as 5.7% and 5.1% for the pavement and bridge mixes respectively, and both values fell in the specified range (3.5% - 6.5%). Six cylinder specimens for compressive strength test were also prepared for quality control of each mix, which showed average 7-day strength of 3943 psi (27.2 MPa) and 4318 psi (29.8 MPa) for the pavement and bridge mixes respectively, indicating reasonable quality of these fabricated concrete samples. The deicer ponding experiment did not start until the concrete specimens were at least 60 days old to allow sufficient hydration.
(a)
(b)
(c)
F igur e 4. Quality contr ol of fabr icated concr ete samples: (a) slump test; (b) air content test; and (c) cylinder molds for fabr icating compr essive str ength test
specimens.
21
2.1.4. Chloride Sensors
The chloride ingress over time was monitored using a custom-made chloride sensor embedded in each concrete sample. Chloride sensors made of silver/silver chloride (Ag/AgCl) electrodes were fabricated in our laboratory using an electro-deposition process. First, the silver wire was sanded and cleaned, followed by the measurement of its diameter. Then, it is mounted in a 0.2M potassium chloride (KCl) solution along with a clean graphite rod, with them connected to the positive and negative end of a computer-controlled Princeton Applied ResearchTM Potentiostat (serving as the power source). A constant current is applied by the Potentiostat to provide a 1 mA/cm2 current density on the silver wire for one hour (to deposit a silver chloride layer on it), followed by the rinsing of the electroplated silver wire.
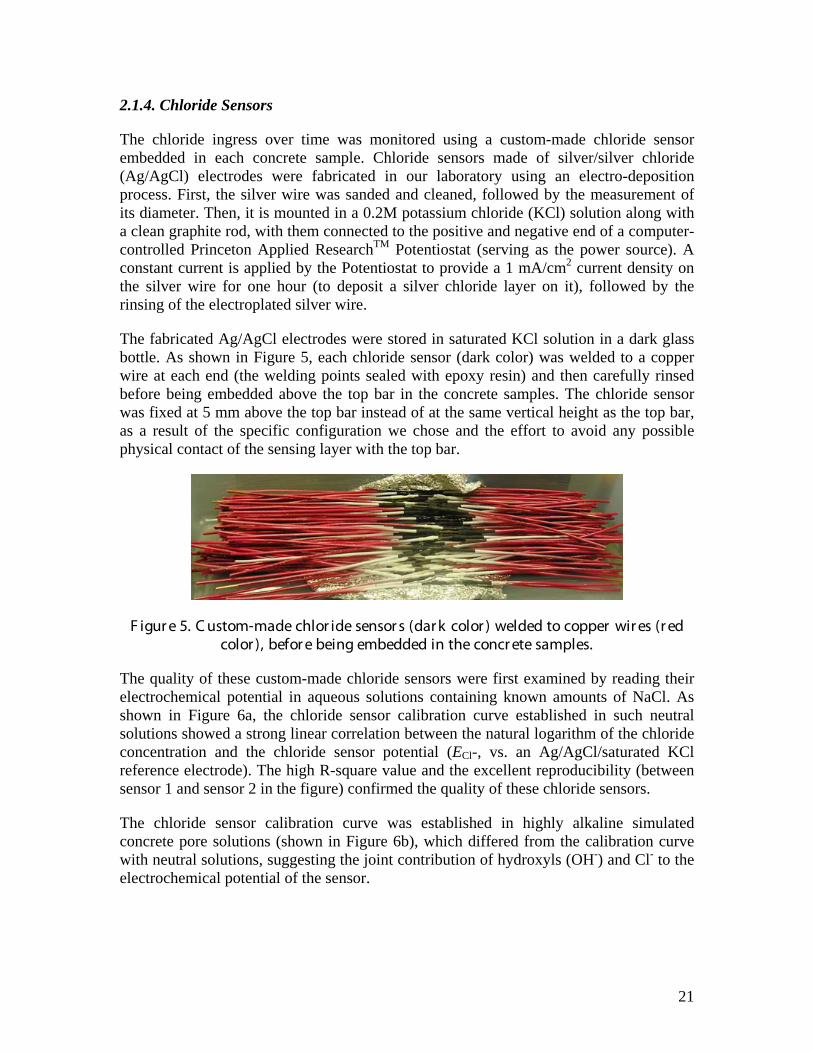
The fabricated Ag/AgCl electrodes were stored in saturated KCl solution in a dark glass bottle. As shown in Figure 5, each chloride sensor (dark color) was welded to a copper wire at each end (the welding points sealed with epoxy resin) and then carefully rinsed before being embedded above the top bar in the concrete samples. The chloride sensor was fixed at 5 mm above the top bar instead of at the same vertical height as the top bar, as a result of the specific configuration we chose and the effort to avoid any possible physical contact of the sensing layer with the top bar.
F igur e 5. C ustom-made chlor ide sensor s (dar k color ) welded to copper wir es (r ed color ), befor e being embedded in the concr ete samples.
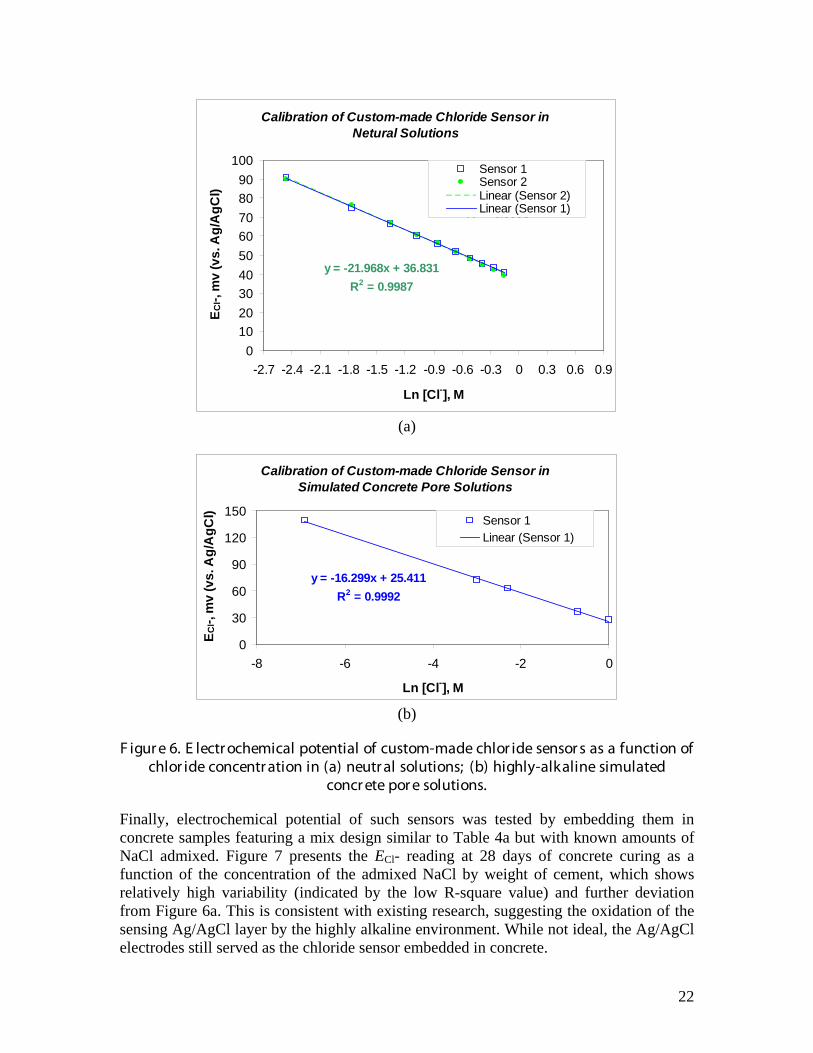
The quality of these custom-made chloride sensors were first examined by reading their electrochemical potential in aqueous solutions containing known amounts of NaCl. As shown in Figure 6a, the chloride sensor calibration curve established in such neutral solutions showed a strong linear correlation between the natural logarithm of the chloride concentration and the chloride sensor potential (ECl-, vs. an Ag/AgCl/saturated KCl reference electrode). The high R-square value and the excellent reproducibility (between sensor 1 and sensor 2 in the figure) confirmed the quality of these chloride sensors.
The chloride sensor calibration curve was established in highly alkaline simulated concrete pore solutions (shown in Figure 6b), which differed from the calibration curve with neutral solutions, suggesting the joint contribution of hydroxyls (OH-) and Cl- to the electrochemical potential of the sensor.
22
Calibration of Custom-made Chloride Sensor in Netural Solutions
y = -21.968x + 36.831R2 = 0.9987
y = -21.617x + 37.254R2 = 0.9998
0102030405060708090
100
-2.7 -2.4 -2.1 -1.8 -1.5 -1.2 -0.9 -0.6 -0.3 0 0.3 0.6 0.9
Ln [Cl-], M
E Cl-,
mv
(vs.
Ag/
AgC
l)
Sensor 1Sensor 2Linear (Sensor 2)Linear (Sensor 1)
(a)
Calibration of Custom-made Chloride Sensor in Simulated Concrete Pore Solutions
y = -16.299x + 25.411R2 = 0.9992
0
30
60
90
120
150
-8 -6 -4 -2 0
Ln [Cl-], M
E Cl-,
mv
(vs.
Ag/
AgC
l) Sensor 1Linear (Sensor 1)
(b)
F igur e 6. E lectr ochemical potential of custom-made chlor ide sensor s as a function of chlor ide concentr ation in (a) neutr al solutions; (b) highly-alkaline simulated
concr ete por e solutions.
Finally, electrochemical potential of such sensors was tested by embedding them in concrete samples featuring a mix design similar to Table 4a but with known amounts of NaCl admixed. Figure 7 presents the ECl- reading at 28 days of concrete curing as a function of the concentration of the admixed NaCl by weight of cement, which shows relatively high variability (indicated by the low R-square value) and further deviation from Figure 6a. This is consistent with existing research, suggesting the oxidation of the sensing Ag/AgCl layer by the highly alkaline environment. While not ideal, the Ag/AgCl electrodes still served as the chloride sensor embedded in concrete.
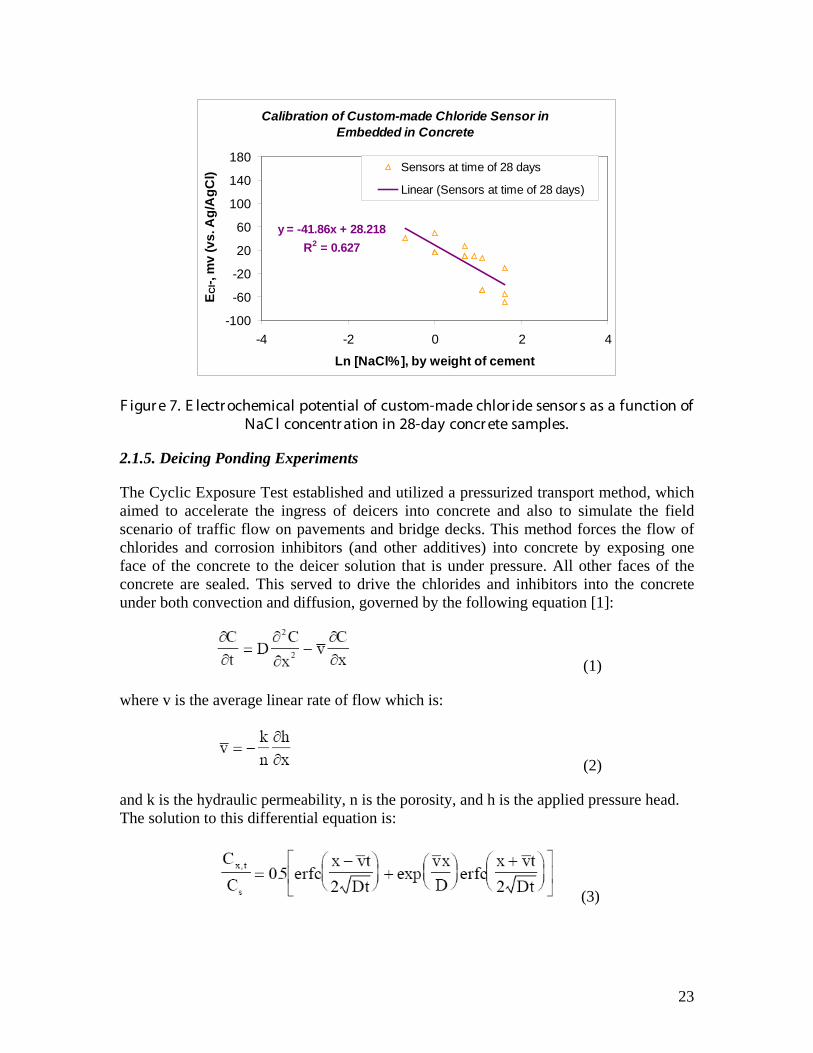
23
Calibration of Custom-made Chloride Sensor in Embedded in Concrete
y = -41.86x + 28.218R2 = 0.627
-100
-60
-20
20
60
100
140
180
-4 -2 0 2 4
Ln [NaCl%], by weight of cement
E Cl-,
mv
(vs.
Ag/
AgC
l) Sensors at time of 28 days
Linear (Sensors at time of 28 days)
F igur e 7. E lectr ochemical potential of custom-made chlor ide sensor s as a function of NaC l concentr ation in 28-day concr ete samples.
2.1.5. Deicing Ponding Experiments
The Cyclic Exposure Test established and utilized a pressurized transport method, which aimed to accelerate the ingress of deicers into concrete and also to simulate the field scenario of traffic flow on pavements and bridge decks. This method forces the flow of chlorides and corrosion inhibitors (and other additives) into concrete by exposing one face of the concrete to the deicer solution that is under pressure. All other faces of the concrete are sealed. This served to drive the chlorides and inhibitors into the concrete under both convection and diffusion, governed by the following equation [1]:
(1)
where v is the average linear rate of flow which is:
(2)
and k is the hydraulic permeability, n is the porosity, and h is the applied pressure head. The solution to this differential equation is:
(3)
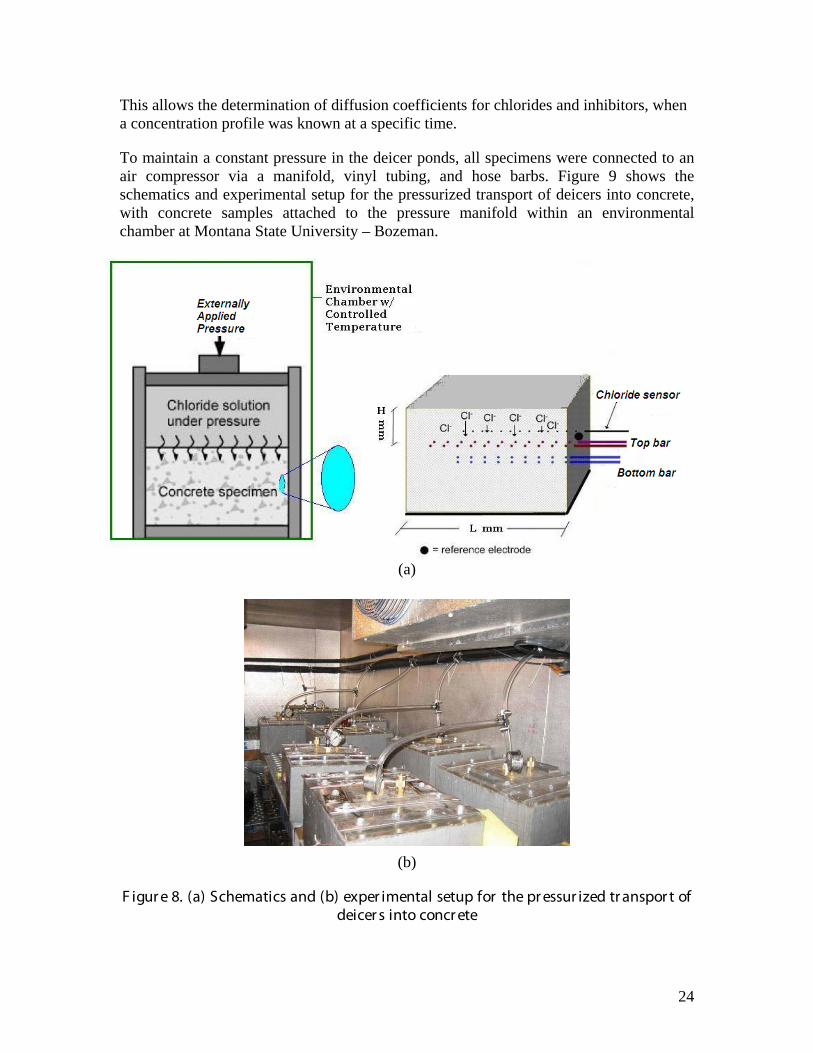
24
This allows the determination of diffusion coefficients for chlorides and inhibitors, when a concentration profile was known at a specific time.
To maintain a constant pressure in the deicer ponds, all specimens were connected to an air compressor via a manifold, vinyl tubing, and hose barbs. Figure 9 shows the schematics and experimental setup for the pressurized transport of deicers into concrete, with concrete samples attached to the pressure manifold within an environmental chamber at Montana State University – Bozeman.
(a)
(b)
F igur e 8. (a) Schematics and (b) exper imental setup for the pr essur ized tr anspor t of deicer s into concr ete
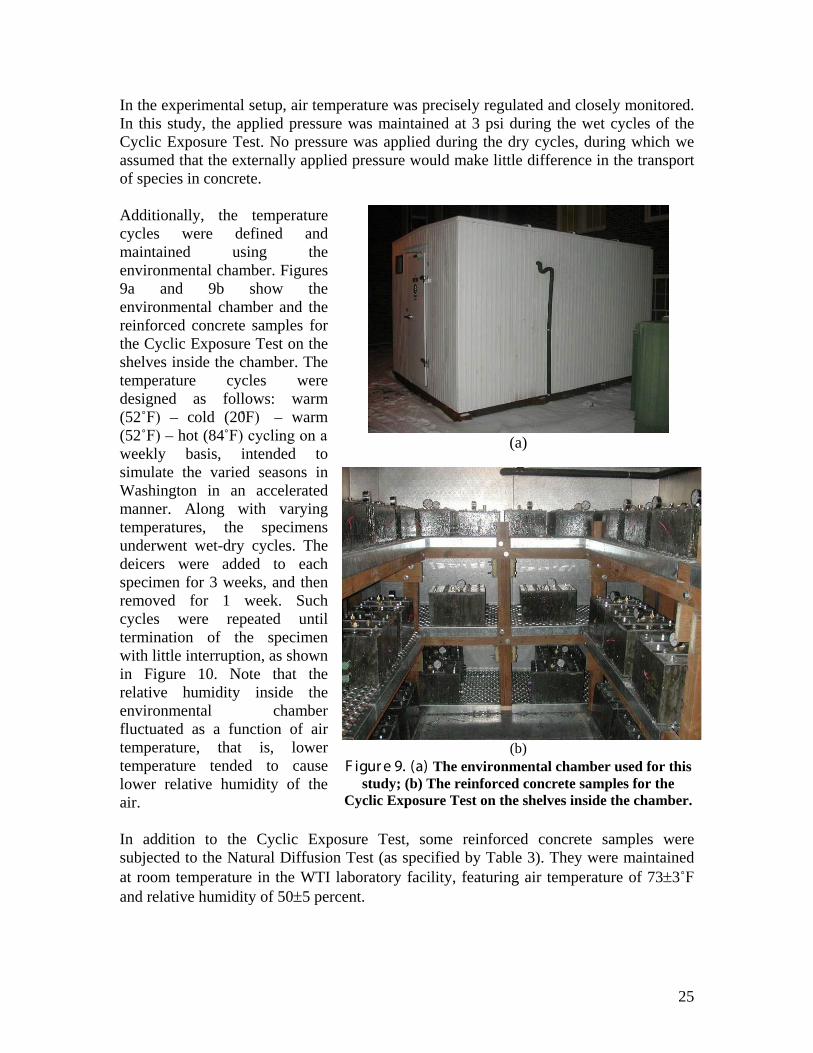
25
In the experimental setup, air temperature was precisely regulated and closely monitored. In this study, the applied pressure was maintained at 3 psi during the wet cycles of the Cyclic Exposure Test. No pressure was applied during the dry cycles, during which we assumed that the externally applied pressure would make little difference in the transport of species in concrete. Additionally, the temperature cycles were defined and maintained using the environmental chamber. Figures 9a and 9b show the environmental chamber and the reinforced concrete samples for the Cyclic Exposure Test on the shelves inside the chamber. The temperature cycles were designed as follows: warm (52˚F) – cold (20̊F) – warm (52˚F) – hot (84˚F) cycling on a weekly basis, intended to simulate the varied seasons in Washington in an accelerated manner. Along with varying temperatures, the specimens underwent wet-dry cycles. The deicers were added to each specimen for 3 weeks, and then removed for 1 week. Such cycles were repeated until termination of the specimen with little interruption, as shown in Figure 10. Note that the relative humidity inside the environmental chamber fluctuated as a function of air temperature, that is, lower temperature tended to cause lower relative humidity of the air.
(a)
(b)
F igur e 9. (a) The environmental chamber used for this study; (b) The reinforced concrete samples for the
Cyclic Exposure Test on the shelves inside the chamber.
In addition to the Cyclic Exposure Test, some reinforced concrete samples were subjected to the Natural Diffusion Test (as specified by Table 3). They were maintained at room temperature in the WTI laboratory facility, featuring air temperature of 73±3˚F and relative humidity of 50±5 percent.
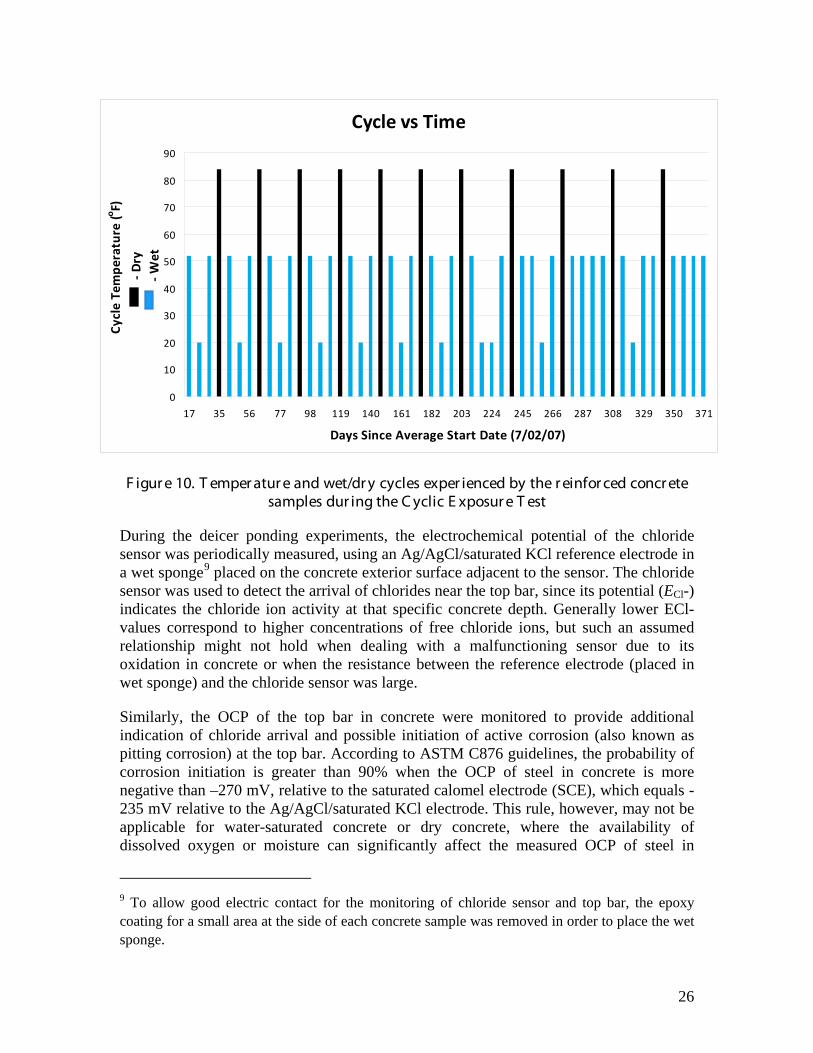
26
Cycle vs Time
0
10
20
30
40
50
60
70
80
90
17 35 56 77 98 119 140 161 182 203 224 245 266 287 308 329 350 371
Days Since Average Start Date (7/02/07)
Cycl
e Te
mpe
ratu
re (o F)
- D
ry -
Wet
F igur e 10. T emper atur e and wet/dr y cycles exper ienced by the r einfor ced concr ete samples dur ing the C yclic E xposur e T est
During the deicer ponding experiments, the electrochemical potential of the chloride sensor was periodically measured, using an Ag/AgCl/saturated KCl reference electrode in a wet sponge9
Similarly, the OCP of the top bar in concrete were monitored to provide additional indication of chloride arrival and possible initiation of active corrosion (also known as pitting corrosion) at the top bar. According to ASTM C876 guidelines, the probability of corrosion initiation is greater than 90% when the OCP of steel in concrete is more negative than –270 mV, relative to the saturated calomel electrode (SCE), which equals -235 mV relative to the Ag/AgCl/saturated KCl electrode. This rule, however, may not be applicable for water-saturated concrete or dry concrete, where the availability of dissolved oxygen or moisture can significantly affect the measured OCP of steel in
placed on the concrete exterior surface adjacent to the sensor. The chloride sensor was used to detect the arrival of chlorides near the top bar, since its potential (ECl-) indicates the chloride ion activity at that specific concrete depth. Generally lower ECl- values correspond to higher concentrations of free chloride ions, but such an assumed relationship might not hold when dealing with a malfunctioning sensor due to its oxidation in concrete or when the resistance between the reference electrode (placed in wet sponge) and the chloride sensor was large.
9 To allow good electric contact for the monitoring of chloride sensor and top bar, the epoxy coating for a small area at the side of each concrete sample was removed in order to place the wet sponge.
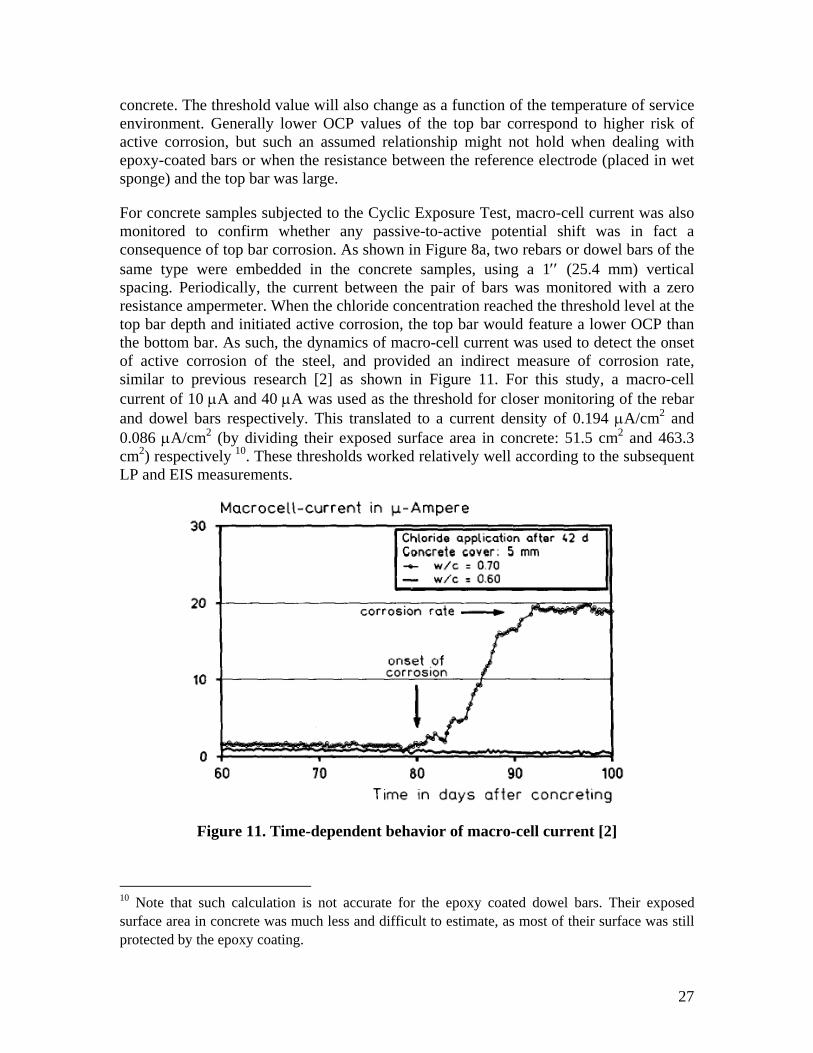
27
concrete. The threshold value will also change as a function of the temperature of service environment. Generally lower OCP values of the top bar correspond to higher risk of active corrosion, but such an assumed relationship might not hold when dealing with epoxy-coated bars or when the resistance between the reference electrode (placed in wet sponge) and the top bar was large.
For concrete samples subjected to the Cyclic Exposure Test, macro-cell current was also monitored to confirm whether any passive-to-active potential shift was in fact a consequence of top bar corrosion. As shown in Figure 8a, two rebars or dowel bars of the same type were embedded in the concrete samples, using a 1′′ (25.4 mm) vertical spacing. Periodically, the current between the pair of bars was monitored with a zero resistance ampermeter. When the chloride concentration reached the threshold level at the top bar depth and initiated active corrosion, the top bar would feature a lower OCP than the bottom bar. As such, the dynamics of macro-cell current was used to detect the onset of active corrosion of the steel, and provided an indirect measure of corrosion rate, similar to previous research [2] as shown in Figure 11. For this study, a macro-cell current of 10 µA and 40 µA was used as the threshold for closer monitoring of the rebar and dowel bars respectively. This translated to a current density of 0.194 µA/cm2 and 0.086 µA/cm2 (by dividing their exposed surface area in concrete: 51.5 cm2 and 463.3 cm2) respectively 10. These thresholds worked relatively well according to the subsequent LP and EIS measurements.
Figure 11. Time-dependent behavior of macro-cell current [2]
10 Note that such calculation is not accurate for the epoxy coated dowel bars. Their exposed surface area in concrete was much less and difficult to estimate, as most of their surface was still protected by the epoxy coating.
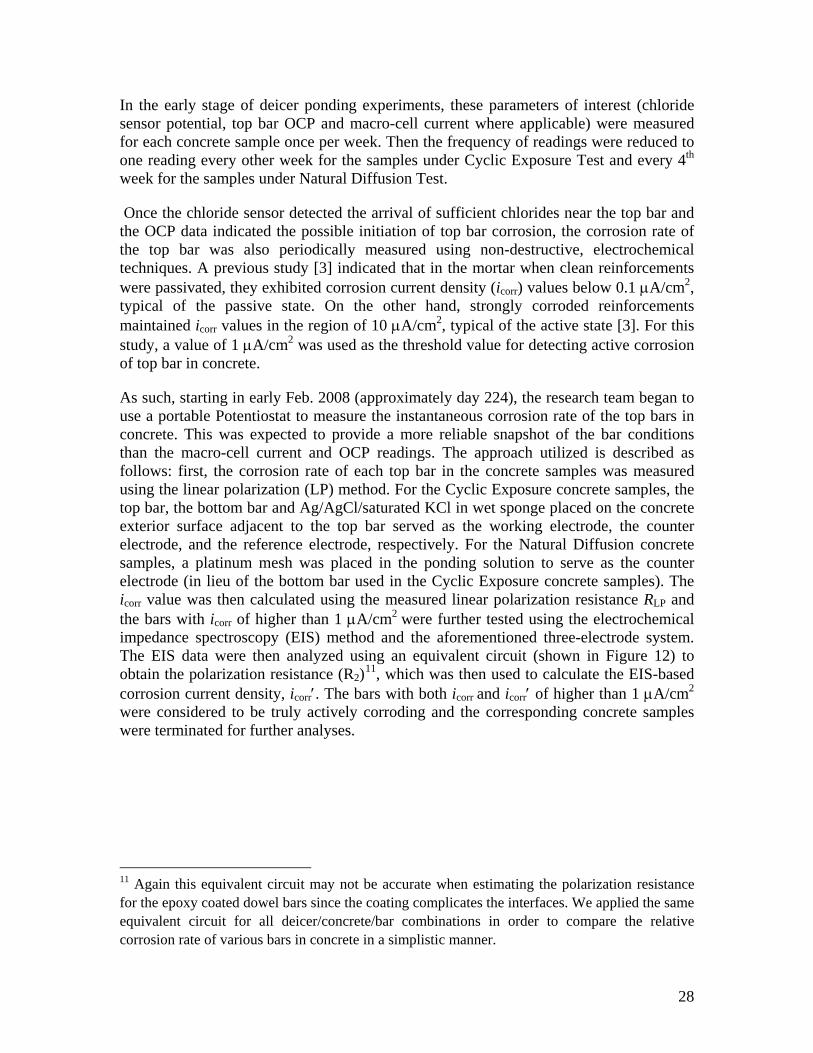
28
In the early stage of deicer ponding experiments, these parameters of interest (chloride sensor potential, top bar OCP and macro-cell current where applicable) were measured for each concrete sample once per week. Then the frequency of readings were reduced to one reading every other week for the samples under Cyclic Exposure Test and every 4th week for the samples under Natural Diffusion Test.
Once the chloride sensor detected the arrival of sufficient chlorides near the top bar and the OCP data indicated the possible initiation of top bar corrosion, the corrosion rate of the top bar was also periodically measured using non-destructive, electrochemical techniques. A previous study [3] indicated that in the mortar when clean reinforcements were passivated, they exhibited corrosion current density (icorr) values below 0.1 µA/cm2, typical of the passive state. On the other hand, strongly corroded reinforcements maintained icorr values in the region of 10 µA/cm2, typical of the active state [3]. For this study, a value of 1 µA/cm2 was used as the threshold value for detecting active corrosion of top bar in concrete.
As such, starting in early Feb. 2008 (approximately day 224), the research team began to use a portable Potentiostat to measure the instantaneous corrosion rate of the top bars in concrete. This was expected to provide a more reliable snapshot of the bar conditions than the macro-cell current and OCP readings. The approach utilized is described as follows: first, the corrosion rate of each top bar in the concrete samples was measured using the linear polarization (LP) method. For the Cyclic Exposure concrete samples, the top bar, the bottom bar and Ag/AgCl/saturated KCl in wet sponge placed on the concrete exterior surface adjacent to the top bar served as the working electrode, the counter electrode, and the reference electrode, respectively. For the Natural Diffusion concrete samples, a platinum mesh was placed in the ponding solution to serve as the counter electrode (in lieu of the bottom bar used in the Cyclic Exposure concrete samples). The icorr value was then calculated using the measured linear polarization resistance RLP and the bars with icorr of higher than 1 µA/cm2 were further tested using the electrochemical impedance spectroscopy (EIS) method and the aforementioned three-electrode system. The EIS data were then analyzed using an equivalent circuit (shown in Figure 12) to obtain the polarization resistance (R2)11
, which was then used to calculate the EIS-based corrosion current density, icorr′. The bars with both icorr and icorr′ of higher than 1 µA/cm2 were considered to be truly actively corroding and the corresponding concrete samples were terminated for further analyses.
11 Again this equivalent circuit may not be accurate when estimating the polarization resistance for the epoxy coated dowel bars since the coating complicates the interfaces. We applied the same equivalent circuit for all deicer/concrete/bar combinations in order to compare the relative corrosion rate of various bars in concrete in a simplistic manner.
29
F igur e 12. E quivalent electr ic cir cuit used in the E I S data analysis
2.1.6. Compression Testing of Concrete Core Samples
Concrete samples were terminated and removed from the testing program once significant evidence suggested the active corrosion of the top bar in them. Upon termination two to three small core samples (average height of 2.2′′ or 55.9 mm and average diameter of 2.3′′ or 58.4 mm) were taken from each sample to test their compressive strength and to assess concrete strength gains or losses caused by exposure to concentration deicers and in the case of Cyclic Exposure Test, to temperature and wet/dry cycles. Cores were removed from the concrete according to the ASTM C42/C 42 M (2004) Standard Test Method of Obtaining and Testing Drilled Cores and Sawed Beams of Concrete. The compression testing was conducted in accordance with ASTM C873 / C873M - 04e1 Standard Test Method for Compressive Strength of Concrete Cylinders. Results of compression testing of individual specimens were compared to control specimens not exposed to deicers. The compressive strength of concrete samples were first calculated by dividing the measured ultimate strength by the area of specimen cross-section, then multiplied by the Length/Diameter (L/D) correction factor, and finally presented in the unit of psi, or pounds per square inch.
2.1.7. FESEM/EDX Measurements
For concrete samples continuously subjected to deicers at room temperature, microscopic analyses were conducted to examine the possible chemical changes in the cement paste following the Natural Diffusion Test. To this end, a 0.2" (5.1 mm) thick slice sample was cut from the center of the terminated concrete sample perpendicularly using a concrete saw with a diamond crusted blade cooled with de-ionized water, in order to allow the cross-sectional analysis of deicer/concrete interface. Each slice sample was then polished on silicon carbide (SiC) papers down to a grid size of 1000 with the aid of a metallographic grinding disc. After polishing, the sample surface was cleaned with pressurized oxygen to remove debris, and then desiccated under vacuum for seven days prior to surface analyses.
The newly cut concrete surface was subjected to field emission scanning electron microscopy (FESEM) and energy dispersive X-ray spectroscopy (EDX), in order to examine its localized morphology and elemental distributions at the microscopic level.
30
We used a Zeiss Supra PGT/HKL system coupled with the energy dispersive X-ray analyzer. Under an accelerating voltage of 1 kV and a pressure of typically 10-5 to 10-4 torr, the FESEM was used to investigate the effect of deicers on the concrete morphology, by collecting data from at least five randomly selected sites of the cement paste. Care was taken to examine only the cement paste, and the sites were randomly selected to avoid overlapping areas and aggregates. Images detailing morphology were taken using an SE2 detector and at magnifications beginning at 500 times and up to 6000 times. The EDX data were obtained using a micro-analytical unit that featured the ability to detect the small variations in trace element content. For the EDX analysis, an accelerating voltage of 20 kV was used with a scan time of 60 seconds per sampling area. Areas used for EDX analysis corresponded directly to the FESEM morphological examination at 500X magnification. The area analyzed was approximately 212.5µm by 143.75µm. Elements chosen for analysis were based on the known chemical components of the cement paste and deicers.
2.1.8. Estimating the Apparent Chloride Diffusion Coefficient Using the EDX Data
For one-dimensional situations, chloride penetration within concrete is governed by Fick's law:
( )C CDt x x
∂ ∂ ∂=
∂ ∂ ∂ (4)
where D is the apparent chloride diffusion coefficient; C is the chloride concentration; t is the time; x is the position variable. Assuming that the apparent chloride diffusion coefficient is constant, the surface concentration of chloride is maintained at a constant value sC , and the specimens are initially chloride free, the solution to Eqn. (4) for a semi-infinite concrete sample is given by:
[1 ( )]2s
xC C erfDt
= − (5)
where (*)erf is the error function.
In this work, the apparent chloride diffusion coefficient was inversely parameterized from chloride concentration distributions measured in various concrete samples. These were in direct contact with different chloride sources for 330-347 days12
12 Some samples showed significant evidence of action corrosion at the top bar and were terminated from the Natural Diffusion Test on day 330 while other continued until day 347.
under the Natural Diffusion Test. Except for one side, all surfaces of concrete samples were sealed by epoxy so that the chloride penetration could only occur in one direction, which is the validity condition of Eqn. (5). After immersion, the total chloride concentration was measured by the EDX for cement mortar phase at two different deicer penetration depths, 1mm and 12 mm respectively. The EDX provided elemental concentration data from any selected micro-area and allowed the analysis of chloride concentration by weight of
31
concrete in a semi-quantitative manner. The highly scattered nature of EDX results is consistent with the heterogeneous nature of the cement mortar at the micron scale. To derive the free chloride concentration at each depth of the sample, we assume a constant chloride binding ratio, i.e., free-to-total chloride ratio.
To determine apparent chloride diffusion coefficients from these noisy EDX data profiles, a weighted-regression procedure was utilized, which is based on minimization of weighted residuals between the experimental concentration data and the calculated one with Eqn. (5). As such, the objective function for inverse parameterization follows:
2exp, ,( )i i calc iF C Cω= −∑ (6)
where F is the weighted residual; iω is the weighting factor for data set i ; the summation is performed over all the data point involved in the study. The numerical solutions were obtained by the widely-used gradient-free simplex method, which features a robust and fast convergence behavior.
2.2. Predictive Models Based on Artificial Neural Networks
To study the complex cause-and-effect relationships inherent in the deicer/concrete/bar systems, we elected to use artificial neural networks (ANNs). This modeling alternative was used to establish predictive models correlating potential influential factors (e.g., deicer type, mix design, exposure duration, average daily temperature, wet percent time during deicer ponding, average daily chloride concentration of the ponding solution, bar type, and test type) and target output factor (e.g., ECl-, OCP of top bar, macro-cell current, and icorr).
Artificial neural networks (ANNs) are powerful tools to model the non-linear cause-and-effect relationships inherent in complex processes [4], as they provide non-parametric, data-driven, self-adaptive approaches to information processing. ANNs offer several advantages over traditional, model-based methods. First, ANNs are robust and can produce generalizations from experience even if the data are incomplete or noisy, given that over-fitting is avoided with expert intervention. Second, ANNs can learn from examples and capture subtle functional relationships among case data. Prior assumptions about the underlying relationships in a particular problem, which in the real world are usually implicit or complicated, need not be made. Third, ANNs provide universal approximation functions flexible in modeling linear and nonlinear relationships.
ANNs have been successfully utilized to predict the compressive strength of concrete [5-6], to predict the electrochemical behavior of steel in various chloride solutions [7] and the chloride binding [8], chloride profiles [9], and chloride permeability [10] in concrete, to recognize the OCP behavioral pattern of steel in concrete [11], and to predict the time to onset of rebar corrosion [12] and the life of concrete structures [13].
The ANN paradigm adopted in this study was the multi-layer feed-forward neural network, of which a typical architecture is shown in Figure 13. The nodes in the input and output layers consist of independent variables and response variable(s), respectively. One
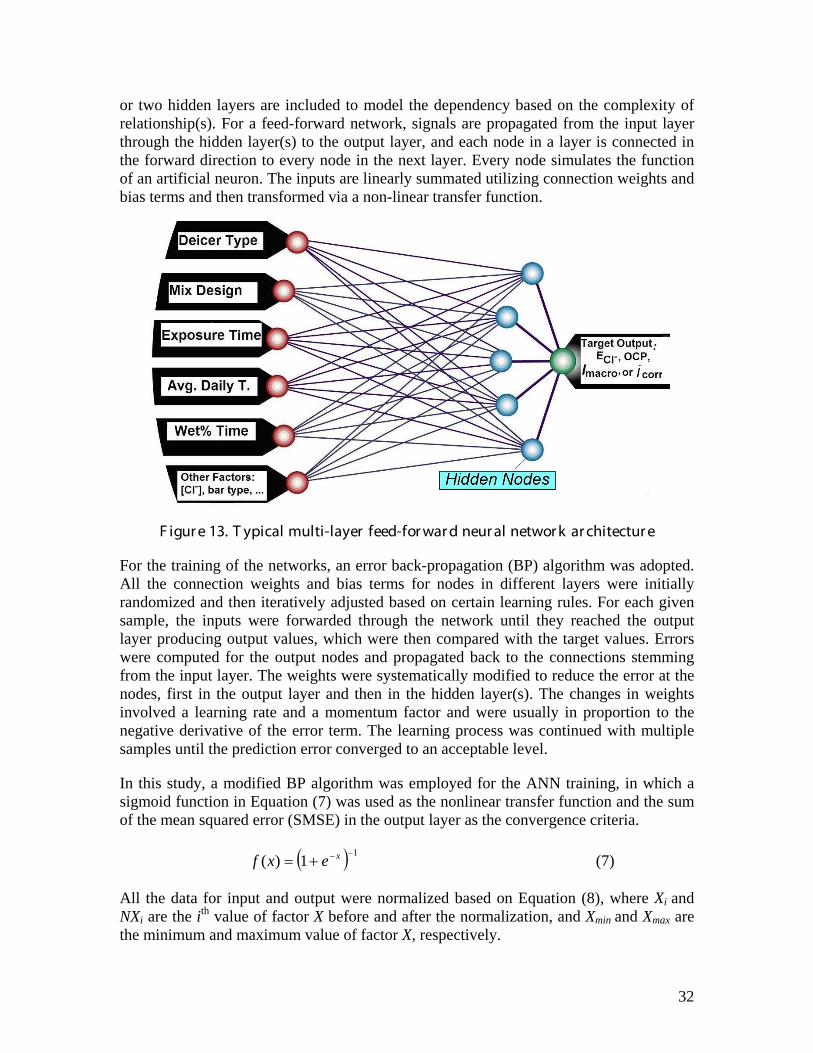
32
or two hidden layers are included to model the dependency based on the complexity of relationship(s). For a feed-forward network, signals are propagated from the input layer through the hidden layer(s) to the output layer, and each node in a layer is connected in the forward direction to every node in the next layer. Every node simulates the function of an artificial neuron. The inputs are linearly summated utilizing connection weights and bias terms and then transformed via a non-linear transfer function.
F igur e 13. T ypical multi-layer feed-for war d neur al networ k ar chitectur e
For the training of the networks, an error back-propagation (BP) algorithm was adopted. All the connection weights and bias terms for nodes in different layers were initially randomized and then iteratively adjusted based on certain learning rules. For each given sample, the inputs were forwarded through the network until they reached the output layer producing output values, which were then compared with the target values. Errors were computed for the output nodes and propagated back to the connections stemming from the input layer. The weights were systematically modified to reduce the error at the nodes, first in the output layer and then in the hidden layer(s). The changes in weights involved a learning rate and a momentum factor and were usually in proportion to the negative derivative of the error term. The learning process was continued with multiple samples until the prediction error converged to an acceptable level.
In this study, a modified BP algorithm was employed for the ANN training, in which a sigmoid function in Equation (7) was used as the nonlinear transfer function and the sum of the mean squared error (SMSE) in the output layer as the convergence criteria.
( ) 11)( −−+= xexf (7)
All the data for input and output were normalized based on Equation (8), where Xi and NXi are the ith value of factor X before and after the normalization, and Xmin and Xmax are the minimum and maximum value of factor X, respectively.
33
)1.0(
)1.0(
minmax
min
+−+−
=XX
xxNX i
i (8)
2.3. References
[1] Freeze, R.A., and J. Cherry (1979). Groundwater, Prentice-Hall, Inc., New Jersey. [2] Raupach M. and P. Schiessl (1997). Construction and Building Materials 11(4):
207. [3] Gonzalez J.A., A. Cobo, M.N. Gonzalez, and E. Otero (2000). Materials and
Corrosion 51, 97-103. [4] Shi, X., P. Schillings, and D. Boyd. Applying Artificial Neural Networks and
Virtual Experimental Design to Quality Improvement of Two Industrial Processes. International Journal of Production Research, 42(1) (2004), 101-118.
[5] L.-C. Yeah, Cem. Con. Res. 28(12) (1998), 1797-1808. [6] L.-C. Yeah, J. Mat. in Civ. Engrg. 18(4) (2006), 597-604. [7] A. M. Nor and R.A. Cottis, in Proceedings of CORROSION/2004 Symposium
(held in New Orleans, LA, USA. March 23-April 1), eds. National Association of Corrosion Engineers, (2004), Paper No. 04063.
[8] G. K. Glass, N. M. Hassanein, and N. R. Buenfeld, Magazine of Concrete Research 49(181) (1997), 323-335.
[9] J. Peng, Z. Li, and B. Ma, J. Mat. in Civ. Engrg. 14(4) (2002), 327-333. [10] E. Güneyisi, M. Gesoğlu,T. Özturan, and E. Özbay, Constr. Bldg, Mater. 23
(2009), 469-481. [11] T. Parthiban, R. Ravi, G.T. Parthiban, S. Srinivasan, K.R. Ramakrishnan, and M.
Raghavan, Corro. Sci. 47 (2005), 1625-1642. [12] G. Morcous and Z. Lounis, Comp. Aid. Civ. Infra. Engrg. 20(2) (2005), 108-117. [13] N. R. Buenfeld and N. M. Hassanein, Proc. Instn. Civ. Engrs Structs & Bldgs 128
(1998), 38-48.
34
C H A PT E R 3. L A B OR A T OR Y I NV E ST I G A T I ON A ND NE UR A L NE T W OR K S M ODE L I NG OF DE I C E R I NG R E SS I NT O POR T L A ND C E M E NT C ONC R E T E A ND
I T S C OR R OSI ON I M PL I C A T I ONS
This chapter provides the results and discussion of the laboratory investigation, including: the apparent chloride diffusion coefficient of various deicer/concrete combinations in the Natural Diffusion Test, the effect of deicer ponding experiments to the compressive strength of concrete, and the ANN-based predictive models using data from the deicer ponding experiments.
3.1. Chloride Diffusion Coefficient of Deicers in Concrete
As described in Chapter 2, we used the EDX data to derive the apparent chloride diffusion coefficient, Dapp, in the concrete samples subjected to the Natural Diffusion Test (room temperature, 330-347 days). This involved the elemental analysis of at least five areas at two depths of each concrete sample, 1 mm and 12 mm respectively from the bottom of the deicer pond. The elemental data showed high variability at any given depth of the same sample and a weighted-regression procedure was utilized to fit the actual data to the Fick’s law.
As shown in Figure 14, the Dapp values obtained from inverse parameterization for most corrosion-inhibited chloride brines are characterized by a magnitude of 10-12 m2/s, which is a common occurrence for ionic diffusion in water-saturated concrete. Note that the relatively high Dapp values of the non-inhibited NaCl brine may be biased for several reasons: first, the EDX analysis provides the concentration of chloride element (mostly bound chlorides), which may not have been a good representation of relative concentration of free chloride in concrete (even though we assumed a constant chloride binding ratio); second, EDX is a semi-quantitative method when it comes to quantifying chloride concentration in concrete especially when the chloride concentrations are very low. High variability in its data can also come from the different chemical composition in the multiple sampled areas. As such, these EDX-derived Dapp values should be used with caution and only suitable for relative comparison under the investigated conditions, and they are not reliable enough for service life modeling.
Furthermore, there is not sufficient research to substantiate the translation of laboratory-obtained Dapp values into service life of reinforced concrete in chloride-laden environment and the performance and service life of reinforced concrete are complicated by the high variability inherent in exposure conditions (e.g., mechanical, temperature and contaminant loadings). The rule of thumb, however, is that the smaller the Dapp value, the longer it takes for sufficient chlorides to reach the surface of rebar or dowel bar to initiate active corrosion.
Two trends can be observed from Figure 14. First of all, in both bridge and pavement concrete mixes, the chloride diffusion coefficient of the corrosion-inhibited NaCl was significantly lower than that of non-inhibited NaCl (the control), implying beneficial role of the corrosion inhibitor in slowing down the ingress of chloride into concrete. While existing literature demonstrated that MgCl2 and CaCl2 have high chloride diffusion
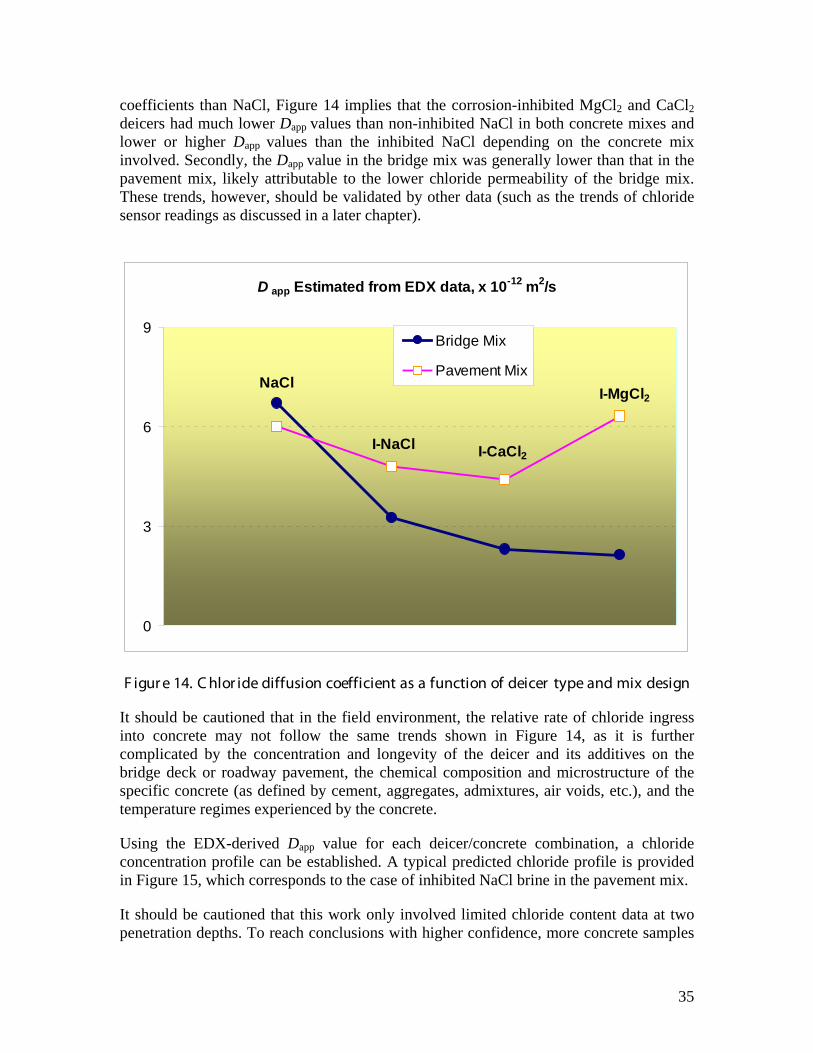
35
coefficients than NaCl, Figure 14 implies that the corrosion-inhibited MgCl2 and CaCl2 deicers had much lower Dapp values than non-inhibited NaCl in both concrete mixes and lower or higher Dapp values than the inhibited NaCl depending on the concrete mix involved. Secondly, the Dapp value in the bridge mix was generally lower than that in the pavement mix, likely attributable to the lower chloride permeability of the bridge mix. These trends, however, should be validated by other data (such as the trends of chloride sensor readings as discussed in a later chapter).
D app Estimated from EDX data, x 10-12 m2/s
NaCl
I-NaCl I-CaCl2
I-MgCl2
0
3
6
9Bridge Mix
Pavement Mix
F igur e 14. C hlor ide diffusion coefficient as a function of deicer type and mix design
It should be cautioned that in the field environment, the relative rate of chloride ingress into concrete may not follow the same trends shown in Figure 14, as it is further complicated by the concentration and longevity of the deicer and its additives on the bridge deck or roadway pavement, the chemical composition and microstructure of the specific concrete (as defined by cement, aggregates, admixtures, air voids, etc.), and the temperature regimes experienced by the concrete.
Using the EDX-derived Dapp value for each deicer/concrete combination, a chloride concentration profile can be established. A typical predicted chloride profile is provided in Figure 15, which corresponds to the case of inhibited NaCl brine in the pavement mix.
It should be cautioned that this work only involved limited chloride content data at two penetration depths. To reach conclusions with higher confidence, more concrete samples
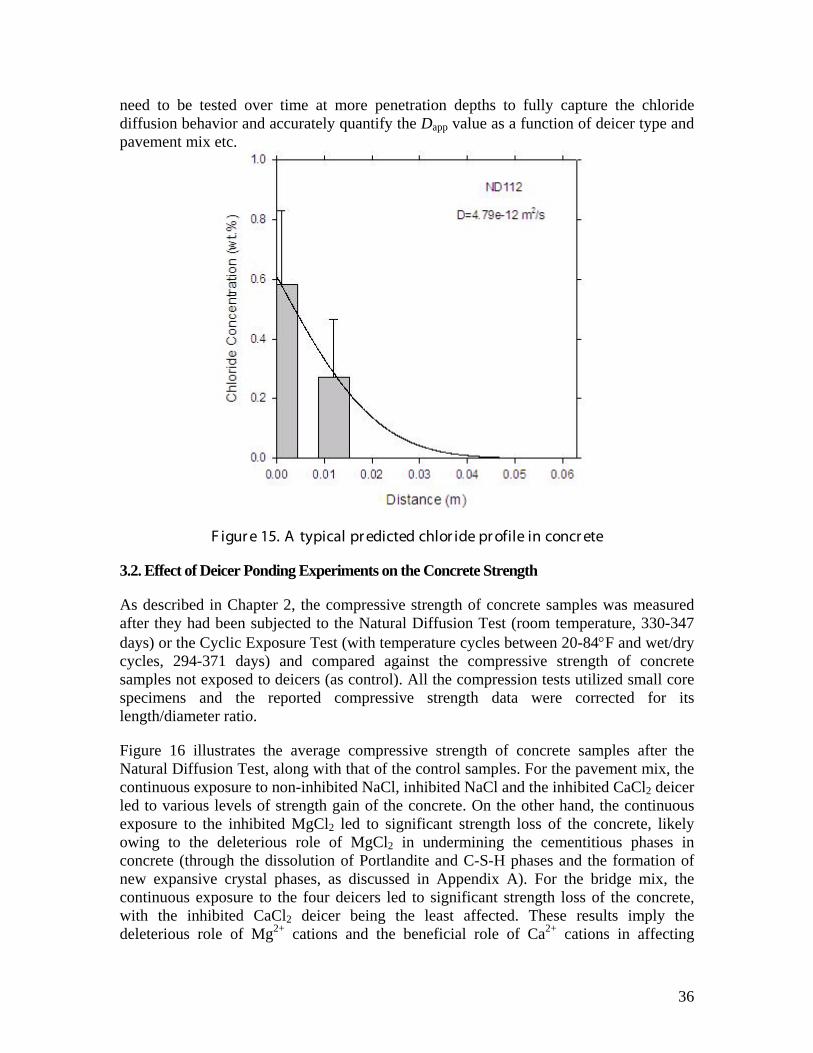
36
need to be tested over time at more penetration depths to fully capture the chloride diffusion behavior and accurately quantify the Dapp value as a function of deicer type and pavement mix etc.
F igur e 15. A typical pr edicted chlor ide pr ofile in concr ete
3.2. Effect of Deicer Ponding Experiments on the Concrete Strength
As described in Chapter 2, the compressive strength of concrete samples was measured after they had been subjected to the Natural Diffusion Test (room temperature, 330-347 days) or the Cyclic Exposure Test (with temperature cycles between 20-84°F and wet/dry cycles, 294-371 days) and compared against the compressive strength of concrete samples not exposed to deicers (as control). All the compression tests utilized small core specimens and the reported compressive strength data were corrected for its length/diameter ratio.
Figure 16 illustrates the average compressive strength of concrete samples after the Natural Diffusion Test, along with that of the control samples. For the pavement mix, the continuous exposure to non-inhibited NaCl, inhibited NaCl and the inhibited CaCl2 deicer led to various levels of strength gain of the concrete. On the other hand, the continuous exposure to the inhibited MgCl2 led to significant strength loss of the concrete, likely owing to the deleterious role of MgCl2 in undermining the cementitious phases in concrete (through the dissolution of Portlandite and C-S-H phases and the formation of new expansive crystal phases, as discussed in Appendix A). For the bridge mix, the continuous exposure to the four deicers led to significant strength loss of the concrete, with the inhibited CaCl2 deicer being the least affected. These results imply the deleterious role of Mg2+ cations and the beneficial role of Ca2+ cations in affecting
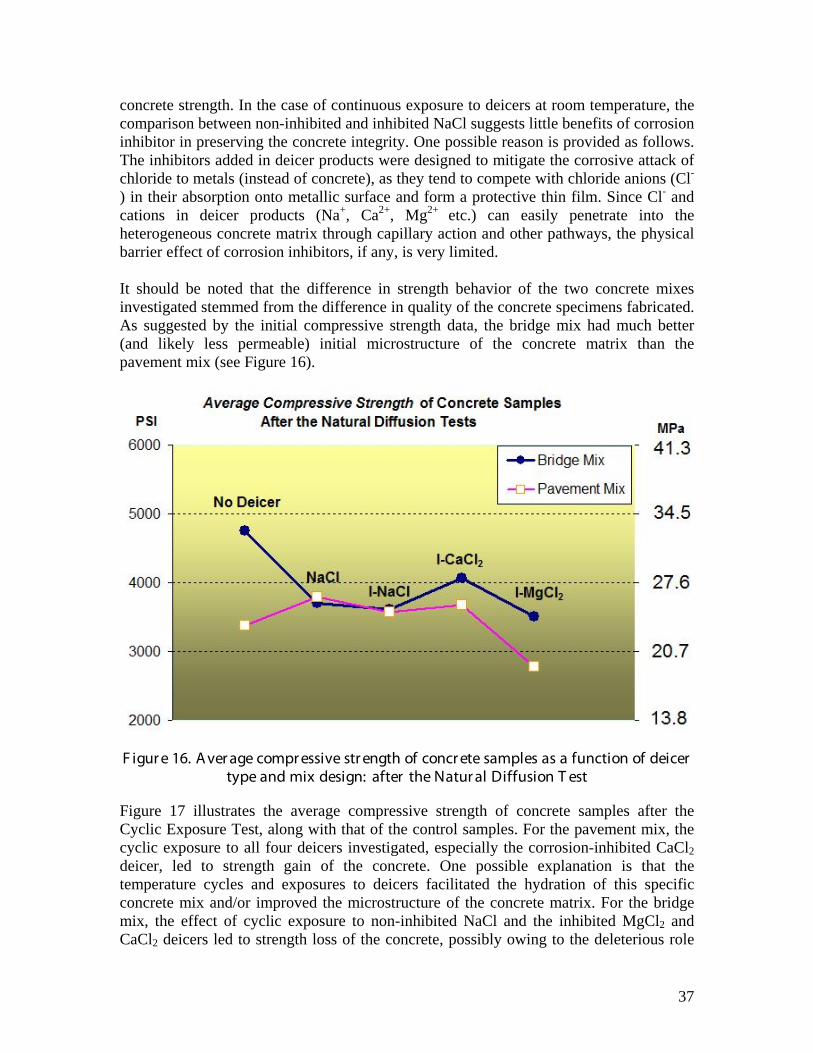
37
concrete strength. In the case of continuous exposure to deicers at room temperature, the comparison between non-inhibited and inhibited NaCl suggests little benefits of corrosion inhibitor in preserving the concrete integrity. One possible reason is provided as follows. The inhibitors added in deicer products were designed to mitigate the corrosive attack of chloride to metals (instead of concrete), as they tend to compete with chloride anions (Cl-
) in their absorption onto metallic surface and form a protective thin film. Since Cl- and cations in deicer products (Na+, Ca2+, Mg2+ etc.) can easily penetrate into the heterogeneous concrete matrix through capillary action and other pathways, the physical barrier effect of corrosion inhibitors, if any, is very limited. It should be noted that the difference in strength behavior of the two concrete mixes investigated stemmed from the difference in quality of the concrete specimens fabricated. As suggested by the initial compressive strength data, the bridge mix had much better (and likely less permeable) initial microstructure of the concrete matrix than the pavement mix (see Figure 16).
F igur e 16. A ver age compr essive str ength of concr ete samples as a function of deicer type and mix design: after the Natur al Diffusion T est
Figure 17 illustrates the average compressive strength of concrete samples after the Cyclic Exposure Test, along with that of the control samples. For the pavement mix, the cyclic exposure to all four deicers investigated, especially the corrosion-inhibited CaCl2 deicer, led to strength gain of the concrete. One possible explanation is that the temperature cycles and exposures to deicers facilitated the hydration of this specific concrete mix and/or improved the microstructure of the concrete matrix. For the bridge mix, the effect of cyclic exposure to non-inhibited NaCl and the inhibited MgCl2 and CaCl2 deicers led to strength loss of the concrete, possibly owing to the deleterious role
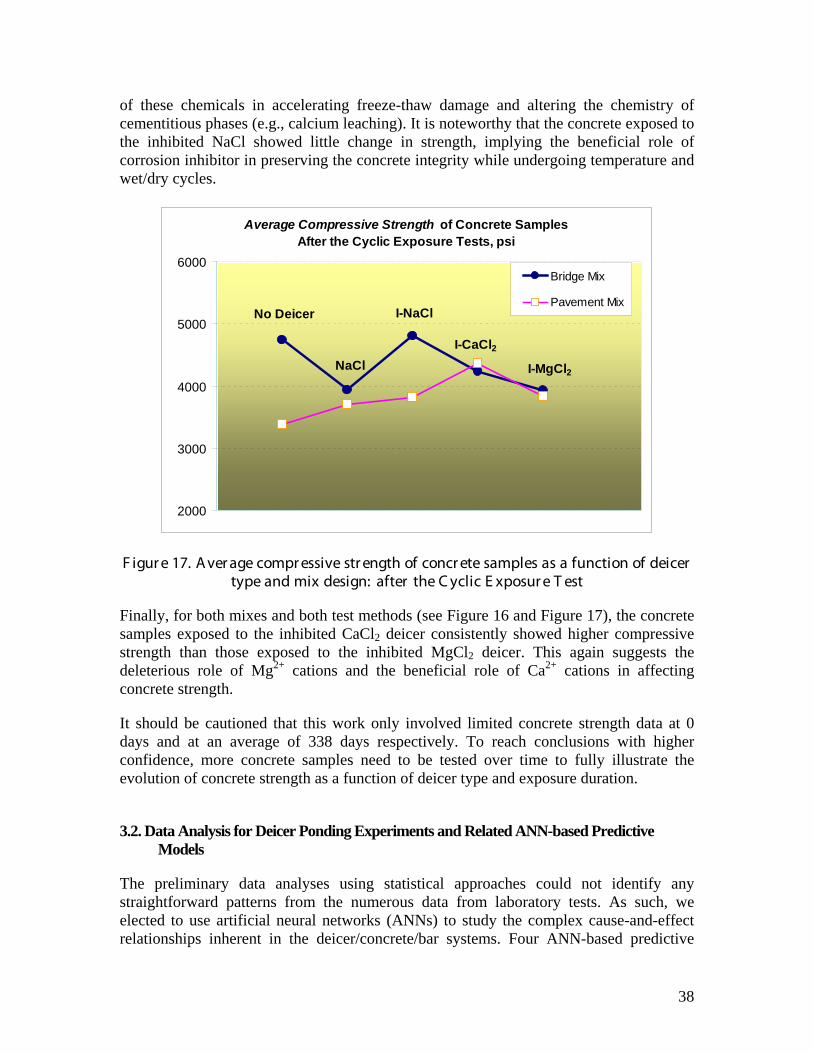
38
of these chemicals in accelerating freeze-thaw damage and altering the chemistry of cementitious phases (e.g., calcium leaching). It is noteworthy that the concrete exposed to the inhibited NaCl showed little change in strength, implying the beneficial role of corrosion inhibitor in preserving the concrete integrity while undergoing temperature and wet/dry cycles.
Average Compressive Strength of Concrete Samples After the Cyclic Exposure Tests, psi
I-MgCl2
I-CaCl2
I-NaCl
NaCl
No Deicer
2000
3000
4000
5000
6000Bridge Mix
Pavement Mix
F igur e 17. A ver age compr essive str ength of concr ete samples as a function of deicer type and mix design: after the C yclic E xposur e T est
Finally, for both mixes and both test methods (see Figure 16 and Figure 17), the concrete samples exposed to the inhibited CaCl2 deicer consistently showed higher compressive strength than those exposed to the inhibited MgCl2 deicer. This again suggests the deleterious role of Mg2+ cations and the beneficial role of Ca2+ cations in affecting concrete strength.
It should be cautioned that this work only involved limited concrete strength data at 0 days and at an average of 338 days respectively. To reach conclusions with higher confidence, more concrete samples need to be tested over time to fully illustrate the evolution of concrete strength as a function of deicer type and exposure duration.
3.2. Data Analysis for Deicer Ponding Experiments and Related ANN-based Predictive Models
The preliminary data analyses using statistical approaches could not identify any straightforward patterns from the numerous data from laboratory tests. As such, we elected to use artificial neural networks (ANNs) to study the complex cause-and-effect relationships inherent in the deicer/concrete/bar systems. Four ANN-based predictive
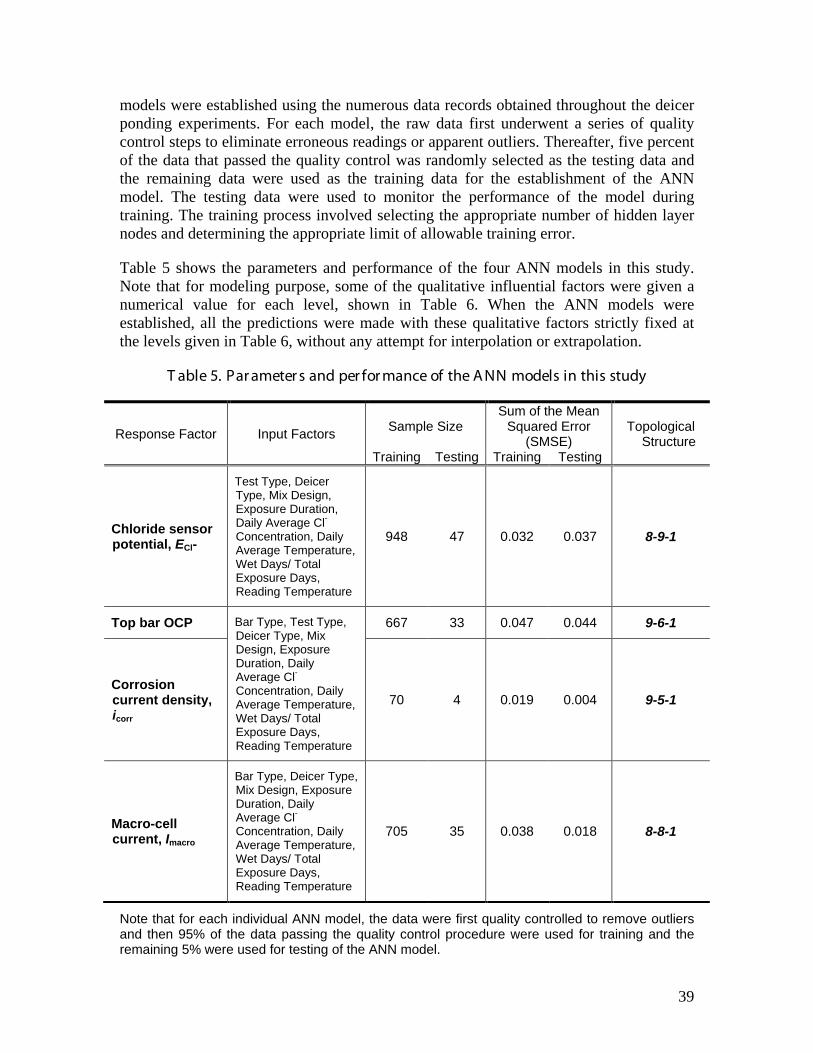
39
models were established using the numerous data records obtained throughout the deicer ponding experiments. For each model, the raw data first underwent a series of quality control steps to eliminate erroneous readings or apparent outliers. Thereafter, five percent of the data that passed the quality control was randomly selected as the testing data and the remaining data were used as the training data for the establishment of the ANN model. The testing data were used to monitor the performance of the model during training. The training process involved selecting the appropriate number of hidden layer nodes and determining the appropriate limit of allowable training error.
Table 5 shows the parameters and performance of the four ANN models in this study. Note that for modeling purpose, some of the qualitative influential factors were given a numerical value for each level, shown in Table 6. When the ANN models were established, all the predictions were made with these qualitative factors strictly fixed at the levels given in Table 6, without any attempt for interpolation or extrapolation.
T able 5. Par ameter s and per for mance of the A NN models in this study
Response Factor Input Factors Sample Size Sum of the Mean
Squared Error (SMSE)
Topological Structure
Training Testing Training Testing
Chloride sensor potential, ECl-
Test Type, Deicer Type, Mix Design, Exposure Duration, Daily Average Cl- Concentration, Daily Average Temperature, Wet Days/ Total Exposure Days, Reading Temperature
948 47 0.032 0.037 8-9-1
Top bar OCP Bar Type, Test Type, Deicer Type, Mix Design, Exposure Duration, Daily Average Cl- Concentration, Daily Average Temperature, Wet Days/ Total Exposure Days, Reading Temperature
667 33 0.047 0.044 9-6-1
Corrosion current density, icorr
70 4 0.019 0.004 9-5-1
Macro-cell current, Imacro
Bar Type, Deicer Type, Mix Design, Exposure Duration, Daily Average Cl- Concentration, Daily Average Temperature, Wet Days/ Total Exposure Days, Reading Temperature
705 35 0.038 0.018 8-8-1
Note that for each individual ANN model, the data were first quality controlled to remove outliers and then 95% of the data passing the quality control procedure were used for training and the remaining 5% were used for testing of the ANN model.
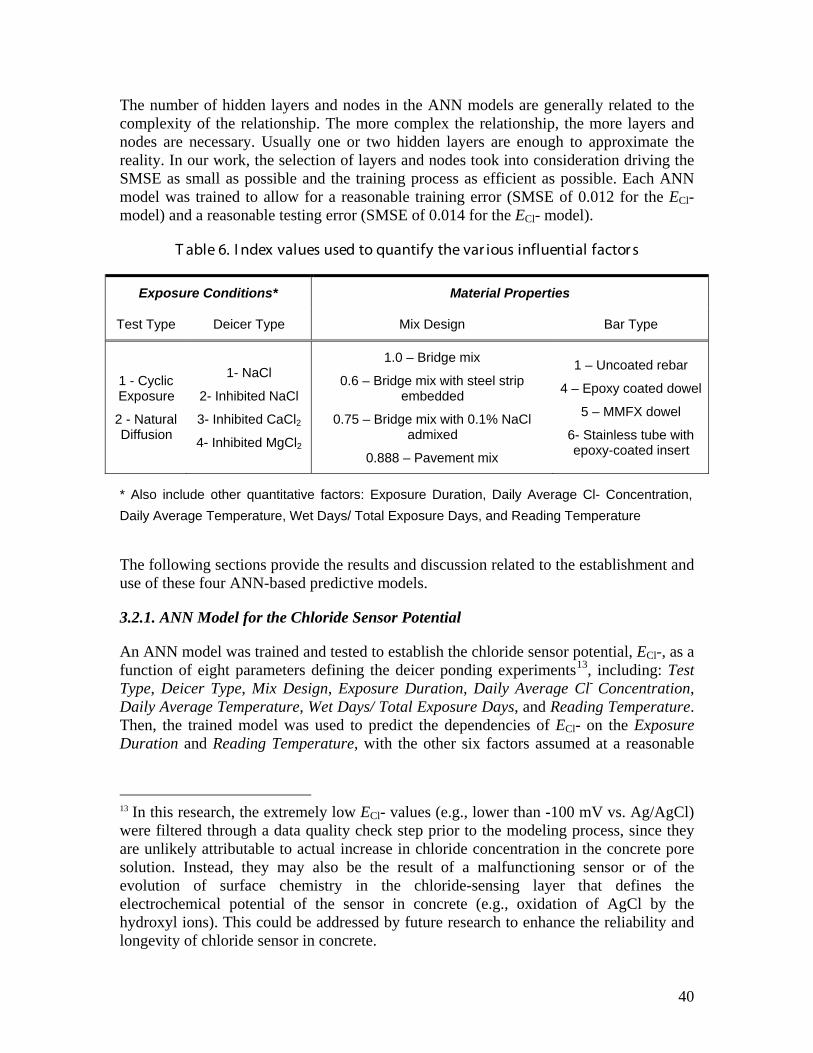
40
The number of hidden layers and nodes in the ANN models are generally related to the complexity of the relationship. The more complex the relationship, the more layers and nodes are necessary. Usually one or two hidden layers are enough to approximate the reality. In our work, the selection of layers and nodes took into consideration driving the SMSE as small as possible and the training process as efficient as possible. Each ANN model was trained to allow for a reasonable training error (SMSE of 0.012 for the ECl- model) and a reasonable testing error (SMSE of 0.014 for the ECl- model).
T able 6. I ndex values used to quantify the var ious influential factor s
Exposure Conditions* Material Properties
Test Type Deicer Type Mix Design Bar Type
1 - Cyclic Exposure
2 - Natural Diffusion
1- NaCl
2- Inhibited NaCl
3- Inhibited CaCl2
4- Inhibited MgCl2
1.0 – Bridge mix
0.6 – Bridge mix with steel strip embedded
0.75 – Bridge mix with 0.1% NaCl admixed
0.888 – Pavement mix
1 – Uncoated rebar
4 – Epoxy coated dowel
5 – MMFX dowel
6- Stainless tube with epoxy-coated insert
* Also include other quantitative factors: Exposure Duration, Daily Average Cl- Concentration, Daily Average Temperature, Wet Days/ Total Exposure Days, and Reading Temperature
The following sections provide the results and discussion related to the establishment and use of these four ANN-based predictive models.
3.2.1. ANN Model for the Chloride Sensor Potential
An ANN model was trained and tested to establish the chloride sensor potential, ECl-, as a function of eight parameters defining the deicer ponding experiments13
13 In this research, the extremely low ECl- values (e.g., lower than -100 mV vs. Ag/AgCl) were filtered through a data quality check step prior to the modeling process, since they are unlikely attributable to actual increase in chloride concentration in the concrete pore solution. Instead, they may also be the result of a malfunctioning sensor or of the evolution of surface chemistry in the chloride-sensing layer that defines the electrochemical potential of the sensor in concrete (e.g., oxidation of AgCl by the hydroxyl ions). This could be addressed by future research to enhance the reliability and longevity of chloride sensor in concrete.
, including: Test Type, Deicer Type, Mix Design, Exposure Duration, Daily Average Cl- Concentration, Daily Average Temperature, Wet Days/ Total Exposure Days, and Reading Temperature. Then, the trained model was used to predict the dependencies of ECl- on the Exposure Duration and Reading Temperature, with the other six factors assumed at a reasonable
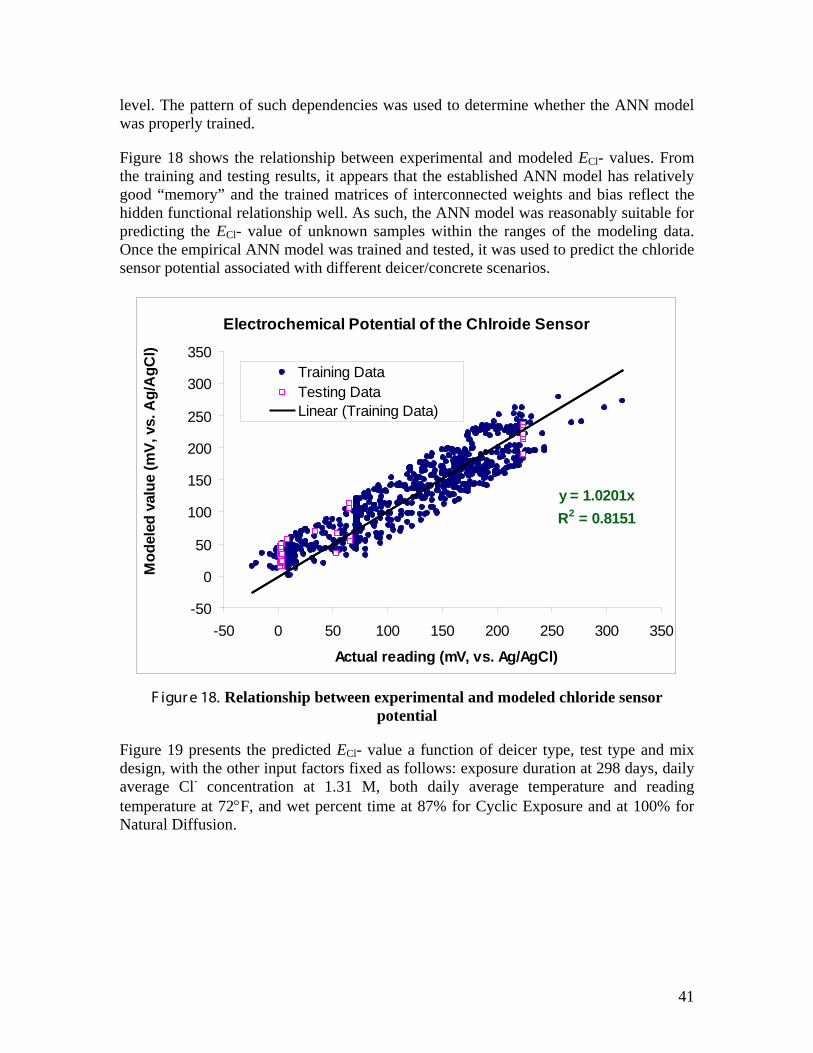
41
level. The pattern of such dependencies was used to determine whether the ANN model was properly trained.
Figure 18 shows the relationship between experimental and modeled ECl- values. From the training and testing results, it appears that the established ANN model has relatively good “memory” and the trained matrices of interconnected weights and bias reflect the hidden functional relationship well. As such, the ANN model was reasonably suitable for predicting the ECl- value of unknown samples within the ranges of the modeling data. Once the empirical ANN model was trained and tested, it was used to predict the chloride sensor potential associated with different deicer/concrete scenarios.
Electrochemical Potential of the Chlroide Sensor
y = 1.0201xR2 = 0.8151
-50
0
50
100
150
200
250
300
350
-50 0 50 100 150 200 250 300 350
Actual reading (mV, vs. Ag/AgCl)
Mod
eled
val
ue (m
V, v
s. A
g/A
gCl)
Training DataTesting DataLinear (Training Data)
F igur e 18. Relationship between experimental and modeled chloride sensor
potential
Figure 19 presents the predicted ECl- value a function of deicer type, test type and mix design, with the other input factors fixed as follows: exposure duration at 298 days, daily average Cl- concentration at 1.31 M, both daily average temperature and reading temperature at 72°F, and wet percent time at 87% for Cyclic Exposure and at 100% for Natural Diffusion.
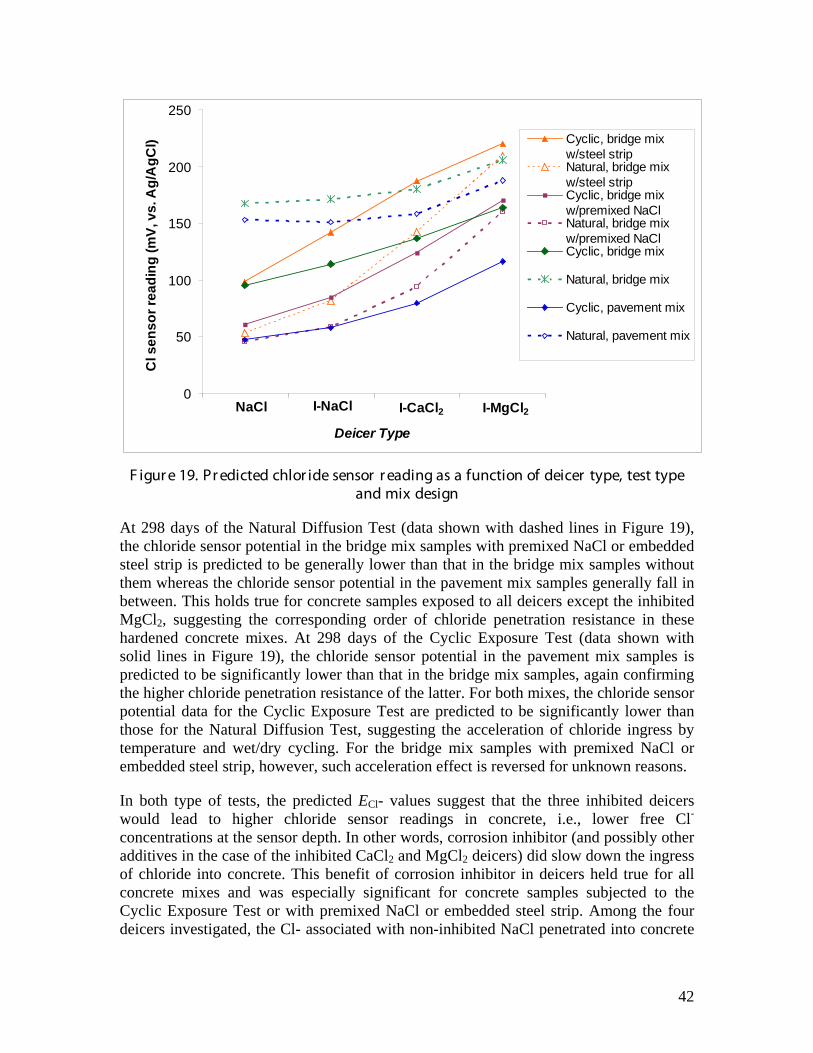
42
NaCl I-NaCl I-CaCl2 I-MgCl20
50
100
150
200
250
Deicer Type
Cl s
enso
r rea
ding
(mV,
vs.
Ag/
AgC
l) Cyclic, bridge mixw/steel stripNatural, bridge mixw/steel stripCyclic, bridge mixw/premixed NaClNatural, bridge mixw/premixed NaClCyclic, bridge mix
Natural, bridge mix
Cyclic, pavement mix
Natural, pavement mix
F igur e 19. Pr edicted chlor ide sensor r eading as a function of deicer type, test type
and mix design
At 298 days of the Natural Diffusion Test (data shown with dashed lines in Figure 19), the chloride sensor potential in the bridge mix samples with premixed NaCl or embedded steel strip is predicted to be generally lower than that in the bridge mix samples without them whereas the chloride sensor potential in the pavement mix samples generally fall in between. This holds true for concrete samples exposed to all deicers except the inhibited MgCl2, suggesting the corresponding order of chloride penetration resistance in these hardened concrete mixes. At 298 days of the Cyclic Exposure Test (data shown with solid lines in Figure 19), the chloride sensor potential in the pavement mix samples is predicted to be significantly lower than that in the bridge mix samples, again confirming the higher chloride penetration resistance of the latter. For both mixes, the chloride sensor potential data for the Cyclic Exposure Test are predicted to be significantly lower than those for the Natural Diffusion Test, suggesting the acceleration of chloride ingress by temperature and wet/dry cycling. For the bridge mix samples with premixed NaCl or embedded steel strip, however, such acceleration effect is reversed for unknown reasons.
In both type of tests, the predicted ECl- values suggest that the three inhibited deicers would lead to higher chloride sensor readings in concrete, i.e., lower free Cl- concentrations at the sensor depth. In other words, corrosion inhibitor (and possibly other additives in the case of the inhibited CaCl2 and MgCl2 deicers) did slow down the ingress of chloride into concrete. This benefit of corrosion inhibitor in deicers held true for all concrete mixes and was especially significant for concrete samples subjected to the Cyclic Exposure Test or with premixed NaCl or embedded steel strip. Among the four deicers investigated, the Cl- associated with non-inhibited NaCl penetrated into concrete

43
at the highest rate whereas that of the inhibited-MgCl2 and CaCl2 deicers penetrated at much lower rates.
The established ECl- ANN model was also used to build three-dimensional response surfaces, in order to graphically illustrate the dependencies of ECl- on two selected influential factors, with the other six factors assumed at a reasonable level. Note that each presented ECl- data point was an average of eight predicted ECl- values corresponding to 2 test types and 4 deicer types.
Figure 20a presents a predicted response surface illustrating the dependency of ECl- on exposure duration (100 - 298 days) and wet percent time (80% - 100%). The predictions were made with the other input factors fixed as follows: pavement mix, daily average Cl- concentration at 1.31 M, both daily average exposure temperature and reading temperature at 72°F. It can be seen that ECl- tends to decrease drastically as the wet percent time decreases from 100% to 80%, suggesting that the incorporation of dry cycles in the deicer ponding experiments accelerates the ingress of chlorides into concrete, when the daily average Cl- concentration was maintained constant (i.e., more chlorides are provided in the wet cycles to compensate for the zero surface Cl- concentration during dry cycles). This is consistent with the general consensus that wet-dry cycles generally accelerate the ingress of chloride into concrete [1-3]. Figure 20a also shows that ECl- tends to decrease as the exposure duration increases from 100 days to 298 days, suggesting continued ingress of more chlorides into concrete.
Figure 20b presents a predicted response surface illustrating the dependency of ECl- on reading temperature (20 - 72°F) and daily average exposure temperature (44 - 72°F). The predictions were made with the other input factors fixed as follows: pavement mix, exposure duration at 298 days, daily average Cl- concentration at 1.31 M, and wet percent time at 87% for the Cyclic Exposure Test and at 100% for the Natural Diffusion Test. It can be seen that ECl- generally increases with the daily average temperature, suggesting the important role of cold temperature (20°F) exposure in accelerating the chloride ingress into concrete, through freeze-thaw damage of the concrete. The daily average temperature might also have affected the ECl- through the processes altering the physicochemical properties of the chloride-sensing layer. Figure 20b also shows that ECl- tends to decrease as the reading temperature increases from 20°F to 72°F, especially when the daily average exposure temperature is high. This is consistent with the expected working mechanism of the Ag/AgCl sensor, for which the relationship between electrochemical potential and temperature (along with free Cl- concentration, [Cl-]) is governed by the Nernst Equation. When the daily average exposure temperature is low, however, the effect of reading temperature on the ECl- value is less significant for unknown reasons.
Three-dimensional response surfaces were also established using the ANN model predictions for chloride sensor embedded in the bridge mix, which featured very similar patterns to those for the pavement mix (as shown in Figure 21a and Figure 21b).
44
1.000.950.90 0.850.80100
199298
0
30
60
90
120
150
180
210
240Predicted chloride sensor reading, mV (vs.
Ag/AgCl)
Wet days / total exposure days
Exposure duration, days
180-210150-180120-15090-12060-90
(a)
20 3346
597244
51 5865 72
0
30
60
90
120
150
180
210Predicted chloride sensor reading, mV (vs.
Ag/AgCl)
Reading temperature, oF
Daily average exposure
temperature, oF
180-210150-180120-15090-12060-90
(b)
F igur e 20. Pr edicted r esponse sur face of chlor ide sensor r eading in pavement mix as a function of: (a) exposur e dur ation and wet per cent time; (b) r eading temper atur e
and daily aver age exposur e temper atur e
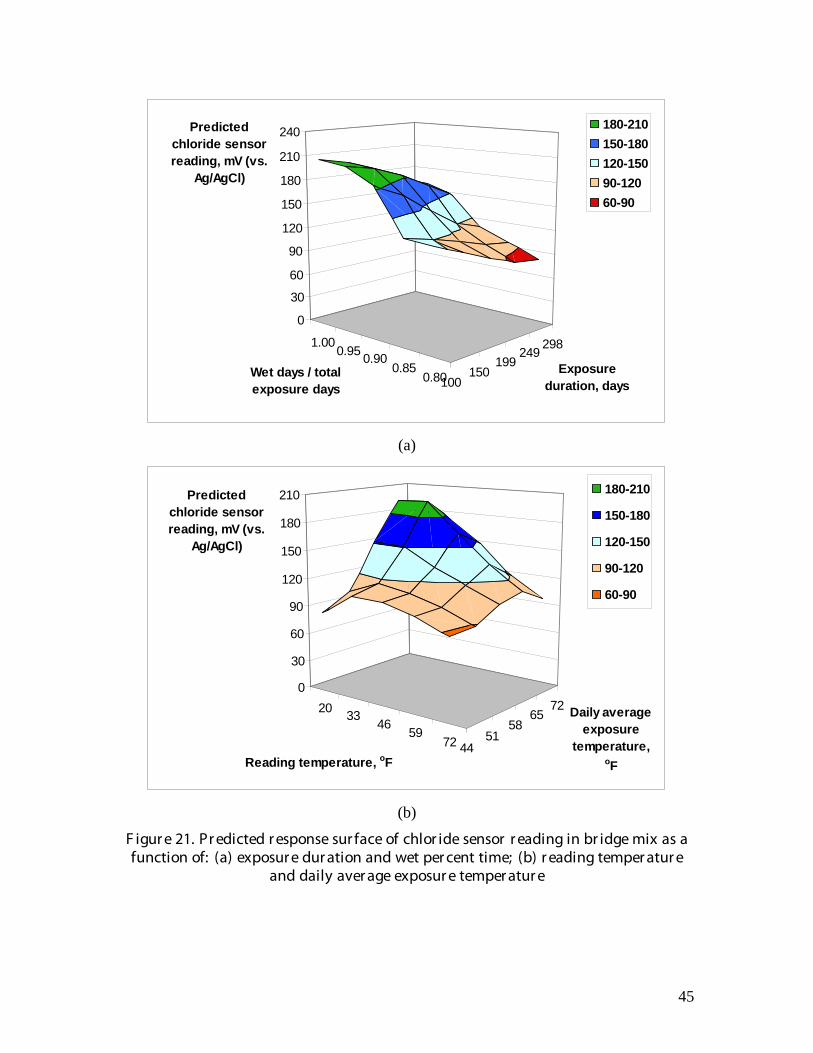
45
1.000.95 0.90
0.850.80100
150199
249298
0
30
60
90
120
150
180
210
240Predicted chloride sensor reading, mV (vs.
Ag/AgCl)
Wet days / total exposure days
Exposure duration, days
180-210150-180120-15090-12060-90
(a)
20 3346
5972 44
5158
6572
0
30
60
90
120
150
180
210Predicted chloride sensor reading, mV (vs.
Ag/AgCl)
Reading temperature, oF
Daily average exposure
temperature, oF
180-210
150-180
120-150
90-120
60-90
(b)
F igur e 21. Pr edicted r esponse sur face of chlor ide sensor r eading in br idge mix as a function of: (a) exposur e dur ation and wet per cent time; (b) r eading temper atur e
and daily aver age exposur e temper atur e
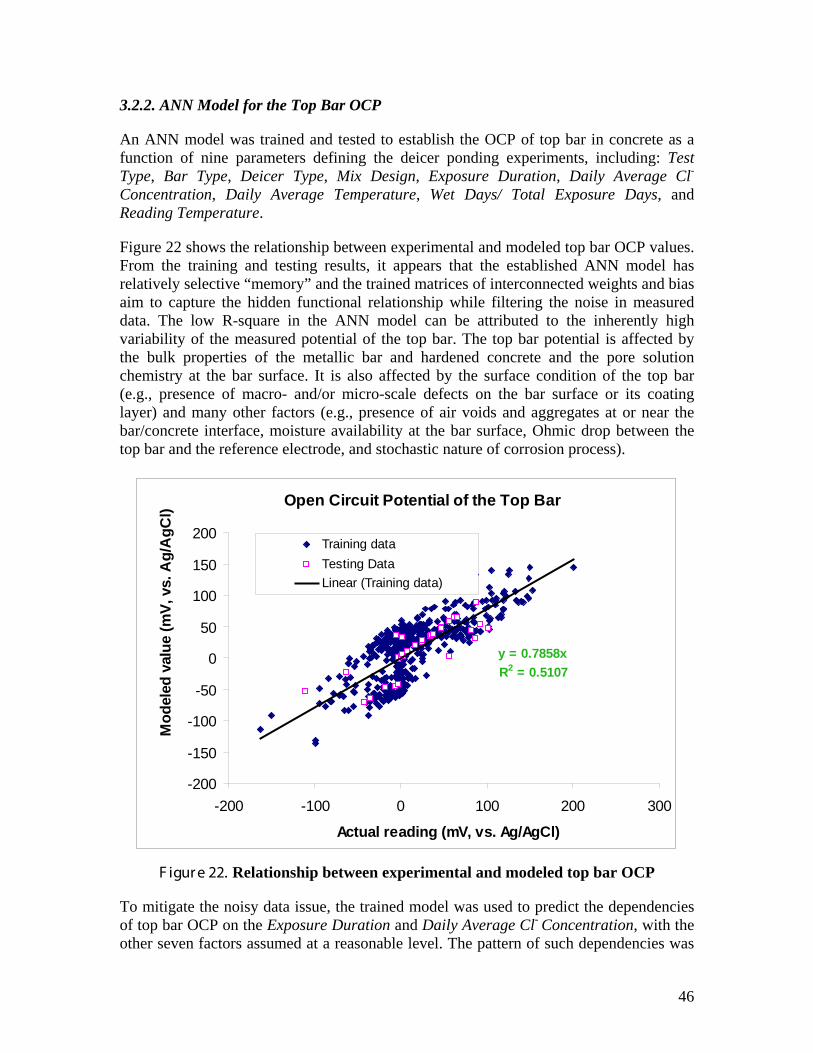
46
3.2.2. ANN Model for the Top Bar OCP
An ANN model was trained and tested to establish the OCP of top bar in concrete as a function of nine parameters defining the deicer ponding experiments, including: Test Type, Bar Type, Deicer Type, Mix Design, Exposure Duration, Daily Average Cl-
Concentration, Daily Average Temperature, Wet Days/ Total Exposure Days, and Reading Temperature.
Figure 22 shows the relationship between experimental and modeled top bar OCP values. From the training and testing results, it appears that the established ANN model has relatively selective “memory” and the trained matrices of interconnected weights and bias aim to capture the hidden functional relationship while filtering the noise in measured data. The low R-square in the ANN model can be attributed to the inherently high variability of the measured potential of the top bar. The top bar potential is affected by the bulk properties of the metallic bar and hardened concrete and the pore solution chemistry at the bar surface. It is also affected by the surface condition of the top bar (e.g., presence of macro- and/or micro-scale defects on the bar surface or its coating layer) and many other factors (e.g., presence of air voids and aggregates at or near the bar/concrete interface, moisture availability at the bar surface, Ohmic drop between the top bar and the reference electrode, and stochastic nature of corrosion process).
Open Circuit Potential of the Top Bar
y = 0.7858xR2 = 0.5107
-200
-150
-100
-50
0
50
100
150
200
-200 -100 0 100 200 300
Actual reading (mV, vs. Ag/AgCl)
Mod
eled
val
ue (m
V, v
s. A
g/A
gCl)
Training dataTesting DataLinear (Training data)
F igur e 22. Relationship between experimental and modeled top bar OCP
To mitigate the noisy data issue, the trained model was used to predict the dependencies of top bar OCP on the Exposure Duration and Daily Average Cl- Concentration, with the other seven factors assumed at a reasonable level. The pattern of such dependencies was
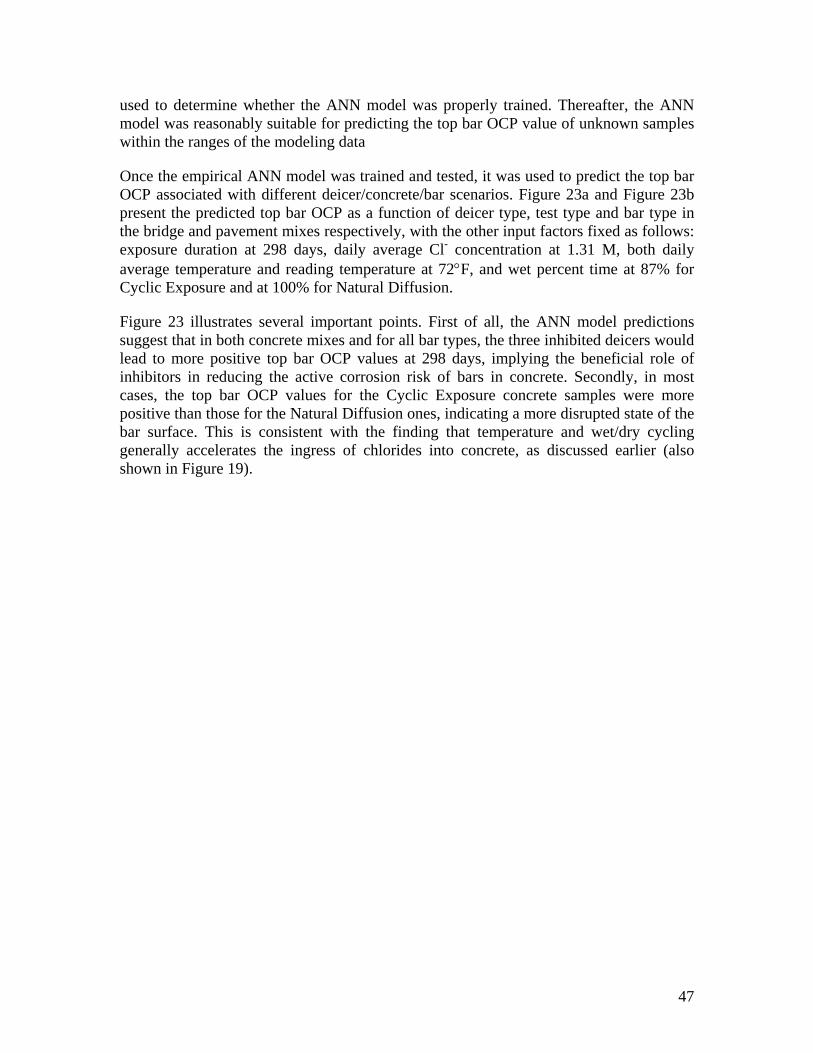
47
used to determine whether the ANN model was properly trained. Thereafter, the ANN model was reasonably suitable for predicting the top bar OCP value of unknown samples within the ranges of the modeling data
Once the empirical ANN model was trained and tested, it was used to predict the top bar OCP associated with different deicer/concrete/bar scenarios. Figure 23a and Figure 23b present the predicted top bar OCP as a function of deicer type, test type and bar type in the bridge and pavement mixes respectively, with the other input factors fixed as follows: exposure duration at 298 days, daily average Cl- concentration at 1.31 M, both daily average temperature and reading temperature at 72°F, and wet percent time at 87% for Cyclic Exposure and at 100% for Natural Diffusion.
Figure 23 illustrates several important points. First of all, the ANN model predictions suggest that in both concrete mixes and for all bar types, the three inhibited deicers would lead to more positive top bar OCP values at 298 days, implying the beneficial role of inhibitors in reducing the active corrosion risk of bars in concrete. Secondly, in most cases, the top bar OCP values for the Cyclic Exposure concrete samples were more positive than those for the Natural Diffusion ones, indicating a more disrupted state of the bar surface. This is consistent with the finding that temperature and wet/dry cycling generally accelerates the ingress of chlorides into concrete, as discussed earlier (also shown in Figure 19).
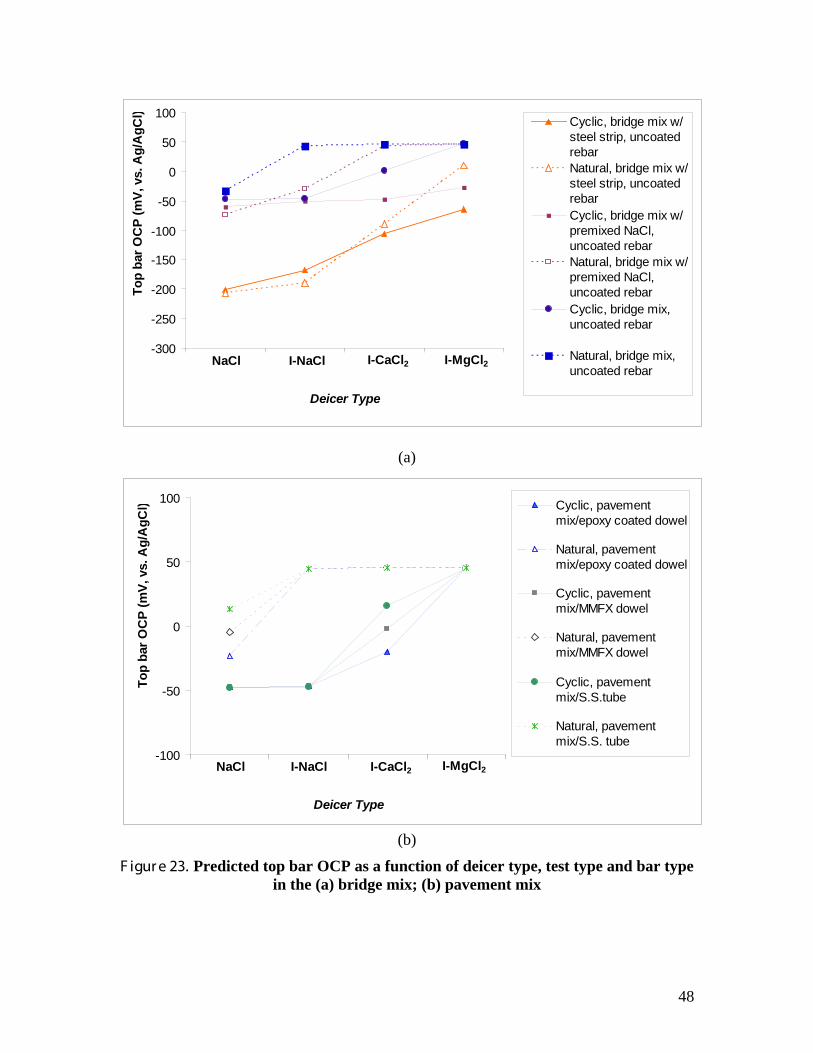
48
I-MgCl2I-CaCl2I-NaClNaCl-300
-250
-200
-150
-100
-50
0
50
100
Deicer Type
Top
bar O
CP
(mV,
vs.
Ag/
AgC
l) Cyclic, bridge mix w/steel strip, uncoatedrebarNatural, bridge mix w/steel strip, uncoatedrebarCyclic, bridge mix w/premixed NaCl,uncoated rebarNatural, bridge mix w/premixed NaCl,uncoated rebarCyclic, bridge mix,uncoated rebar
Natural, bridge mix,uncoated rebar
(a)
I-MgCl2I-CaCl2I-NaClNaCl-100
-50
0
50
100
Deicer Type
Top
bar O
CP
(mV,
vs.
Ag/
AgC
l) Cyclic, pavementmix/epoxy coated dowel
Natural, pavementmix/epoxy coated dowel
Cyclic, pavementmix/MMFX dowel
Natural, pavementmix/MMFX dowel
Cyclic, pavementmix/S.S.tube
Natural, pavementmix/S.S. tube
(b)
F igur e 23. Predicted top bar OCP as a function of deicer type, test type and bar type in the (a) bridge mix; (b) pavement mix
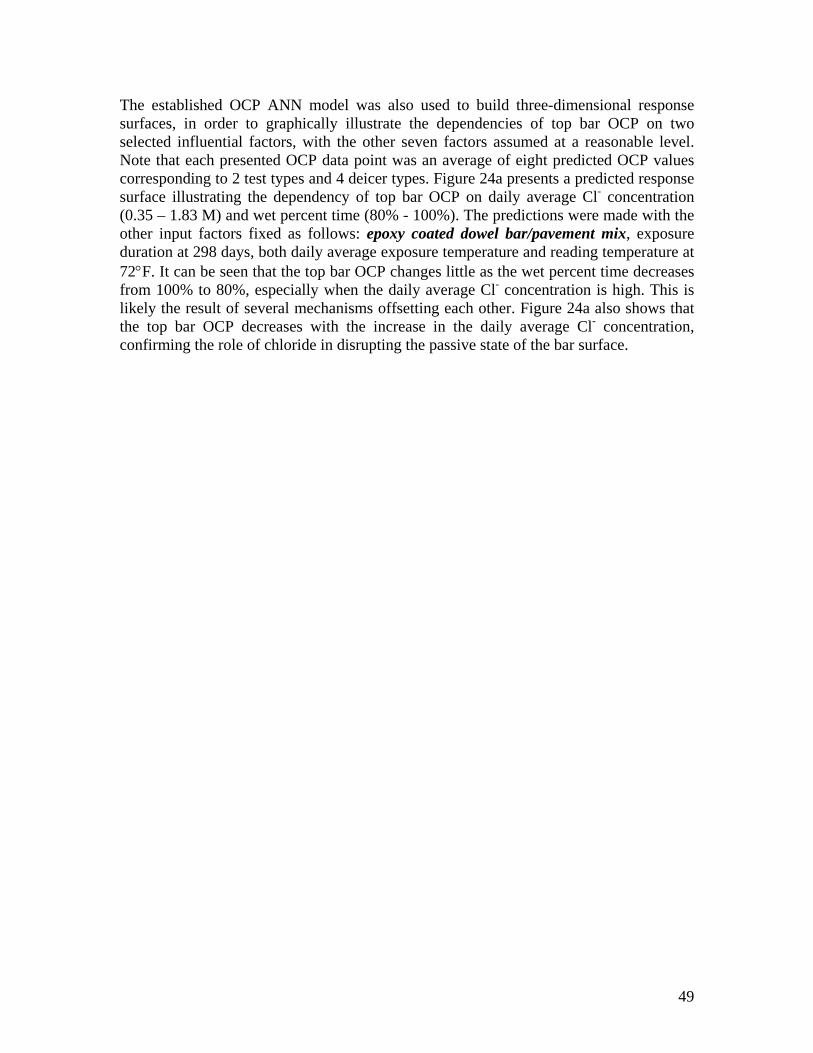
49
The established OCP ANN model was also used to build three-dimensional response surfaces, in order to graphically illustrate the dependencies of top bar OCP on two selected influential factors, with the other seven factors assumed at a reasonable level. Note that each presented OCP data point was an average of eight predicted OCP values corresponding to 2 test types and 4 deicer types. Figure 24a presents a predicted response surface illustrating the dependency of top bar OCP on daily average Cl- concentration (0.35 – 1.83 M) and wet percent time (80% - 100%). The predictions were made with the other input factors fixed as follows: epoxy coated dowel bar/pavement mix, exposure duration at 298 days, both daily average exposure temperature and reading temperature at 72°F. It can be seen that the top bar OCP changes little as the wet percent time decreases from 100% to 80%, especially when the daily average Cl- concentration is high. This is likely the result of several mechanisms offsetting each other. Figure 24a also shows that the top bar OCP decreases with the increase in the daily average Cl- concentration, confirming the role of chloride in disrupting the passive state of the bar surface.
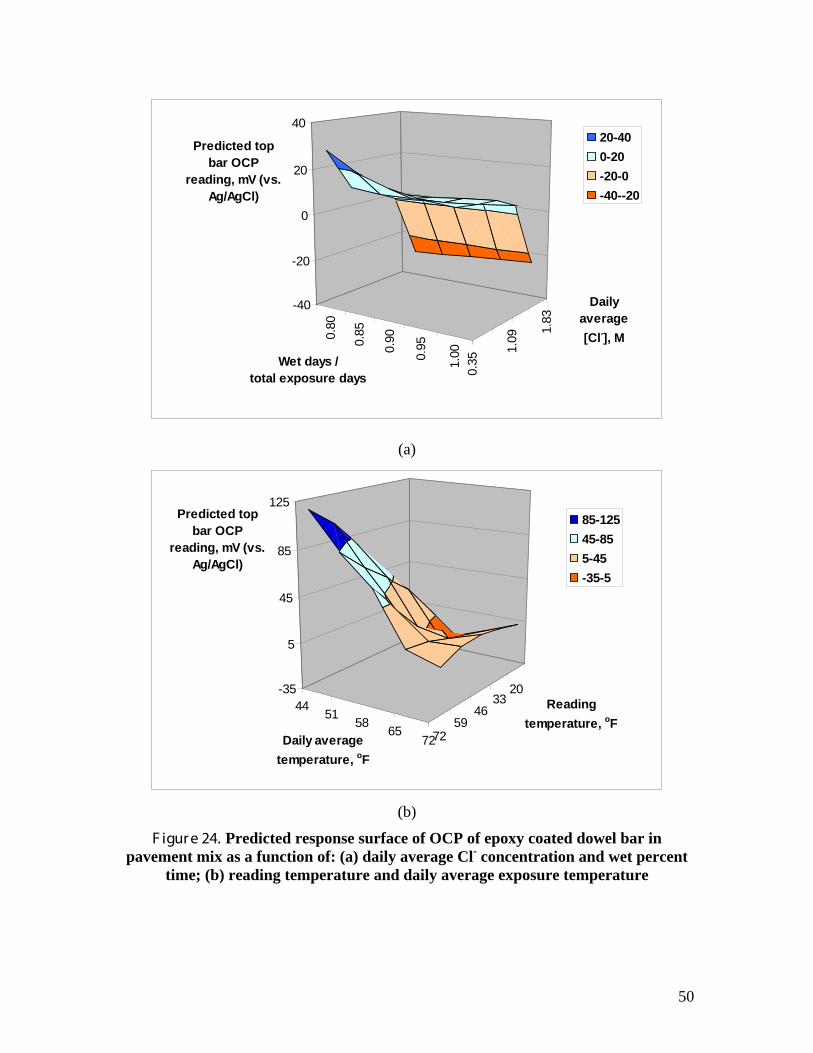
50
0.80
0.85
0.90
0.95
1.00
0.35
1.09
1.83
-40
-20
0
20
40
Predicted top bar OCP
reading, mV (vs. Ag/AgCl)
Wet days / total exposure days
Daily average [Cl-], M
20-400-20-20-0-40--20
(a)
2033
4659
72
4451
5865
72
-35
5
45
85
125Predicted top
bar OCP reading, mV (vs.
Ag/AgCl)
Reading temperature, oF
Daily average temperature, oF
85-12545-855-45-35-5
(b)
F igur e 24. Predicted response surface of OCP of epoxy coated dowel bar in pavement mix as a function of: (a) daily average Cl- concentration and wet percent
time; (b) reading temperature and daily average exposure temperature
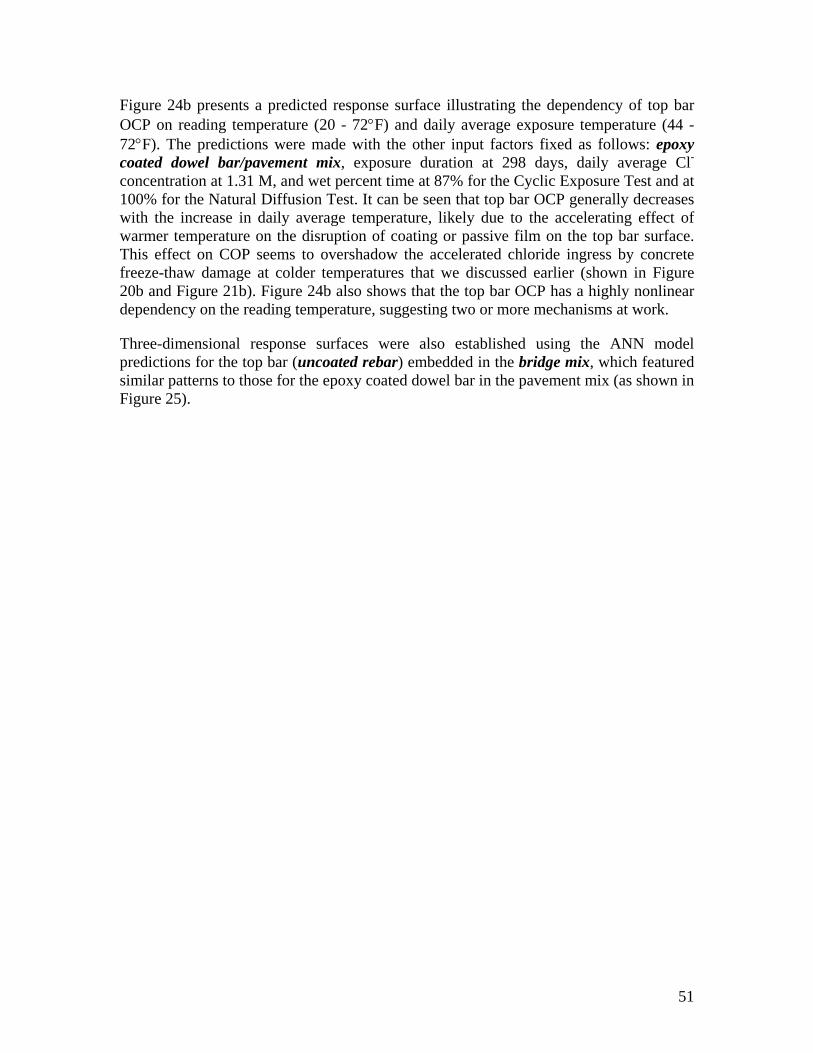
51
Figure 24b presents a predicted response surface illustrating the dependency of top bar OCP on reading temperature (20 - 72°F) and daily average exposure temperature (44 - 72°F). The predictions were made with the other input factors fixed as follows: epoxy coated dowel bar/pavement mix, exposure duration at 298 days, daily average Cl- concentration at 1.31 M, and wet percent time at 87% for the Cyclic Exposure Test and at 100% for the Natural Diffusion Test. It can be seen that top bar OCP generally decreases with the increase in daily average temperature, likely due to the accelerating effect of warmer temperature on the disruption of coating or passive film on the top bar surface. This effect on COP seems to overshadow the accelerated chloride ingress by concrete freeze-thaw damage at colder temperatures that we discussed earlier (shown in Figure 20b and Figure 21b). Figure 24b also shows that the top bar OCP has a highly nonlinear dependency on the reading temperature, suggesting two or more mechanisms at work.
Three-dimensional response surfaces were also established using the ANN model predictions for the top bar (uncoated rebar) embedded in the bridge mix, which featured similar patterns to those for the epoxy coated dowel bar in the pavement mix (as shown in Figure 25).
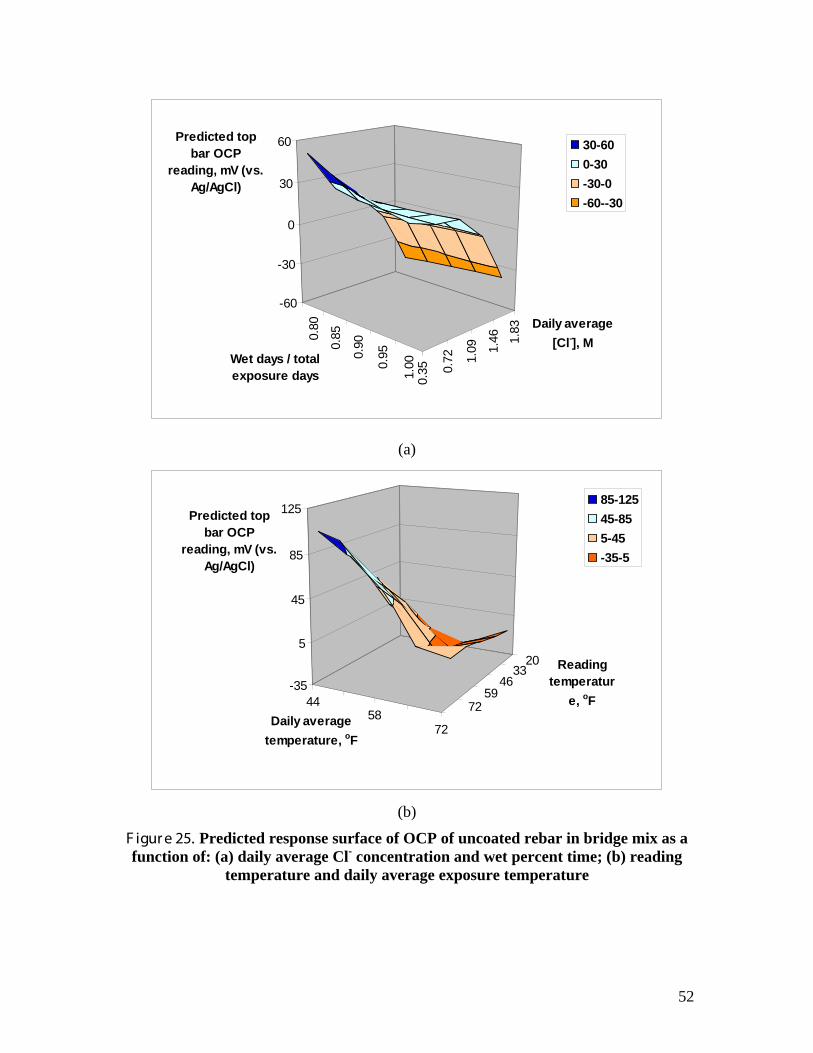
52
0.80
0.85
0.90
0.95
1.00
0.35 0.
72 1.09 1.
46 1.83
-60
-30
0
30
60Predicted top bar OCP
reading, mV (vs. Ag/AgCl)
Wet days / total exposure days
Daily average [Cl-], M
30-600-30-30-0-60--30
(a)
2033
4659
724458
72
-35
5
45
85
125Predicted top bar OCP
reading, mV (vs. Ag/AgCl)
Reading temperatur
e, oFDaily average
temperature, oF
85-12545-855-45-35-5
(b)
F igur e 25. Predicted response surface of OCP of uncoated rebar in bridge mix as a function of: (a) daily average Cl- concentration and wet percent time; (b) reading
temperature and daily average exposure temperature
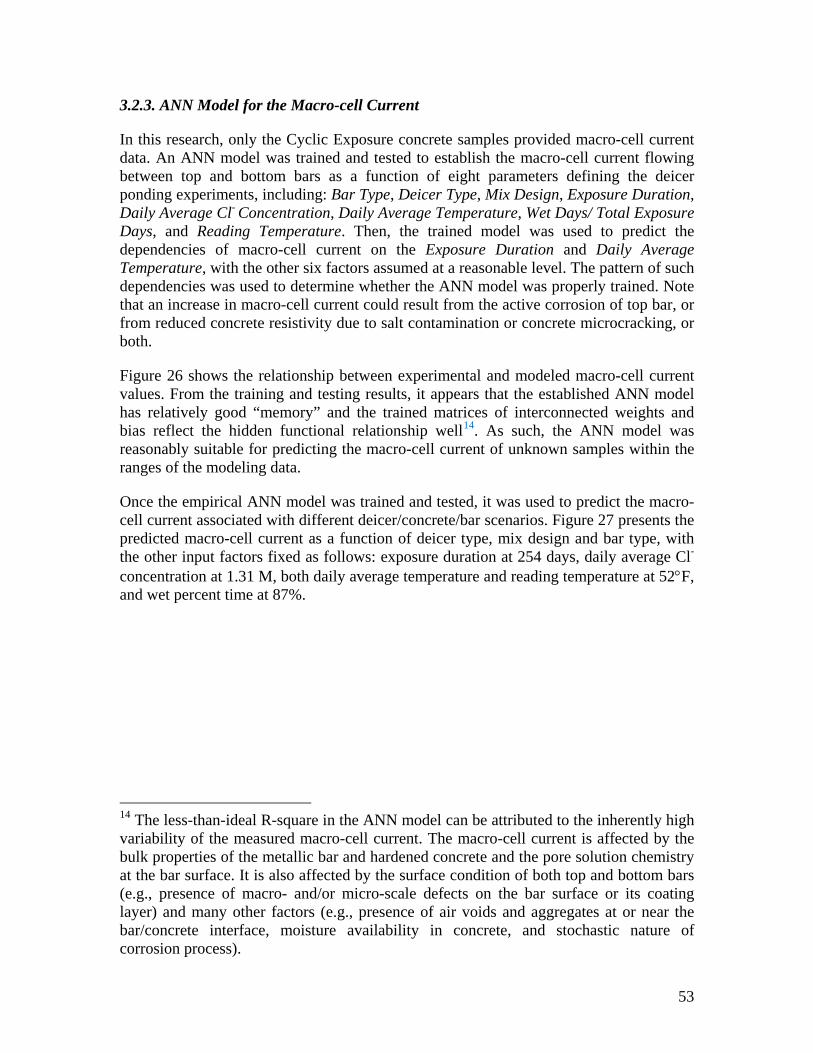
53
3.2.3. ANN Model for the Macro-cell Current
In this research, only the Cyclic Exposure concrete samples provided macro-cell current data. An ANN model was trained and tested to establish the macro-cell current flowing between top and bottom bars as a function of eight parameters defining the deicer ponding experiments, including: Bar Type, Deicer Type, Mix Design, Exposure Duration, Daily Average Cl- Concentration, Daily Average Temperature, Wet Days/ Total Exposure Days, and Reading Temperature. Then, the trained model was used to predict the dependencies of macro-cell current on the Exposure Duration and Daily Average Temperature, with the other six factors assumed at a reasonable level. The pattern of such dependencies was used to determine whether the ANN model was properly trained. Note that an increase in macro-cell current could result from the active corrosion of top bar, or from reduced concrete resistivity due to salt contamination or concrete microcracking, or both.
Figure 26 shows the relationship between experimental and modeled macro-cell current values. From the training and testing results, it appears that the established ANN model has relatively good “memory” and the trained matrices of interconnected weights and bias reflect the hidden functional relationship well14
Once the empirical ANN model was trained and tested, it was used to predict the macro-cell current associated with different deicer/concrete/bar scenarios. Figure 27 presents the predicted macro-cell current as a function of deicer type, mix design and bar type, with the other input factors fixed as follows: exposure duration at 254 days, daily average Cl- concentration at 1.31 M, both daily average temperature and reading temperature at 52°F, and wet percent time at 87%.
. As such, the ANN model was reasonably suitable for predicting the macro-cell current of unknown samples within the ranges of the modeling data.
14 The less-than-ideal R-square in the ANN model can be attributed to the inherently high variability of the measured macro-cell current. The macro-cell current is affected by the bulk properties of the metallic bar and hardened concrete and the pore solution chemistry at the bar surface. It is also affected by the surface condition of both top and bottom bars (e.g., presence of macro- and/or micro-scale defects on the bar surface or its coating layer) and many other factors (e.g., presence of air voids and aggregates at or near the bar/concrete interface, moisture availability in concrete, and stochastic nature of corrosion process).
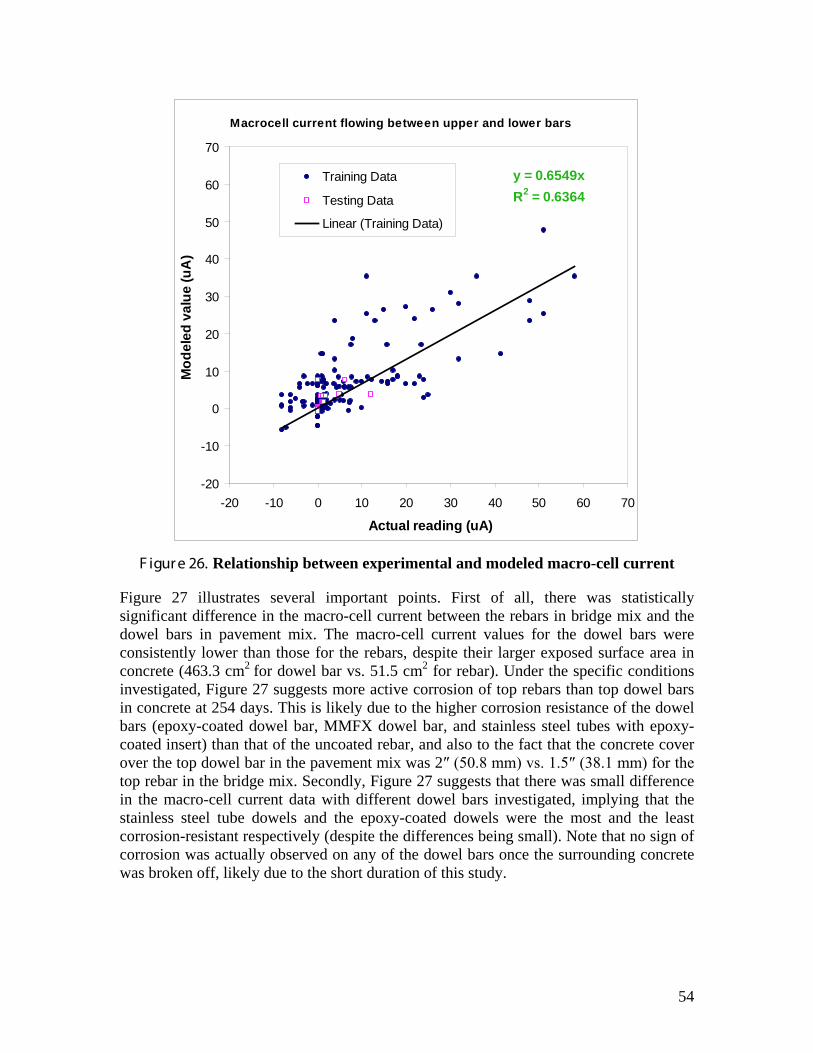
54
Macrocell current flowing between upper and lower bars
y = 0.6549xR2 = 0.6364
-20
-10
0
10
20
30
40
50
60
70
-20 -10 0 10 20 30 40 50 60 70
Actual reading (uA)
Mod
eled
val
ue (u
A)
Training Data
Testing Data
Linear (Training Data)
F igur e 26. Relationship between experimental and modeled macro-cell current
Figure 27 illustrates several important points. First of all, there was statistically significant difference in the macro-cell current between the rebars in bridge mix and the dowel bars in pavement mix. The macro-cell current values for the dowel bars were consistently lower than those for the rebars, despite their larger exposed surface area in concrete (463.3 cm2 for dowel bar vs. 51.5 cm2 for rebar). Under the specific conditions investigated, Figure 27 suggests more active corrosion of top rebars than top dowel bars in concrete at 254 days. This is likely due to the higher corrosion resistance of the dowel bars (epoxy-coated dowel bar, MMFX dowel bar, and stainless steel tubes with epoxy-coated insert) than that of the uncoated rebar, and also to the fact that the concrete cover over the top dowel bar in the pavement mix was 2″ (50.8 mm) vs. 1.5″ (38.1 mm) for the top rebar in the bridge mix. Secondly, Figure 27 suggests that there was small difference in the macro-cell current data with different dowel bars investigated, implying that the stainless steel tube dowels and the epoxy-coated dowels were the most and the least corrosion-resistant respectively (despite the differences being small). Note that no sign of corrosion was actually observed on any of the dowel bars once the surrounding concrete was broken off, likely due to the short duration of this study.
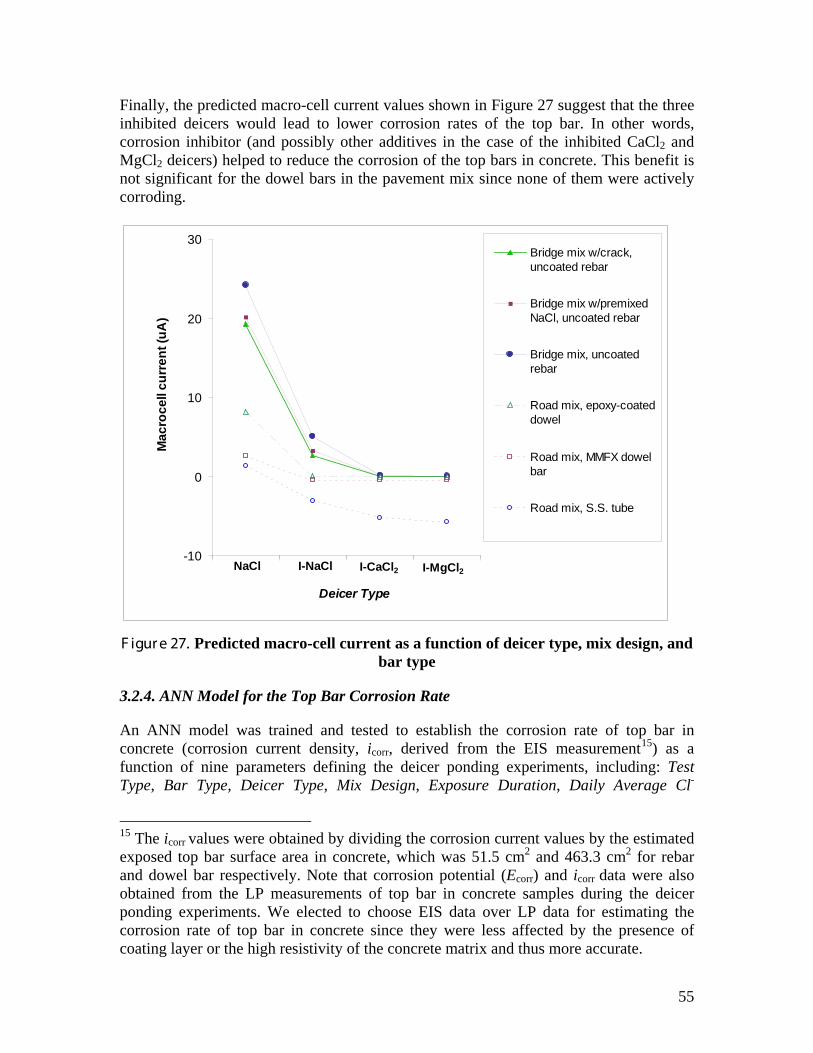
55
Finally, the predicted macro-cell current values shown in Figure 27 suggest that the three inhibited deicers would lead to lower corrosion rates of the top bar. In other words, corrosion inhibitor (and possibly other additives in the case of the inhibited CaCl2 and MgCl2 deicers) helped to reduce the corrosion of the top bars in concrete. This benefit is not significant for the dowel bars in the pavement mix since none of them were actively corroding.
I-MgCl2I-CaCl2I-NaClNaCl-10
0
10
20
30
Deicer Type
Mac
roce
ll cu
rren
t (uA
)
Bridge mix w/crack,uncoated rebar
Bridge mix w/premixedNaCl, uncoated rebar
Bridge mix, uncoatedrebar
Road mix, epoxy-coateddowel
Road mix, MMFX dowelbar
Road mix, S.S. tube
F igur e 27. Predicted macro-cell current as a function of deicer type, mix design, and
bar type
3.2.4. ANN Model for the Top Bar Corrosion Rate
An ANN model was trained and tested to establish the corrosion rate of top bar in concrete (corrosion current density, icorr, derived from the EIS measurement15
15 The icorr values were obtained by dividing the corrosion current values by the estimated exposed top bar surface area in concrete, which was 51.5 cm2 and 463.3 cm2 for rebar and dowel bar respectively. Note that corrosion potential (Ecorr) and icorr data were also obtained from the LP measurements of top bar in concrete samples during the deicer ponding experiments. We elected to choose EIS data over LP data for estimating the corrosion rate of top bar in concrete since they were less affected by the presence of coating layer or the high resistivity of the concrete matrix and thus more accurate.
) as a function of nine parameters defining the deicer ponding experiments, including: Test Type, Bar Type, Deicer Type, Mix Design, Exposure Duration, Daily Average Cl-
56
Concentration, Daily Average Temperature, Wet Days/ Total Exposure Days, and Reading Temperature. Then, the trained model was used to predict the dependencies of icorr on the Daily Average Temperature and Reading Temperature, with the other seven factors assumed at a reasonable level. The pattern of such dependencies was used to determine whether the ANN model was properly trained.
Figure 28 shows the relationship between experimental and modeled top bar icorr values. From the training and testing results, it appears that the established ANN model has very good “memory” and the trained matrices of interconnected weights and bias reflect the hidden functional relationship well. As such, the ANN model was reasonably suitable for predicting the top bar icorr value of unknown samples within the ranges of the modeling data.
y = 0.9681xR² = 0.9664
0.0
0.5
1.0
1.5
2.0
2.5
3.0
0.0 0.5 1.0 1.5 2.0 2.5 3.0
Mod
eled
val
ue (µ
A/c
m2 )
Actual reading (µA/cm2)
Corrosion Current Density of Top Bar (Determined by EIS)
Training dataTesting dataLinear (Training data)
F igur e 28. Relationship between experimental and modeled corrosion rate of top
bar in concrete
Once the empirical ANN model was trained and tested, it was used to predict the top bar icorr associated with different deicer/concrete/bar scenarios. Figure 29a and Figure 29b present the predicted top bar icorr as a function of deicer type, test type and bar type in the bridge and pavement mixes respectively, with the other input factors fixed as follows: exposure duration at 298 days, daily average Cl- concentration at 1.31 M, both daily average temperature and reading temperature at 72°F, and wet percent time at 87% for Cyclic Exposure and at 100% for Natural Diffusion.
Figure 29 illustrates several important points. First, there was statistically significant difference in the top bar icorr (indicative of its corrosion rate) between the rebars in bridge mix and the dowel bars in pavement mix. The icorr values for the dowel bars were consistently lower than those for the rebars. For this study, an icorr of 1 µA/cm2 was used
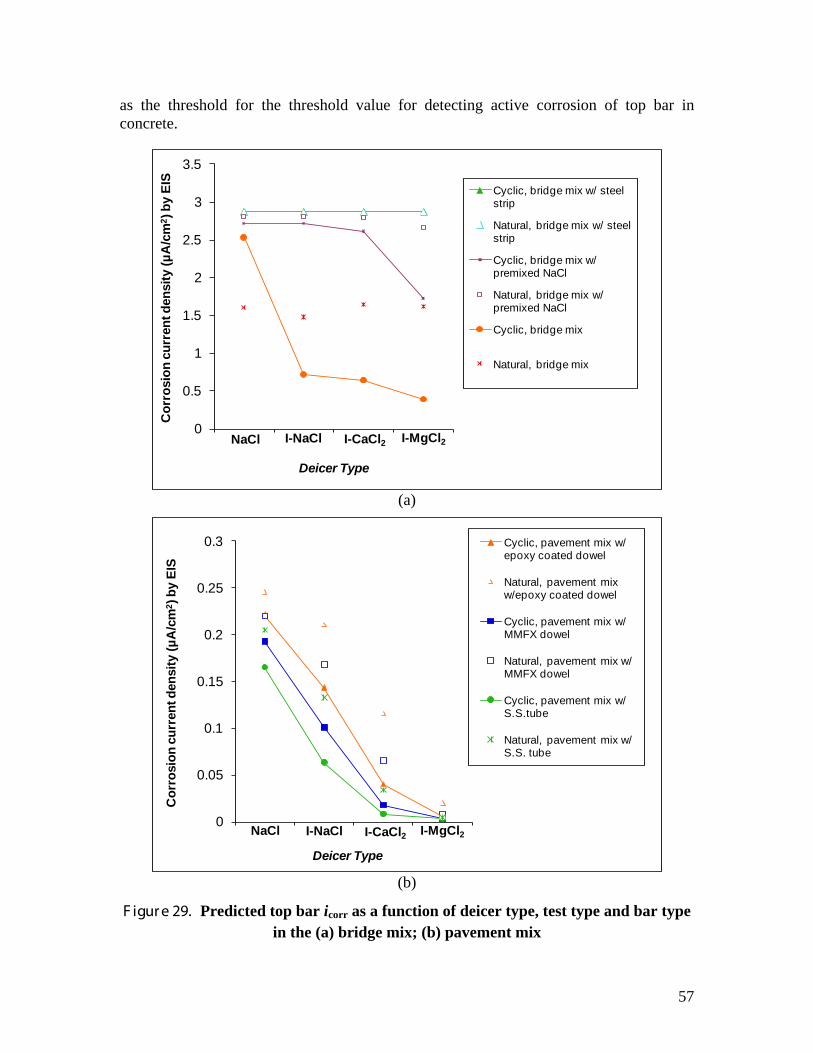
57
as the threshold for the threshold value for detecting active corrosion of top bar in concrete.
NaCl I-NaCl I-CaCl2 I-MgCl20
0.5
1
1.5
2
2.5
3
3.5C
orro
sion
cur
rent
den
sity
(µA
/cm
2 ) b
y EI
S
Deicer Type
Cyclic, bridge mix w/ steel strip
Natural, bridge mix w/ steel strip
Cyclic, bridge mix w/ premixed NaCl
Natural, bridge mix w/ premixed NaCl
Cyclic, bridge mix
Natural, bridge mix
(a)
NaCl I-NaCl I-CaCl2 I-MgCl20
0.05
0.1
0.15
0.2
0.25
0.3
Cor
rosi
on c
urre
nt d
ensi
ty (µ
A/c
m2 )
by
EIS
Deicer Type
Cyclic, pavement mix w/ epoxy coated dowel
Natural, pavement mix w/epoxy coated dowel
Cyclic, pavement mix w/ MMFX dowel
Natural, pavement mix w/ MMFX dowel
Cyclic, pavement mix w/ S.S.tube
Natural, pavement mix w/ S.S. tube
(b)
F igur e 29. Predicted top bar icorr as a function of deicer type, test type and bar type in the (a) bridge mix; (b) pavement mix
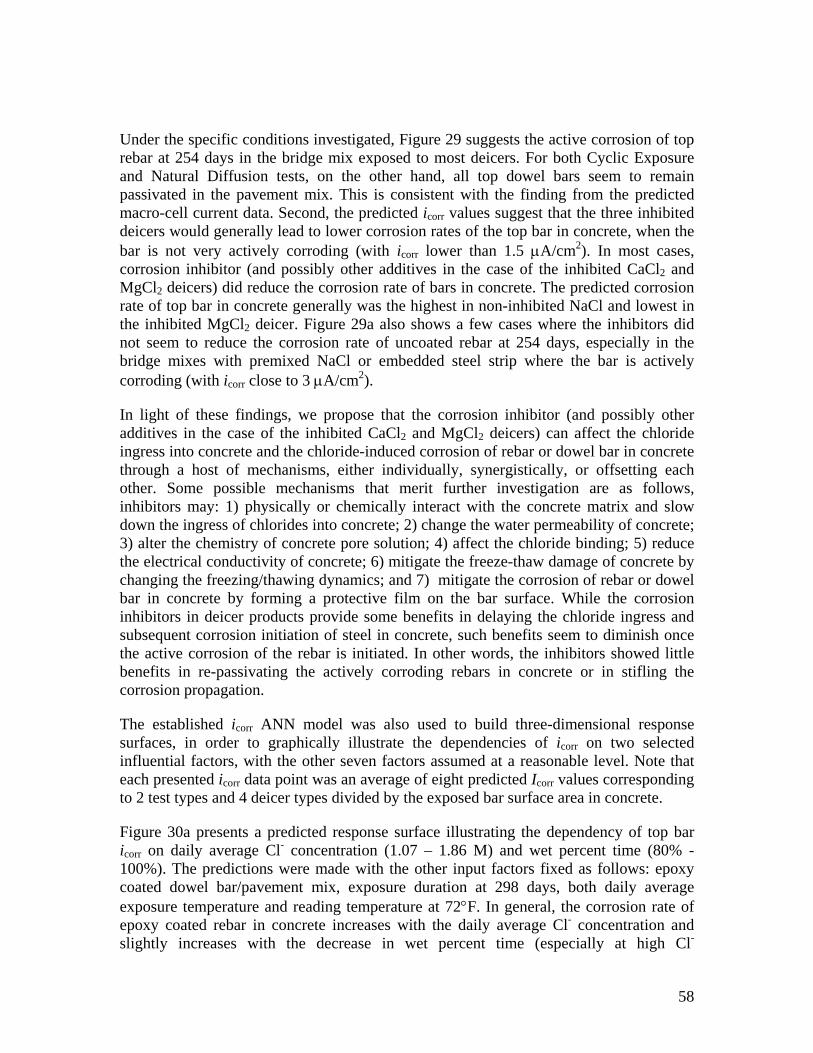
58
Under the specific conditions investigated, Figure 29 suggests the active corrosion of top rebar at 254 days in the bridge mix exposed to most deicers. For both Cyclic Exposure and Natural Diffusion tests, on the other hand, all top dowel bars seem to remain passivated in the pavement mix. This is consistent with the finding from the predicted macro-cell current data. Second, the predicted icorr values suggest that the three inhibited deicers would generally lead to lower corrosion rates of the top bar in concrete, when the bar is not very actively corroding (with icorr lower than 1.5 µA/cm2). In most cases, corrosion inhibitor (and possibly other additives in the case of the inhibited CaCl2 and MgCl2 deicers) did reduce the corrosion rate of bars in concrete. The predicted corrosion rate of top bar in concrete generally was the highest in non-inhibited NaCl and lowest in the inhibited MgCl2 deicer. Figure 29a also shows a few cases where the inhibitors did not seem to reduce the corrosion rate of uncoated rebar at 254 days, especially in the bridge mixes with premixed NaCl or embedded steel strip where the bar is actively corroding (with icorr close to 3 µA/cm2).
In light of these findings, we propose that the corrosion inhibitor (and possibly other additives in the case of the inhibited CaCl2 and MgCl2 deicers) can affect the chloride ingress into concrete and the chloride-induced corrosion of rebar or dowel bar in concrete through a host of mechanisms, either individually, synergistically, or offsetting each other. Some possible mechanisms that merit further investigation are as follows, inhibitors may: 1) physically or chemically interact with the concrete matrix and slow down the ingress of chlorides into concrete; 2) change the water permeability of concrete; 3) alter the chemistry of concrete pore solution; 4) affect the chloride binding; 5) reduce the electrical conductivity of concrete; 6) mitigate the freeze-thaw damage of concrete by changing the freezing/thawing dynamics; and 7) mitigate the corrosion of rebar or dowel bar in concrete by forming a protective film on the bar surface. While the corrosion inhibitors in deicer products provide some benefits in delaying the chloride ingress and subsequent corrosion initiation of steel in concrete, such benefits seem to diminish once the active corrosion of the rebar is initiated. In other words, the inhibitors showed little benefits in re-passivating the actively corroding rebars in concrete or in stifling the corrosion propagation.
The established icorr ANN model was also used to build three-dimensional response surfaces, in order to graphically illustrate the dependencies of icorr on two selected influential factors, with the other seven factors assumed at a reasonable level. Note that each presented icorr data point was an average of eight predicted Icorr values corresponding to 2 test types and 4 deicer types divided by the exposed bar surface area in concrete.
Figure 30a presents a predicted response surface illustrating the dependency of top bar icorr on daily average Cl- concentration (1.07 – 1.86 M) and wet percent time (80% - 100%). The predictions were made with the other input factors fixed as follows: epoxy coated dowel bar/pavement mix, exposure duration at 298 days, both daily average exposure temperature and reading temperature at 72°F. In general, the corrosion rate of epoxy coated rebar in concrete increases with the daily average Cl- concentration and slightly increases with the decrease in wet percent time (especially at high Cl-
59
concentrations). At 298 days, most icorr values are predicted to be below 1 µA/cm2 for the epoxy coated dowel bar.
Figure 30b presents a predicted response surface illustrating the dependency of top bar icorr on exposure duration (282 – 372 days) and daily average exposure temperature (51 - 72°F). The predictions were made with the other input factors fixed as follows: epoxy coated dowel bar/pavement mix, reading temperature at 72°F, daily average Cl- concentration at 1.31 M, and wet percent time at 87% for the Cyclic Exposure Test and at 100% for the Natural Diffusion Test. There was no active corrosion of the epoxy coated dowel bar until day 350 or so, where the top bar corrosion rate started to show significant increases with the daily average temperature (from 51°F to 72°F) and the exposure duration. This is reasonable since in this temperature range there is no freeze-thaw damage and higher temperature contributes to high reaction rates of concrete deterioration and steel corrosion.
Three-dimensional response surfaces were also established using the ANN model predictions for Stainless Steel tube (with epoxy coated insert) embedded in the pavement mix (as shown in Figure 31), which featured very similar patterns to those for the epoxy coated dowel bar (as shown in Figure 30) except significantly lower icorr values. Response surfaces were also established using the ANN model predictions for the MMFX dowel bar in the pavement mix, which also featured very similar patterns to those in Figure 30 with icorr values between the other two dowel bars.
Figure 32a presents a predicted response surface illustrating the dependency of top bar icorr on daily average Cl- concentration (1.07 – 1.86 M) and wet percent time (80% - 100%). The predictions were made with the other input factors fixed as follows: uncoated rebar in the bridge mix (in the absence or presence of embedded steel strip or admixed 0.1% NaCl), exposure duration at 298 days, both daily average exposure temperature and reading temperature at 72°F. The uncoated rebar in the bridge mix featured icorr values generally higher than 1 µA/cm2 (indicative active corrosion of the top bar), which have a highly non-linear dependency on the daily average chloride concentration and are not significantly affected by the change in wet percent time.
Figure 32b presents a predicted response surface illustrating the dependency of top bar icorr on exposure duration (282 – 372 days) and daily average exposure temperature (51 - 72°F). The predictions were made with the other input factors fixed as follows: uncoated rebar in the bridge mix (in the absence or presence of embedded steel strip or admixed 0.1% NaCl), reading temperature at 72°F, daily average Cl- concentration at 1.31 M, and wet percent time at 87% for the Cyclic Exposure Test and at 100% for the Natural Diffusion Test. The corrosion rate of top dowel bar increases significantly, as the daily average temperature increases from 51°F to 72°F. This confirms the important role of temperature in accelerating metallic corrosion in concrete. The corrosion rate of dowel bar shows a non-linear behavior as the exposure duration increases from 282 days to 372 days. This possibly reflects the formation and subsequent disruption of a compact rust layer as corrosion progresses.
60
1.07 1.
27 1.47 1.
66 1.86
0.0
0.5
1.0
1.5
2.0
0.80
0.85
0.90
0.95
1.00
Daily avg. [Cl-], M
Predicted top bar icorr, µA/cm2
Wet days / total exposure days
1.5-2.0
1.0-1.5
0.5-1.0
0.0-0.5
(a)
5156
6267
720.0
0.5
1.0
1.5
2.0
282 305327
350372
Daily avg. temp., oF
Predicted top bar icorr, µA/cm2
Exposure duration, days
1.5-2.0
1.0-1.5
0.5-1.0
0.0-0.5
(b)
F igur e 30. Predicted response surface of icorr of epoxy-coated dowel bar in pavement mix as a function of: (a) daily average Cl- concentration and wet percent time; (b)
exposure duration and daily average exposure temperature
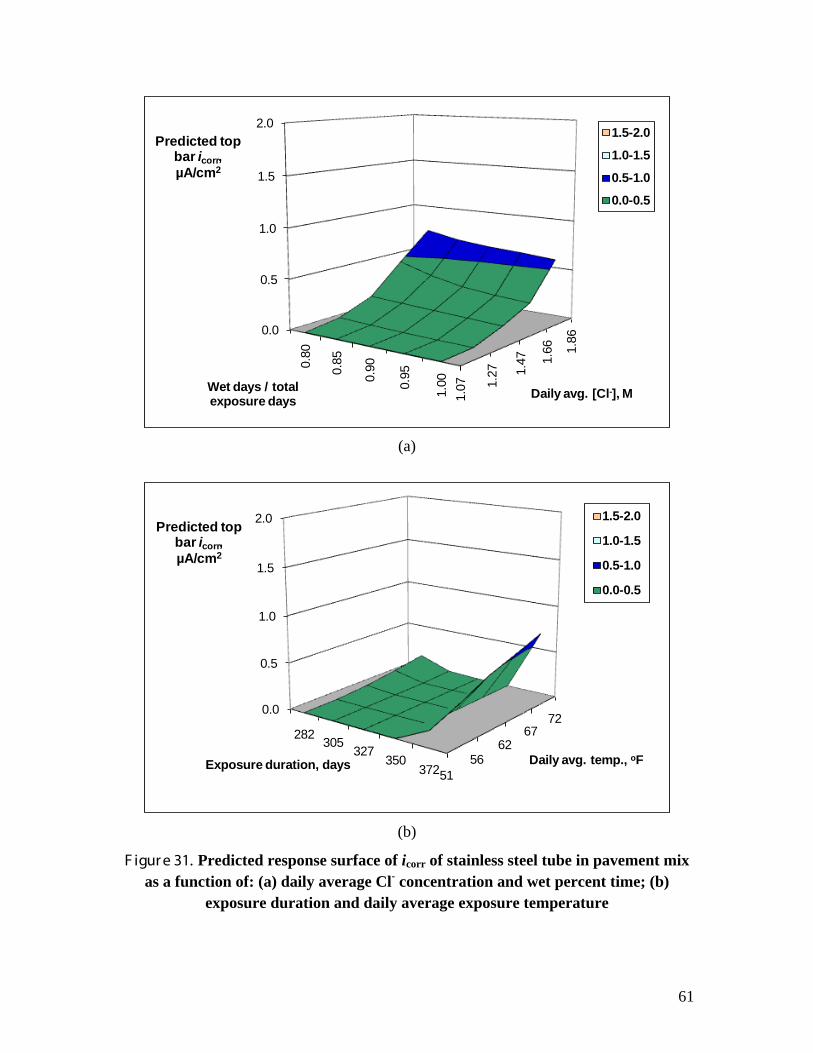
61
1.07 1.
27 1.47 1.
66 1.86
0.0
0.5
1.0
1.5
2.0
0.80
0.85
0.90
0.95
1.00
Daily avg. [Cl-], M
Predicted top bar icorr, µA/cm2
Wet days / total exposure days
1.5-2.0
1.0-1.5
0.5-1.0
0.0-0.5
(a)
5156
6267
720.0
0.5
1.0
1.5
2.0
282 305327
350372
Daily avg. temp., oF
Predicted top bar icorr, µA/cm2
Exposure duration, days
1.5-2.0
1.0-1.5
0.5-1.0
0.0-0.5
(b)
F igur e 31. Predicted response surface of icorr of stainless steel tube in pavement mix as a function of: (a) daily average Cl- concentration and wet percent time; (b)
exposure duration and daily average exposure temperature
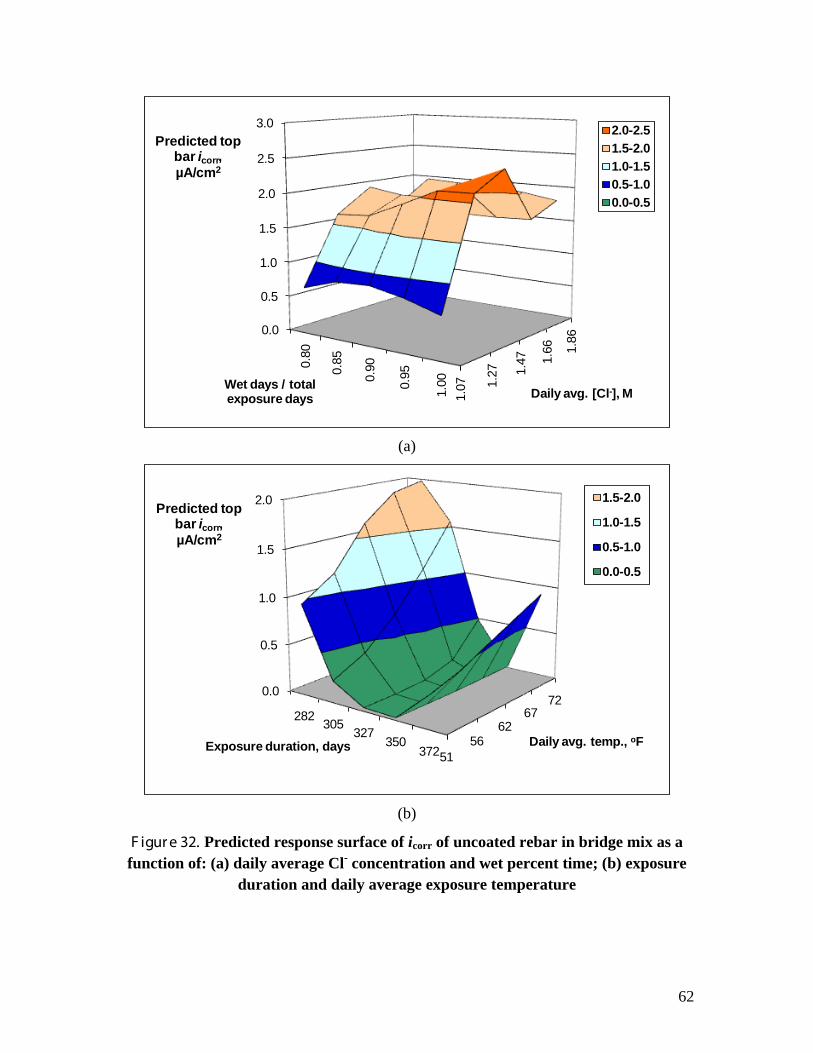
62
1.07 1.
27 1.47 1.
66 1.86
0.0
0.5
1.0
1.5
2.0
2.5
3.0
0.80
0.85
0.90
0.95
1.00
Daily avg. [Cl-], M
Predicted top bar icorr, µA/cm2
Wet days / total exposure days
2.0-2.51.5-2.01.0-1.50.5-1.00.0-0.5
(a)
5156
6267
720.0
0.5
1.0
1.5
2.0
282 305327
350372
Daily avg. temp., oF
Predicted top bar icorr, µA/cm2
Exposure duration, days
1.5-2.0
1.0-1.5
0.5-1.0
0.0-0.5
(b)
F igur e 32. Predicted response surface of icorr of uncoated rebar in bridge mix as a function of: (a) daily average Cl- concentration and wet percent time; (b) exposure
duration and daily average exposure temperature
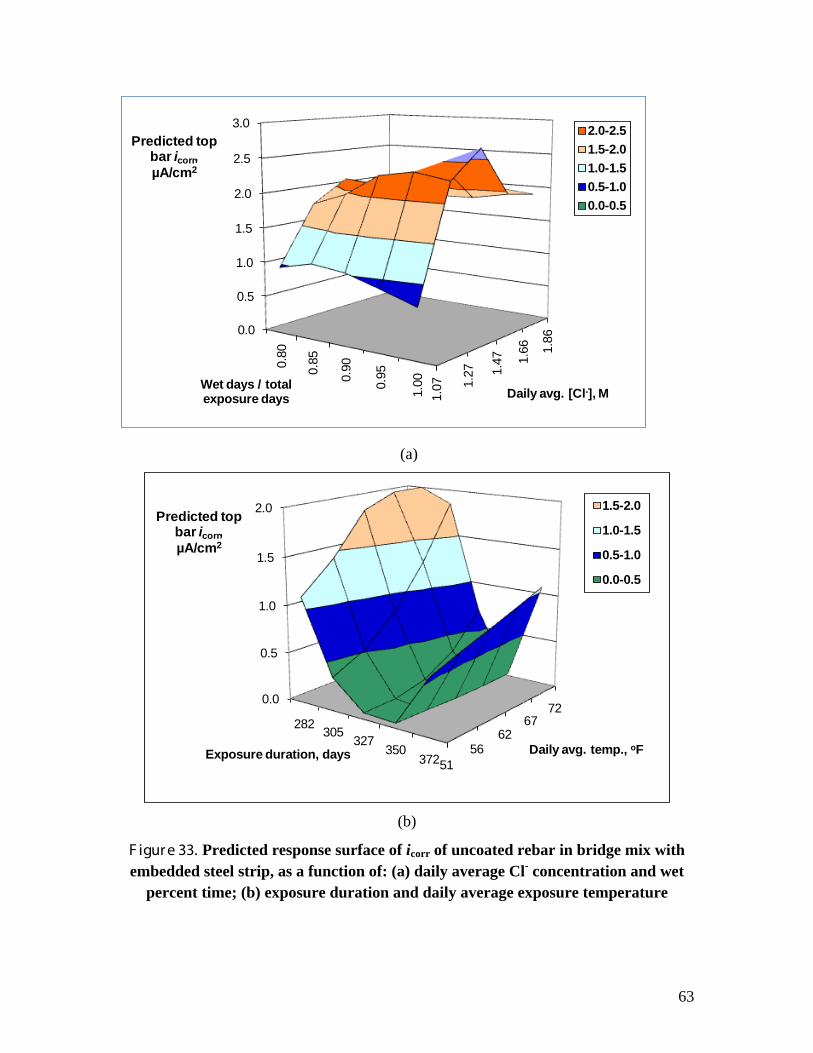
63
1.07 1.
27 1.47 1.
66 1.86
0.0
0.5
1.0
1.5
2.0
2.5
3.0
0.80
0.85
0.90
0.95
1.00
Daily avg. [Cl-], M
Predicted top bar icorr, µA/cm2
Wet days / total exposure days
2.0-2.51.5-2.01.0-1.50.5-1.00.0-0.5
(a)
5156
6267
720.0
0.5
1.0
1.5
2.0
282 305327
350372
Daily avg. temp., oF
Predicted top bar icorr, µA/cm2
Exposure duration, days
1.5-2.0
1.0-1.5
0.5-1.0
0.0-0.5
(b)
F igur e 33. Predicted response surface of icorr of uncoated rebar in bridge mix with embedded steel strip, as a function of: (a) daily average Cl- concentration and wet
percent time; (b) exposure duration and daily average exposure temperature
64
Three-dimensional response surfaces were also established using the ANN model predictions for the uncoated rebar in bridge mix with embedded steel strip (as shown in Figure 33), which featured very similar patterns to those without the steel strip (as shown in Figure 32) but slightly higher icorr values. Response surfaces were also established using the ANN model predictions for the uncoated rebar in bridge mix with admixed 0.1% NaCl, which also featured very similar patterns and icorr values to those in Figure 32 and Figure 33.
Note that the presence of air voids and aggregates at or near the bar/concrete interface, the presence of macro- and/or micro-scale defects on the bar surface or its coating layer, and the stochastic nature of corrosion process could have all contributed to the variability in the top bar icorr readings obtained in this study.
3.3. Conclusions
Prior to this research, little was known about the possible contribution or risk deicer inhibitors (and other additives) pose to infrastructure preservation. Therefore, research was needed to determine whether or not corrosion-inhibited deicers provide benefits in mitigating the corrosion of rebars or dowel bars in concrete, relative to the “straight salt”. To this end, extensive laboratory tests were conducted to assess the effect of chloride-based deicers on steel in concrete and to determine whether or not deicer corrosion inhibitors help preserve the transportation infrastructure. The key findings and conclusions are presented as follows:
1. We obtained the EDX data to derive the apparent chloride diffusion coefficient, Dapp, in the concrete samples subjected to the Natural Diffusion Test (room temperature, 330-347 days). The chloride diffusion coefficient of the corrosion-inhibited NaCl was significantly lower than that of non-inhibited NaCl (the control), implying beneficial role of the corrosion inhibitor in slowing down the ingress of chloride into concrete.
2. The laboratory testing revealed mixed effects of continuous deicer exposure at room temperature on the compressive strength of Portland cement concrete and suggested little benefits of corrosion inhibitor added in deicers. The corrosion inhibitors in deicers, however, demonstrated a beneficial role in preserving the concrete strength for concrete specimens underwent temperature and wet/dry cycles during deicer exposure. The inhibited MgCl2 deicers posed a greater risk to concrete strength, relative to the other three deicers investigated.
3. Great variability was observed in the numerous data obtained from the periodical monitoring of chloride sensor potential, top bar potential, macro-cell current, and top bar corrosion rate during the deicer ponding experiments. As such, ANN-based predictive models were established to filter the noises from the signals in the data and to identify meaningful patterns. From the training and testing results, it appears that the established ANN models have relatively good or selective “memory” and the trained matrices of interconnected weights and bias reflect the hidden functional relationship well.
65
4. The chloride sensor data suggest that corrosion inhibitor (and possibly other additives in the case of the inhibited CaCl2 and MgCl2 deicers) did slow down the ingress of chloride into concrete, for both natural diffusion and cyclic exposure tests. This benefit of corrosion inhibitor in deicers held true for all concrete mixes and was especially significant for concrete samples subjected to the Cyclic Exposure Test or with premixed NaCl or embedded steel strip. Among the four deicers investigated, the Cl- associated with non-inhibited NaCl penetrated into concrete at the highest rate whereas that of the inhibited-MgCl2 and CaCl2 deicers penetrated at much lower rates.
5. The electrochemical potential data suggest that corrosion inhibitor (and possibly other additives in the case of the inhibited CaCl2 and MgCl2 deicers) led to more positive top bar OCP values at 298 days, implying the beneficial role of inhibitors in reducing the active corrosion risk of bars in concrete.
6. The macro-cell current data suggest that corrosion inhibitor (and possibly other additives in the case of the inhibited CaCl2 and MgCl2 deicers) helped to reduce the corrosion rate of the top bars in concrete. This benefit is not significant for the dowel bars in the pavement mix since none of them are actively corroding, based on the ANN model predictions for the given conditions. According to the ANN modeling, the dowel bars show consistently lower macro-cell current values at 254 days than the rebars, despite their larger exposed surface area in concrete. This is likely due to the higher corrosion resistance of the dowel bars (epoxy-coated dowel bar, MMFX dowel bar, and stainless steel tubes with epoxy-coated insert) than that of the uncoated rebar, and also to the fact that the concrete cover over the top dowel bar in the pavement mix was 2″ (50.8 mm) vs. 1.5″ (38.1 mm) for the top rebar in the bridge mix.
7. The corrosion rate data of top bar in concrete suggest that in most cases, corrosion inhibitor (and possibly other additives in the case of the inhibited CaCl2 and MgCl2 deicers) did reduce the corrosion rate of bars in concrete. The ANN modeling shows active corrosion of top rebar at 254 days in the bridge mix exposed to most deicers, whereas all top dowel bars seem to remain passivated in the pavement mix. The predicted corrosion rate of top bar in concrete generally was the highest in non-inhibited NaCl and lowest in the inhibited MgCl2 deicer. The benefit of deicer inhibitors for bars in concrete was not significant for the bridge mixes with premixed NaCl or embedded steel strip where the bar is actively corroding (with icorr close to 3 µA/cm2).
8. While the corrosion inhibitors in deicer products provide some benefits in delaying the chloride ingress and subsequent corrosion initiation of steel in concrete, such benefits seem to diminish once the active corrosion of the rebar is initiated. In other words, the inhibitors showed little benefits in re-passivating the actively corroding rebars in concrete or in stifling the corrosion propagation.
66
3.4. References
[1] C.L. Page, P. Lambert, and P.R.W. Vassie, Mater. Struct. 24(4) (1991), 243-252. [2] K. Hong and R.D Hooton, Cem. Conc. Res. 29(9) (1999), 1379-1386. [3] A. Boddy, E. Bentz, M.D.A. Thomas, and R.D Hooton, Cem. Conc. Res. 29(6)
(1999), 827-837.
67
C H A PT E R 4. C H E M I C A L C H A NG E OF POR T L A ND C E M E NT C ONC R E T E E X POSE D T O DE I C E R S
This chapter provides the results and discussion regarding the combined use of FESEM and EDX to examine the effect of deicer ponding experiments on the chemistry of concrete.
4.1. Introduction
In light of existing knowledge base, deicers may pose a risk for the durability of Portland cement concrete (PCC) structures and pavements through three main pathways: 1). physical deterioration of the concrete surface by salt scaling; 2). chemical reactions between deicers and concrete; and 3). deicer aggravating aggregate-cement reactions.
First, the scaling of concrete in presence of deicers, referred to as “salt scaling”, has been recognized as the main cause for frost-related concrete deterioration, and has been found closely related to concrete quality (e.g., air entrainment level), weather conditions, and the number of freeze/thaw cycles [1,2,3]. Recently, however, the treatment of PCC with sodium acetate solutions was claimed to be a promising technology to reduce water penetration into concrete and thus extend the service life of concrete [4].
Second, previous research studies have shown that concentrated MgCl2-based deicers cause more severe deterioration to concrete than those based on CaCl2 or NaCl. This is due to the reaction between Mg2+ and the hydrated products in cement paste [5-9], which has been reported to be responsible for the degradation of concrete matrix caused by MgCl2 and calcium magnesium acetate (CMA) [10]. It has also been found that concrete exposed to concentrated CaCl2 deteriorated in a similar pattern to those exposed to MgCl2, although at a slower and less severe pace [11].
Finally, both MgCl2 and CaCl2 deicers are known to deteriorate concretes containing reactive dolomite (CaMg(CO3)2) aggregates by accelerating the alkali-carbonate reaction (ACR) [12-13]. The long-term use of NaCl can initiate and/or accelerate alkali-silica reaction (ASR) by supplying additional alkalis to concrete [14-18], whereas CaCl2 and MgCl2 do not have as obvious an effect on ASR. Recent research has found that the acetate or formate-based deicers could induce increased levels of expansion in concrete with ASR-susceptible aggregates, and could trigger ASR in concrete that previously did not show ASR susceptibility [19-21].
A recent investigation at our laboratory examined the effect of diluted deicers on the durability of a non-air-entrained PCC [22]. Under the experimental conditions in the study, the CMA solid deicer and the MgCl2 liquid deicer were benign to the concrete durability, whereas potassium formate and the sodium-acetate/sodium-formate blend deicer showed moderate amount of weight loss and noticeable deterioration of the concrete. NaCl, the NaCl-based deicer, and the potassium-acetate-based deicer were the most deleterious to the concrete. In addition to exacerbating physical distresses, each investigated chemical or diluted deicer chemically reacted with some of the cement hydrates and formed new products in the pores and cracks. Such physiochemical changes
68
of the cement paste induced by the deicers pose various levels of risks for the concrete durability [22].
Most previous studies on deicer/concrete interactions generally focused on macroscopic observations and property testing. In this study, we aim to shed more light on the underlying mechanisms responsible for the accelerated deterioration of concrete in the presence of chloride-based deicers with or without corrosion inhibitor, by focusing on physiochemical changes induced by the deicers at the microscopic level of the concrete. To this end, we utilized two types of concrete samples and subjected them to four common deicers (diluted from their eutectic concentration by an average factor of 100:31), allowing the natural diffusion of chlorides into the water-saturated concrete at room temperature for an extended time (330-347 days16
The following sections provide the relevant results and discussion.
), before the FESEM/EDX investigation. Specifically, the solutions used for the Natural Diffusion Test had the following average salt (Cl-) concentrations, 7.7% (1.31 M), 7.8% (1.33 M), 8.2% (1.48 M), 8.8% (1.86 M) for the non-inhibited NaCl, the inhibited NaCl, the inhibited CaCl2 deicer, and the inhibited MgCl2 deicer respectively.
4.2. Results and Discussion
To elucidate the analysis of chemical changes of concrete induced by deicer exposure, for elemental for each deicer/concrete combination, we took slice specimens at two different deicer penetration depth (1 mm and 12 mm respectively) for analysis. Areas used for EDX analysis corresponded directly to the FESEM morphological examination at 500X magnification and at least five areas were analyzed for the given depth of each sample. The area analyzed for elemental analysis by EDX was approximately 212.5µm by 143.75µm. Subsequently, we analyzed the EDX-derived elemental concentration of calcium (Ca) as well as several relative ratios of critical elements indicative of the cement hydrates and their possible reaction products with deicers (and associated additives). The data are provided in Figure 34 and Figure 35 respectively in the form of box plots. Note that box plot is a well-established statistical way of graphically illustrating groups of numerical data, in which the top, middle and bottom line of the box itself corresponds to the 75-, 50-, and 25-percentile value (x.75, x.5, and x.25) respectively. The inter-quartile range (IQR) is defined by subtracting the first quartile from the third quartile (x.75 − x.25).
16 Some samples showed significant evidence of action corrosion at the top bar and were terminated from the Natural Diffusion Test on day 330 while other continued until day 347.
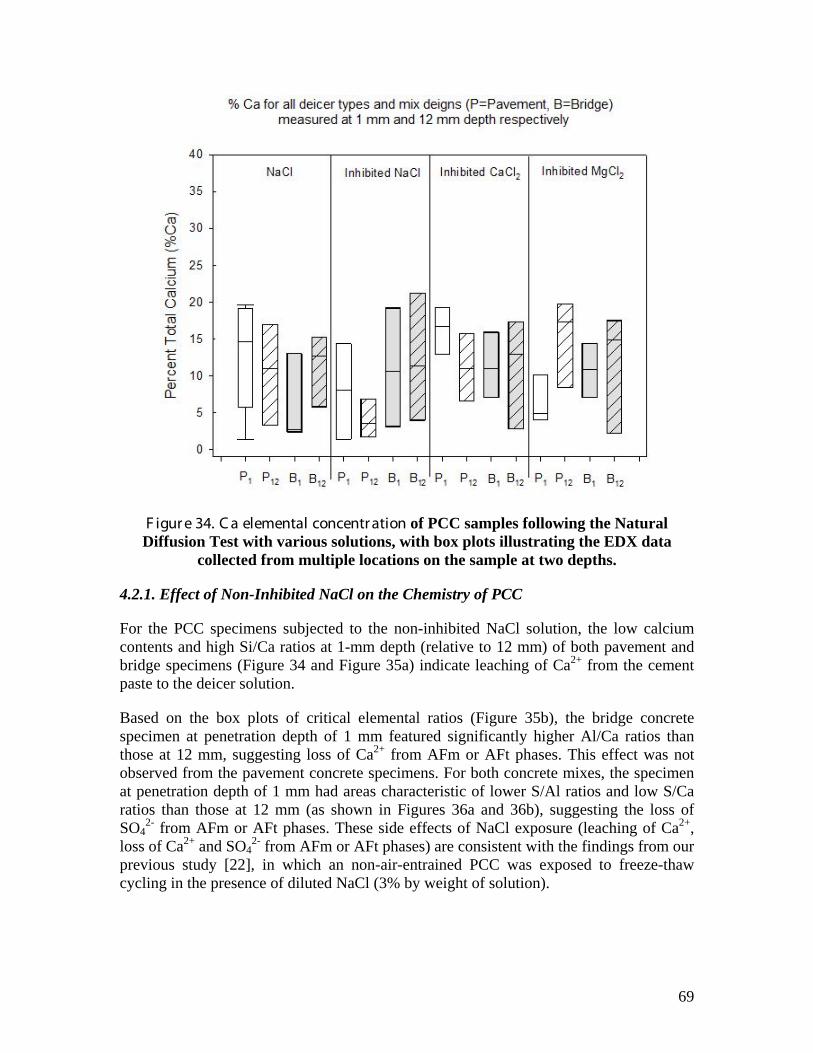
69
F igur e 34. C a elemental concentr ation of PCC samples following the Natural Diffusion Test with various solutions, with box plots illustrating the EDX data
collected from multiple locations on the sample at two depths.
4.2.1. Effect of Non-Inhibited NaCl on the Chemistry of PCC
For the PCC specimens subjected to the non-inhibited NaCl solution, the low calcium contents and high Si/Ca ratios at 1-mm depth (relative to 12 mm) of both pavement and bridge specimens (Figure 34 and Figure 35a) indicate leaching of Ca2+ from the cement paste to the deicer solution.
Based on the box plots of critical elemental ratios (Figure 35b), the bridge concrete specimen at penetration depth of 1 mm featured significantly higher Al/Ca ratios than those at 12 mm, suggesting loss of Ca2+ from AFm or AFt phases. This effect was not observed from the pavement concrete specimens. For both concrete mixes, the specimen at penetration depth of 1 mm had areas characteristic of lower S/Al ratios and low S/Ca ratios than those at 12 mm (as shown in Figures 36a and 36b), suggesting the loss of SO4
2- from AFm or AFt phases. These side effects of NaCl exposure (leaching of Ca2+, loss of Ca2+ and SO4
2- from AFm or AFt phases) are consistent with the findings from our previous study [22], in which an non-air-entrained PCC was exposed to freeze-thaw cycling in the presence of diluted NaCl (3% by weight of solution).
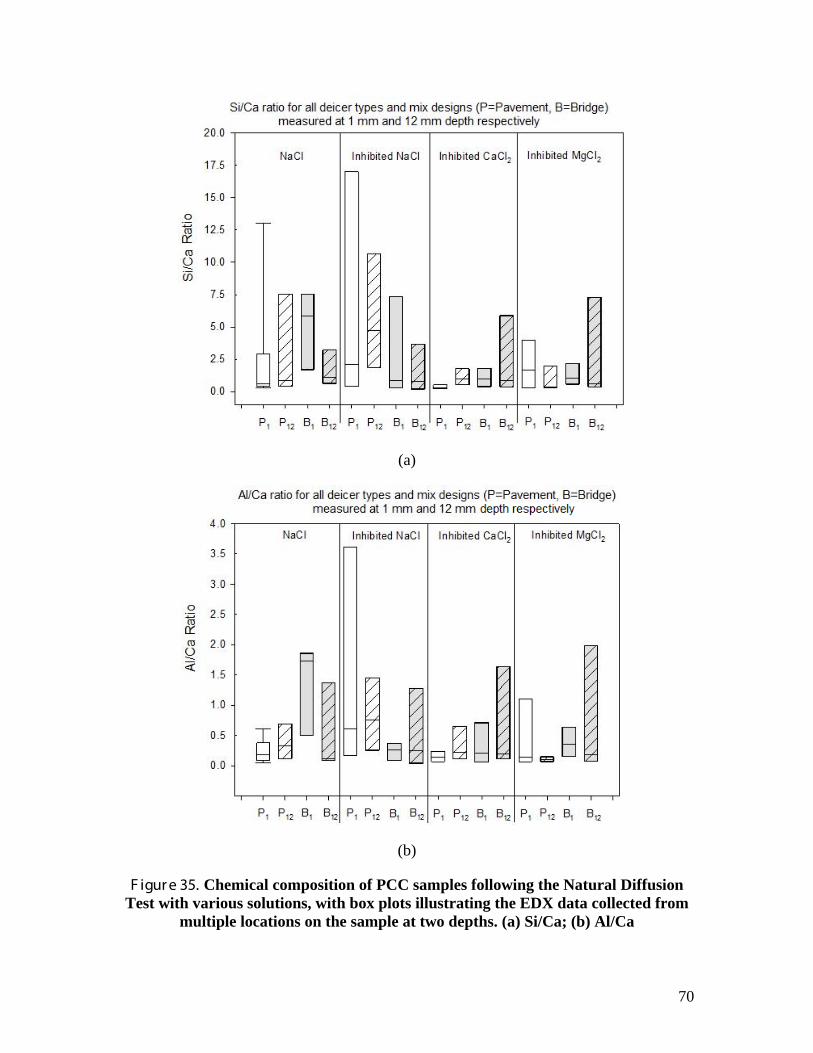
70
(a)
(b)
F igur e 35. Chemical composition of PCC samples following the Natural Diffusion Test with various solutions, with box plots illustrating the EDX data collected from
multiple locations on the sample at two depths. (a) Si/Ca; (b) Al/Ca
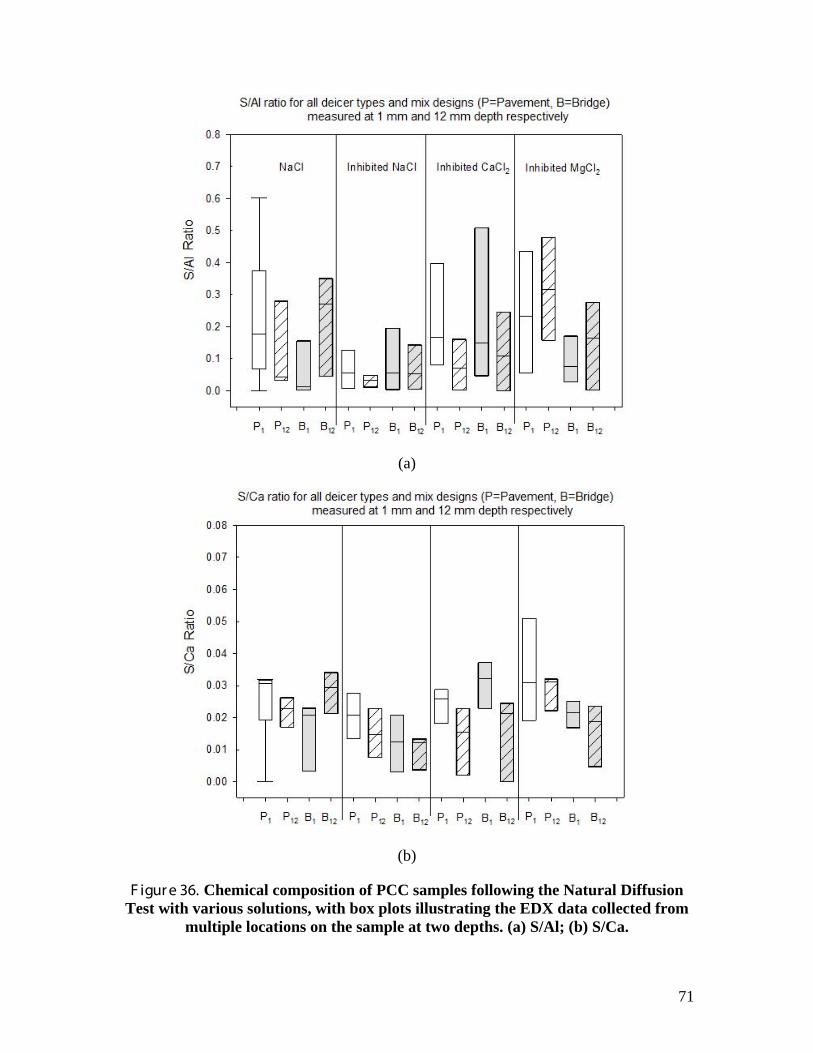
71
(a)
(b)
F igur e 36. Chemical composition of PCC samples following the Natural Diffusion Test with various solutions, with box plots illustrating the EDX data collected from
multiple locations on the sample at two depths. (a) S/Al; (b) S/Ca.
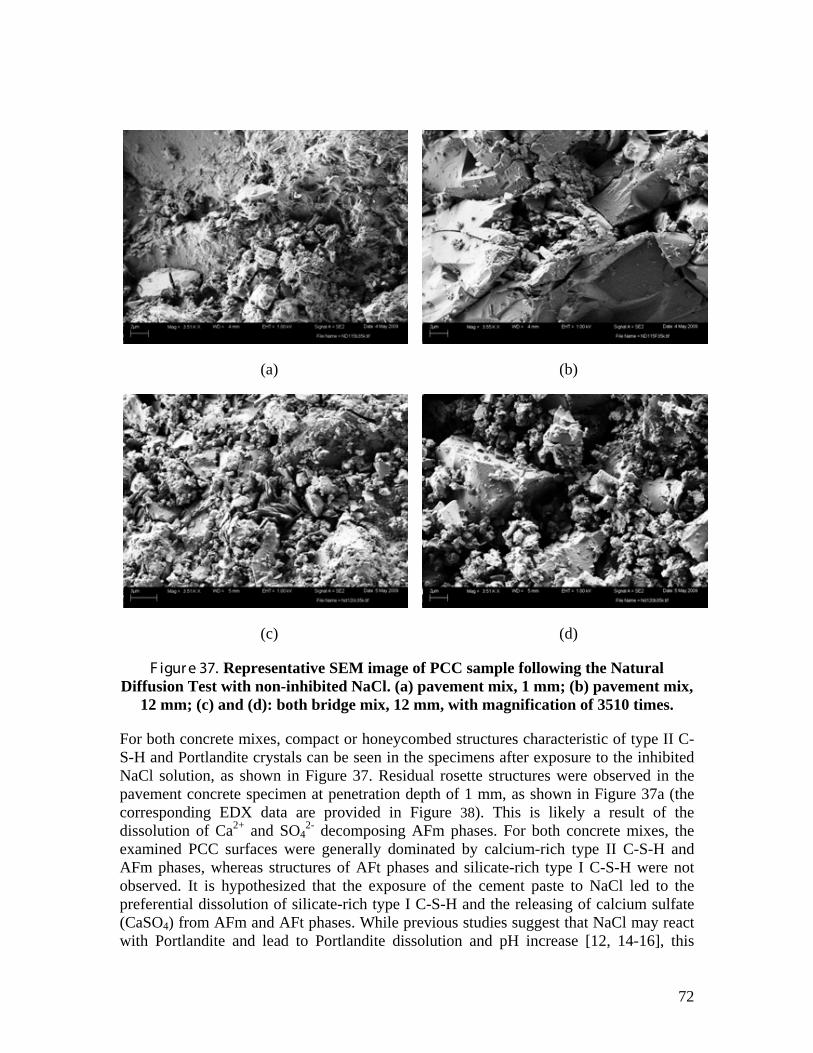
72
(a)
(b)
(c)
(d)
F igur e 37. Representative SEM image of PCC sample following the Natural Diffusion Test with non-inhibited NaCl. (a) pavement mix, 1 mm; (b) pavement mix,
12 mm; (c) and (d): both bridge mix, 12 mm, with magnification of 3510 times.
For both concrete mixes, compact or honeycombed structures characteristic of type II C-S-H and Portlandite crystals can be seen in the specimens after exposure to the inhibited NaCl solution, as shown in Figure 37. Residual rosette structures were observed in the pavement concrete specimen at penetration depth of 1 mm, as shown in Figure 37a (the corresponding EDX data are provided in Figure 38). This is likely a result of the dissolution of Ca2+ and SO4
2- decomposing AFm phases. For both concrete mixes, the examined PCC surfaces were generally dominated by calcium-rich type II C-S-H and AFm phases, whereas structures of AFt phases and silicate-rich type I C-S-H were not observed. It is hypothesized that the exposure of the cement paste to NaCl led to the preferential dissolution of silicate-rich type I C-S-H and the releasing of calcium sulfate (CaSO4) from AFm and AFt phases. While previous studies suggest that NaCl may react with Portlandite and lead to Portlandite dissolution and pH increase [12, 14-16], this
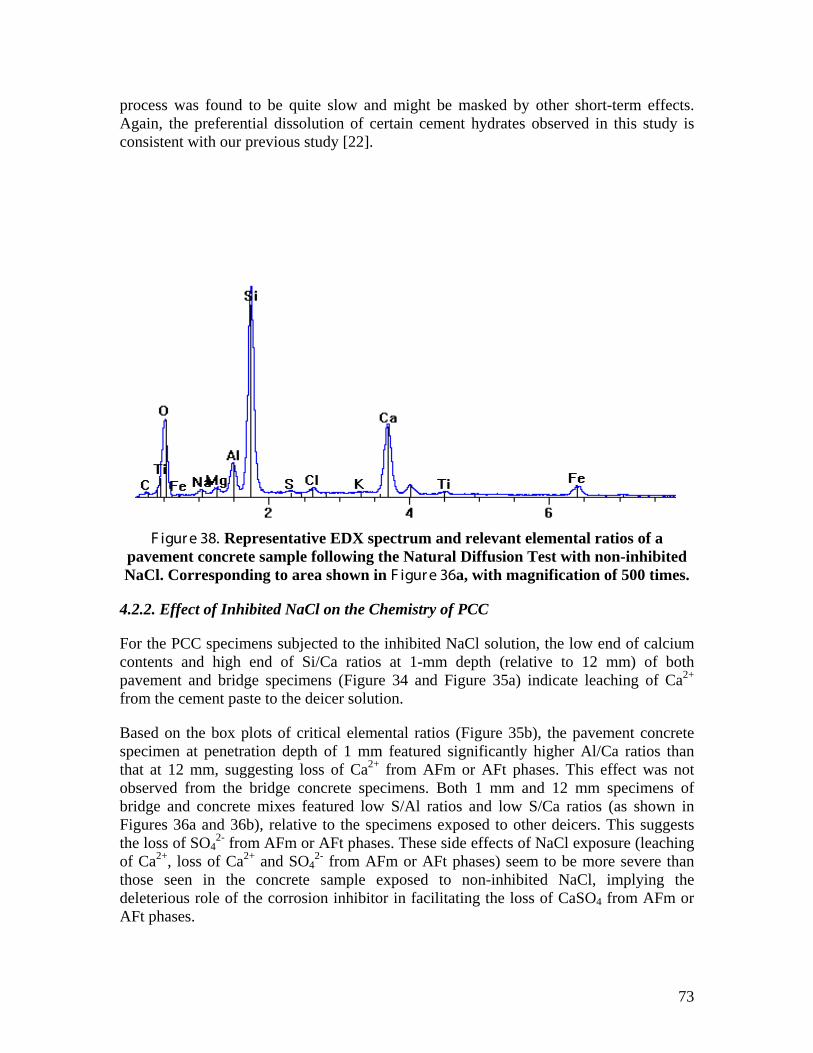
73
process was found to be quite slow and might be masked by other short-term effects. Again, the preferential dissolution of certain cement hydrates observed in this study is consistent with our previous study [22].
F igur e 38. Representative EDX spectrum and relevant elemental ratios of a pavement concrete sample following the Natural Diffusion Test with non-inhibited NaCl. Corresponding to area shown in F igur e 36a, with magnification of 500 times.
4.2.2. Effect of Inhibited NaCl on the Chemistry of PCC
For the PCC specimens subjected to the inhibited NaCl solution, the low end of calcium contents and high end of Si/Ca ratios at 1-mm depth (relative to 12 mm) of both pavement and bridge specimens (Figure 34 and Figure 35a) indicate leaching of Ca2+ from the cement paste to the deicer solution.
Based on the box plots of critical elemental ratios (Figure 35b), the pavement concrete specimen at penetration depth of 1 mm featured significantly higher Al/Ca ratios than that at 12 mm, suggesting loss of Ca2+ from AFm or AFt phases. This effect was not observed from the bridge concrete specimens. Both 1 mm and 12 mm specimens of bridge and concrete mixes featured low S/Al ratios and low S/Ca ratios (as shown in Figures 36a and 36b), relative to the specimens exposed to other deicers. This suggests the loss of SO4
2- from AFm or AFt phases. These side effects of NaCl exposure (leaching of Ca2+, loss of Ca2+ and SO4
2- from AFm or AFt phases) seem to be more severe than those seen in the concrete sample exposed to non-inhibited NaCl, implying the deleterious role of the corrosion inhibitor in facilitating the loss of CaSO4 from AFm or AFt phases.
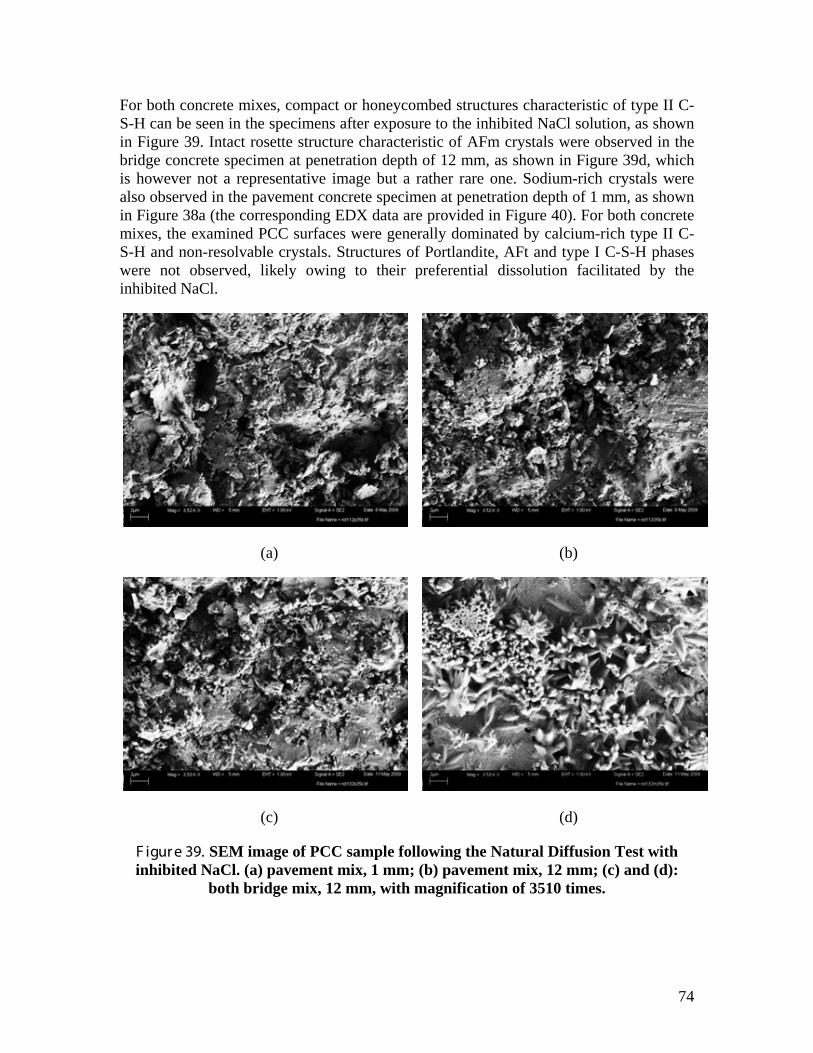
74
For both concrete mixes, compact or honeycombed structures characteristic of type II C-S-H can be seen in the specimens after exposure to the inhibited NaCl solution, as shown in Figure 39. Intact rosette structure characteristic of AFm crystals were observed in the bridge concrete specimen at penetration depth of 12 mm, as shown in Figure 39d, which is however not a representative image but a rather rare one. Sodium-rich crystals were also observed in the pavement concrete specimen at penetration depth of 1 mm, as shown in Figure 38a (the corresponding EDX data are provided in Figure 40). For both concrete mixes, the examined PCC surfaces were generally dominated by calcium-rich type II C-S-H and non-resolvable crystals. Structures of Portlandite, AFt and type I C-S-H phases were not observed, likely owing to their preferential dissolution facilitated by the inhibited NaCl.
(a)
(b)
(c)
(d)
F igur e 39. SEM image of PCC sample following the Natural Diffusion Test with inhibited NaCl. (a) pavement mix, 1 mm; (b) pavement mix, 12 mm; (c) and (d):
both bridge mix, 12 mm, with magnification of 3510 times.
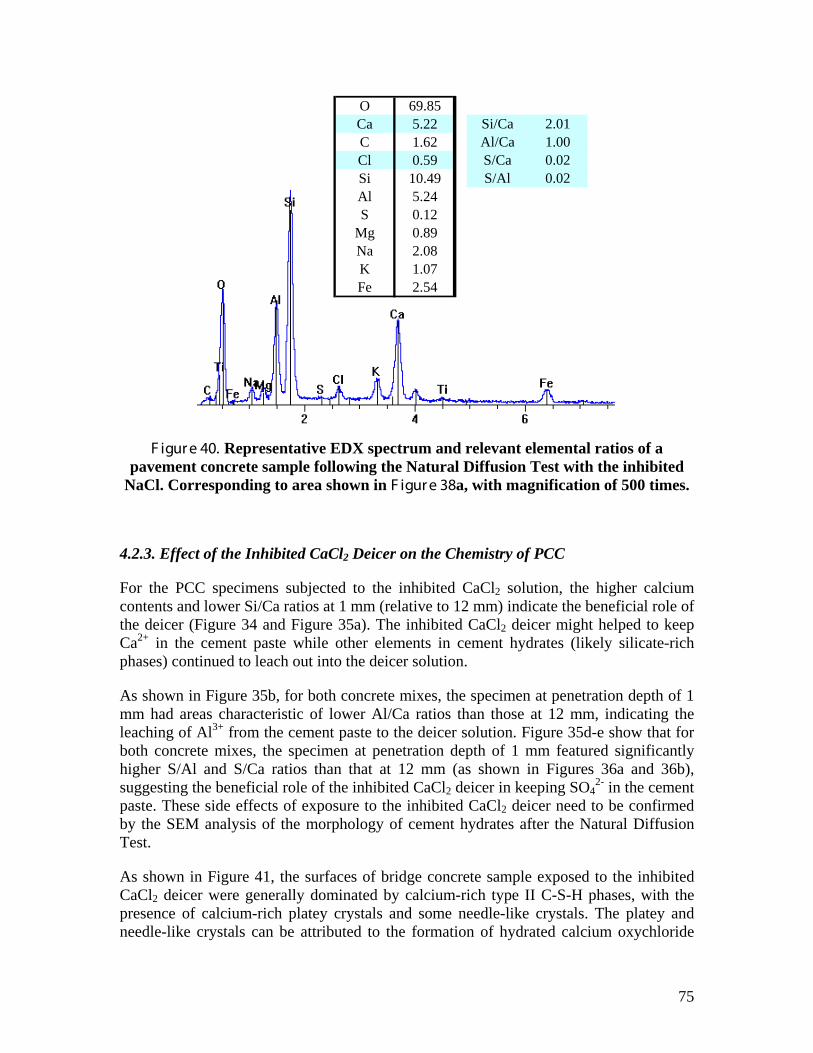
75
F igur e 40. Representative EDX spectrum and relevant elemental ratios of a pavement concrete sample following the Natural Diffusion Test with the inhibited
NaCl. Corresponding to area shown in F igur e 38a, with magnification of 500 times.
4.2.3. Effect of the Inhibited CaCl2 Deicer on the Chemistry of PCC
For the PCC specimens subjected to the inhibited CaCl2 solution, the higher calcium contents and lower Si/Ca ratios at 1 mm (relative to 12 mm) indicate the beneficial role of the deicer (Figure 34 and Figure 35a). The inhibited CaCl2 deicer might helped to keep Ca2+ in the cement paste while other elements in cement hydrates (likely silicate-rich phases) continued to leach out into the deicer solution.
As shown in Figure 35b, for both concrete mixes, the specimen at penetration depth of 1 mm had areas characteristic of lower Al/Ca ratios than those at 12 mm, indicating the leaching of Al3+ from the cement paste to the deicer solution. Figure 35d-e show that for both concrete mixes, the specimen at penetration depth of 1 mm featured significantly higher S/Al and S/Ca ratios than that at 12 mm (as shown in Figures 36a and 36b), suggesting the beneficial role of the inhibited CaCl2 deicer in keeping SO4
2- in the cement paste. These side effects of exposure to the inhibited CaCl2 deicer need to be confirmed by the SEM analysis of the morphology of cement hydrates after the Natural Diffusion Test.
As shown in Figure 41, the surfaces of bridge concrete sample exposed to the inhibited CaCl2 deicer were generally dominated by calcium-rich type II C-S-H phases, with the presence of calcium-rich platey crystals and some needle-like crystals. The platey and needle-like crystals can be attributed to the formation of hydrated calcium oxychloride
O 69.85Ca 5.22 Si/Ca 2.01C 1.62 Al/Ca 1.00Cl 0.59 S/Ca 0.02Si 10.49 S/Al 0.02Al 5.24S 0.12
Mg 0.89Na 2.08K 1.07Fe 2.54
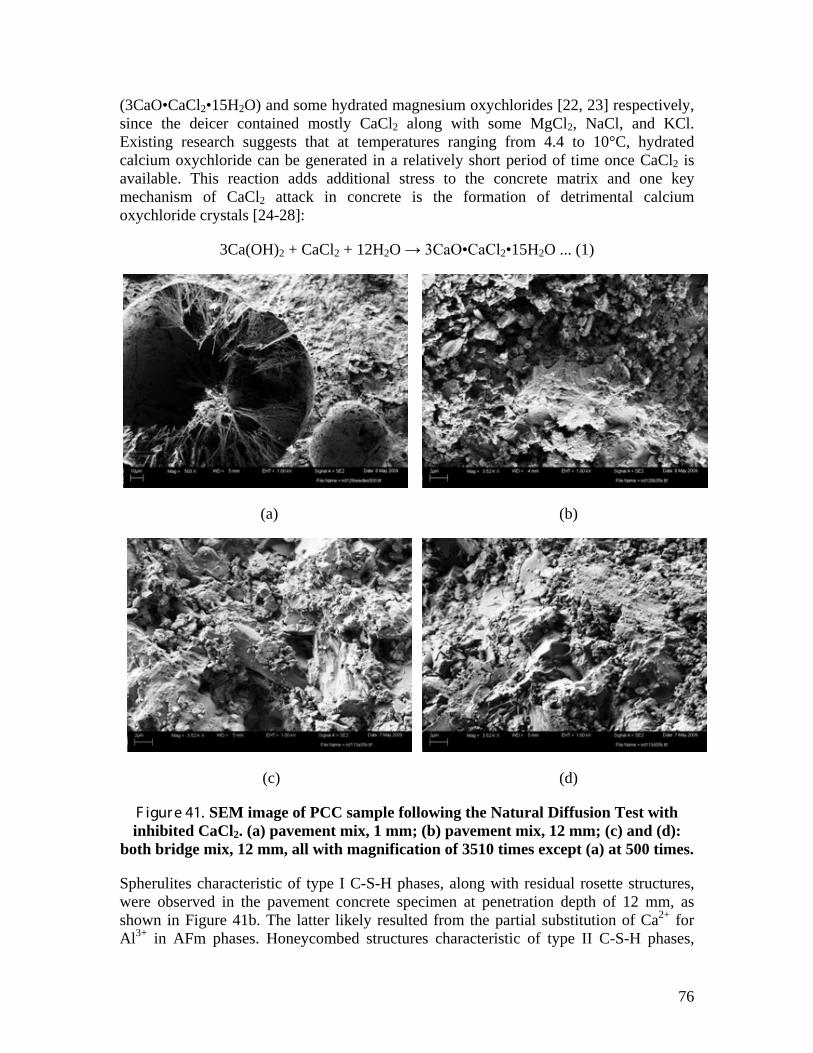
76
(3CaO•CaCl2•15H2O) and some hydrated magnesium oxychlorides [22, 23] respectively, since the deicer contained mostly CaCl2 along with some MgCl2, NaCl, and KCl. Existing research suggests that at temperatures ranging from 4.4 to 10°C, hydrated calcium oxychloride can be generated in a relatively short period of time once CaCl2 is available. This reaction adds additional stress to the concrete matrix and one key mechanism of CaCl2 attack in concrete is the formation of detrimental calcium oxychloride crystals [24-28]:
3Ca(OH)2 + CaCl2 + 12H2O → 3CaO•CaCl2•15H2O ... (1)
(a)
(b)
(c)
(d)
F igur e 41. SEM image of PCC sample following the Natural Diffusion Test with inhibited CaCl2. (a) pavement mix, 1 mm; (b) pavement mix, 12 mm; (c) and (d):
both bridge mix, 12 mm, all with magnification of 3510 times except (a) at 500 times.
Spherulites characteristic of type I C-S-H phases, along with residual rosette structures, were observed in the pavement concrete specimen at penetration depth of 12 mm, as shown in Figure 41b. The latter likely resulted from the partial substitution of Ca2+ for Al3+ in AFm phases. Honeycombed structures characteristic of type II C-S-H phases,
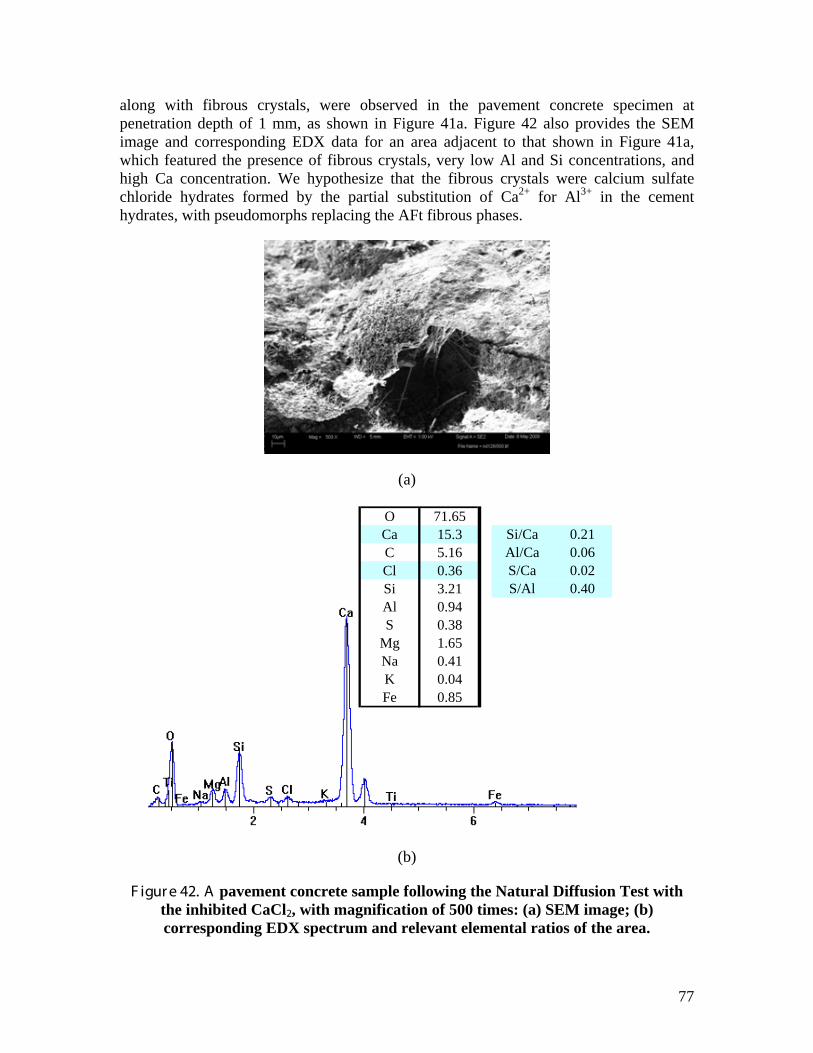
77
along with fibrous crystals, were observed in the pavement concrete specimen at penetration depth of 1 mm, as shown in Figure 41a. Figure 42 also provides the SEM image and corresponding EDX data for an area adjacent to that shown in Figure 41a, which featured the presence of fibrous crystals, very low Al and Si concentrations, and high Ca concentration. We hypothesize that the fibrous crystals were calcium sulfate chloride hydrates formed by the partial substitution of Ca2+ for Al3+ in the cement hydrates, with pseudomorphs replacing the AFt fibrous phases.
(a)
(b)
F igur e 42. A pavement concrete sample following the Natural Diffusion Test with the inhibited CaCl2, with magnification of 500 times: (a) SEM image; (b) corresponding EDX spectrum and relevant elemental ratios of the area.
O 71.65Ca 15.3 Si/Ca 0.21C 5.16 Al/Ca 0.06Cl 0.36 S/Ca 0.02Si 3.21 S/Al 0.40Al 0.94S 0.38
Mg 1.65Na 0.41K 0.04Fe 0.85
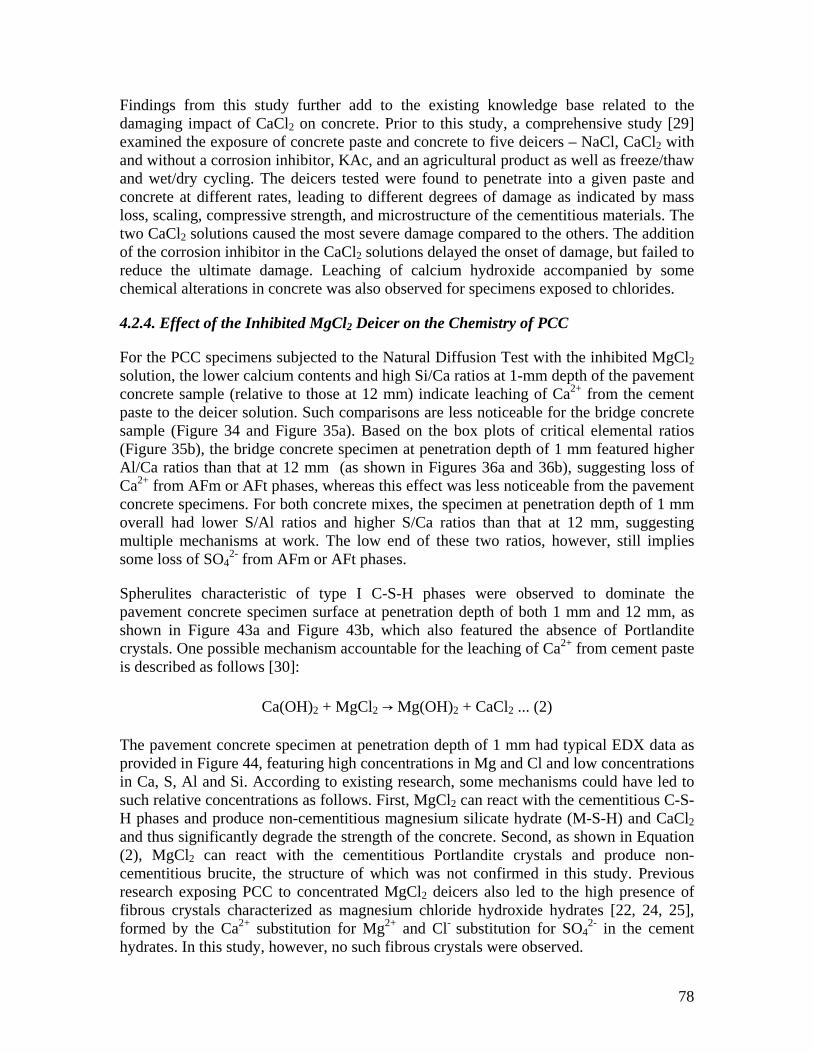
78
Findings from this study further add to the existing knowledge base related to the damaging impact of CaCl2 on concrete. Prior to this study, a comprehensive study [29] examined the exposure of concrete paste and concrete to five deicers – NaCl, CaCl2 with and without a corrosion inhibitor, KAc, and an agricultural product as well as freeze/thaw and wet/dry cycling. The deicers tested were found to penetrate into a given paste and concrete at different rates, leading to different degrees of damage as indicated by mass loss, scaling, compressive strength, and microstructure of the cementitious materials. The two CaCl2 solutions caused the most severe damage compared to the others. The addition of the corrosion inhibitor in the CaCl2 solutions delayed the onset of damage, but failed to reduce the ultimate damage. Leaching of calcium hydroxide accompanied by some chemical alterations in concrete was also observed for specimens exposed to chlorides.
4.2.4. Effect of the Inhibited MgCl2 Deicer on the Chemistry of PCC
For the PCC specimens subjected to the Natural Diffusion Test with the inhibited MgCl2 solution, the lower calcium contents and high Si/Ca ratios at 1-mm depth of the pavement concrete sample (relative to those at 12 mm) indicate leaching of Ca2+ from the cement paste to the deicer solution. Such comparisons are less noticeable for the bridge concrete sample (Figure 34 and Figure 35a). Based on the box plots of critical elemental ratios (Figure 35b), the bridge concrete specimen at penetration depth of 1 mm featured higher Al/Ca ratios than that at 12 mm (as shown in Figures 36a and 36b), suggesting loss of Ca2+ from AFm or AFt phases, whereas this effect was less noticeable from the pavement concrete specimens. For both concrete mixes, the specimen at penetration depth of 1 mm overall had lower S/Al ratios and higher S/Ca ratios than that at 12 mm, suggesting multiple mechanisms at work. The low end of these two ratios, however, still implies some loss of SO4
2- from AFm or AFt phases.
Spherulites characteristic of type I C-S-H phases were observed to dominate the pavement concrete specimen surface at penetration depth of both 1 mm and 12 mm, as shown in Figure 43a and Figure 43b, which also featured the absence of Portlandite crystals. One possible mechanism accountable for the leaching of Ca2+ from cement paste is described as follows [30]:
Ca(OH)2 + MgCl2 → Mg(OH)2 + CaCl2 ... (2)
The pavement concrete specimen at penetration depth of 1 mm had typical EDX data as provided in Figure 44, featuring high concentrations in Mg and Cl and low concentrations in Ca, S, Al and Si. According to existing research, some mechanisms could have led to such relative concentrations as follows. First, MgCl2 can react with the cementitious C-S-H phases and produce non-cementitious magnesium silicate hydrate (M-S-H) and CaCl2 and thus significantly degrade the strength of the concrete. Second, as shown in Equation (2), MgCl2 can react with the cementitious Portlandite crystals and produce non-cementitious brucite, the structure of which was not confirmed in this study. Previous research exposing PCC to concentrated MgCl2 deicers also led to the high presence of fibrous crystals characterized as magnesium chloride hydroxide hydrates [22, 24, 25], formed by the Ca2+ substitution for Mg2+ and Cl- substitution for SO4
2- in the cement hydrates. In this study, however, no such fibrous crystals were observed.
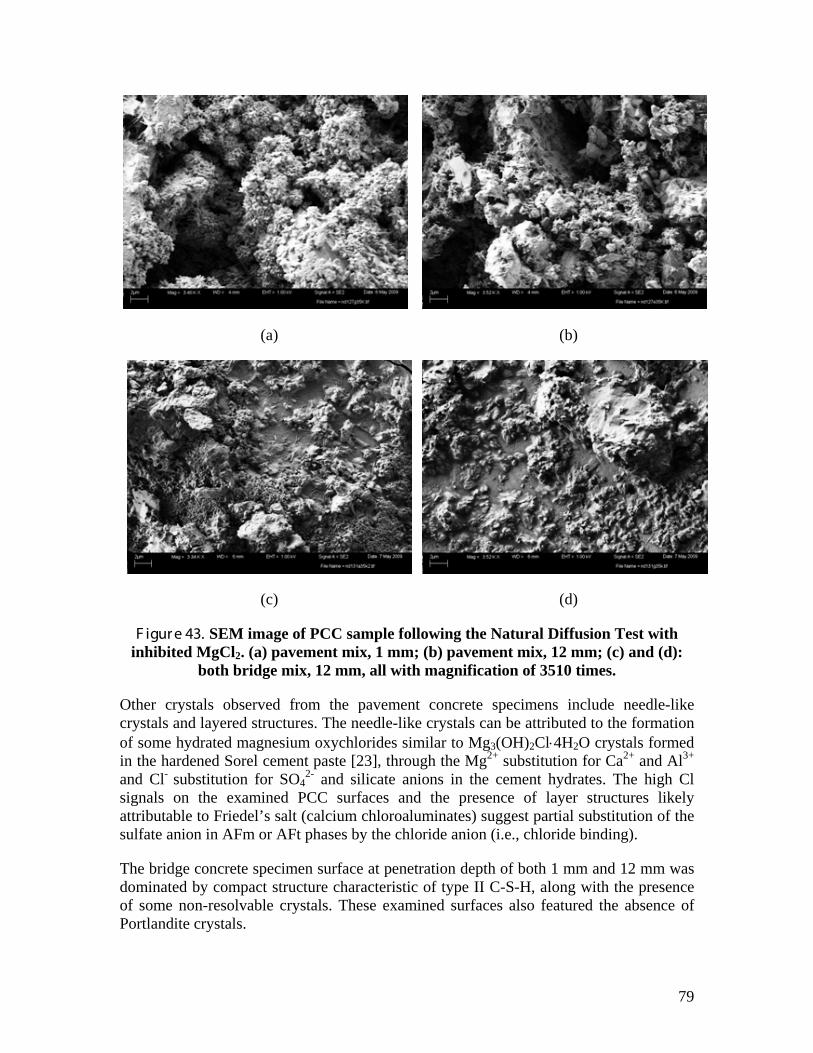
79
(a)
(b)
(c)
(d)
F igur e 43. SEM image of PCC sample following the Natural Diffusion Test with inhibited MgCl2. (a) pavement mix, 1 mm; (b) pavement mix, 12 mm; (c) and (d):
both bridge mix, 12 mm, all with magnification of 3510 times.
Other crystals observed from the pavement concrete specimens include needle-like crystals and layered structures. The needle-like crystals can be attributed to the formation of some hydrated magnesium oxychlorides similar to Mg3(OH)2Cl⋅4H2O crystals formed in the hardened Sorel cement paste [23], through the Mg2+ substitution for Ca2+ and Al3+ and Cl- substitution for SO4
2- and silicate anions in the cement hydrates. The high Cl signals on the examined PCC surfaces and the presence of layer structures likely attributable to Friedel’s salt (calcium chloroaluminates) suggest partial substitution of the sulfate anion in AFm or AFt phases by the chloride anion (i.e., chloride binding).
The bridge concrete specimen surface at penetration depth of both 1 mm and 12 mm was dominated by compact structure characteristic of type II C-S-H, along with the presence of some non-resolvable crystals. These examined surfaces also featured the absence of Portlandite crystals.
80
F igur e 44. Representative EDX spectrum and relevant elemental ratios of a pavement concrete sample following the Natural Diffusion Test with the inhibited
MgCl2. Corresponding to area shown in F igur e 42a, with magnification of 500 times.
Findings from this study further add to the existing knowledge base related to the damaging impact of MgCl2 on concrete. Prior to this study, research has been generally focused on the effect of concentrated MgCl2 on concrete, which has been proven to chemically attack cement mortar and concrete, leading to volume change, loss of compressive strength, and microcracks [24-25].
4.3. Conclusions
We explored the combined use of FESEM and EDX to examine the effect of deicer ponding on the chemistry of concrete. The results revealed that each investigated deicer, at its given concentration, chemically reacted with some of the cement hydrates and formed new products in the concrete matrix. Such chemical changes of the cement paste induced by the deicers may account for the observed strength properties and have further implications for the concrete durability. Corrosion inhibitors and other additives in deicers did not show significant benefit in inhibiting the chemical changes of concrete induced by cations and/or anions in deicers.
4.4. References
[1] Marchand J, Sellevod EJ, Pigeon M. The Deicer Salt Scaling Deterioration of Concrete-An Overview, in: V.M. Malhotra (Ed.), Proceedings of Third
O 63.35Ca 5.71 Si/Ca 0.33C 11.99 Al/Ca 0.07Cl 1.16 S/Ca 0.03Si 1.91 S/Al 0.43Al 0.4S 0.17
Mg 14.76Na 0.04K 0.02Fe 0.49
81
CANMET/ACI International Conference on Durability of Concrete, ACI SP-145, American Concrete Institute, Detroit,1994, pp.1-46
[2] Pigeon M, Pleau R. Durability of Concrete in Cold Climates, E & FN Spon, New York, 1995.
[3] Mussato BT, Gepraegs OK, Farnden G. Relative Effects of Sodium Chloride and Magnesium Chloride on Reinforced Concrete: The State of Art, Transport Res Rec 2004; 1886(8): 59-66.
[4] Al-Otoom A, Al-Khlaifa A, Shawaqfeh A. Crystallization Technology for Reducing Water Permeability into Concrete, Ind Eng Chem Res 2007; 46(16): 5463-5467.
[5] Cody RD, Cody AM, Spry PG, Gan G. Experimental deterioration of highway concrete by chloride deicing salts, Environ Eng Geosci 1996; 2(4): 575-588.
[6] Lee H, Cody RD, Cody AM, Spry PG. Effects of various deicing chemicals on pavement concrete deterioration, in: Center for Transportation Research and Education(Ed.), Mid-Continent Transportation Symposium Proceedings, Iowa State University, Ames, U.S.A.,2000, pp.151-155.
[7] Deja J, Loj G. Effect of cations occuring in the chloride solutions on the corrosion resistance of slag cementitious materials, in: R.N. Swamy (Ed.), Infrastructure Regeneration and Rehabilitation Improving the Quality of Life through Better Construction-A Vision for the Next Millennium international conference, Sheffield, ROYAUME-UNI,1999, pp.603-620.
[8] Cody RD, Spry PG, Cody AM, Gan G. The role of magnesium in concrete deterioration, The Iowa Highway Research Board, Final Report-Iowa DOT HR-355, 1994.
[9] Sutter L, Peterson K, Julio-Betancourt G, Hooton D, Vam Dam T, Smith K. The deleterious chemical effects of concentrated deicing solutions on Portland cement concrete. Final report for the South Dakota Department of Transportation, 2008.
[10] Levelton Consultants Ltd, Guidelines for the selection of snow and ice control materials to mitigate environmental impacts, NCHRP REPORT 577, National Cooperative Highway Research Program, Transportation research board of the national academies, Washington, D.C.
[11] Monosi S, Collepardi M. Research on 3CaO·CaCl2·15H2O identified in concretes damaged by CaCl2 attack, Il Cimento 1990; 87: 3-8.
[12] Chatterji S, Thaulow N, Jensen AD. Studies of Alkali-Silica Reaction. Part 4. Effect of different alkali salt solutions on expansion, Cem Concr Res 1987; 17(5): 777-783.
[13] Nixon PJ, Page CL, Canham I, Bollinghaus R. Influence of sodium chloride on the Alkali-Silica Reaction, Adv Cem Res. 1988; 1(2): 99-106.
[14] Kawamura M, Takemoto K, Ichise M. Influences of the alkali-silica reaction on the corrosion of steel reinforcement in concrete, in: S.N. Okana, M. Kawamura (Eds.), Proceedings of 8th International Conference on Alkali-Aggregate Reaction in Concrete, Elsevier, Kyoto, Japan, 1989, pp. 115-120.
[15] Kawamura M, Takeuchi K, Sugiyama A. Mechanisms of expansion of mortars containing reactive aggregate in NaCl solution, Cem Concr Res 1994; 24(4): 621-632.
[16] Kawamura M, Takeuchi K. Alkali-silica and pore solution composition in mortars in sea water, Cem Concr Res 1996; 26(12): 1809-1819.
82
[17] Sibbick RG. The susceptibility of various UK aggregates to alkali-silica reaction, Ph.D. Dissertation, Aston University, Birmingham, UK, 1993.
[18] Sibbick RG, Page CL. Effects of sodium chloride in the alkali-silica reaction in hardened concrete, in: A. Shayan (Ed.), Proceedings of 10th International Conference on Alkali-Aggregate Reaction in Concrete, CSIRO, Melbourne, Australia, 1996, pp. 822-829.
[19] Rangaraju PR, Sompura KR, Olek J, Diamond S, Lovell J. Potential for development of alkali-silica reaction in the presence of airfield deicing chemicals, in: International Society for Concrete Pavements (Ed.) Proceedings of the 8th International Conference on Concrete Pavements, Colorado Springs, USA , 2005,pp. 1269-1289.
[20] Rangaraju PR, Sompura KR, Olek J. Modified ASTM C 1293 test method to investigate potential of potassium acetate deicer solution to cause alkali-silica reaction, Transport Res Rec 2007; 2020: 50-60.
[21] Rangaraju PR, Desai J. Effectiveness of Selected SCMs in Mitigating ASR in Presence of Potassium Acetate Deicer Solution, in: Transportation Research Board (Ed.) Proceedings (CD-ROM) of the 85th Annual Meeting of Transportation Research Board, Paper No. 06-3010, Washington D.C., 2006.
[22] Shi, X., Fay, L., Peterson, M.M., and Yang, Z. Freeze-thaw Damage and Chemical Change of a Portland Cement Concrete In the Presence of Diluted Deicers. Materials and Structures 2010; 43(7): 933-946. DOI: 10.1617/s11527-009-9557-0.
[23] Tooper B, Cartz L. Structure and Formation of Magnesium Oxychloride Sorel Cements. Nature 1966; 211(5040): 64-66.
[24] L. Sutter, K. Peterson, G. Julio-Betancourt, D. Hooton, T. Vam Dam, and K. Smith, The Deleterious Chemical Effects of Concentrated Deicing Solutions on Portland Cement Concrete. South Dakota Department of Transportation, Final Report SD2002-01-F, April 2008.
[25] L. Sutter, K. Peterson, S. Touton, T. Van Dam, D. Johnston, “Petrographic evidence of calcium oxychloride formation in mortars exposed to magnesium chloride solution”. Cem. Concr. Res. 2006; 36(8): 1533–1541.
[26] W. Kurdowski, “The protective layer and decalcification of C-S-H in the mechanism of chloride corrosion of cement paste”, Cem. Concr. Res. 2004; 34(9): 1555-1559.
[27] S. Monosi and M. Collepardi, "Research on 3CaO•CaCl2•15H2O identified in concretes damaged by CaCl2 attack”. Il Cemento 1990; 87(1): 3-8.
[28] L. Sutter, T. Van Dam and K. R. Peterson, “Long term effects of magnesium chloride and other concentrated salt solutions on pavement and structural Portland cement concrete—phase I results”, in Compendium of Papers CD for the Transportation Research Board 85th Annual Meeting, Washington, D.C, Jan. 2006.
[29] K. Wang, D. E. Nelsen, and W. A. Nixon. “Damaging effects of deicing chemicals on concrete materials”, Cement Concrete Comp. 2006; 28(2):173-188.
[30] Shi, X., Akin, M., Pan. T., Fay, L., Liu, Y., and Yang, Z., The Open Civil Engineering Journal 2009; 3: 16-27.
83
C H A PT E R 5. C ONC L USI ONS, R E SE A R C H NE E DS A ND R E C OM M E NDA T I ONS F OR I M PL E M E NT A T I ON
5.1. Conclusions
Prior to this research, little was known about the possible contribution or risk corrosion inhibitors (and other additives) in deicers pose to infrastructure preservation. Therefore, research was needed to determine whether or not corrosion-inhibited deicers provide benefits in mitigating the corrosion of rebars or dowel bars in concrete, relative to the “straight salt”. To this end, we conducted an extensive literature review and performed laboratory tests to assess the effect of chloride-based deicers on rebars and dowel bars in concrete and to determine whether or not deicer corrosion inhibitors help preserve the transportation infrastructure.
The laboratory investigation exposed concrete samples to four common chloride-based deicers (assuming an average dilution factor of 100:31 from their eutectic concentration once applied) for approximately one year or less. The two mix designs investigated represent the roadway pavements and bridge decks built by the Washington Department of Transportation before 1980s, with a water-to-cement ratio of 0.39 and 0.38 and maximum aggregate size of 1.5′′ and 0.75′′ respectively. The bridge mix specimens were made with 0.1% sodium chloride by weight of concrete to simulate salt contamination; or with a steel strip to simulate crack; or without either; but all with number 4 AASHTO M-31 uncoated steel rebar in them. The pavement mix specimens were made with a sawed joint and a MMFXTM dowel bar; or with a sawed joint and epoxy-coated AASHTO M-284 dowel bar; or with a stainless steel tube with epoxy-coated dowel bar insert. We aimed to simulate the effect of deicers on reinforced concrete in an accelerated manner, by either ponding the concrete samples with deicer solutions at room temperature, or incorporating pressurized ingress, wet-dry cycling and temperature cycling into the test regime. All concrete samples had a pond 2.5′′ deep in its upper portion. The concrete samples used for the Cyclic Exposure Test had two bars in them and the distance between the top bar and the bottom bar was 1′′, whereas the samples used for the Natural Diffusion Test only had one bar in them. The dowel bars had the dimension of length 18′′× diameter 1.5′′ and had a concrete cover of 2′′ over the top bar, whereas the rebars had the dimension of length 18′′× diameter 0.5′′ and had a concrete cover of 1.5′′ over the top bar.
The chloride ingress over time was monitored using a custom-made chloride sensor embedded in each concrete sample. Also periodically measured were the OCP of the top rebar or dowel bar and the macro-cell current flowing between the top bar and the bottom bar in concrete. Once the chloride sensor detected the arrival of sufficient chlorides near the top bar and the OCP data indicated the possible initiation of top bar corrosion, the corrosion rate of the top bar was also periodically measured using non-destructive, electrochemical techniques. At the end of ponding experiments, core specimens were taken from each sample to test the compressive strength of concrete. For samples continuously subjected to deicers at room temperature, microscopic analyses were conducted to examine the possible chemical changes in the cement paste.
84
The key findings and conclusions are presented as follows.
1. The laboratory testing revealed mixed effects of deicers on the compressive strength of Portland cement concrete. When the concrete specimens were continuously exposed to deicers at room temperature, the corrosion inhibitors added in deicers showed little benefits to the compressive strength of concrete. However, when the concrete specimens underwent temperature and wet/dry cycles, the corrosion inhibitors in deicers demonstrated a beneficial role in preserving the concrete strength. The inhibited magnesium chloride deicer posed a greater risk to concrete strength, relative to the other three deicers investigated, likely due to the role of magnesium cations in de-calcification of cement hydrates.
2. From a modeling perspective, artificial neural networks (ANNs) were used to achieve better understanding of the complex cause-and-effect relations inherent in the deicer/concrete/bar systems and were successful in finding some meaningful, logical results from the noisy data associated with the deicer ponding experiments.
3. The chloride sensor data and ANN modeling suggest that corrosion inhibitor (and possibly other additives in the case of the inhibited calcium or magnesium chloride deicers) did slow down the ingress of the chlorides into concrete, for both natural diffusion and cyclic exposure tests. This benefit of corrosion inhibitor in deicers held true for all concrete mixes and was especially significant for concrete specimens subjected to the Cyclic Exposure Test or for bridge mix specimens with premixed sodium chloride or embedded steel strip. Among the four deicers investigated, the chloride anion (Cl-) associated with non-inhibited sodium chloride penetrated into concrete at the highest rate whereas that of the inhibited magnesium or calcium chloride deicers penetrated at much lower rates. The different chloride penetration rates have implications on the service life of reinforced concrete exposed to different deicers, even though such implications are difficult to quantify.
4. The electrochemical potential data and ANN modeling suggest that corrosion inhibitor (and possibly other additives in the case of the inhibited calcium or magnesium chloride deicers) led to more positive top bar potentials at 298 days, implying the beneficial role of inhibitors in reducing the active corrosion risk of bars in concrete.
5. The macro-cell current data and ANN modeling suggest that corrosion inhibitors (and possibly other additives in the case of the inhibited calcium or magnesium chloride deicers) helped to reduce the corrosion rate of the top bars in concrete. This benefit is not significant for the dowel bars in the pavement mix since none of them were actively corroding in the studied duration. According to the ANN modeling, at 254 days the dowel bars show consistently lower macro-cell current values than the rebars, despite their larger exposed surface area in concrete. This is likely due to the higher corrosion resistance of the dowel bars than that of the uncoated rebar, and also to the fact that the concrete cover over the top dowel bar in the pavement mix was 2″ vs. 1.5″ for the top rebar in the bridge mix. There were sma ll differences in the
85
macro-cell current data of various dowel bars investigated, limited by the short duration of this study.
6. The corrosion rate data of the top bar in concrete and ANN modeling suggest that in most cases, corrosion inhibitors (and possibly other additives in the case of the inhibited calcium or magnesium chloride deicers) reduced the corrosion rate of bars in concrete. The ANN modeling shows active corrosion of top rebar at 254 days in the bridge mix exposed to most deicers, whereas all top dowel bars seem to remain passivated (no active corrosion) in the pavement mix. The predicted corrosion rate of the top bar in concrete generally was the highest in non-inhibited sodium chloride and lowest in the inhibited magnesium chloride deicer. The benefit of deicer inhibitors for rebar in concrete was not significant for the bridge mixes with premixed sodium chloride or embedded steel strip where the rebar is actively corroding.
7. While the corrosion inhibitors in deicer products provide some benefits in delaying the chloride ingress and subsequent corrosion initiation of steel in concrete, such benefits seem to diminish once the active corrosion of the rebar is initiated. In other words, the inhibitors showed little benefits in re-passivating the actively corroding rebars in concrete or in stifling the corrosion propagation.
8. We examined the effect of deicer ponding on the chemistry of concrete on the microscopic level. The results revealed that each investigated deicer, at its given concentration, chemically reacted with some of the cement hydrates and formed new products in the concrete matrix. Such chemical changes of the cement paste induced by the deicers may account for the observed strength changes and have further implications for the concrete durability. Corrosion inhibitors and other additives in deicers did not show significant benefit in inhibiting the chemical changes of concrete induced by cations and/or anions in deicers.
5.2. Research Needs
While this research helps shed more light on various aspects related to the chloride ingress into concrete, the chloride-induced corrosion in concrete, the effect of deicers on chemistry of concrete, and the possible role of corrosion inhibitor in deicers, it also identifies some key knowledge gaps and research needs, as summarized below.
1. Continued research is needed to identify and improve products used for deicing, anti-icing and pre-wetting operations so that they either pose little risk or provide benefits to infrastructure preservation.
2. Continued research is needed to better understand the effects of widely used deicer products on the durability of concrete structures and pavements. There is an urgent need to bridge the knowledge gap between laboratory findings and field experience and to establish a systematic strategic plan and roadmap for future research.
3. Accelerated laboratory tests of PCC durability in the presence of deicers need to be established in order to realistically simulate the field experience of PCC structures
86
and pavements in the highway environment. Such tests are expected to be implemented both in assessing the potential impacts of deicer products and in assessing the durability of conventional and unconventional concrete mixes.
4. This study did not observe active corrosion of dowel bars in concrete, likely due to its short duration and the lack of simulated transverse joints for pavement samples used for testing. For pavements in the field, dowel bars are not totally embedded in concrete and there is always the direct contact with the environment at the transverse joint. As such, improvement in concrete mixes would do little to improve corrosion at the transverse joints where delivery of corrosive materials will occur. Recent years have seen “severe deterioration of concrete joints on many pavements in states where deicing chemicals are routinely used”. A transportation pooled fund (http://www.pooledfund.org/projectdetails.asp?id=452&status=4) has been recently established to address this research need, entitled “Investigation of Jointed Plain Concrete Pavement Deterioration at Joints and the Potential Contribution of Deicing Chemicals”.
5.3. Recommendations for Implementation
In light of the research findings from this project, we provide the following recommendations for implementation:
1. Explore improved technologies and products and implement best practices to minimize the deicer usage while maintaining the desired levels of service.
2. Be aware of the deleterious effects various deicers could pose on the strength of concrete, especially in the case of magnesium-chloride-based deicers since they can chemically de-calcify the cement hydrates and undermine the concrete microstructure.
3. Be aware of the corrosion risk various deicers could pose on the rebar and dowel bar in concrete, especially in the case of sodium-chloride-based deicers (with or without inhibitor) since the chloride anions in them tend to ingress at higher speed than those in other deicers and thus induce rebar corrosion in concrete at an earlier stage.
4. Explore new technologies and methods to minimize the negative side effects of sodium chloride, magnesium chloride, and other deicers on reinforced concrete. To anticipate better return on investment in preserving the durability and performance of reinforced concrete, agencies should focus on improved concrete mix designs with less permeability (e.g., replacing Portland cement with fly ash, silica fume, and slag), instead of procuring the more costly (inhibited) deicers.
5. Encourage the inclusion of a test method for deicer impact on reinforced concrete into the existing test matrix used to evaluate and qualify deicer products, to facilitate a more holistic approach to selecting snow and ice control chemicals through performance-based specifications.
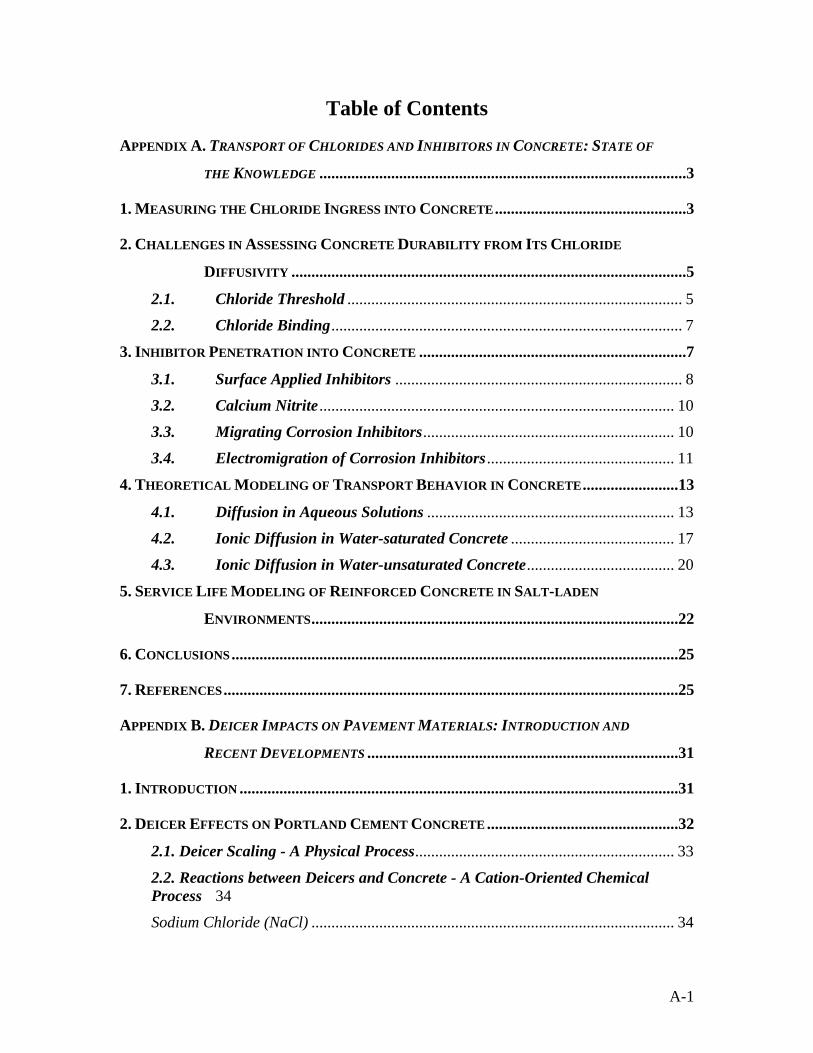
A-1
Table of Contents
APPENDIX A. TRANSPORT OF CHLORIDES AND INHIBITORS IN CONCRETE: STATE OF
THE KNOWLEDGE ............................................................................................3
1. MEASURING THE CHLORIDE INGRESS INTO CONCRETE ................................................3
2. CHALLENGES IN ASSESSING CONCRETE DURABILITY FROM ITS CHLORIDE
DIFFUSIVITY ...................................................................................................5
2.1. Chloride Threshold .................................................................................... 5
2.2. Chloride Binding ........................................................................................ 7
3. INHIBITOR PENETRATION INTO CONCRETE ...................................................................7
3.1. Surface Applied Inhibitors ........................................................................ 8
3.2. Calcium Nitrite ......................................................................................... 10
3.3. Migrating Corrosion Inhibitors ............................................................... 10
3.4. Electromigration of Corrosion Inhibitors ............................................... 11
4. THEORETICAL MODELING OF TRANSPORT BEHAVIOR IN CONCRETE ........................13
4.1. Diffusion in Aqueous Solutions .............................................................. 13
4.2. Ionic Diffusion in Water-saturated Concrete ......................................... 17
4.3. Ionic Diffusion in Water-unsaturated Concrete ..................................... 20
5. SERVICE LIFE MODELING OF REINFORCED CONCRETE IN SALT-LADEN
ENVIRONMENTS ............................................................................................22
6. CONCLUSIONS ................................................................................................................25
7. REFERENCES ..................................................................................................................25
APPENDIX B. DEICER IMPACTS ON PAVEMENT MATERIALS: INTRODUCTION AND
RECENT DEVELOPMENTS ..............................................................................31
1. INTRODUCTION ..............................................................................................................31
2. DEICER EFFECTS ON PORTLAND CEMENT CONCRETE ................................................32
2.1. Deicer Scaling - A Physical Process ................................................................. 33
2.2. Reactions between Deicers and Concrete - A Cation-Oriented Chemical Process 34
Sodium Chloride (NaCl) ........................................................................................... 34
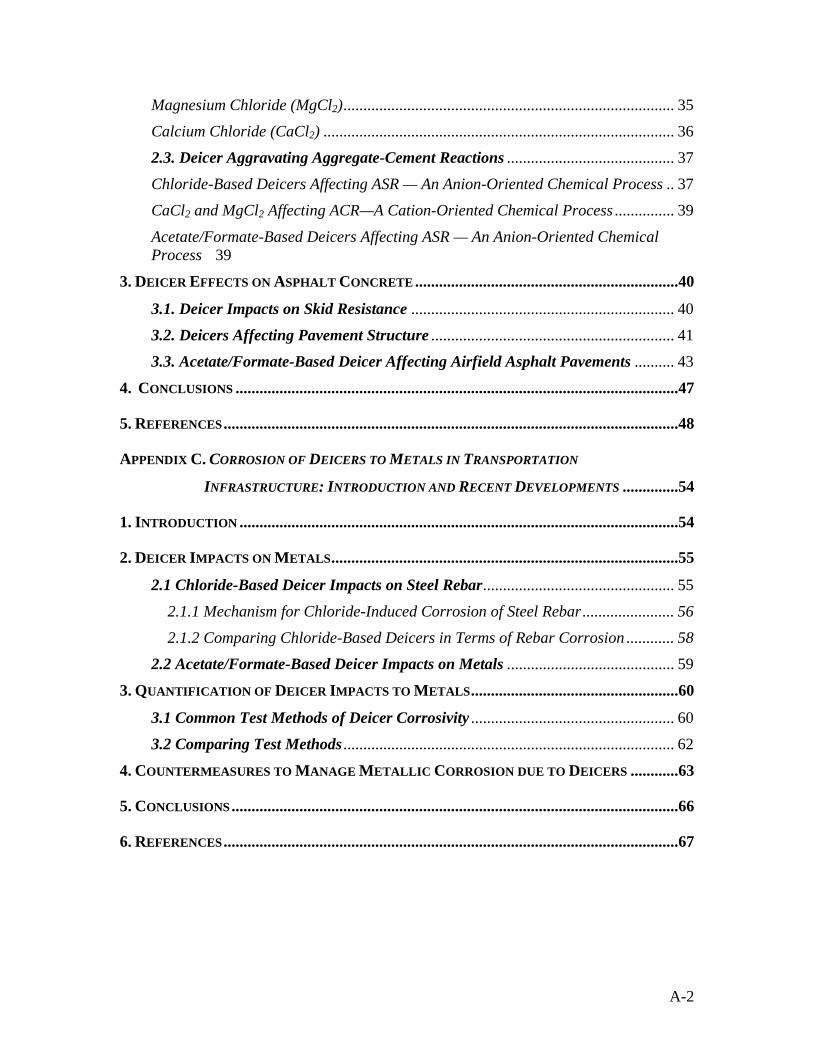
A-2
Magnesium Chloride (MgCl2) ................................................................................... 35
Calcium Chloride (CaCl2) ........................................................................................ 36
2.3. Deicer Aggravating Aggregate-Cement Reactions .......................................... 37
Chloride-Based Deicers Affecting ASR — An Anion-Oriented Chemical Process .. 37
CaCl2 and MgCl2 Affecting ACR—A Cation-Oriented Chemical Process ............... 39
Acetate/Formate-Based Deicers Affecting ASR — An Anion-Oriented Chemical Process 39
3. DEICER EFFECTS ON ASPHALT CONCRETE ..................................................................40
3.1. Deicer Impacts on Skid Resistance .................................................................. 40
3.2. Deicers Affecting Pavement Structure ............................................................. 41
3.3. Acetate/Formate-Based Deicer Affecting Airfield Asphalt Pavements .......... 43
4. CONCLUSIONS ...............................................................................................................47
5. REFERENCES ..................................................................................................................48
APPENDIX C. CORROSION OF DEICERS TO METALS IN TRANSPORTATION
INFRASTRUCTURE: INTRODUCTION AND RECENT DEVELOPMENTS ..............54
1. INTRODUCTION ..............................................................................................................54
2. DEICER IMPACTS ON METALS .......................................................................................55
2.1 Chloride-Based Deicer Impacts on Steel Rebar ................................................ 55
2.1.1 Mechanism for Chloride-Induced Corrosion of Steel Rebar ....................... 56
2.1.2 Comparing Chloride-Based Deicers in Terms of Rebar Corrosion ............ 58
2.2 Acetate/Formate-Based Deicer Impacts on Metals .......................................... 59
3. QUANTIFICATION OF DEICER IMPACTS TO METALS ....................................................60
3.1 Common Test Methods of Deicer Corrosivity ................................................... 60
3.2 Comparing Test Methods ................................................................................... 62
4. COUNTERMEASURES TO MANAGE METALLIC CORROSION DUE TO DEICERS ............63
5. CONCLUSIONS ................................................................................................................66
6. REFERENCES ..................................................................................................................67

A-3
APPENDIX A. Transport of Chlorides and Inhibitors in Concrete: State of the Knowledge
Part of this appendix was published in: Liu, Y. and Shi, X. Electrochemical Chloride Extraction and Electrochemical Injection of Corrosion Inhibitor in Concrete: State of the Knowledge. Corrosion Reviews 2009, 27(1-2), 53-82.
This appendix chapter provides the results of a comprehensive literature review on topics relevant to this study. As such, it synthesizes the information on existing research related to the transport of chlorides and inhibitors in concrete, which is valuable for understanding the chloride-induced corrosion of rebar or dowel bar in concrete. The following sections cover the measurement of chloride ingress into concrete, the challenges in assessing concrete durability from its chloride diffusivity, the inhibitor penetration into concrete, the computational models to simulate the transport of species in aqueous solution, water-unsaturated and water-saturated cementitious materials, and the service life modeling of reinforced concrete in salt-laden environments.
1. Measuring the Chloride Ingress into Concrete
There are two types of experiments generally used to measure the chloride diffusion coefficients of concrete. One is the steady-state diffusion tests, such as the Diffusion Cell Test in which a concrete specimen is used to separate a chloride solution from a chloride-free solution and periodical measurements of the chloride ion content are conducted until a steady state condition is achieved. The other is from non-steady state tests that involve the ponding or immersion of concrete specimen for a specific duration before measuring the chloride penetration depth or profile, such as the Salt Ponding Test
Conventional chloride diffusion tests (based on ASTM standards) are very time-consuming, especially for high quality concrete mixes. The diffusion tests often take a minimum of 1 to 3 years of exposure in simulated weathering conditions before any service life modeling can be conducted [13]. Therefore, there is an increasing demand for rapid, reliable methods for testing the corrosion susceptibility of steel in a particular type of concrete and in a particular environment.
[11]. The diffusion coefficients obtained are known as effective (Deff), or apparent (Dapp), respectively [12]
In recent years, electric field migration tests have become very popular as they can accelerate the chloride ingress into concrete. Rapid Migration Test (RMT) is a method to measure the electrical migration of chloride from one cell with a chloride solution to the other that is chloride-free [14]. The average depth of chloride penetration is obtained by spraying a colorimetric indicator on the sample, and the value is then divided by the product of the applied voltage and migration time to rate the concrete permeability. Rapid Chloride Permeability Test (RCPT) is a method that records the amount of charge passed through a concrete sample in order to evaluate its permeability. By introducing the concept of ion mobility, the similarity between diffusion and migration enables the determination of an ion diffusion coefficient from the migration tests. RCPT is designated in AASHTO T 277 and ASTM C 1202 as a standard test to evaluate the
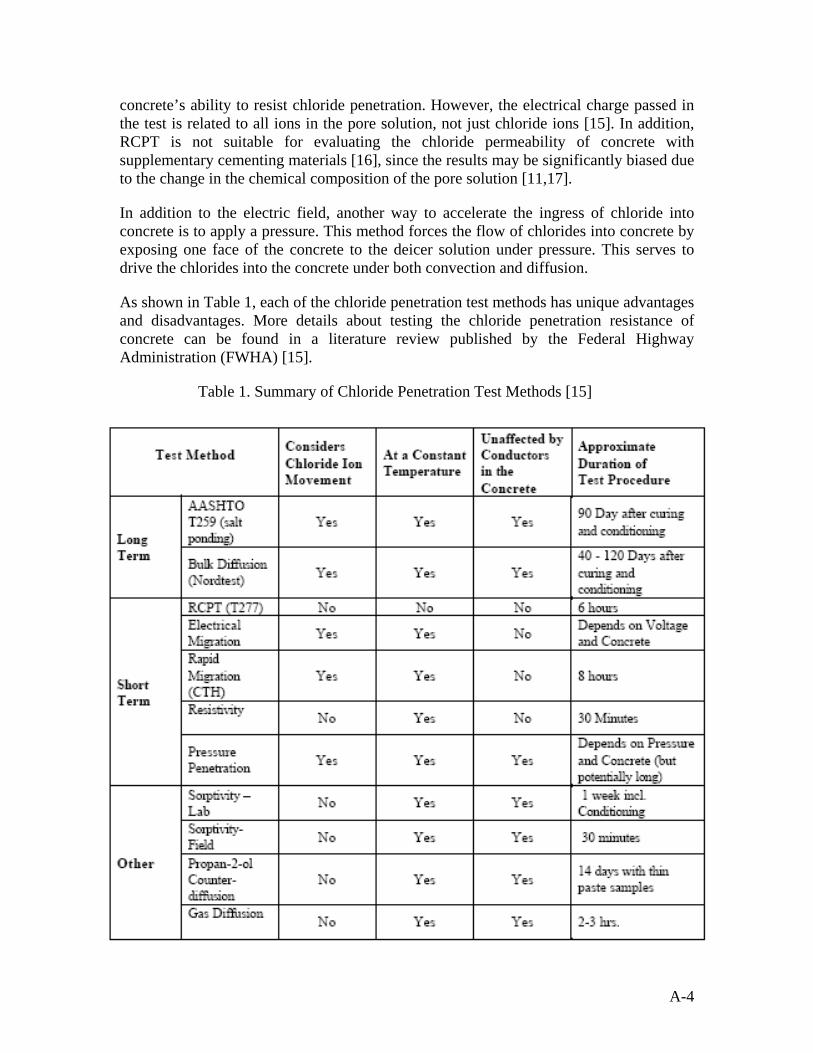
A-4
concrete’s ability to resist chloride penetration. However, the electrical charge passed in the test is related to all ions in the pore solution, not just chloride ions [15]. In addition, RCPT is not suitable for evaluating the chloride permeability of concrete with supplementary cementing materials [16], since the results may be significantly biased due to the change in the chemical composition of the pore solution [11,17].
In addition to the electric field, another way to accelerate the ingress of chloride into concrete is to apply a pressure. This method forces the flow of chlorides into concrete by exposing one face of the concrete to the deicer solution under pressure. This serves to drive the chlorides into the concrete under both convection and diffusion.
As shown in Table 1, each of the chloride penetration test methods has unique advantages and disadvantages. More details about testing the chloride penetration resistance of concrete can be found in a literature review published by the Federal Highway Administration (FWHA) [15].
Table 1. Summary of Chloride Penetration Test Methods [15]
A-5
2. Challenges in Assessing Concrete Durability from Its Chloride Diffusivity
The length of the corrosion propagation stage in concrete is usually found to be relatively short, typically a few years. As a result, much of the emphasis on achieving concrete durability of 75 years is put on achieving a long corrosion initiation stage [18], which is a function of the chloride transport properties of concrete (usually the diffusion coefficient), the surface chloride content dictated by the environment, the concrete cover thickness, and the chloride threshold concentration determining the onset of active corrosion.
Chloride ingress into concrete is a complex process. Therefore, challenges are inherent in assessing concrete durability from its chloride diffusivity, mainly pertinent to the determination of chloride threshold and the quantification of chloride binding effect.
2.1. Chloride Threshold
Chlorides from external sources (marine environments or deicing salt applications) can comprise rebar passivity and initiate active corrosion once the Cl- content at rebar depth reaches a threshold level, Cth. The time it takes for chlorides to reach Cth is defined as time-to-corrosion, Ti, which is a critical factor in determining the resistance of reinforced concrete to the chloride-laden environment. Both Cth and Ti are important service life determinants for reinforced concrete structures [19-20]. There are numerous factors that could affect these two service life determinants, such as: the pH of concrete pore solution, the electrochemical potential of the steel, and the presence of voids at the steel/concrete interface. The pH of concrete pore solution mainly depends on the type of cement and additions. The potential of the steel is primarily related to the oxygen availability at the steel surface and thus to the moisture content of concrete. Voids that can be normally found in real structures due to incomplete compaction may weaken the layer of cement hydration products deposited at the steel/concrete interface and thus may favor local acidification required for sustained propagation of pits. The presence of air voids, as well as crevices and microcracks, may decrease the chloride threshold. In addition, the presence of sulphate ions, the temperature and the composition or surface roughness of the steel reinforcement may affect the chloride threshold [21-23]. Hartt and Nam [24] reported a range of values for Cth and Ti with seemingly identical slabs and the same exposure condition. The results indicate that these two service life determinants should be represented by a probability function instead of a specific value. There is limited research on the probabilistic nature of how mix design and other factors impact corrosion initiation (as indicated by Cth and Ti) [25-27].
The chloride threshold has been expressed as the free chloride concentration, total chloride concentration, or chloride-to-hydroxyl concentration ([Cl-]/[OH-]) ratio. In Denmark and Sweden, several projects were aimed at developing a standard test procedure to experimentally evaluate the Cth values [28]. The [Cl-]/[OH-] ratio has been traditionally considered to be a more reliable indicator than the chloride concentration, considering that the competition between aggressive Cl- and inhibitive OH- governs the
A-6
pitting/repassivation of steel. Research in aqueous solutions has indicated that for chloride-contaminated concrete the pitting corrosion occurs only above a critical [Cl-
]/[OH-] ratio [29]. Through a probability simulation model, the threshold [Cl-]/[OH-] for corrosion of bare steel rods in high pH solutions was once predicted to be 0.66 in the presence of oxygen bubbles attached to the steel and 1.4 in the case of air. Such result agreed favorably with experimental data. In the same model, it was concluded that the threshold ratio should be about 1.4 for typical reinforced concrete and in excess of 3 for high quality concrete with minimal air voids [30]. The chloride threshold generally increases with increasing concrete quality. Ann and Song [31] argued that the ratio of total chloride to acid neutralization capacity, [Cl-]/[H+], best presents the chloride threshold level since it takes into account “all potentially important inhibitive (cement hydration products) and aggressive (total chloride) factors”.
Considerable research efforts [19-20, 31-42] have focused on identifying the Cth and Ti values for reinforced concrete in salt-laden environments, in an effort to quantify the risk of chloride-induced rebar corrosion, with either experimental or modeling approaches. A wide range of Cth and Ti values have been reported for corrosion initiation of rebar in concrete, owing to the probabilistic nature of rebar corrosion initiation as well as the variability in the test methods, mix design and rebar used, and exposure conditions. Glass et al. [43] and Alonso et al. [44-45] summarized historical literature and noted that Cth values spread over more than one order of magnitude. The complexity inherent in Cth and Ti is that they are affected by a number of factors interdependently. It is believed that the following variables ultimately define these two determinants: 1) type of raw materials (especially cement composition) and admixtures; 2) mix design (especially water-to-cement ratio, w/c); 3) execution and curing circumstances; 4) type of steel bar (hot-rolled, hot-rolled micro-alloyed, temperature, work-hardened etc.); 5) rebar surface condition; 6) exposure conditions; and 7) sampling concrete for chloride analysis [46].
Recently, the physical condition of the rebar/concrete interface (especially entrapped air void content) was found to be more influential for Cth than the chloride binding or buffering capacity of cement paste matrix [31]. Laboratory observation shows that even for seemingly identical concrete slabs, variability of Cth and Ti is introduced by micro-structural factors such as the size and distribution of entrapped air voids, and the arrangement of aggregates which can significantly affect the tortuosity of chloride ingress path [47]. Monfore and Verbeck [48] reported a correlation between entrapped air voids and sites of corrosion initiation, but only limited efforts have subsequently focused on this topic. At the rebar/concrete interface, the sites with entrapped air voids feature the absence of hydration products and allow easy access for dissolved oxygen and free chlorides. As such, an increasing air void content at the interface leads to a greater probability of lower Cth [31]. Further, Söylev and Francois [49] argued that at the rebar/concrete interface macro-defects have a direct impact on corrosion whereas micro-defects have no significant effect. Macro-defects herein imply large air voids and/or gaps formed beneath the horizontal reinforcement as a result of bleeding and settlement of fresh concrete.
Furthermore, the method that has been used to determine the chloride content or its profile in concrete certainly contributed to the variability in reported Cth values.
A-7
Traditionally, both the chloride content profile in concrete and the Cth value are determined using the coring method, which involves acquisition of one or more cores from sound concrete between reinforcements at the time of active corrosion initiation. The cores are sliced and analyzed for their chloride content, and the chloride content in the slice corresponding to the reinforcement cover is defined as Cth. Recently, both experimental [46] and modeling [50-53] studies revealed that chloride content at the top of the rebar trace is higher than that at the same depth away from the rebar. This was explained by the relatively low content of coarse aggregates in the vicinity of the rebar [47] as well as the rebar serving as a physical barrier to chloride migration [54-56]. Thus, it is more reasonable to express Cth with the chloride content on the top of rebar trace than that acquired from the core sample.
2.2. Chloride Binding
Chloride binding removes chloride ions from the pore solution, and slows down the rate of penetration [57]. With water-soluble and acid-soluble chlorides referred to as free and total chlorides, respectively, the total chloride diffusivity was found to be near three times the free chloride diffusivity [58]. In a Florida DOT study, the relationship between bound and free chlorides was found to follow the Langmuir adsorption isotherm [7].
It is generally believed that only the free chlorides can promote pitting corrosion, while the bound chlorides such as those adsorbed on C-S-H or chemically bound with concrete C3A (tricalcium aluminate) or C4AF phases (e.g., Friedel’s salt, 3CaO•Al2O3•CaCl2•10H2O) do not. However, a recent study suggests that bound chlorides also play a role in corrosion initiation, as a large part of them is released as soon as the pH drops to values below 12 [22].
Chloride binding further complicates the determination of the threshold [Cl-]/[OH-] to initiate corrosion of steel in concrete. Chloride binding evidently decreases with increasing OH- above pH 12.6 and a decrease in pH can thus result in decreasing [Cl-]/ [OH-] [59].
The chloride binding capacity is affected by numerous factors, such as the C3A and alkali contents of cement [60], use of mineral admixtures, cation of the chloride salt [61], temperature, and degree of hydration [57].
3. Inhibitor Penetration into Concrete
The use of corrosion inhibitors is an effective means of mitigating corrosion of the steel rebar in concrete structures. By definition, a corrosion inhibitor is a chemical substance that decreases the corrosion rate when present in the corrosion system at suitable concentration, without significantly changing the concentration of any other corrosion agent. Corrosion inhibitors work through various mechanisms. The corrosion of steel in concrete consists of anodic reactions and cathodic reactions that progress simultaneously, and corrosion inhibitors thus can be classified into anodic type, cathodic type, or mixed type. Anodic inhibitors (e.g. calcium nitrite) reduce the rate of reaction at the anode and they usually react with the corrosion products to form a protective coating on the metal
A-8
surface. Cathodic inhibitors act indirectly to mitigate corrosion by preventing the reaction at the cathode. They are often adsorbed on the steel surface and act as a barrier to the reduction of oxygen. Mixed inhibitors influence both the anodic and cathodic sites of corrosion, often by forming an adsorbed film to the metal surface. This is especially beneficial in reinforced concrete due to the prominence of micro-cell corrosion.
Corrosion inhibitors can also be classified as follows: oxidizing inhibitors, scavengers, conversion layer formers, and adsorbed layer formers [62]. Oxidizing inhibitors or passivators act by shifting the electrochemical potential of the corroding metal such that an insoluble oxide or hydroxide forms on the metal surface (e.g., nitrites and chromates). Scavengers act by removing concentrations of corrosive agents such as chloride ions. Conversion layer inhibitors form insoluble compounds on metal surfaces without oxidation (e.g., calcium and magnesium ions in neutral or basic solution). Adsorbed layer inhibitors (e.g., organic nitrates and amines) are organic inhibitors that strongly adsorb to the metal surface and interfere with the anodic and/or cathodic reactions in the area of adsorption. Nitrogen is usually the active atom in an adsorbed layer inhibitor acting on steel in a non-acid electrolyte. Volatile corrosion inhibitors (e.g., aliphatic and cyclic amines/nitrites) are similar to adsorbed layer inhibitors and they possess appreciable saturated vapor pressures under atmospheric conditions that allow significant vapor-phase transport of the inhibitor. A 1993 SHRP study indicated that Alox 901 (a proprietary product that forms a protective film by conversion to a metallic soap) was a very effective surface-applied corrosion inhibitor and potentially capable of doubling the service life of an overlay [62]. In addition, Cortec VCI-1337 (MCI-2020, a proprietary blend of surfactants and amine salts in a water carrier) was an effective inhibitor when applied as ponding agents. The product was designed to migrate in a vapor phase and adsorb on a metallic surface forming a monomolecular film at both anodic and cathodic sites [63].
3.1. Surface Applied Inhibitors
The inhibitor formulations for deicer products are generally proprietary and thus there is little information available in the public domain regarding their penetration into concrete or transport behavior in concrete. As such, we examined other surface applied inhibitors for concrete instead.
Although numerous chemical compounds have been studied as inhibitors to be admixed to concrete, monofluorophosphate (MFP, Na2PO3F) seems to be the only one tested and applied in practice as a surface-applied inhibitor for preventative and curative treatment of reinforced concrete [64]. MFP, polyphosphates, and calcium magnesium acetate (CMA) are known to be corrosion inhibitors used in deicer products, among other proprietary compounds. Compared with sodium nitrite, CMA (similar to sodium acetate and urea) was found only marginally effective as corrosion inhibitors for reinforced concrete [65].
In fresh or even young mortar and concrete, MFP cannot be applied due to the reaction with the calcium ions. Laboratory testing of mortar samples indicated that a minimum MFP/chloride concentration ratio greater than 1 had to be achieved in order to reduce the
A-9
corrosion of steel rebar [64]. 15% by weight solutions of MFP were applied repeatedly (10 passes with intervening periods of drying) to reinforced concrete specimens with water/cement ratio of 0.65, and only a very slight improvement was identified in the specimens with the lowest chloride levels. That was attributed to the fact that very little penetration of MFP or phosphate had occurred beyond the outermost 4 mm of concrete [64]. In another study, concentrated aqueous solutions of MFP were applied to the surface of reinforced concretes. The corrosion of embedded steel bars at various depths of cover were monitored electrochemically during a controlled program of wet-dry cycling undertaken for several months prior to and for approximately 18 months after the inhibitor treatment. On completion of the exposure tests, steel weight losses and the corrosion distribution on the steel surfaces were also measured. Penetration of soluble MFP ions into all the concrete specimens was found to be negligible and the inhibitor surface treatment did not reduce the corrosion rates of rebar. Hydrolysis products of MFP (phosphate and fluoride) were present at significant depths in aqueous extracts of the carbonated concrete specimens, whereas in those of the non-carbonated specimens only fluoride was detectable [66].
In early field tests in Switzerland, no sufficient MFP was found either [64]. This was partly due to the fact that the concrete was dense and with a cover depth greater than 45mm (1.8 inches) or to an insufficient number of MFP applications on the surface. On one of the test sites, for a reinforced concrete sidewall of 60m length, various surface application rates of MFP were tested between 500 and 2200 g/m2 along with changing heating schemes. Heating of the concrete surface did not seem to facilitate MFP penetration, on the contrary, the maximum penetration (25mm) was found on areas without any heating but with repetitive MFP applications. In this case, some inhibitive effect of MFP was found through rebar half-cell potential and concrete resistivity measurements [64]. In another field test, MFP was applied onto cleaned, dry concrete surfaces in up to 10 passes and the concrete was impregnated down to the reinforcement level, in some cases down to 40-60 mm in a few days or weeks. Good penetration was found in carbonated concrete, and increased penetration was achieved when using a gel rather than a solution in the application [64].
The migration of corrosion inhibitors in aqueous solution was studied using concrete disks (of approximately 6-mm thickness). Concrete disk specimens were placed between glass vacuum flanges and aqueous solutions of salts. A vacuum applied on one side of the disk caused inhibitors to penetrate the disk. The depth of solute migration was measured by surface-sensitive analysis (x-ray photoelectron spectroscopy, XPS) of selected portions of fractured disks. XPS measurements were used to establish whether chemical changes had occurred during solute migration and to determine whether differential migration of solute cation and anion had taken place. Tests indicated that the borate ion was more mobile in concrete than the chloride ion, indicating an ability to migrate faster to the rebar in concrete [63]. Sodium tetraborate (Na2B4O7) is often used as a corrosion inhibitor that can form a protective layer on the metal surface through the reaction of borate and oxygen. This reaction appears to be highly dependent on the pH of the pore solution.
A-10
3.2. Calcium Nitrite
The effectiveness of calcium nitrite, Ca(NO2)2, as a surface-applied corrosion inhibitor was investigated in the laboratory, to treat chloride-contaminated concrete specimens in presence or absence of carbonation, respectively [67]. The corrosion of embedded steel bars at various depths of cover were monitored electrochemically during a controlled program of wet-dry cycling undertaken for several months prior to and for approximately 18 months after the inhibitor treatment. On completion of the exposure tests, steel weight losses and the corrosion distribution on the steel surfaces were also measured. The results indicated that nitrite ions were transported through realistic thicknesses of cover concrete of high water/cement ratio (e.g., w/c > 0.45). They were able to reduce corrosion of moderately pre-corroding steel in noncarbonated concrete with modest levels of chloride contamination and in carbonated concrete without chloride. In the case of non-carbonated concrete with higher levels of chloride contamination, or carbonated concrete with even low levels of chloride, the inhibitor was found ineffective and local corrosion rates were observed to increase in some specimens [67]. The authors also emphasized that no short-term laboratory investigation could fully simulate the field performance of real structures.
3.3. Migrating Corrosion Inhibitors
Alkanolamines and amines and their salts with organic and inorganic acids have been described and patented as corrosion inhibitors for various applications, often as active ingredients of migrating corrosion inhibitors (MCIs). Such organic inhibitors have been claimed to penetrate rapidly into concrete due to their high vapor pressure under atmospheric conditions, and their transport behavior have been studied mostly over the past decade. Similar to MFP, however, existing research related to the penetration behavior of MCIs into concrete has been inconclusive so far, maybe due to the diversity in porosity and chemistry of concretes investigated and test methods used. For instance, the product FerroGard 903 was reported to penetrate into concrete at a speed between 2.5 and 20 mm/ day, depending on the quality of the concrete. This fast penetration was attributed to the assumption that the organic active ingredient was transported not only by way of capillary suction and diffusion but via the gaseous phase as well [68]. The inhibitor contained an aminoalcohol (volatile fraction) and a phosphorous compound (non-volatile fraction), and both have to be present on the steel to provide effective corrosion inhibition. The transport of these two fractions was studied in cement paste and concrete. The results showed that the phosphorus component formed an insoluble calcium salt in the alkaline environment of cement, was thus unable to penetrate from the outside into the alkaline concrete zone, and could not develop its inhibiting effect there. On the other hand, the aminoalcohol had not been bound by cement but remained completely dissolved in the pore solution, thus providing optimal conditions for high mobility. For the aminoalcohol, diffusion in the dissolved state was found to be the most efficient transport mechanism, whereas the transport via the gaseous phase played an inferior role only and capillary suction was hardly observed at all [70]. However, diffusion tests of the volatile fraction of a similar inhibitor MCI-2020 estimated its diffusion coefficient to range from 3 and 0.4 ×10⁻¹² m2/s, agreeing well with the gas permeability determined for the concrete mixes [64].
A-11
The transport of FerroGard 903 was also studied on cores taken from a 100-year old, fully carbonated concrete structure, where the precipitation of the phosphorus component was avoided. The recommended dosage (500 g/m2) and way of application (several brushings) allowed only a moderate penetration of the aminoalcohol in the first 15 mm. Only a ponding for 28 or 50 days led to a significant inhibitor concentration (both aminoalcohol and phosphate) at depths greater than 30 mm [64]. In another study, concrete cubes of different grade, coated with the penetrating inhibitor, were tested. The results indicated that the inhibitor (monitored only via the aminoalcohol presence) penetrated into carbonated and non-carbonated concrete to at least 30 mm depth within 28 days. However, the results indicated that the penetration and retention were dependent on the grade and, hence, the pore structure of concrete. Penetration was most effective in Grade 30 concrete where sufficient amounts of inhibitor were present at all depths up to 60 mm; for the higher Grades 40 and 50 concretes the penetration rate or the inhibitor was not as high as in the Grade 30 concrete, due to their denser microstructure. In the 20 MPa concrete, significant loss of inhibitor occurred at the concrete surface due to the volatile nature of the inhibitor molecules and the relatively open pore structure of this concrete. In all cases the corrosion inhibitor was able to easily penetrate through the relatively dry 30 MPa concrete. After 10 months, the corrosion inhibitor was found to be present in all treated specimens although concentrations near the surface (i.e., less than 30 mm) had diminished. Laboratory results indicated that the application of the penetrating corrosion inhibitor prior to carbonation delayed the onset of carbonation-induced corrosion, and after 50 wetting and drying cycles, corrosion rates were at passive levels. Treatment of corroding reinforced concrete with penetrating corrosion inhibitor was able to decrease the corrosion rate under conditions of carbonation-induced corrosion, both for laboratory conditions and site structures [69].
A recent study examined the inhibition efficiency of MCI2005 (a proprietary blend of volatile amines and amino carboxylate compounds) when supplied as a concrete admixture, a topical treatment, and a combination of surface application and electromigration. The treated concrete was cored, sectioned, and then crushed before being immersed in distilled water to extract the available inhibitor. The amine concentrations were quantified using an ammonium-sensing electrode and were then related to the inhibitor concentration present. Concentration profiles were taken from samples 5 years after being treated with MCI2005 and revealed that the inhibitor was still present in the concrete. Repeated surface applications of MCI2005 over a period of 1 year yielded concentrations similar to those achieved by admixing, while the combination of a single-surface application and electromigration resulted in slightly higher concentrations through the bulk of the sample. The inhibitor concentrations measured at the rebar level necessary to achieve inhibition were in the order of 2~3×10⁻⁵ MCI-2005 (ml)/concrete (g), noting that the actual concentration at the rebar were approximately 10 times greater than those detected. Though present in low concentrations, the long-term effectiveness of MCI2005 as a corrosion inhibitor for rebar was demonstrated [70].
3.4. Electromigration of Corrosion Inhibitors
Electrical injection of corrosion inhibitors (EICI) is a relatively new technique shown to be an effective method of adding corrosion inhibitors to preexisting structures and can be
A-12
used on preexisting structures as a rehabilitative measure to retard corrosion. In a SHRP study in 1987 [10], SRI developed quaternary ammonium and phosphonium corrosion inhibitors that can be electrically injected into concrete matrices using an in situ technique. The inhibitors are cationic, i.e., positively charged, and theoretically can be applied to concrete structures using the ECE facilities. It would then substantially reduce the complexity of the corrosion rehabilitation system. The study showed that such inhibitor injection can provide adequate corrosion protection to rebars embedded in chloride-contaminated concrete. The tehnology features its novelty and nondestructive nature, and the requirement of only temporary installation (10-15 days). The electrical field and the current density requirements are 5-10V/cm and 4.6-12.4 A/m2 respectively. Limited studies have been published since the SHRP study, which is most likely due to the high cost of aforementioned corrosion inhibitors.
The electromigration of two organic base corrosion inhibitors, ethanolamine (pKa 9.5) and guanidine (pKa 13.6), were recently investigated. In this EICI process, an electric field was applied between steel embedded in concrete and an external anode, with the cathodic current density galvanostatically controlled in the range 1~5 A/m2 for 3-14 days. Experiments with the same conditions but without an electric field were also conducted, by applying the corrosion inhibitors to similar saturated concrete surfaces from external electrolyte. The inhibitor concentration profiles indicated that the two inhibitors were effectively injected into carbonated reinforced concretes investigated and their electrical injection in non-carbonated concrete was far less effective. In carbonated concrete, the inhibitors became concentrated near the embedded steel. In non-carbonated concrete (w/c=0.65, pH>13), guanidine penetration was accelerated to a modest extent by the applied field but a 2-week, 5A/m2 treatment did not cause sufficient inhibitor to reach the rebar at a cover depth of 35mm. Ethanolamine penetration in non-carbonated concrete was not significantly enhanced by the electric field. These findings were explicable in terms of the influence of the pH values of the pore solutions in the various specimens on the degrees of ionization of the organic bases concerned. Hence they tend to migrate and neutralize cathodically-generated hydroxyl ions [71].
For EICI, inhibitors that demonstrate satisfactory inhibition effectiveness and high diffusion coefficients are highly desired. In a recent study the potential applicability of EICI as a routine electrochemical treatment was assessed [71]. Eight organic chemicals were selected for preliminary evaluation of their corrosion inhibition effectiveness for ASTM A588 steel in chloride-containing simulated pore solutions. The best performers (tetrabutylammonium bromide and tetraethylammonium bromide) were then further evaluated for their diffusion coefficient in concrete via a customized electro-migration test. The study identified the selection of corrosion inhibitors as a critical component to the successful implementation of EICI practice as a rehabilitative measure for salt-contaminated concrete. The modeling results indicated that when an appropriate corrosion inhibitor was utilized, it was feasible to electrically inject sufficient amount of inhibitor into salt-contaminated concrete within a reasonable time frame [72].
More information on the state of the knowledge related to the electromigration of corrosion inhibitors (and also the electrochemical removal of chlorides from concrete) can be found in reference [73].
A-13
4. Theoretical Modeling of Transport Behavior in Concrete
Chloride ingress into concrete can occur by a number of mechanisms, including diffusion due to a concentration gradient, migration in an electric field, absorption, electro-osmosis, and wick action [57]. Diffusion is considered the basic mechanism on the assumption that the concrete is generally moist [74]. Chloride penetration from the environment produces a profile in the concrete characterized by high chloride content near the external surface and decreasing contents at greater depth. The natural diffusion of chloride ions from one dimension is governed by Fick’s second law:
)),((),(x
txcDxt
txc∂
∂∂∂
=∂
∂ (1)
where c(x,t) is the Cl- concentration at depth x beneath the exposed surface after exposure time t, and D is the diffusion coefficient. Given reasonable assumptions, an analytical solution to Equation (1) is proposed to describe the kinetics of a non-stationary diffusion process [75]:
)2
(1),(
0
0
Dtxerf
ccctxc
s
−=−
− (2)
where co, cs is the Cl- concentration in initial concrete and at the external surface at time t, respectively, and erf is a Gaussian error function defined by:
dtezerfz t∫ −=
0
22)(π
(3)
Active corrosion of steel in concrete does not commence until the chloride content at the reinforcement surface exceeds a critical value, known as the chloride threshold. In normal circumstances, the chloride threshold content may vary from 0.2% to 0.5% by weight of cement [76].
In addition to empirical models, mechanistic models are also used for quantitative analysis of the chloride ingress process. Recent research [77] employed the finite element method to predict the chloride concentration profiles of a coastal concrete structure, which agreed favorably with the measured data.
When cathodic protection is provided to the reinforced concrete structure, the theoretical modeling of chloride transport in concrete can be further complicated. More details are provided in reference [78] for the modeling under such scenarios.
4.1. Diffusion in Aqueous Solutions
4.1.1. In the Absence of an External Electric Field
Ions in electrolytic solutions are subjected to various types of interactions that complicate the mathematical treatment of this problem. For example, the diffusion coefficient for
A-14
each species present does not have the same value, and thus the various ions attempt to reach different speeds in electrolytic solutions. An induced internal electrical field is then created by the species of opposite sign so that the faster ions will be slowed down and the slower ones will be accelerated. Eventually, all the ions will move at the same average speed that predominantly depends on the diffusion coefficient of each species.
In a non-ideal ionic solution, the extended Nernst-Planck equation describing the flux of each species is given by [79]:
lni ii i i i i i i
Z FDJ D C C C u C
RTφ γ= − ∇ − ∇ + − ∇ (4)
Where i denotes for the type of species (e.g., Na+, K+, Cl- and OH-) and J, D, C, γ and Z are the flux, diffusion coefficient, concentration, activity, and valence number of that specific species respectively; F is the Faraday constant, R is the ideal gas constant, T is temperature, φ is the induced electrical potential.
For each ionic species, the law of mass conservation leads to [80]:
ii J
tC
⋅−∇=∂
∂ (5)
To complete the system of equations, a supplemental relation is needed to account for the electrical potential that is inherently induced by the movement of all ions. According to the literature, three methods can determine the magnitude of φ in Equation (4).
0=∑ CZi
Electroneutrality: [81]
(6)
∑ = 0ii JZ
Null Current: [82]
(7)
∑=∇⋅∇− iiCZFφε
Poisson Equation: [83]
(8)
where ε is the dielectric constant. The summation in Equations (6-8) is taken over all the species present in the ionic solutions. The Poisson equation, which relates the electrical potential to the electrical charge in space, is developed based on the assumption that the electromagnetic signal travels much faster than ions in solutions.
A-15
In order to calculate the activity of each species in electrolytic solutions, the model developed by Pitzer and his co-workers can be used. According to this model, the activity coefficient of cation i can be obtained from the following equation [84]:
' ''
2
1 1 11
1 1 1 11
ln (2 ) (2 )
(2 )
Na Nc Na
i M a Ma Ma c Mc a Mcaa c a
Na Na Nc Na Nn
a M c a ca n nMa aaa c a na a
z G m B ZC m m
m m M Z m m C m
γ φ ϕ
ϕ λ
= = =
−
= = = == +
= + + + +
+ + +
∑ ∑ ∑
∑ ∑ ∑∑ ∑ (9)
where the subscript a and c are related to the other cations in ionic solutions and G is the extend Debye-Hückel model. All the other parameters are evaluated through experiments to represent the short-range interactions between the various species. Pitzer developed two similar equations to calculate the activity coefficients of anions and neutral species in ionic solutions. Given the complexity of these equations, they can hardly be implemented in a computer program for simulation purpose.
Samson et al. recently proposed a new equation to account for chemical activity effect in ionic solutions [85]:
2 5 2(0.2 4.17 10 )ln1 1000
i ii
i
Az I I Az Ia B I
γ−− ⋅
= − ++
(10)
where I is the ionic strength of electrolytic solutions, A and B are temperature-dependent parameters, and ia is a parameter that varies with the ionic species considered. Given its relative simplicity, Equation (10) can be easily implemented in a numerical code aimed at modeling ionic transport phenomena in electrolytic solutions.
It has been reported that the effect of the nonideality of electrolytic solutions on the ionic fluxes is negligible. If this conclusion is valid, the chemical activity of each species can be well approximated by its corresponding concentration, and the last term in Equation (4) can be omitted. With the null current flux assumption in Equation (7) used, the combination of Equations (4-6) leads to [86]:
∑
∑
=
=
∇=∇ N
iiii
N
iiii
CDZ
CDZ
FRT
1
2
1φ (11)
4.1.2. In the Presence of an External Electric Field
With the nonideality of electrolytic solutions ignored, the combination of Equations (4-5) gives [87]:
iiiiii
iii RuCC
RTFDZCD
tC
=+∇−∇−⋅∇+∂
∂ )( φ (12)
A-16
where iR denotes the reaction rate term.
As mentioned above, Equation (12) introduces one more variable for the electric potentialφ that can be solved by the electroneutrality condition. From Equation (12), one can get the following expression [88]:
∑∑∑===
=⋅∇+∂
∂ n
iii
n
iii
n
i
ii RZFJZF
tCZF
111)( (13)
where iJ is the flux vector defined in Equation (4).
The first term in Equation (13) is zero by taking the time derivative of the electroneutrality condition. The term under the divergence operator can be identified as the total current density vector defined by [89]:
)(1
φ∇−∇−= ∑=
i
n
i
iiiii C
RTFDZCDZFi (14)
It should be noted that no convective term is included in the expression of the current density which is also a result of the electroneutrality condition.
For simplicity, Equation (13) can be written in the form of conservation of electric charge [90]:
∑=
=⋅∇n
iii RZFi
1 (15)
The ionic conductivity, which is defined in the absence of concentration gradients, is implicitly given by [91]:
∑=
=n
i
ii
RTCZFk
1
22 (16)
Based on the assumption that the electromagnetic signal travels much more rapidly than ions in the solution, it is possible to use the following equation to calculate the electric potentialφ [92-93].
0=⋅∇ i (17)
Inserting the current density expression in Equation (17), one can get:
0))((1
=∇−∇−⋅∇=⋅∇ ∑=
φi
n
i
iiiii C
RTFDZ
CDZFi (18)
The arrangement of Equation (18) results in [94]:
A-17
∑=
∇⋅∇=∇−⋅∇n
iiiiii CDZFuCZF
1
22 )( φε (19)
4.2. Ionic Diffusion in Water-saturated Concrete
Hydrated cement paste is generally believed to be a kind of composite material with a large porosity, in which the pores are filled with water and ions can transport within the pore solution. Comparatively, the diffusion coefficients of ions in the solid phases are so small that they can be ignored. However, the solid phases can capture ions either physically or chemically. When chloride ions penetrate into concrete, some of them will be captured by the hydrated products. Therefore, chloride in cementitious materials can have free and bound components. Free chloride ions can move from one place to another and destroy the passive film on the surface of the steel bar to initiate corrosion. The bound chlorides are generally harmless to the reinforcement and exist in the form of chloro-aluminates, making them unviable for free transport. Since only free chloride is involved in the corrosion of the reinforcement, chloride binding will effectively reduce the amount of free chlorides available to initiate the deterioration process, which can retard the transport process of free chloride ions.
The mechanism of chloride binding is not quite clear, but chemical and physical bindings are believed to occur. Accordingly, the free and bound chlorides under equilibrium conditions are expressed by empirical equations. The total amount of chloride concentration in cementitious materials can be divided into free and bound components as below [95]:
fbt CCC += (20)
where tC represents the total chloride concentration, bC denotes the bound chloride concentration, and fC is the free chloride concentration. In real cementitious materials, the relationship between the free, bound and total amount of chlorides can be either linear or non-linear. Four kinds of scenarios are referenced here:
Arya et al. proposed a linear relationship for bound and free chloride:
Linear isotherm [96]
βα +⋅= fb CC (21)
where α and β are constant. Although this equation fit their experimental data fairly well, it could not explain the physical meaning of β=bC at 0=fC . For instance, if a chloride-free concrete is exposed to a chloride-free solution, bound or total chloride should not be β , but zero. Therefore, Equation (21) is not applicable for low free chloride concentrations.
A-18
In fact, the linear relationship holds well only in a limited range of free chloride concentration. In most cases, the relationship between bound and free chlorides is nonlinear. Owing to this non-linearity, Pereira et al. [95] suggested a Langmuir isotherm for describing chloride binding:
Langmuir isotherm [97]
f
fb C
CC
⋅+
⋅=
βα
1 (22)
where α and β are constant.
Sometimes, the Freundlich isotherm can be sued:
Freundlich isotherm [98]
βfb CaC ⋅= (23)
where the parameters α and β in the Freundlich equation are purely empirical coefficients from a non-linear regression.
Recently, a modified BET equation was proposed for describing chloride binding:
Modified BET isotherm [99]
)]1(1)[1(
])1)(1(1[ 2
sf
sf
sf
sf
sf
sf
sf
bm
b
CC
CC
CC
CC
CC
CC
CC
CC
+−+−−
−−−=
βαβββ
ββα (24)
where sC is the free chloride concentration in a saturated solution, α relates to the difference between the adsorption energy at the first layer and those at the second or higher layers, and β denotes the difference between the adsorption energy at the second layer and those at the third or higher layers. It is found that both Freundlich equation and the modified BET equation correspond very well when the free chloride concentrations are lower than 1mol/l.
The porosity of a material, a commonly used parameter for the description of diffusion in porous materials, is defined as [100]:
volumetotalvolumevoid
=p (25)
A-19
This parameter is non-dimensional and does not provide information on the geometrical features of the pores or their size distribution.
A proper way to describe the movement of ions in the pore solution of cementitious materials is based on the homogenization technique. To obtain the concentration profiles, the continuity equation has to be computed for each species, but some considerations about the binding of different species are needed. The following two scenarios are most commonly used.
1)
It can be assumed that only chlorides can be bound to the solid phase in concrete. However, for each chloride ion bound, one hydroxide ion is released to keep the electroneutrality of the pore solution. For example, consider the pore solution which only contains chloride, sodium, potassium and hydroxide. The mass balance equations for the considered species take the following format [101]:
Only Chloride can be bound
xJ
tCp
tC
p fbf
∂
∂−=
∂∂
−+∂
∂)1( (26)
xJ
tC
p NaNa
∂
∂−=
∂
∂ ++
(27)
xJ
tC
p KK
∂
∂−=
∂
∂ ++
(28)
The concentration of hydroxide can be obtained from the electroneutrality condition that must be followed in any volume of the diffusion medium:
fKNaOH CCCC −+= ++− (29)
2)
In some cases, specific chemical interactions can happen between dissolved substances and the porous matrix. For example, chloride, sulfate and carbonate ions can all react with hydrated cementitious minerals. During capillary absorption, these ions can be removed from pore solutions by chemical or physical combination. It is possible to take the binding of all the cations and anions into consideration. A proper way to handle such a condition, based on the homogenization technique, can be achieved via the following equation [102]:
All the species present can be bound
)()1( iifib pJt
Cp
tC
p ⋅∇=∂
∂+
∂∂
− (30)
where ibC stands for the concentration of species i in the solid phase, and ifC represents its corresponding part in the pore solutions.
A-20
In both cases, the size of pores is considered as independent of time, which is generally reached under long steady-state flow. Actually, the size of pores varies with the progress of physical or chemical interactions of all sorts. However for modeling purpose, the size and distribution of pores can be assumed unchanged with time.
Equation (30) should be used carefully to ensure that the pore solutions and the solid cement phases are in the state of electroneutrality, respectively. A procedure similar to Equation (26) can be used to achieve this purpose. In addition, the Poisson equation used to calculate the electric potential can be written as [103]:
1( )
N
i ii
p pF Z Cx x
φε=
∂ ∂− =
∂ ∂ ∑ (31)
4.3. Ionic Diffusion in Water-unsaturated Concrete
In many cases, concrete structures exposed to ionic solutions are frequently subjected to wetting and drying cycles. While the transport of chloride in water-saturated concrete has been relatively well understood, recent reports have underlined the complexity of ionic transport in water-unsaturated concrete. The transport of water can accelerate concrete degradation, and its kinetics is a very important factor for durability evaluation.
The kinetics of water-unsaturated concrete deterioration is based on the penetration of water and aggressive ions carried by water into the pores of concrete. In unsaturated materials, the stress acting on the liquid arises not from external pressure differences but from the effects of capillarity. The macroscopic velocity of the fluid appearing in Equation (4) as u can be described by [104]:
xDu w ∂
∂−=
θ (32)
where wD is called the capillary diffusivity, and θ is the volumetric water content in the pores.
To accomplish the model, the mass conservation on the liquid phase must be taken into account [105]:
)(x
Dxt w ∂
∂∂∂
=∂∂ θθ (33)
The capillary diffusivity in Equation (33) depends heavily on θ in porous materials so that the water content profile is steep-fronted. It is often useful to represent the wetted region by a rectangular profile, which is the so-called sharp front approximation. Equation (33) is known as Richard equation. While Richard equation is commonly accepted among scientists, its use over the past decades has led to some confusion on moisture transport mechanism in unsaturated porous materials.
A-21
The application of homogenization technique to the law of mass conservation results in the following relation [106]:
)ln
()())1((
uCx
CDpx
CRT
FZDp
xC
Dpxt
Cpt
Cpif
iifiif
iiifi
ifis −∂
∂+
∂∂
+∂
∂
∂∂
=∂
∂+
∂−∂ γ
θθθθθ
(34)
where p is the porosity of the material, isC is the concentration of species i in the solid phase, ifC is the corresponding part of isC in the pore solutions, and iD is the diffusion coefficient of species i at the macroscopic level. For the water-unsaturated cementitious materials, the Poisson equation, which relates the electrical potential to the concentration of each ionic species, can be expressed with Equation (31).
In the above, the fluid velocity is not explicitly considered. The convective transport of a fluid in concrete can occur under a pressure gradient. In the absence of gravity and for the isotropic case, the filtration velocity of a fluid, subjected to the pressure gradient is governed by Darcy’s law [107]:
ku hp
= − ∇ (35)
where u is the fluid velocity, k is the intrinsic permeability, p is the porosity, and h is the pressure head.
Darcy's law, linearly relating a flow velocity to a pressure gradient, is well suitable to model laminar liquid flow through porous materials, but is not capable of accurately modeling fluid flows where non-zero fluid velocity is maintained at the solid-fluid interface. Because of such slippage at the solid-liquid interface, the rate of mass flow through the material exceeds that predicted from Darcy's law.
It should be noted that Darcy's law is a phenomenological equation derived from empirical observations. It describes the bulk flow of a fluid through a porous medium without any reference to the microstructure characteristics of the material. From this perspective, Darcy's law is analogous to Fourier's law for heat conduction and Ohm's law for electricity conduction.
In the presence of fluid movement, the conservation equation can be written as:
ii i
C u C Jt
∂+ ⋅∇ = −∇ ⋅
∂ (36)
Inserting the expression for the flux of each species in Equation (4), as well as the fluid velocity in Equation (35), one can obtain the governing equations to describe the transport of each species in the presence of pressure gradient.
A-22
Specifically, if only chloride is considered in the calculation, the governing equation involving both convection and diffusion simply becomes [108]:
2
2Cl Cl Cl
ClC C CD u
t x x∂ ∂ ∂
= −∂ ∂ ∂
(37)
The analytic solution to this differential equation is:
0.5[ ( ) exp( ) ( )]2 2
ClsCl ClCl Cl
C x ut ux x uterfc erfcC DD t D t
− += + (38)
5. Service Life Modeling of Reinforced Concrete in Salt-laden Environments
Chloride penetration into concrete is the main cause of steel deterioration in concrete structures exposed to chloride-laden environments. Through the use of deterioration models, cost-effective decisions can be made concerning the time to repair or replace existing structures, and the most effective corrosion abatement systems. There are software packages available to aid in concrete modeling and service life forecasting, such as 4SIGHT and CONLIFE available from the National Institute of Standards and Technology [109], as well as conventional Finite Difference Method (FDM) applications.
Khatri and Sirivivatnanon [110] proposed a model for predicting the service life of reinforced concrete structures, where the acceptable level of deterioration is related to the presence of chloride ions on the rebar surface. As such, the service life is defined as the time required for transport processes to raise the chloride content at the depth of the rebar to the threshold level for pitting corrosion. It should be mentioned that the service life is not a fixed value as calculated by a deterministic model, but instead it is a range of values determined by material characteristics, cover depth, and severity of service environments.
The diffusion of chloride ions in water-saturated cementitious materials is a complex process involving various physical and chemical interactions. The chloride ions can be bound either physically or chemically by cement paste, thereby lowering the fraction of free chlorides that can diffuse freely in the pore solutions. In addition, the internal electric field formed by the cations and anions will speed up the ions that have low diffusion coefficients and slow down the ions that have high diffusion coefficients to maintain the electro-neutrality condition. If we ignore such complex internal processes and treat the diffusion problem phenomenologically, the temporal and spatial evolution of chloride-ion concentration can be calculated based on Fick’s second law in Eqn. (39) [74,87], which has been used extensively by many researchers to calculate the chloride concentrations for various concrete cover depths at different exposure time intervals:
2
2cC CDt x
∂ ∂=
∂ ∂ (39)
A-23
where C is the concentration (mol m-3); t is the time (s); D is the diffusion coefficient (m2s-1); χ is the position (m). In this work, the service life or the length of the corrosion initiation stage is approximated with the following simplified assumptions:
• The concrete is initially chloride-free, and the concrete acts as a physical barrier to protect the rebar. The rebar corrosion is triggered only when the concrete in contact with the steel becomes contaminated with chloride ions exceeding a threshold concentration value.
• Chloride ions progress inward from the external surface of the concrete, which is covered by aqueous solutions of chlorides from deicers and precipitation. Therefore, the concrete immediately below the surface acquires a surface chloride concentration that remains unchanged in the simulation.
• Chloride ions progress inward by simple diffusion, driven by the gradient of the concentration of chloride ions in the concrete. The effective diffusion coefficient is constant with time and space, and is a property of the concrete between the concrete surface and the steel rebar.
Based on these assumptions, an analytical solution exists to predict the spatial and temporal evolution of chloride concentration profiles, which is given by [74,110,111]:
[1 ( )]2t s
c
xC C erfD t
= − (40)
where x is the concrete cover depth; tC is the chloride concentration at cover depth; sC is the surface chloride concentration; t is time; cD is the effective diffusion coefficient in concrete; erf is the Gaussian error function as below:
2
0
2( )z terf z e dt
π−= ∫ (41)
Eqn. (2) can be used to calculate the service life of a concrete cover, provided that tC ,
sC , cD and x are known.
Concrete is a multiphase porous composite consisting of cement paste and aggregates, in both of which phases pores exist. Chloride ions can only diffuse in the pore solutions. Effective diffusion coefficients of chloride, characterizing the resistance of concrete to diffusive ingress of chlorides, are therefore considered to be a function of the characteristics of the cement paste and the aggregates. The rate at which chloride ions ingress into water-saturated concrete depends on the diffusion coefficients in cement paste and aggregates as well as the aggregates fraction. Additionally, the rate of ingress is also influenced by the cement paste/aggregate interfacial (ITZ) zones and internal cracks. Prediction of effective chloride diffusion coefficients in concrete based on its mixture proportions is needed for service life evaluation. If the roles of ITZ and internal cracks on
A-24
chloride ingress can be ignored, the effective diffusion coefficient of chloride in water-saturated concrete can be calculated by the following equation:
[( ) ( )]( ) ( )
a p a p a pc
p a p a a
D D V D D DD
D D D D V− + +
=+ + −
(42)
where pD and aD are the chloride ion diffusion coefficients in the cement paste and aggregates, respectively, and aV is the aggregate volume fraction.
If the aggregates have a lower diffusion coefficient than the cement paste, the concrete will have a lower diffusion coefficient than the cement paste. Therefore, chloride ion ingress will decrease with the increase in the aggregate volume, and controls are necessary on the quantity of cement paste and aggregate to achieve a specified service life. The diffusion coefficient of chloride ions in aqueous solutions [112], cement paste [113] and marble [114] has the order of 10-9 m2/s, 10-12 m2/s and 10-15 m2/s, respectively. Accordingly, it can be assumed that diffusion of chloride ions in aggregates of concrete is negligible, leading to:
(1 )(1 )
ac p
a
VD DV
−=
+ (43)
Thus, at 0.7aV = , the effective diffusion coefficient predicted from Eqn. (43) is:
0.1765c pD D= (44)
The chloride threshold value is required in the assessment of service life when chloride-induced corrosion is the failure mechanism. Choosing an accurate value for tC is a great challenge as this parameter varies over a wide range of reported values. The chloride threshold level is commonly presented as total chloride content expressed relative to the weight of cement, which is favored because of the availability of relatively simple means to derive data. A summary of chloride threshold levels inferred from extensive published data was given by Glass and Buenfeld [43] and Alonso et al. [44], where the critical chloride levels ranged from 0.17% to 2.4%. Evidently, despite such abundant data in the literature, no agreement among the obtained values is found. This lack of accordance is due to the existence of several processing parameters, such as concrete mixing proportions, moisture content in the concrete, temperature, and types of cations, which may affect the cement binding ability and, therefore, the amount of free chlorides able to depassivate the steel. Recently, it has been shown that corrosion initiation is more dependent on the chloride and hydroxyl ratio or free chloride concentration in the concrete pore solutions than the chloride threshold value [44], from which the corrosion initiation criterion can be given by the ratio of [Cl-] to [OH-], i.e., the concentrations for free Cl- and OH- respectively. The threshold ratio should be about 1.4 for typical reinforced concrete [30]. In concrete, the typical pH value in pore solution is 13.5, which corresponds to the OH- concentration of 0.316 M. As such, the minimum chloride concentration for steel to initiate pitting corrosion in typical concrete, Cth, is 0.44 M.

A-25
Time-to-corrosion of reinforcement in concrete (Ti) and Cth are important service life determinants for reinforced concrete structures in chloride-laden environments. Numerous literatures have discussed, through experimental or modeling approaches, these two determinants in conventional PCC and their relationships with the type of cement and reinforcement, mix design, exposure conditions, and other factors. It should be cautioned, however, that these relationships feature a probabilistic nature [115]. A recent study confirmed and analyzed the probabilistic distribution of Ti and Cth for both regular concrete and self-compacting concrete (SCC) slabs, and the air voids at the rebar-concrete interface were also found to contribute the uncertainty inherent in the service life of reinforced concrete in salt-laden environments [115].
6. Conclusions
Based on the comprehensive literature review, we can conclude that chloride ingress into concrete is a complex process, which in the highway environment is further complicated by the freeze-thaw cycles and wet-dry cycles experienced by roadways and bridges. While there are numerous existing experimental or modeling studies related to the transport of chlorides (and inhibitors) in concrete, the measurement of chloride (and inhibitor) ingress into concrete is technically challenging. Furthermore, it is also difficult to assess the durability of reinforced concrete from its chloride diffusivity, partially owing to the heterogeneous nature of the concrete matrix, the difficulty in fabricating concrete in a reproducible manner, and the inherently probabilistic nature of species transport in concrete and of chloride-induced corrosion of rebar or dowel bars in concrete.
7. References
[1] Hartt., W. and J. Nam, Critical Parameters for Corrosion Induced Deterioration of Marine Bridge Substructures in Florida, prepared for the Florida Department of Transportation (2004).
[2] Baykal, M., Implementation of Durability Models for Portland Cement Concrete into Performance-Based Specifications. Austin, TX: The University of Texas at Austin (2000).
[3] Savas, B., Effects of Microstructure on Durability of Concrete. Raleigh, NC: North Carolina State University (1999).
[4] Samples, L. and J. Ramirez, Methods of Corrosion Protection and Durability of Concrete Bridge Decks Reinforced with Epoxy-Coated Bars, Phase I. FHWA/IN/JTRP-98/15. Purdue University, IN. (1999)
[5] Wee, T., A. Suryavanshi, and S. Tin, ACI Materials Journal, 97(2000): 221. [6] Hausmann, D., Materials Performance 37(1998): 64. [7] Hartt, W., S. Charvin, and S. Lee, Influence of Permeability Reducing and
Corrosion Inhibiting Admixtures in Concrete upon Initiation of Salt Induced Embedded Metal Corrosion, prepared for the Florida Department of Transportation (1999).
[8] FHWA, FOCUS Federal Highway Administration, Washington DC, 1999, Sept.: 6.
A-26
[9] Sharp, S.R., G.G. Clemena, Y.P. Virmani, G.E. Stoner, and R.G. Kelly, Electrochemical Chloride Extraction: Influence of Concrete Surface on Treatment. Report # FHWA-RD-02-107. Sept. 2002.
[10] SRI International, http://onlinepubs.trb.org/onlinepubs/shrp/SHRP-S-310.pdf. 1993. [11] Savas B. Z., Effects of Microstructure on Durability of Concrete, Raleigh, NC:
North Carolina State University. [12] Castellote M., C. Andrade, and C. Alonso, Cement and Concrete research,
31(2001): 1411. [13] Husain A., S. Al-Bahar, S.A. Salam, and O. Al-Shamali, Desalination 165(2004):
377. [14] Stanish K., R.D. Hooton, and M.D.A. Thomas, Cement and Concrete Research
34(2004): 43-57. [15] Stanish K.D., R.D. Hooton, and M.D.A. Thomas (1997). Testing the Chloride
Penetration Resistance of Concrete: A Literature Review. Toronto, ON: Canada, University of Toronto.
[16] Shi C., J.A. Stegemann, and R.J. Caldwell, ACI Materials Journal 95(1998): 389. [17] Wee T.H., A.K. Suryavanshi, and S.S. Tin, ACI Materials Journal 97(2000): 221. [18] Weyers R.E. (1998). Corrosion Service Life Model, in Repair and Rehabilitation of
Reinforced Concrete Structures: The State of the Art, p. 105, W.P. Silva-Araya, O.T. de Rincon, and L. Pumarada O’Neill, Eds., American Society of Civil Engineers, Reston, VA.
[19] R. F. Stratfull, The corrosion of steel in a reinforced concrete bridge, Corros 13 (3) (1956) 173-178.
[20] V. K. Gouda, Corrosion and corrosion inhibition of reinforcing steel, Br Corros J 5 (2) (1970) 198-202.
[21] Page C.L., N.R. Short, and W.R. Holden, Cement and Concrete Research 16(1986): 79.
[22] Bertolini L., B. Elsener, P. Pedeferri, and R. Polder (2004). Corrosion of Steel in Concrete: Prevention, Diagnosis, Repair. Wiley-VCH, Verlag GmbH & Co. KgaA, Weinheim.
[23] Glass G.K., and N.R. Buenfeld, Prog. Struct. Engng. Mater. 2(2000): 448. [24] W.H.Hartt and J.Nam, Effect of Cement Alkalinity on Chloride Threshold and
Time-to-Corrosion of Reinforcing Steel in Concrete, Corros 64(8) (2008) 671-680. [25] P. Cros, W. H. Hartt and H. Yu, Effects of reinforcement on chloride intrusion into
concrete and time-to-corrosion, 16th International Corrosion Congress, Sept 22-26, 2005, Beijing, China.
[26] E. J. Hansen and V. E. Saouma, Numerical simulation of reinforced concrete deterioration: Part I: Chloride diffusion, ACI Mater J 96(2) (1999) 173-180.
[27] H. Yu, Y. Deng, W. H. Hartt, Modeling Analysis for the Effects of Non-diffusive Coarse Aggregate on Time-to-corrosion and Corrosion Initiation Site, NACE International/2008 Conference, Paper No. 08321, March 16-20, 2008, New Orleans, LA.
[28] Henriksen A. (2004). Chloride Thresholds: A Research Proposal, 83rd Transportation Research Board Annual Meeting, Washington, D.C.: US.
[29] Kayyali O.A. and M.N. Hague, Cement and Concrete Research 18(1988): 895. [30] Hausmann D.A., Materials Performance 37(1998): 64.
A-27
[31] Ann, K. Y., and Song, H.-W., Chloride Threshold Level for Corrosion of Steel in Concrete, Corros Sci 49(11) (2007) 4113-4133.
[32] A. L. Page, N. R. Short and W. R. Holden, The influence of different cements on chloride-induced corrosion of reinforcing steel, Cem Concr Res 16 (7) (1986) 79-86.
[33] S. Care, Influence of aggregates on chloride diffusion coefficient into mortar”, Cem Concr Res 33(7) (2003) 1021-1028.
[34] C. Andrade, Calculation of chloride diffusion coefficients in concrete from ionic migration measurement, Cem Concr Res 23(3) (1993) 724-742.
[35] Z. P. Bazant, “Physical model for steel corrosion in concrete sea structures- Application”, ASCE J Struct Div. 105, June, 1979, 1155-1166.
[36] C. B. Shin and E. K. Kim, Modeling of chloride ion ingress in coastal concrete, Cem Concr Res 32(5) (2002) 757-762.
[37] A. Boddy and E. Bentz, An overview and sensitivity study of a multi-mechanistic chloride transport model, Cem Concr Res 29(6) (1999) 827-837.
[38] D.A.Hausmann, Steel corrosion in concrete: How does it occur?, Mater Prot 6 (11) (1967) 19-23.
[39] T.Yonezawa, V.Ashworth, R.P.M. Procter, Pore solution composition and chloride effects on the corrosion of steel in concrete, Corros 44 (7) (1988) 489-493.
[40] W.Breit, Critical chloride content — investigations of steel in alkaline chloride solutions, Mater Corros 49 (6) (1998) 539-550.
[41] L. Li, A.A. Sagûës, Chloride Corrosion Threshold of Reinforcing Steel in Alkaline Solutions - Open-Circuit Immersion Tests, Corros 57(1) (2001) 19-28.
[42] G. Morcous and Z. Lounis, Comp. Aid. Civ. Infra. Engrg. 20(2) (2005), 108-117. [43] G.K. Glass and N.R. Buenfeld, The Presentation of the Chloride Threshold Level
for Corrosion of Steel in Concrete, Corros Sci 39(5) (1997) 1001-1013. [44] C. Alonso, C. Andrade, M. Castellote and P. Castro, “Chloride threshold values to
depassivate reinforcing bars embedded in a standardized OPC mortar”, Cem Concr Res 30(7) (2000) 1047-1055.
[45] C. Alonso, M. Castellote, C. Andrade Chloride threshold dependence of pitting potential of reinforcements, Electrochim Acta 47 (2002) 3469-3481.
[46] H. Yu and W. H. Hartt, Effect of Reinforcement and Coarse Aggregates on Chloride Ingress into Concrete and Time-to-Corrosion: Part I—Spatial Chloride Distribution and Implications, Corros 63(9) (2007) 843-850.
[47] H.Yu, R.J.Himiob and W.H.Hartt, Effects of reinforcement and coarse aggregates on chloride ingress into concrete and time-to-corrosion: Part 2: Spatial distribution of coarse aggregates, Corros 63(10) (2007) 924-931.
[48] G.E. Monfore, and G.J. Verbeck, Corrosion of Prestressed Wire in Concrete, ACI Mater J 57(5) (1960) 491-497.
[49] Söylev, T.A., and Francois, R. Corrosion of Reinforcement in Relation to Presence of Defects at the Interface between Steel and Concrete, J. Mater Civil Eng 17(4) (2005) 447-455.
[50] T. A. Soylev, R. François, Quality of steel-concrete interface and corrosion of reinforcing steel, Cem Concr Res 33(9) (2003), 1407-1415
A-28
[51] Chi, J.M., Huang, R., Yang, C.C., Effects of carbonation on mechanical properties and durability of concrete using accelerated testing method, J Marine Sci Tech 10 (1) (2002) 14-20
[52] H. A. F. Dehwah, M.Maslehuddin and S.A.Austin, Effect of cement alkalinity on pore solution chemistry and chloride-induced reinforcement corrosion, ACI Mater J 99(3) (2002) 227-235.
[53] B. H. Oh and B. S. Jang, Chloride diffusion analysis of concrete structures considering effects of reinforcing, ACI Mater J 100(2) (2003) 143-149.
[54] S. C. Kranc, A.A. Sagues and F. P-Moreno, Decreased corrosion initiation time of steel in concrete due to reinforcing bar obstruction of diffusional flow, ACI Mater J 99(1) (2002) 51-53.
[55] P. Cros W. H. Hartt and H. Yu, Affects of reinforcement on chloride intrusion into concrete and time-to-corrosion, 16th International Corrosion Congress, Sept 22-26, 2005, Beijing, China.
[56] E. J. Hansen and V. E. Saouma, Numerical simulation of reinforced concrete deterioration: Part I: Chloride diffusion, ACI Mater J 96(2) (1999) 173-180.
[57] Buenfeld N.R., G.K. Glass, A.M. Hassanein, and J.Z. Zhang, Journal of Materials in Civil Engineering 11(1998):220.
[58] Lu X., C. Li, and H. Zhang, Cement and Concrete Research 32(2002): 323. [59] Tritthart, J. Cement and Concrete Research 19 (1989): 683. [60] Rasheeduzzafar, S.E. Hussain, and S.S. Al-Saadoun, Cement and Concrete
Research 21(1991): 777. [61] Andrade C., and C.L. Page (1986). British Corrosion Journal 21(1): 49. [62] Al-Qadi I.L., B.D. Prowell, R.E. Weyers, T. Dutta, H. Gouru, and N. Berke.
Concrete Bridge Protection and Rehabilitation: Chemical and Physical Techniques. Corrosion Inhibitors and Polymers. SHRP-S-666. Strategic Highway Research Program. Washington, DC, 1993.
[63] Dillard, J.G. et al., Migration of Inhibitors in Aqueous Solution through Concrete. Transportation Research Record 30, Washington, D.C.: Transportation Research Board, National Research Council, 1991.
[64] Elsener, B. Corrosion Inhibitors for Steel in Concrete. State of the Art Report. European Federation of Corrosion Publications Number 35. Published by Maney Publishing on behalf of the Institute of Materials. 2001.
[65] Ushirode, W.M., J.T. Hinatsu, and F.R. Foulkes, J. Appl. Electrochem. 22(1992), 224-9.
[66] Ngala V.T., C. L. Page, M. M. Page, Corrosion Science 45 (2003) 1523-1537. [67] Ngala V.T., C. L. Page, M. M. Page, Corrosion Science 44 (2002) 2073-2087. [68] Tritthart J., Cement and Concrete Research 33 (2003) 829-834. [69] Heiyantuduwa, R., M.G. Alexander, and J.R. Mackechnie. Journal of Materials in
Civil Engineering, Nov/Dec (2006): 842-850. [70] Holloway, L., K. Nairn, and M. Forsyth. Cement and Concrete Research 34 (2004):
1435-1440. [71] Sawada S., C. L. Page, M. M. Page, Corrosion Science 47 (2005) 2063-2078. [72] Pan, T., Nguyen, T.A., and Shi, X. Assessment of Electrical Injection of Corrosion
Inhibitor for Corrosion Protection of Reinforced Concrete. Transportation Research Record: Journal of the Transportation Research Board, 2008, 2044, 51-60.
A-29
[73] Liu, Y. and Shi, X. Electrochemical Chloride Extraction and Electrochemical Injection of Corrosion Inhibitor in Concrete: State of the Knowledge. Corrosion Reviews, 2009, 27(1-2), 53-82.
[74] Erdoğdu S., I.L. Kondratova, and T.W. Bremner, Cement and Concrete Research 34(2004): 603.
[75] Hartt W.H., G.P. Rodney, L. Virginie, and D.K. Lysogorski (2004). A Critical Literature Review of High-Performance Corrosion Reinforcements in Concrete Bridge Applications. FHWA-HRT-04-093.
[76] Mehta P.K. (1977). Effect of cement composition on corrosion of reinforcing steel in concrete. In Chloride Corrosion of Steel in Concrete, Philadelphia, ASTM STP 629, pp.12-19.
[77] Shin C.B., and E.K. Kim, Cement and Concrete Research 32(2002): 757. [78] Liu, Y., and Shi, X. Cathodic Protection Technologies for Reinforced Concrete:
Introduction and Recent Developments. Reviews in Chemical Engineering 2009, 25(5-6), 339-388.
[79] Marcotte T. et al., Cement and Concrete Research 29(1999): 1561-1568. [80] Stanish, K., M. Thomas, Cement and Concrete Research 33(2003), 55-62 [81] Buenfeld, N., Journal of Materials in Civil Engineering 11(1998): 220-228 [82] Samson, E., J. Marchand, J. Beaudoin, Cement and Concrete Research 30(2000):
1895-1902 [83] Stanish, K., R. Hooton, M. Thomas, Cement and Concrete Research 34(2004): 43-
49 [84] Pitzer, K., Journal of Physical Chemistry 77(1973): 268-277 [85] Samson, E. et al., Computational Material Science 15(1999): 285-294 [86] Samson, E., J. Marchand, Journal of Colloid and Interface Science 215(1999):1-8 [87] Zhang, J., I. Mcloughlin, N. Buenfeld, Cement and Concrete Composites
20(1998):253-261 [88] Yu, S., C. Page, British Corrosion Journal 31(1996):73-76 [89] Shin, C., E. Kim, Cement and Concrete Research 32(2002):757-762 [90] Ait-Mokhtar, A., Cement and Concrete Composites 26(2004):339-345 [91] Hassanein, A., G. Glass, N. Buenfeld, Corrosion Science, 55(1999): 840-850 [92] Keister, J., Journal of Membrane Science, 29(1986):155-167 [93] Wang, Y., L. Li, C. Page, Computational Material Science 20(2001):196-212 [94] Masi, M., Cement and Concrete Research 27(1997):1591-1601 [95] Truc, O., J. Ollivier, L. Nilsson, Cement and Concrete Research 30(2000):1581-
1592 [96] Arya, C., J. Newman, Materials and Structures 23(1990):319-330 [97] Pereira, C., L. Hegedus, Proceedings of the 8th International Symposium on
Chemical Reaction Engineering, 87, 427-438 [98] Tangtermsirikul, S., T. Maruya, Y. Matsuoka, Taisei Kensetsu Gijutsu kenkyu,
24(1991):377-382 [99] Tang, L., Chloride Transport in Concrete-Measurement and Prediction, Thesis,
Chalmers University of technology. [100] Siegwart, M., J. Lyness, B. Mcfarland, Cement and Concrete Research
33(2003):1211-1221
A-30
[101] Boddy, A., E. Bentz, M. Thomas, R. Hooton, Cement and Concrete Research 29(1999): 827-837
[102] Hassanein A, G. Glass, N. Buenfeld, Corrosion 54(1997):323-332 [103] Johannesson, B., Cement and Concrete Research 29(1999):1261-1270 [104] Samson, E., J. Marchand, K. Snyder, J. Beaudoin, Cement and Concrete Research
35(2005):141-153 [105] Xi, Y., A. Ababneh, ICACS 17-19(2003) : 354-364 [106] Marchand, J., Materials and Structures 34(2001):195-200 [107] Chung J., G. Consolazio, Cement and Concrete Research 35(2005):597-608 [108] Freeze, R.A., and J. Cherry (1979). Groundwater, Prentice-Hall, Inc., New Jersey. [109] NIST (2005). Publicly Available Computer Models, Lastly accessed in Feb. 2005,
at: http://ciks.cbt.nist.gov/~bentz/phpct/cmml.html. [110] R. P. Khatri, V. Sirivivatnanon, Cement and Concrete Research, 34 (2004) 745-
752. [111] T. J. Kirkpatrick, R. E. Weyers, C. M. Anderson-Cook, M. M. Sprinkel, Cement
and Concrete Research, 32 (2002) 1943-1960. [112] S. H. Lee, J. C. Rasaiah, Journal of Physical Chemistry, 100 (1996) 1420-1425. [113] M. Castellote, C. Alonso, C. Andrade, G. A. Chadbourn, C. L. Page, Cement and
Concrete Research, 31 (2001) 621-625. [114] D. W. Hobbs, Cement and Concrete Research, 29 (1999) 1995-1998. [115] Yu, H., Shi, X., Hartt, W. H., and Lu, B. (2010). Laboratory investigation of
reinforcement corrosion initiation and chloride threshold concentration for self-compacting concrete. Cement and Concrete Research, in press. DOI: 10.1016/j.cemconres.2010.06.004.
A-31
APPENDIX B. Deicer Impacts on Pavement Materials: Introduction and Recent Developments
Published as: Shi, X., Akin, M., Pan. T., Fay, L., Liu, Y., and Yang, Z. Deicer Impacts on Pavement Materials: Introduction and Recent Developments. The Open Civil Engineering Journal, 2009, 3, 16-27. With some references updated herein.
Abstract:
1. Introduction
A review of the impacts of deicers used in winter maintenance practices of Portland cement concrete and asphalt concrete roadways and airport pavements is presented. Traditional and relatively new deicers are incorporated in this review, including sodium chloride, magnesium chloride, calcium chloride, calcium magnesium acetate, potassium acetate, potassium formate, sodium acetate, and sodium formate. The detrimental effects of deicers on Portland cement concrete exist through three main pathways: 1) physical deterioration such as “salt scaling”; 2) chemical reactions between deicers and cement paste (a cation-oriented process, especially in the presence of magnesium chloride and calcium chloride); and 3) deicers aggravating aggregate-cement reactions (such as the anion-oriented process in the case of chlorides, acetates, and formates affecting alkali-silica reactivity and the cation-oriented process in the case of calcium chloride and magnesium chloride affecting alkali-carbonate reactivity). The deicer impacts on asphalt concrete pavements had been relatively mild until acetate- and formate-based deicers were introduced in recent years. The damaging mechanism seems to be a combination of chemical reactions, emulsifications and distillations, as well as the generation of additional stress in the asphalt concrete.
In cold-climate regions, snow and ice control operations are crucial to maintaining highways that endure cold and snowy weather. The growing use of deicers has raised concerns about their effects on motor vehicles, transportation infrastructure, and the environment. The deleterious effect of chloride-based deicers on reinforcing steel bar (rebar) in concrete structures is well known [1]. Deicers may also pose detrimental effects on concrete infrastructure through their reactions with cement paste and/or aggregates and thus reduce concrete integrity and strength, which in turn may foster the ingress of moisture, oxygen and other aggressive agents onto the rebar surface and promote rebar corrosion.
This literature review presents a synthesis of the impacts of common deicers on cement and asphalt pavements, respectively, detailing the various mechanisms found to cause deterioration. The following sections document the impacts sodium chloride (NaCl), calcium chloride (CaCl2) and magnesium chloride (MgCl2) have on pavement materials, compared with those of alternative deicers such as calcium magnesium acetate (CMA), potassium acetate (KAc), potassium formate (KFm), sodium acetate (NaAc), and sodium formate (NaFm).
A-32
2. Deicer Effects on Portland Cement Concrete
Previous studies on deicer/concrete interactions used mostly concentrated deicer solutions. A Transportation Pooled Fund study [2] investigated the effects of concentrated brines of NaCl, CaCl2, MgCl2 and CMA on Portland cement concrete (PCC) and concluded that both physical and chemical interactions occur within concrete when it is exposed to freeze/thaw conditions and deicers. Based on the ASTM C 666 freeze/thaw test results, concrete prisms of 10 cm diameter by 5 cm height subjected to 300 freezing/thawing cycles in 14% MgCl2 and 15% CaCl2 reported considerable expansion (0.17% and 0.18% length change, respectively), mass change (3.5% and -3.5%, respectively) and loss in the dynamic modulus of elasticity (50% and 40%, respectively). In contrast, those exposed to 18% NaCl did not expand more than 0.04% and reported 0.5% mass gain and approximately 5% loss in the dynamic modulus of elasticity. Significant evidence existed that MgCl2 and CaCl2 chemically reacted with hardened cement paste, as indicated by the dissolution of the cement paste and formation of expansive oxychloride phases. These mechanisms were assumed responsible for the observed expansive cracking, increased permeability, and significant loss in compressive strength of the concrete [2]. Exposure to NaCl, however, did not result in noticeable chemical interaction or related distress in concrete mortar or concrete [2].
A recent study [3] in our laboratory investigated the effects of diluted deicers on PCC, assuming a 100-to-3 dilution ratio for all liquid and solid deicers. Based on the gravimetric and macroscopic observations of freeze-thaw specimens following the SHRP H205.8 laboratory test, de-ionized water, the CMA solid deicer, and the MgCl2 liquid deicer were benign to the PCC durability, whereas KFm and the NaAc/NaFm blend deicers showed moderate amount of weight loss and noticeable deterioration of the concrete. NaCl, the NaCl-based deicer, and the KAc-based deicer were the most deleterious to the concrete. In addition to exacerbating physical distresses, each investigated chemical or diluted deicer chemically reacted with some of the cement hydrates and formed new products in the pores and cracks. Such physiochemical changes of the cement paste induced by the deicers pose various levels of risks for the concrete durability.
Yet another laboratory study investigated the effects of both diluted and concentrated deicers on PCC. Concrete specimens were exposed to weekly cycles of wetting and drying in distilled water and in solutions of NaCl, CaCl2, MgCl2, and CMA with either a 6.04 molal ion concentration (equivalent to a 15% solution of NaCl), or a 1.06 molal ion concentration (equivalent to a 3% solution of NaCl), for periods of up to 95 weeks. At lower concentrations, NaCl and CaCl2 showed a relatively small negative impact on the properties of concrete, whereas MgCl2 and CMA caused measurable damage to concrete. At high concentrations, NaCl showed a greater but still relatively small negative effect, whereas CaCl2, MgCl2 and CMA caused significant loss of material and a reduction in stiffness and strength of the concrete [4].
In addition to chlorides, the detrimental effects of CMA on PCC have also been confirmed. In a recent laboratory study, cement mortar samples (water to cement ratio (w/c)=0.485) were reported to lose cohesiveness and disintegrate completely after 30-day
A-33
exposure to 28% CMA solution at room temperature, and the formation of calcium acetate hydrate phases were confirmed by X-ray diffraction results [2]. In another laboratory study [5], eight-month continuous exposure of good-quality concrete (w/c=0.45 and air-entrained) to concentrated CMA solutions (25%) caused a significant decrease in load capacity, mass loss and severe visual degradation of the concrete. The use of 40% blast furnace slag along with a Portland clinker was found effective in mitigating such impacts of CMA [5]. The deleterious effects of CMA were also reported in earlier studies ([6], [7]), involving a delamination process of the cement matrix likely associated with leaching of the calcium hydroxide.
In light of these studies, it appears that deicers may pose a risk for the durability of PCC structures and pavements through three main pathways: 1) physical deterioration of the concrete through such effects as salt scaling; 2) chemical reactions between deicers and concrete; and 3) deicers aggravating aggregate-cement reactions.
2.1. Deicer Scaling - A Physical Process
Physical mechanisms of attack by deicers can lead to damage of PCC in the common forms of scaling, map cracking, or paste disintegration [2]. Scaling refers to the local peeling of the hardened concrete surface, often as a result of cyclic freezing and thawing [8]. Scaling can occur on concrete surfaces independent of deicer application, as the aqueous solution in the concrete pores near the surface freezes and thaws due to temperature fluctuations. Freezing of water in saturated concrete exerts tremendous expansive forces that consequently lead to scaling off of concrete surfaces, especially when the concrete surface is not adequately protected with entrained air.
Many research studies have shown that chloride-based deicing salts can exacerbate the scaling problem as concrete experiences freeze/thaw cycles. Moisture tends to move toward zones with higher salt concentrations via osmosis. Accordingly, the osmotic pressure adds to the normal hydraulic pressure if salts are present in the pore solution, which increases the risk for physical deterioration of concrete. In addition, the application of deicing salts to pavements increases the rate of cooling, which increases the number of freeze/thaw cycles and thus the risk for freeze/thaw deterioration. However, the presence of deicers can be beneficial as it widens the temperature range in which phase transitions occur. These opposing effects define the physical distress in concrete caused by deicers, and a pioneering laboratory study revealed the worst conditions at a low deicer concentration (5% NaCl) and optimum conditions at a moderately high concentration (13% NaCl) [9]. Another study suggested that concrete containing relatively high concentrations of dissolved salts can provide better resistance to scaling than concrete with plain water in its pores [10].
The scaling of concrete in the presence of deicers, referred to as “salt scaling,” has been recognized as the main cause of frost-related concrete deterioration, and has been found closely related to concrete quality (e.g., air entrainment level), weather conditions, and the number of freeze/thaw cycles ([11], [12], [13], [14]). Concrete damage from salt scaling was found to be significantly dependent on the salt type (sodium, potassium,

A-34
magnesium or calcium chloride) and salts containing potassium seemed to cause more scaling damage for unknown reasons [15].
KAc was reported to cause minor scaling associated with alkali carbonation of the surface layer of concrete [16]. Recently, however, the treatment of PCC with sodium acetate solutions was claimed to be a promising technology to grow crystals inside the pores to reduce water penetration into concrete and thus extend the service life of concrete [17]. Such beneficial effect was demonstrated in the treatment of a poor-quality concrete (w/c=0.65 and non-air-entrained).
Early research argued that the best protection against "salt scaling" would be reduction of porosity [9]. It is now generally believed that the use of properly cured, air-entrained Portland cement concrete would prevent physical damage by the freeze/thaw cycles. For instance, high-quality concrete with 5–7% entrained air has been found more resistant to freeze/thaw cycles and scaling [18]. Entrained air provides spaces within the concrete mass for expanding water to move into, thereby reducing the potential stress and associated deterioration. For an air-entrained concrete, the spacing factor seems to be its key air void characteristic to allow sufficient resistance to salt scaling [19]. It should be noted that air entrainment only slows the freeze–thaw process instead of preventing it [10].
The use of supplementary cementitious materials, particularly fly ash, has been widely reported to have detrimental effects on the scaling resistance of properly air-entrained concrete, as it tends to refine porosity and increase the non-evaporable water content [20]. One study suggested that the key was to allow sufficient time for high-volume fly ash concrete to develop strength before subjecting it to salt scaling [21]. In contrast, the use of some cementitious material may improve the resistance of mortars and concretes to the combined action of frost and deicer, as in the case of a magnesium phosphate cement-based binder prepared by mixing magnesium oxide (MgO) with mono-ammonium phosphate, borax and fly ash [22].
2.2. Reactions between Deicers and Concrete - A Cation-Oriented Chemical Process
Chemical mechanisms of attack by deicers can lead to damage of PCC in the common forms of map cracking, paste disintegration, internal microcracking, strength loss, mass gain, and expansion. The following strategies were recommended to mitigate the deleterious effects of deicers: 1) use less deicing chemicals; 2) use NaCl brines wherever possible, 3) use concrete sealants (e.g., siloxanes and silanes) and concrete mixtures with supplementary cementitious materials (e.g., ground granulated blast furnace slag and coal fly ash) [2].
Sodium Chloride (NaCl)
Sodium chloride (NaCl) remains the principal road deicer in use despite its well-known corrosive effects on metals. It has a eutectic point of -23°C, good ice-melting rates at low temperatures and, above all, is relatively inexpensive. Generally, salt scaling appears to be limited to the concrete surface when NaCl is used. Unless reactive
A-35
aggregates are included in thick concrete structures such as bridge decks, NaCl, when used as a deicer, does not cause serious deterioration in concrete except for the surface distress caused by the physical mechanism of scaling. Long-term use of NaCl does not result in strength loss in the cement paste matrix via chemical mechanisms except for the slow process of accelerating alkali-silica reaction.
While NaCl itself may be innocent, deicers originating from mines (rock salt, as opposed to solar salt) may contain significant traces of calcium sulfate. Research by Pitt et al. [23] showed that even low levels of CaSO4 can damage mortar, especially in combination with freezing and thawing cycles, due to pore filling by possibly Friedel’s salt and ettringite. To minimize such damage, changes in mix design or treating joints and cracks with silane sealers can be effective, while establishing restrictions on CaSO4 limits in rock salt used for deicing may be difficult.
Magnesium Chloride (MgCl2)
Numerous research studies have shown that MgCl2, when used as a deicer, causes much more severe deterioration to concrete than NaCl or CaCl2. This is due to the reaction between Mg2+ and the hydrated products in cement paste ([24], [25], [26], [27], [2]). As shown in Equation (1), MgCl2 can react with the cementitious calcium silicate hydrate (C-S-H) present in the cement paste and produce non-cementitious magnesium silicate hydrate (M-S-H) and calcium chloride (CaCl2):
MgCl2 + C-S-H → M-S-H + CaCl2 ... (1)
MgCl2 can also react with calcium hydroxide (Ca(OH)2), another hydrated product present in the cement paste in addition to C-S-H. As shown in Equation (2), this chemical reaction produces another non-cementitious material, magnesium hydroxide (Mg(OH)2), commonly known as brucite.
MgCl2 + Ca(OH)2 → Mg(OH)2 + CaCl2 ... (2)
Since M-S-H and brucite are thermodynamically more stable than C-S-H and Ca(OH)2, the two reactions are highly likely to occur when MgCl2 is applied as a deicer onto concrete. M-S-H and brucite have lower binding capacity than C-S-H and Ca(OH)2, and their formation in concrete thus significantly degrades concrete strength while increasing porosity.
In addition, great expansive forces usually accompany the formation of brucite, which further accelerates the concrete deterioration process. As a result, concrete degradation due to the reaction of Mg2+ with cement paste has been recognized as one of the major mechanisms through which MgCl2 deicer affects the durability of concrete structures ([28], [24], [25], [27]).
The aforementioned MgCl2 impacts on concrete are substantiated further by research based on field data [25]. In Iowa, core samples taken from existing concrete structures aged from eight to forty years all contained dolomitic limestone aggregates. The study revealed that MgCl2 deteriorated concrete by promoting expansion of the
A-36
concrete through the formation of brucite and growth of other detrimental minerals. It was also reported that NaCl showed less detrimental effect than MgCl2 ([25], [29], [30]).
Detailed information regarding the mechanism of MgCl2 deteriorating concrete material can be found in many research studies. The consensus is that Mg(OH)2 and M-S-H are the most predominant reaction products, formation of which eventually leads to the degradation of concrete when MgCl2 is applied as a deicer ([31], [32], [33], [34]), although different mechanisms were proposed for the formation and behavior of Mg(OH)2.
A recent laboratory study reported the formation of another potentially detrimental phase, calcium oxychloride (3CaO•CaCl2•15H2O), formed in cement mortars exposed to 15% MgCl2 solutions for 84 days, as confirmed by optical microscopy, scanning electron microscopy (SEM), and microanalysis [35]. The proposed mechanism was based on Equations (2) and (3):
3Ca(OH)2 + CaCl2 + 12H2O → 3CaO•CaCl2•15H2O ... (3)
The petrographic evidence indicated that platey calcium oxychloride crystals and their carbonate-substituted phase precipitated in air voids and cracks by consuming portlandite (Ca(OH)2). In addition, Friedel’s salt was detected in the specimens analyzed [35]. In another laboratory study by the same group, the structures of brucite were also observed in the outer layers of the PCC specimens exposed to concentrated MgCl2 [2].
The difficulty of constructing durable concrete dams in salt mines led to research efforts in Poland investigating the long-term behavior of cement pastes exposed to a strong chloride solution, predominantly composed of NaCl, MgCl2, and KCl [36]. Kurdowski found two cements: high-alumina cement and alkali activated slag, performed particularly well for over seven years because a stable skin-like layer of low permeability formed and protected the concrete core. Even after fifteen years the high-alumina cement had high strength and showed no deterioration. Portland and slag cements, however, were found to be particularly vulnerable to deterioration or unstable layers of chemical products. The difference is attributed to the higher porosity of Portland and slag cements [36].
Calcium Chloride (CaCl2)
CaCl2 has been found to have a detrimental effect falling between that caused by NaCl and MgCl2. It has also been found that concrete specimens exposed to CaCl2 deteriorated in a similar pattern to those exposed to MgCl2, although at a slower pace and to a less severe degree. As shown in Equation (3), CaCl2 can also react with Ca(OH)2 and form a hydrated calcium oxychloride ([37], [2]).
At temperatures ranging from 4.4 to 10°C, hydrated calcium oxychloride can be generated in a relatively short period of time once CaCl2 is available. This reaction adds additional stress to the concrete matrix. A recent study [38] provided further evidence for this mechanism of CaCl2 attack in concrete.
A-37
The damaging impact of CaCl2 on concrete was examined in a comprehensive study [16] conducted at Iowa State University. The study included five deicing chemicals – NaCl, CaCl2 with and without a corrosion inhibitor, KAc, and an agricultural product as well as freezing/thawing and wetting/drying exposure conditions. Comprehensive damaging criteria were set up and examined for the paste and concrete subjected to these deicing chemicals, including mass loss, scaling, compressive strength, chemical penetration, and microstructure of the paste and concrete. The deicing chemicals tested were found to penetrate into a given paste and concrete at different rates, leading to different degrees of damage. The two CaCl2 solutions caused the most severe damage compared to the others. The addition of the corrosion inhibitor in the CaCl2 solutions delayed the onset of damage, but failed to reduce the ultimate damage. Leaching of calcium hydroxide accompanied by some chemical alterations in concrete was also observed for specimens exposed to chlorides.
2.3. Deicer Aggravating Aggregate-Cement Reactions
Chloride-Based Deicers Affecting ASR — An Anion-Oriented Chemical Process
Alkali silica reaction (ASR) is a deleterious process caused by the chemical reaction between available alkalis from the cement paste and reactive silica in the aggregate of PCC. In ASR, the chemical reaction between hydroxyl (OH-) associated with sodium (Na+) and potassium (K+) and reactive forms of silica produces a gel that expands when sufficient moisture is available. The expansion of the gel can produce internal stress great enough to cause cracks in both cement paste and aggregates. Typical ASR distress is manifested by cracking, popouts and expansion.
ASR was first discovered as a stress to concrete structures in the United States by Stanton in 1940 [39]. Failure of concrete structures later ascribed to ASR can be dated back to the late 1920s. Reactive aggregates, available alkalis and sufficient water are three prerequisites for ASR to occur. ASR has been conventionally controlled by limiting alkali content in cement and selecting aggregates of good quality.
Extensive research suggests that NaCl can initiate and/or accelerate ASR by supplying additional alkalis to concrete ([40], [41], [42], [43], [44], [45], [46]). An increase in pH of the concrete pore solution has been frequently observed and commonly proposed as the principal cause for the exacerbation of ASR in PCC exposed to NaCl ([42], [44], [47]). Nevertheless, this process was found to be quite slow and might be masked by other short-term effects. Equation (4) presents the mechanism of the pH increase in concrete pore solution resulting from the dissolution of Ca(OH)2 in the presence of sodium chloride.
2NaCl + Ca(OH)2 ↔ CaCl2 + 2NaOH ... (4)
The Cl- ions from NaCl might also accelerate ASR when the OH- concentration remains above a certain limit ([45], [48]). It was reported that high-alkali concrete exposed to NaCl solution expanded even more than high-alkali concrete exposed to NaOH. This was attributed to the combined effects of ASR and the formation of
A-38
expansive chloroaluminates [49]. In contrast, low-alkali concrete was sufficiently protected against ASR when exposed to NaCl [49].
For high-alkali concrete that is already affected by ASR, map cracking can occur at the surface due to a decrease in pH in the near-surface layer of concrete. This has been observed in field specimens indicating that chloride ions traveled less than 100 mm inside the ASR-affected concrete. Measurements of core samples from concrete structures exposed to NaCl deicer indicated that most chlorides existed in the water-soluble form. SEM observations and microprobe analyses on mortar bars immersed in NaCl solution also suggested that binding of Cl- ions in chloroaluminates or cement hydrates was a long-term process, which could be promoted at higher initial alkali concentrations [50]. A SEM/ Energy-dispersive X-ray (EDX) investigation of cracking deterioration observed in a 3-year-old pavement in central Iowa revealed that ettringite-filled air voids were centers of pressure causing the cracks, instead of ASR that might have been incorrectly identified [51].
It should be noted that the accelerating effect of NaCl on ASR is a slow process, and stress to the concrete surface may be more likely caused by physical mechanisms such as salt scaling rather than chemical mechanisms [25]. Such a conclusion was made based on a laboratory observation where the 0.75M NaCl solution caused more extensive deterioration to the concrete surface than the 3.0M one [25].
As reported in literature, CaCl2 and MgCl2 do not have as obvious an effect on ASR as NaCl. A possible reason is that both Ca2+ and Mg2+ cations can react with the free hydroxyl ions (OH-) in the concrete pore solution and form products that are less soluble in water than NaOH or KOH. Therefore, exposure of concrete to CaCl2 or MgCl2 tends to decrease the pH value in the pore solution. As a consequence, the accelerating effect of Cl- on ASR, if any, might be masked by the more dominant effect of the reaction between Ca2+ and Mg2+ cations with OH- in the cement paste.
Prezzi et al., [52] stress the need for laboratory tests that simulate actual field conditions to truly determine how CaCl2 and MgCl2 deicers affect ASR. In their study, CaCl2 and MgCl2 seemed to actually help reduce ASR-related expansions when added to concrete during mixing operations. When NaOH, KOH, LiOH, NaCl, KCl, CaCl2, MgCl2, and AlCl3 were introduced to new concrete samples as admixtures and then tested according to ASTM C 1260, it was found that samples corresponding to chlorides with monovalent cations had greater ASR expansion than reference concrete specimens, while the divalent and trivalent cations generally had reduced expansions [52]. While this is in contrast to findings from a previous study [48] in which CaCl2 accelerated ASR, the test temperature and salt concentrations were different in these two studies and thus making it difficult to directly compare the research findings. Yet another study [53] tested ASR gel soaked in a solution consisting of 0.7M NaOH and 0.1M CaCl2, where a non-expansive reaction product formed and the ASR gel did not repolymerize.
A-39
CaCl2 and MgCl2 Affecting ACR—A Cation-Oriented Chemical Process
Another deleterious process is commonly observed in concretes with a short service life. The principal reaction has the nature of an alkali-dolomite reaction between coarse aggregates containing reactive dolomite (calcium magnesium carbonate—i.e., CaMg(CO3)2) and cement paste, recognized as Alkali-Carbonate Reaction (ACR).
In ACR, dolomite from the aggregate reacts with OH- in the cement paste to free magnesium cations (Mg2+) and carbonate anions (CO3
2-). Mg2+ then precipitates as brucite, while CO3
2- reacts with portlandite from the cement to form calcite (CaCO3) and OH-. The formation of brucite and calcite leads to crystal growth and thus increased pressure in concrete. This, together with the hydration state changes due to magnesium chloride hydrates, eventually leads to expansion and rapid deterioration of the concrete.
Both MgCl2 and CaCl2 deicers are known to deteriorate concretes containing reactive dolomite aggregates by accelerating ACR. MgCl2 contributes Mg2+ cations that can directly participate in the formation of brucite, whereas CaCl2 was found to accelerate ACR by enhancing the de-dolomitisation reactions, releasing magnesium to form brucite and M-S-H ([26], [27]). No literature was found to report potential effects of NaCl on ACR.
Acetate/Formate-Based Deicers Affecting ASR — An Anion-Oriented Chemical Process
The last decade has seen an increase in the premature deterioration of PCC pavements, which coincided with the introduction of alternative deicers (KAc, NaAc, and NaFm) for winter maintenance. Such deicers have been used more extensively and for more years in European countries for winter maintenance than in the United States [54]. The degree of distress in the PCC of European facilities ranges from mild to severe, in terms of surface cracking and repair and rehabilitation efforts.
Recent research conducted at Clemson University found that the acetate/formate-based deicers could induce increased levels of expansion in concrete with aggregates susceptible to ASR, and could trigger ASR in concrete that previously did not show susceptibility to ASR ([55], [56], [57]). The laboratory results from a modified ASTM C 1260 mortar bar test and a modified ASTM C 1293 concrete prism test indicated that both KAc- and NaAc-based deicer solutions showed significant potential to promote ASR in specimens containing reactive aggregates. Such solutions were also found to cause more rapid and higher levels of expansion within 14 days of testing and to lead to lower dynamic moduli of elasticity, compared with 1N NaOH solution [56]. Increasing temperature or deicer concentration was found to accelerate the deleterious effects of deicers on the ASR in concrete.
Limited existing laboratory studies indicated that acetate-based deicers could cause or accelerate ASR distress in the surface of PCC pavement by increasing the pH of concrete pore solution. PCC pavements that were otherwise resistant to ASR might show rapid deterioration when exposed to these high-alkali solutions. The nature of the reactions associated with increased expansions in mortar bar tests remains unclear to date
A-40
due to limited research conducted on this topic. It was proposed that such deicers react with one of the major hydrated products—portlandite—resulting in higher pH of the concrete pore solution. The high pH resulting from these interactions is likely to have an accelerating effect on the expansions due to ASR. This mechanism was substantiated by SEM/EDX investigation of mortar bars after deicer immersion, which was unable to detect portlandite in the cement paste [58]. Furthermore, the concrete specimens exposed to KAc deicer showed presence of certain secondary reaction products, the effect of which on the PCC durability merits further investigation [59].
Efforts have been made to mitigate ASR by adding various admixture materials. Research sponsored by the Federal Highway Administration (FHWA) used lithium compounds to successfully reduce ASR induced by the deicers [60]. The effectiveness of other supplementary cementing materials (e.g., selected fly ash and slag) was also evaluated in reducing the ASR potential in the presence of KAc deicer. The effectiveness of fly ash in mitigating ASR in the presence of KAc was found dependent on the lime content, as well as the dosage level of the fly ash and the aggregate reactivity. Fly ash with lower lime content was generally more effective in reducing the expansions [61], whereas high-lime fly ash was found ineffective due to its possible negative interactions with the deicer [62]. At the 50% cement replacement level, slag appeared to be effective in mitigating expansions in both KAc deicer solution and 1N NaOH solution [62]. The addition of lithium nitrate to either KAc deicer solution or mortars alone was found to effectively reduce the mortar expansions [62].
3. Deicer Effects on Asphalt Concrete
Of the two major types of pavements—PCC pavement and asphalt pavement—the latter is generally believed to be less effected by deicers. This is attributable to the relatively high chemical resistance that asphalt binder demonstrates in the presence of chloride-based deicers. Thus far, there are no specific guidelines established in the United States for application of deicers on asphalt pavements and little fundamental research carried out in investigating the asphalt/bitumen-deicer reaction, although more severe loss of skid resistance on asphalt surface has been observed by state and federal highway agencies with the application of various road salts [63]. Current research studying deicers effects on asphalt pavement is focused on improving surface skid resistance of the pavements of different mix types.
3.1. Deicer Impacts on Skid Resistance
During the 1976–1977 winter season, FHWA sponsored studies in the states of Maine, Michigan, Utah, and Vermont to determine if more sodium chloride was needed to clear open-graded asphalt friction courses during winter storms than was needed to clear conventional asphalt pavements [64]. It was found that the clearing rates and appearance of open-graded and dense-graded pavements were different. Dense-graded pavement showed occasional faster clearing than open-graded pavements. The open-graded pavement, however, seemed to provide a superior skid-resistant surface during most storms without more salt used to maintain the surface [64].
A-41
Open-graded asphalt mixes commonly used in asphalt pavements fall into three categories: open-graded friction course (OGFC), stone matrix asphalt (SMA), and open-graded base material (OGBM), of which only OGFC and SMA are used as surface course. Accordingly, previous research related to deicer effects on the skid resistance of pavement surfaces focused mainly on these two types of mixes. OGFC and SMA are generically referred to as open-graded mixes (OGMs) or open-graded pavements (OGPs) in deicer studies. OGMs, especially the OGFC, are known to offer lower noise and higher friction between tires and road surface. However, in terms of the skid resistance when deicers are applied, the limited research efforts thus far have yielded quite contradictory conclusions regarding their performance under winter conditions. While some reports indicated that these mixes were problematic when subjected to wet-freeze conditions ([65], [66]), others reported enhanced performance [67]. Such risks, if proven to be true, need to be addressed, considering the increased wet-freeze frequencies on pavement surfaces when deicers are applied.
The Virginia Department of Transportation sponsored a study [68] to examine its winter maintenance techniques of applying sodium chloride in granular, pre-wetted, and liquid forms. The snow removal and ice control operations followed the recommendation by the FHWA Project TE-28. There were no significant differences in the performance of the different surface mixes, including OGFC and dense-graded mixes. A more recent study [69] by the Oregon Department of Transportation was conducted on the effects of liquid magnesium chloride on OGP. Skid tests were performed on four sections of two different highways in Oregon under three conditions: 1) no deicer application; 2) after a deicer application rate of 15 gallons/lane mile; and 3) after a deicer application rate of 30 gallons/lane mile. The results of the skid tests showed that the application of deicer appeared to have little if any effect on the Friction Number (FN), which were all well above the FHWA-recommended minimum FN values.
Due to harsher winter weather that produces more snow and ice, Nordic countries and Canada use more deicers on highways and airport runways than the United States, leading to more extensive research conducted in these areas. Fundamental research has been conducted in these countries to investigate the potential reactions between asphalt materials and various deicers.
3.2. Deicers Affecting Pavement Structure
Thermal cracking, differential heaving, and loss of bearing capacity during spring thaw are often identified as the main mechanisms of pavement deterioration in cold climates. Frost action within the pavement granular layers can be aggravated by an ice enrichment process and differential freezing conditions associated with the contamination of the base material by deicing salt [70].
A comprehensive laboratory study evaluated the relative destructive effects of various deicers on asphalt pavement, considering the effect of freeze/thaw cycles ([71], [72]). This study involved actual aggregates and asphalt specimens cored from the field, as well as four types of deicers used on both highway and airport pavements, namely, urea, NaCl, NaFm, and KAc. Various degrees of material disintegration as a combined
A-42
result of frost action and deicers were observed, revealing that the effect from freeze/thaw cycling was significant whereas the effects of different deicers on both the aggregates and the asphalt concrete mixes varied. The extent of damage due to freeze/thaw cycling in distilled water was less than that caused by any deicer used. A critical range of deicer concentration was found to exist between 1% and 2% by weight of solid deicer to deicer solution, in which the maximum damaging effect of deicers to the aggregate was observed. The limestone aggregates showed a higher resistance to disintegration than the quartzite aggregates when subjected to freeze/thaw cycles in the presence of the deicers. The urea was found to have the highest damaging effect among all the deicers on both the aggregates and asphalt concrete samples, while the least damaging deicer for limestone was NaCl and for quartzite was KAc.
The indirect tensile strengths (ITS) of the samples exposed to deicers were mostly higher than those exposed to distilled water, while all of them were found to be significantly lower than those of the intact samples. However, there was no significant deterioration identified for the mechanical properties of the samples exposed to KAc, NaFm, or NaCl, relative to distilled water. Conditioning asphalt samples using freeze-thaw cycles in the presence of a deicer solution also caused a decrease in the modulus of elasticity. The lowest average elastic modulus was associated with the samples in urea, and visual inspection indicated significant damage by urea [72]. Based on weight measurements and density calculations, asphalt mix sample immersed in NaFm experienced the most disintegration after 25 cycles, whereas urea (followed by KAc) was the most detrimental deicer after 50 cycles [73]. Exposure to freeze/thaw cycles and deicers was found to affect the viscosity of the recovered asphalt binder and the gradation of recovered aggregates. The freeze/thaw cycles seemed to result in soft asphalt binder, while the deicers caused asphalt hardening. However, the authors noted that these findings were inconclusive due to the difficulties involved in testing and the inaccuracies in measuring viscosity of the recovered asphalt. Overall, this laboratory investigation found urea to be the most detrimental deicer, while the other deicers “induced relatively small damage, comparable to that caused by distilled water” [71]. It should be noted that chemical reactions might have been slowed by the low temperatures involved in this study and that damage in the field could occur as a result of reactions between deicer residues and asphalt during hot summer temperatures [71].
A follow-up study was conducted at higher temperatures on asphalt pavement samples taken from the Dorval International Airport (Montreal, Canada) to clarify the role played by the deicers in asphalt deterioration, and to determine whether the damage was attributable to the physical freeze/thaw action. Only 15 freeze/thaw cycles were performed before subjecting some samples to 40 wet/dry cycles at 40°C. This research confirmed the previous finding that softening occurs during freeze/thaw and exposure to deicers causes hardening. After the freeze/thaw and wet/dry cycles, the asphalt samples in NaAc showed the greatest loss of strength and elasticity, followed by those in NaFm. Interestingly, all samples showed increased strength after the warm wet/dry cycles and all except NaFm and NaAc showed increased elasticity after the warm wet/dry cycles. However, the dry samples not exposed to freeze/thaw or wet/dry cycles had the greatest elasticity and nearly the highest strength. Overall, the Canadian studies did not indicate significant damaging effects of KAc and NaFm on asphalt pavement ([72], [74]). It
A-43
should be cautioned, however, that these results were based on laboratory experiments with only two samples of asphalt pavement and the mix design for each pavement was undeterminable from the reports.
3.3. Acetate/Formate-Based Deicer Affecting Airfield Asphalt Pavements
Concurrent to the use of acetate/formate-based deicers in the 1990s, asphalt pavement in Europe saw an increase in pavement durability problems. At some Nordic airports, these problems emerged as degradation and disintegration of asphalt pavement, softening of asphalt binders, and stripping of asphalt mixes occurring together with loose aggregates on the runways ([75], [76]). Such problems were not identified prior to the airports changing from urea to KAc- and KFm-based deicers.
In 2001, serious asphalt durability problems were identified at airports in Nordic countries that used acetate/formate-based deicers [75]. Heavy binder bleeding and serious stripping problems were observed occurring together with loss of asphalt stability. Soft, sticky, and staining binder came to the surface, often leaving strong stains on electrical devices and on the airplanes. The binder of the asphalt base layer was “washed off,” and the aggregates experienced a severe loss of strength. In the laboratory, tests indicated chemical changes in the binder after exposure to the deicer in the form of emulsification, distillation, and an increased amount of polycyclic aromatic hydrocarbons (PAHs). A field investigation was conducted subsequently that confirmed the deleterious effects of acetate-based deicer on the asphalt pavement. The bitumen and the mastic squeezed to the surface of the core, and the concentration of the deicer had a clear influence on its solubility. Some bitumen was dissolved into the pore liquid, and pure stone particles were found inside the core. The limestone filler was found fully dissolved by the deicer liquid and the rest of the mastic became brittle and grey-colored. A large increase in the porosity of asphalt was also noticed ([75], [76]).
To address the observed problems, a joint research program—the JÄPÄ Finnish De-icing Project—was established to conduct extensive laboratory and field investigations on this subject. The goal of JÄPÄ was to provide answers to three fundamental concerns—i.e., how the damage is generated, how to determine the compatibility between asphalt and deicing materials, and whether it is possible to prevent damage by mix design. The research showed that formate/acetate-based deicers significantly damaged asphalt pavements. The damaging mechanism seemed to be a combination of chemical reactions, emulsification and distillation, as well as generation of additional stress inside the asphalt mix. Asphalt binders soaked in the deicer solution were found to have lower softening points and tended to dissolve at temperatures as low as 20°C. Asphalt mixes soaked in the deicer solution were found to have lower surface tensile strength and lower adhesion ([75], [76]). It seemed clear that deicer (formate or acetate), water or moisture, and heat were necessary for the damage to occur. In the field, such damage mainly occurred during the repaving process or on hot summer days with residual deicers from the winter season, as dynamic loading and unloading reduced the time it took for damage to occur.
A recent study [77] at the Western Transportation Institute’s Corrosion and Sustainable Infrastructure Laboratory was able to reproduce acetate-induced
A-44
emulsification of asphalt similar to the field observations at Nordic airports. Aqueous solution tests of asphalt binder in water and four NaAc solutions of different concentrations (5% to 40%) showed a bilinear trend of weight loss increasing with the NaAc concentration. Both visual inspection and optical microscopy indicated that a significant amount of asphalt emulsification occurred in NaAc, but not in water or aqueous solutions of NaCl or NaOH with a pH of 9 (equivalent to the measured pH of 40% NaAc solution). For the two tested asphalt binders, PG 58-22 exhibited slightly higher emulsification than PG 67-22. In the CMA aqueous solution, asphalt emulsification occurred similarly to that in NaAc. These results confirmed that asphalt emulsification should be attributed to the acetate anion, CH3COOH-, and excluded the possibility that high alkalinity was responsible for the asphalt emulsification in NaAc. Asphalt emulsification also occurred in a NaFm aqueous solution.
The effects of NaAc on asphalt mixes were examined by conducting a modified ASTM D 3625-96 Boiling Water Test, which was originally designed to test the susceptibility of asphalt mixes to moisture damage by accelerating the effect of water on bituminous-coated aggregate with boiling water. Stripping occurred for both crushed gravel and limestone aggregate particles included in the asphalt mix exposed to NaAc, suggesting that aggregate properties play at most a secondary role in asphalt emulsification [77]. A significant amount of aggregate was stripped after exposure to the NaAc solutions and the aggregate stripping followed a bilinear tread with weight loss increasing with the NaAc concentration.
Phase I of the Airfield Asphalt Pavement Technology Program Project 05-03: Effect of Deicing Chemicals on HMA Airfield Pavements includes a literature review, interviews with managers at 36 airports that use deicers and have asphalt pavement, as well as laboratory testing. Seven airports indicated that pavement deterioration had occurred, but the cause was unknown except in one case most likely attributable to the type and source of asphalt binder and aggregate. Preliminary laboratory testing of asphalt pavement samples composed of either a chert gravel or diabase with two binders (PG 64-22 and PG 58-28) exposed to KAc and NaFm was conducted. The presence of PAHs was inconclusive after vacuum-induced saturated samples were stored for four days at 60°C. However, significant generation of carboxylate salts had developed after the asphalt mixes were exposed to the deicers, although this may not be related directly to deicer-induced damage. ITS tests showed PG 64-22 to be “somewhat more resistant” [78], and that chert gravel had significantly less strength when exposed to deicers compared to water. A long-term durability test developed by Advanced Asphalt Technologies also showed chert to be very susceptible to moisture damage, particularly when exposed to KAc or NaFm. Soundness tests of both types of aggregate in magnesium sulfate, KAc, and NaFm were acceptable and also showed that direct attack on the aggregate by the deicers was not occurring [78].
The JÄPÄ—Finnish De-icing Project studied the ingredient materials in asphalt pavement individually and the roles they played in the damaging mechanism were ranked accordingly [79]. The key test results of each ingredient material are as follows.
A-45
Effects of Formate/Acetate-Based Deicers on Aggregates
: The main reason for pavement damage was not due to poor quality of aggregates. Mineral aggregate might be a reason secondary to asphalt binders in pavement damage. The decomposition level of acidic aggregates was higher than for caustic aggregates, but was still acceptable. However attention should be paid to the weathering resistance of aggregates used in airfields to extend the lifespan of asphalt pavements.
Physical Effects of Formate/Acetate-Based Deicers on Bitumen/Asphalt
: 1) High density of deicer solution such as 1.34 kg/dm3 for the 50% (by weight) solution enabled the deicer to penetrate into bitumen by gravity. 2) Very low surface tension between deicer chemicals and asphalt facilitated stripping and emulsification of asphalt mixes. 3) Formate/acetate-based deicers had pH values usually between 9 and 11, and the higher the pH the more aggressive the deicer would be. 4) Formate/acetate-based deicers were very hygroscopic, which kept the road surface constantly wet and retained water inside the asphalt to overfill the air voids.
Chemical Effects of Formate/Acetate-Based Deicers on Bitumen/Asphalt
: When exposed to deicers, composition changes of bitumen/asphalt occurred in the hydrocarbon classification C10-C40. When exposed to deicers, large organic molecules, such as the PAHs, grew in bitumen. Deicers in asphalt were found in both the liquid and gas phases. PAHs in the asphalt samples could migrate and become dissolved in the deicer.
Failure Process of Asphalt Pavements
The preliminary research by Advanced Asphalt Technologies suggested the damaging mechanism was mainly a disruption of the asphalt–aggregate bond due to ASR. Expansive pressures typical of ASR-damaged concrete were not perceived to be the problem, but rather the bond disruption and increased susceptibility to moisture damage. Advanced Asphalt Technologies is currently working on Phase II, which includes more significant laboratory testing and field investigations [78].
: Deicers migrate into the asphalt after application onto pavements and saturate asphalt mixes during the winter. The deicer solution intrudes into asphalt due to gravity and for other unknown reasons, especially when asphalt temperature rises significantly (a result of summer weather or laying hot asphalt). Due to the low surface tension between deicers and bitumen, the deicers are absorbed in the bitumen, which, in turn, starts to emulsify. It is possible that the chemical composition of the bitumen changes during emulsification. Due to emulsification the bitumen comes loose and the aggregate particles get cleaned, followed by bleeding and stripping.
A-46
However, the research by Pan et al. at our research group [77] shows that: 1) asphalt emulsification occurs in asphalt mixes with both reactive and non-reactive aggregates, and 2) asphalt emulsification does not occur in NaOH solutions of the same pH values as the NaAc solution, which indicates that asphalt emulsification may be a more critical mechanism of asphalt mix deterioration than ASR unless very reactive aggregates are used in the asphalt mix. We proposed a detailed and specific mechanism of acetate-induced asphalt emulsification based on contact between acetate anions (CH3COOH-) and asphalt, which can be greatly increased at high summer and/or re-paving temperatures due to the tendency of asphalt to swell. For NaAc, aqueous solution tests of asphalt binder were performed at several concentrations and temperatures and the resulting suspended substance was examined using Fourier Transform Infrared Spectroscopy. No significant amounts of new chemicals were identified, and intermolecular binding between the acetate anion CH3COOH- and the alkane component of asphalt was inferred. van der Waals forces anchor the lipophilic organic chain (CH3–) of the acetate anion to the molecular chain of asphalt (CH3−CH2−). At the same time, the hydrophilic polar end (COO-) of the acetate anion forms hydrogen bonds with water molecules and pulls on the asphalt, overcoming the intermolecular forces within the asphalt. Asphalt emulsion is maintained by Brownian motion and repulsive forces on the floccules. The emulsification of asphalt reduces the asphalt–aggregate bond and can lead to adhesion failure in the pavement. There is also the potential that the aggregate preferentially bonds with the acetate anion, which has a higher polarity than the asphalt molecules [77].
To prevent or mitigate the effects of deicers on asphalt pavement, the first and most important countermeasure is to follow best possible practices in asphalt mix design and paving. Responses to an Airport Cooperative Research Program survey point towards adoption of some of these preventive measures: one European airport reduced asphalt pavement air void to 3.0%; another European airport indicated polymer-modified binder is used; and one U.S. airport changed the asphalt binder to PG 76-32 citing current Federal Aviation Administration specifications [54]. Nonetheless, the JÄPÄ Project research showed that the resistance of asphalt pavement to deicers can be improved only partially by mix design. According to the laboratory results, binders with high viscosity or polymer-modified binders were recommended when formate/acetate-based deicers were to be used. High-quality (sound) aggregates could also improve the durability of asphalt pavements in presence of such deicers, and so could aggregates with a higher pH. The void contents of the asphalt mixes were recommended to be kept low enough to limit deicer solution in pores. Other suggestions to prevent asphalt damage are summarized below [80]:
1. Prefer harder bitumen (penetration max 70/100) or modified bitumen.
2. Use alkaline aggregates and avoid limestone filler.
3. Test the compatibility of the materials in advance.
4. The most secure way is not to use acetates and formates on asphalt structures.
A-47
5. When repaving, the wearing course containing residual deicers must be milled away, and recycled asphalt pavement should not be used if it is heavily contaminated [81].
4. Conclusions
Deicers may pose detrimental effects on concrete infrastructure and thus reduce concrete integrity (as indicated by expansion, mass change and loss in the dynamic modulus of elasticity) and strength. Such risks of deicers on the durability of PCC structures and pavements exist through three main pathways: 1) physical deterioration of the concrete through such effects as salt scaling; 2) chemical reactions between deicers and cement paste (a cation-oriented process, especially in the presence of Mg2+ and Ca2+); and 3) deicers aggravating aggregate-cement reactions (including an anion-oriented process in the case of chlorides, acetates, and formates affecting ASR; and a cation-oriented process in the case of CaCl2 and MgCl2 affecting ACR). The use of proper air entrainment, high-quality cementitious materials and aggregates, and mineral admixtures is promising in mitigating the deicer impact on PCC.
The PCC pavement exposed to MgCl2 and CaCl2 deicers may deteriorate due to the chemical reactions between deicers and cement paste. In the case of MgCl2 deicers, Mg(OH)2 and M-S-H are the most predominant reaction products, formation of which eventually leads to the degradation of concrete. In the presence of CaCl2 deicers, PCC pavements deteriorate in a similar pattern to those exposed to MgCl2, although at a slower and less severe pace. CaCl2 can also react with Ca(OH)2 and form a hydrated calcium oxychloride and add additional stress to the concrete matrix.
Field applications of deicers onto PCC pavements and bridges have caused an increase in ASR occurrence. Extensive research suggests that NaCl can initiate and/or accelerate ASR by supplying additional alkalis to concrete. However, the deterioration of NaCl-based deicers on concrete structures by mechanism of ASR is heavily dependent on the thickness of concrete in PCC pavements and bridges. Formate/acetate-based deicers were also found to cause ASR distress in the surface of PCC pavement, by inducing high alkali solutions. CaCl2 and MgCl2 do not have as obvious an effect on ASR as NaCl.
Both MgCl2 and CaCl2 deicers are known to deteriorate concretes containing reactive dolomite aggregates by accelerating ACR, where brucite and portlandite crystals are precipitated and exert additional pressure in the concrete. MgCl2 contributes Mg2+ cations that can directly participate in the formation of brucite, whereas CaCl2 was found to accelerate ACR by enhancing the de-dolomitisation reactions, releasing magnesium to form brucite and M-S-H. No literature was found to report potential effects of NaCl on ACR.
Asphalt pavement is generally believed to be less affected by deicers, although a more severe loss of skid resistance on asphalt surfaces has been observed by state and federal highway agencies with the application of various road salts. Dense-graded pavement showed occasional faster clearing than open-graded pavements. The open-graded pavement, however, seemed to provide a superior skid-resistant surface during
A-48
most storms without more salt applied to maintain the surface. Thus, while their impact on skid resistance is still inconclusive, deicers are known to affect pavement structure and cause loss of strength and elasticity. Exposure to freeze/thaw cycles and deicers was found to affect the viscosity of the recovered asphalt binder and the gradation of recovered aggregates.
The extent of asphalt pavement damage due to freeze/thaw cycling in distilled water was less than that caused by any deicer used (urea, NaCl, NaFm, or KAc). A critical range of deicer concentration was found to exist between 1% and 2% by weight of solid deicer to deicer solution, in which the maximum damaging effect of deicers was observed for all types of deicer and aggregate. The limestone aggregates showed a higher resistance to disintegration than the quartzite aggregates when subjected to freeze/thaw cycles in presence of the deicers. The urea was found to have the highest damaging effect among all the deicers on both the aggregates and asphalt concrete samples.
Formate/acetate-based deicers were found to significantly damage asphalt pavements. The damaging mechanism seemed to be a combination of chemical reactions, emulsifications and distillations, as well as generation of additional stress inside the asphalt concrete. It seemed clear that deicers (formate or acetate), water or humidity, and heat were necessary for the damage to occur. Damage mainly occurred during the repaving process or in the long run in combination with hot summer days. Dynamic loading and unloading reduced the time it took for damage to occur.
5. References
[1] X. Shi, Fay, L., Yang, Z., Nguyen, T.A., and Liu, Y. “Corrosion of Deicers to Metals in Transportation Infrastructure: Introduction and Recent Developments”. Corrosion Reviews 2009, 27(1-2), 23-52.
[2] L. Sutter, K. Peterson, G. Julio-Betancourt, D. Hooton, T. Vam Dam, and K. Smith, The Deleterious Chemical Effects of Concentrated Deicing Solutions on Portland Cement Concrete. South Dakota Department of Transportation, Final Report SD2002-01-F, April 2008.
[3] X. Shi, L. Fay, M. M. Peterson, and Z. X. Yang, “Freeze-thaw Damage and Chemical Change of a Portland Cement Concrete In the Presence of Diluted Deicers”. Materials and Structures 2010, 43(7): 933-946. DOI: 10.1617/s11527-009-9557-0.
[4] D. Darwin, J. Browning, L. Gong, and S. R. Hughes, Effects of Deicers on Concrete Deterioration. Structural Engineering and Materials Laboratory, SL Report 07-3, University of Kansas, Dec. 2007.
[5] M. C. Santagata and M. Collepardi, “The effect of CMA deicers on concrete properties”. Cem. Concr. Res., vol. 30, pp.1389–1394, Sept. 2000
[6] M. C. Santagata and M. Collepardi, “Concrete deterioration caused by exposure to calcium-magnesium acetate aqueous solutions” in Proc. 2nd Int. Conf. On Concrete under Severe Conditions 2: Environment and Loading, N. Banthia, O. Gjorv, and K. Sakai, Eds, CONSEC’98, Troms, Norway, June 21–24, E&FN Spon, London, UK, 1998, pp. 543–554.
[7] O. Peterson, “Chemical effects on cement mortar of calcium magnesium acetate as a deicing salt”. Cem. Concr. Res., vol. 25, no. 3, pp.617-626, April 1995.
A-49
[8] ACI Committee 302, Guide for Concrete Floor and Slab Construction, ACI 302.1R-96, American Concrete Institute, Farmington Hills, Michigan, 1996.
[9] G. G. Litvan, “Phase transitions of adsorbates: VI, effect of deicing agents on the freezing of cement paste”. J. Amer. Ceramic Soc., vol. 58, no. 1-2, pp.26-30, Jan. 1975.
[10] C. Korhonen, Effect of High Doses of Chemical Admixtures on the Freeze-Thaw Durability of Portland Cement Concrete. U.S. Army Corps of Engineers, Engineering Research and Development Center. ERDC/CRREL TR-02-5, Feb. 2002.
[11] J. Marchand, E. J. Sellevod, and M. Pigeon, “The deicer salt scaling deterioration of concrete—an overview”, Presented at the Third CANMET/ACI International Conference on Durability of Concrete, Nice, France, 1994.
[12] M. Pigeon and R. Pleau, Durability of Concrete in Cold Climates. New York, NY: E and FN Spon, 1995.
[13] Transportation Association of Canada, Syntheses of Best Practices — Road Salt Management. Sept. 2003. [Online]. Available: http://www.tac-atc.ca/english/informationservices/readingroom.cfm#syntheses [Last Accessed November 17, 2008].
[14] B. T. Mussato, O. K. Gepraegs, and G. Farnden, “Relative effects of sodium chloride and magnesium chloride on reinforced concrete—the state of art” in Compendium of Papers CD for the Transportation Research Board 83rd Annual Meeting, Washington, D.C. Jan. 2004.
[15] D. B. McDonald and W. F. Perenchio, “Effects of salt type on concrete scaling”, Concrete Intl., vol. 19, no. 7, pp.23-26, July 1997.
[16] K. Wang, D. E. Nelsen, and W. A. Nixon. “Damaging effects of deicing chemicals on concrete materials”, Cement Concrete Comp., vol. 28, no. 2, pp.173-188, Feb. 2006.
[17] A. Al-Otoom, A. Al-Khlaifa, and A. Shawaqfeh, “Crystallization technology for reducing water permeability into concrete”, Ind. Eng. Chem. Res., vol. 46, no. 16, pp.5463–5467, Aug. 2007
[18] D. Williams, Past and current practices of winter maintenance at the Montana Department of Transportation. White Paper, Dec. 2003. [Online]. Available http://www.mdt.mt.gov/publications/docs/brochures/winter_maint/wintmaint_whitepaper.pdf [Last Accessed November 17, 2008].
[19] C. Öttl, “Frost/deicing salt resistance of concrete pavements with unsuitable air void characteristics”, Otto Graf J., vol. 17, pp.45-55, 2006. [Online] Available: http://www.mpa.uni-stuttgart.de/publikationen/otto_graf_journal/ogj_2006/beitrag_oettl.pdf. [Last Accessed Nov. 17, 2008].
[20] J. Marchand, J. Maltais, Y. Marchabée, C. Tablot, and M. Pigeon, "Effects of fly ash on microstructure and deicer salt scaling of concrete" in Frost Resistance of Concrete: Proceedings of the International RILEM Workshop. M. J. Setzer and R. Auberg, Eds. E & FN SPON. Essen, Germany, 1997.
[21] T. Naik, R. Kraus, B. Ramme, and Y. Chun, "Deicing salt-scaling resistance: laboratory and field evaluation of concrete containing up to 70% Class C and Class F fly ash". J. ASTM Intl., vol. 2, no. 7, 12pp, July/Aug, 2005.
A-50
[22] Yang, Q., S. Zhang, and X. Wu, “Deicer-scaling resistance of phosphate cement-based bind for rapid repair of concrete”. Cem. Concr. Res., vol. 32, no. 1, pp.165-168, Jan. 2002.
[23] J. M. Pitt, M. C. Schluter, D. Y. Lee, and W. Dubberke, Effects of Deicing Salt Trace Compounds on Deterioration of Portland Cement Concrete, Final Report, Iowa Department of Transportation and Iowa Highway Research Board, Jan. 1987.
[24] R. D. Cody, P. G. Spry, A. M. Cody, and G.-L. Gan, The Role of Magnesium in Concrete Deterioration. The Iowa Highway Research Board, Final Report—Iowa DOT HR-355, 1994.
[25] R. D. Cody, A. M. Cody, P. G. Spry, and G.-L. Gan, “Experimental deterioration of highway concrete by chloride deicing salts”. Environ. Eng. Geosci., vol. 2, no. 4, pp.575–588, Nov. 1996.
[26] J. Deja and G. Loj, “Effects of cations occurring in the chloride solutions on the corrosion resistance of slag cementitious materials”, presented at Infrastructure Regeneration and Rehabilitation Improving the Quality of Life through Better Construction—A Vision for the Next Millennium, Sheffield, 1999.
[27] H. Lee, R. D. Cody, A. M. Cody, and P. G. Spry, “Effects of various deicing chemicals on pavement concrete deterioration”, in Proceedings Mid-Continent Transportation Symposium, 2000.
[28] T. M. Balasubramanian, S. Srinivasan, K. Balakrishnan, and K. Saravanan, “Deterioration of concrete in industrial environments”, presented at 10th International Congress on Metallic Corrosion, Madras, India, 1987.
[29] A. M. Cody, R. D. Cody, H. Lee, and P. G. Spry, Expansive Mineral Growth and Concrete Deterioration, Iowa State University, Ames, Final Report, Iowa DT HR-384, Sept. 1997.
[30] A. M. Cody, R. D. Cody, H. Lee, and P. G. Spry, “PCC pavement deterioration and expansive mineral growth”, presented at Crossroads 2000, Ames, Iowa, 1998.
[31] M. Moukwa, “Characteristics of the attack of cement paste by MgSO4 and MgCl2 from pore structure measurements”, Cem. Concr. Res., vol. 20, no. 1, pp.148–158, Jan. 1990.
[32] I. M. Helmy, A. A. Amer, and H. El-Didamony, “Chemical attack on hardened pastes of blended cements—Part 1: attack of chloride solutions”, Zement-Kalk-Gips., vol. 44, no. 1, pp.46–50, 1991.
[33] L. D. Wakeley, T. S. Poole, C. A. Weiss, and J. P. Burkes, “Geochemical stability of cement-based composites in magnesium brines”, in Proceedings of the 14th International Conference on Cement Microscopy, Costa Mesa, CA, 1992.
[34] V. W. Rechenberg and H.-M. Sylla, “The effect of magnesium on concrete”, ZKG International, vol. 49, no. 1, pp. 44–56, 1996.
[35] L. Sutter, K. Peterson, S. Touton, T. Van Dam, D. Johnston, “Petrographic evidence of calcium oxychloride formation in mortars exposed to magnesium chloride solution”. Cem. Concr. Res., vol. 36, no. 8, pp.1533–1541, Aug. 2006.
[36] W. Kurdowski, “The protective layer and decalcification of C-S-H in the mechanism of chloride corrosion of cement paste”, Cem. Concr. Res., vol. 34, no. 9, pp.1555-1559, Sept., 2004.
[37] S. Monosi and M. Collepardi, "Research on 3CaO•CaCl2•15H2O identified in concretes damaged by CaCl2 attack”. Il Cemento, vol. 87, pp.3-8, Jan/March, 1990.
A-51
[38] L. Sutter, T. Van Dam and K. R. Peterson, “ Long term effects of magnesium chloride and other concentrated salt solutions on pavement and structural Portland cement concrete—phase I results”, in Compendium of Papers CD for the Transportation Research Board 85th Annual Meeting, Washington, D.C, Jan. 2006.
[39] T. E. Stanton, “Expansion of concrete through reactions between cement and aggregate”, in Proceedings of American Society of Civil Engineers, Vol. 66, 1940, pp.1781–1811.
[40] S. Chatterji, N. Thaulow, A. D. Jensen, “Studies of ASR: Part IV: effect of different alkali salt solutions on expansion”, Cem. Concr. Res., vol. 17, no. 5, pp. 777–783, Sept. 1987.
[41] M. Kawamura, K. Takemoto, and M. Ichise, “Influences of the alkali–silica reaction on the corrosion of steel reinforcement in concrete”, in Proceedings of the 8th International Conference on AAR, Society of Materials Sciences, Kyoto, Japan, 1989, pp.115–120.
[42] P. J. Nixon, C. L. Page, I. Canham, R. Bollinghaus, “Influence of sodium chloride on the ASR”, Adv. Cem. Res., vol. 1, pp.99-105, 1988.
[43] R. G. Sibbick, “The susceptibility of various UK aggregates to alkali–silica reaction”, Ph.D. thesis, Aston University, Birmingham, UK, 1993.
[44] M. Kawamura, K. Takeuchi, A. Sugiyama, “Mechanisms of expansion of mortars containing reactive aggregates in NaCl solution”, Cem. Concr. Res., vol. 24, no. 4, pp.621–632, 1994.
[45] M. Kawamura and K. Takeuchi, “Alkali–silica and pore solution composition in mortars in sea water”, Cem. Concr. Res., vol. 26, no. 12, pp.1809–1819, Dec. 1996.
[46] R. G. Sibbick and C. L. Page, “Effects of sodium chloride on the alkali–silica reaction in hardened concretes”, in Proceedings of the 10th International Conference on AAR, Melbourne, Australia, 1996, pp. 822–829.
[47] S. Diamond, “Alkali reactions in concrete-pore solution effects” in Proceedings of the 6th International Conference on AAR, Copenhagen, Denmark, Steen Rostam, 1983, pp. 155–167.
[48] M. Kawamura and M. Igarashi, “Characteristics of ASR in presence of sodium and calcium chloride”, Cem. Concr. Res., vol. 20, no. 5, pp.757–766, Sept. 1990.
[49] M.-A. Be´rube´ and J. Frenette, “Testing concrete for AAR in NaOH and NaCl solutions at 38 °C and 80 °C”, Cement Concrete Comp., vol. 16, no. 3, pp.189–198, 1994.
[50] J. Duchesne and M.-A. Be´rube´. “Effect of deicing salt and sea water on ASR: new considerations based on experimental data” in Proceedings of the 10th International Conference on AAR, Melbourne, Australia, 1996, pp. 19-23.
[51] J. M. Vernon and W. G. Dubberke, “A different perspective for investigation of Portland cement concrete pavement deterioration”, Transport. Res. Rec., vol. 1525, pp.91-96, 1996.
[52] M. Prezzi, P. J. M. Monteiro, and G. Sposito, “Alkali-silica reaction; Part 2: the effect of chemical additives”, ACI Mat. J., vol. 95, no. 1, pp.3-10, Jan. 1998.
[53] K. E. Kurtis and P. J. M. Monteiro, “Chemical additives to control expansion of alkali-silica reaction gel: proposed mechanisms of control”, J. Mat. Science, vol. 38, no. 9, pp.2027-2036, May 2003.
A-52
[54] X. Shi, Impact of Airport Pavement Deicing Products on Aircraft and Airfield Infrastructure. ACRP Synthesis 6, Final Report. Airport Cooperative Research Program, Transportation Research Board, National Academies, Washington, D.C., April 2008. http://onlinepubs.trb.org/onlinepubs/acrp/acrp_syn_006.pdf last accessed in December 2009.
[55] P. R. Rangaraju, K. R. Sompura, J. Olek, S. Diamond, J. Lovell, “Potential for development of alkali-silica reaction in presence of airfield deicing chemicals”, in Proceedings of the 8th International Conference on Concrete Pavements, Colorado Springs, Aug. 14–18, 2005.
[56] P. R. Rangaraju, K. R. Sompura and J. Olek, “Investigation into potential of alkali-acetate based deicers in causing alkali-silica reaction” in Compendium of Papers CD for the Transportation Research Board 85th Annual Meeting, Washington, D.C. Jan. 2006.
[57] P. R. Rangaraju and J. Desai, “Effectiveness of selected SCMs in mitigating ASR in presence of potassium acetate deicer solution” in Compendium of Papers CD for the Transportation Research Board 85th Annual Meeting, Washington, D.C. Jan. 2006.
[58] P. R. Rangaraju and J. Olek. Potential for Acceleration of ASR in the Presence of Pavement Deicing Chemicals. Innovative Pavement Research Foundation, Final Report IPFR-01-G-002-03-9, Airport Concrete Pavement Technology Program, Skokie, IL; March 2007.
[59] P. R. Rangaraju, “Influence of Airfield Pavement Deicing and Anti-icing Chemicals on Durability of Concrete” in Proceedings 2007 FAA Worldwide Airport Technology Transfer Conference, Atlantic City, New Jersey, USA. April 2007.
[60] K. J. Folliard, M. D. A. Thomas and K. E. Kurtis, Guidelines for the Use of Lithium to Mitigate or Prevent ASR. FHWA Final Report FHWA-RD-03-047, July 2003.
[61] P. R. Rangaraju, K. Sompura, J. Desai, and J. Olek, “Potential of potassium acetate deicer to induce ASR in concrete, and its mitigation”, in Proceedings of Airfield and Highway Pavements 2006 Specialty Conference, I. L. Al-Qadi, Ed, 2006, pp.683-694.
[62] P. R. Rangaraju, Mitigation of ASR in Presence of Pavement Deicing Chemicals. Innovative Pavement Research Foundation Final Report IPRF-01-G-002-04-8, April 2007.
[63] Federal Highway Administration (FHWA) Manual of Practice for Effective Anti-icing Program: A Guide for Highway Winter Maintenance Personnel. Report No. FHWA-RD-95–202. McLean, Va. 1996.
[64] W. C. Besselievre, Deicing Chemical Rates on Open-Graded Pavements. Snow Removal and Ice Control Research. TRB Special Report 185. Transportation Research Board, Washington, DC., 1979.
[65] P. S. Kandhal and R.B. Mallick, “Open-Graded Friction Course: State of the Practice” Transportation Research Circular. Number E-C005, Dec. 1998.
[66] G. V. Heystraeten and R. Diericx, “A rapid and effective de-icing agent for open- graded road surfacings” in Proceedings of the XIth PIARC International Winter Road Congress, Sapporo, Japan, 2002.
A-53
[67] H. Iwata, T. Watanabe, and T. Saito, “Study on the performance of porous asphalt pavement in winter road surface conditions” in Proceedings of the XIth PIARC International Winter Road Congress, Sapporo, Japan, 2002.
[68] G. W. Flintsch, Assessment of the performance of several roadway mixes under rain, snow, and winter maintenance activities. Final Report No. VTRC 04-CR18., Virginia Transportation Research Council. Charlottesville, VA., Feb. 2004.
[69] F. C. Martinez, Evaluation of Deicer Applications on Open-Graded Pavements. Final Report, SPR 616, Oregon Department of Transportation, 2006.
[70] G. Doré, J.-M. Konrad, and M. Roy, "Role of deicing salt in pavement deterioration by frost action" Transport. Res. Rec., vol. 1596, pp.70-75, 1997.
[71] Y. Hassan, A. O. Abd El Halim, A. G. Razaqpur, and M. Farha, “Laboratory investigation of effect of deicing chemicals on airfield asphalt concrete pavements materials” in Proceedings 2nd International Conference on Engineering Materials, San Jose, California, Aug. 16–19, 2001, Vol. I, pp. 299–308.
[72] Y. Hassan, A. O. Abd El Halim, A. G. Razaqpur, W. Bekheet and M. Farha, “Effects of runway deicers on pavement materials and mixes: comparison with road salt”, J. Transp. Engrg. vol. 128, no. 4, pp. 385-391, July/Aug 2002.
[73] J. R. McCutchon, A. P. Joseph, and J. Van Valkenburg, “Assessment of the effect of urea deicing solution on asphaltic concrete pavements”. Project No. 999821, Public Works and Government Services Canada. Hull, Canada, 1992.
[74] M. H. Farha, Y. Hassan, A. O. Abd El Halim, A. G. Razaqpur, A. El-Desouky, and A. Mostafa, “Effects of new deicing alternatives on airfield asphalt concrete pavements” presented at the 2002 Federal Aviation Administration Technology Transfer Conference, January 2002.
[75] F. Nilsson, “Durability problems on Nordic airfields—the influence of deicing agents on asphalt concrete“ in Proceedings of the XXIInd PIARC World Road Congress, 2003.
[76] Seminar on the Effects of De-Icing Chemicals on Asphalt, Helsinki, Finland, March 2006.
[77] T. Pan, X. He, and X. Shi, “Laboratory investigation of acetate-based deicing/anti-icing agents deteriorating airfield asphalt concrete”. J. Assoc. Asphalt Pav. Tech., 2008, 77, 773-793.
[78] Advanced Asphalt Technologies, LLC. “Phase II plans with summary of phase I results”, Interim Report, Airfield Asphalt Pavement Technology Program Project 05-03: Effect of Deicing Chemicals on HMA Airfield Pavements, May 2, 2007.
[79] V. Alatyppö, Conclusions—Finnish Deicing Project, Helsinki University of Technology, Laboratory of Highway Engineering, 2005.
[80] J. Valtonen, “JAPA: the Finnish de-icing project” presentation at the Seminar on the Effects of De-Icing Chemicals on Asphalt, Helsinki, Finland, March 14, 2006.
[81] V. Alatyppö and J. Valtonen, “Experiences on the effects of de-icing chemicals on bituminous airfield runways in Finland” in Proceedings of the 2007 FAA Worldwide Airport Technology Transfer Conference, Atlantic City, New Jersey, April 16–18, 2007.
A-54
APPENDIX C. Corrosion of Deicers to Metals in Transportation Infrastructure: Introduction and Recent Developments
Published as: Shi, X., Fay, L., Yang, Z., Nguyen, T.A., and Liu, Y. Corrosion of Deicers to Metals in Transportation Infrastructure: Introduction and Recent Developments. Corrosion Reviews 2009, 27(1-2), 23-52. With some references updated herein.
Abstract:
1. Introduction
Chemicals used in the snow and ice control operations (also known as deicers) may cause corrosion damage to the transportation infrastructure such as reinforced or pre-stressed concrete structures and steel bridges. This review presents a synthesis of information regarding the impacts of both chloride-based and acetate/formate-based deicers on metals especially steel rebar in concrete, common test methods to quantify such impacts, and countermeasures to manage such impacts. There are many ways to manage the corrosive effects of deicers, such as: selection of high-quality concrete, adequate concrete cover and alternative reinforcement, control of the ingress and accumulation of deleterious species, injection of beneficial species into concrete, and use of non-corrosive deicer alternatives and optimal application rates.
Large amounts of solid and liquid chemicals (known as deicers) as well as abrasives are applied onto winter highways to keep them clear of ice and snow. Deicers applied onto highways often contain chlorides because of their cost-effectiveness, including mainly sodium chloride (NaCl), magnesium chloride (MgCl2), and calcium chloride (CaCl2), sometimes blended with proprietary corrosion inhibitors. A recent survey of highway maintenance agencies conducted by our group indicated that NaCl was the most frequently used deicer, followed by abrasives, then MgCl2, agriculturally based products, CaCl2, and others. Less than 25% of the survey respondents used alternative deicers such as potassium acetate (KAc), sodium acetate (NaAc), calcium magnesium acetate (CMA), and potassium formate /1/.
In 2007 the U.S. sold approximately 20.2 million tons of deicing salts for use in winter maintenance /2/. The growing use of deicers has raised concerns over their effects on motor vehicles, transportation infrastructure, and the environment /3-6/. Motorists and trucking associations have become wary of deicers on their vehicles, as the vehicular corrosion (even though generally cosmetic) has been documented. On average, the deicer corrosion to each vehicle was estimated to cost $32 per year /5/. Furthermore, chemicals may cause corrosion damage to the transportation infrastructure such as reinforced or pre-stressed concrete structures and steel bridges /4/. The deleterious effect of deicing salts on reinforcing steel bar (rebar) in concrete structures is well known /7-9/. A recent study conducted for the U.S. National Cooperative Highway Research Program (NCHRP) identified the deicer corrosion to steel rebar as the primary concern, followed by detrimental effects to vehicles, concrete in general, structural steel, and roadside structures /10/.
Deicers may also pose detrimental effects on concrete infrastructure through their reactions with the cement paste and thus reduce concrete integrity and strength, which in
A-55
turn may foster the ingress of moisture, oxygen and other aggressive agents onto the rebar surface and promote the rebar corrosion. The long-term use of NaCl can initiate and/or accelerate alkali-silica reaction (ASR) by supplying additional alkalis to concrete /11-17/, whereas CaCl2 and MgCl2 do not have as obvious an effect on ASR as NaCl. Numerous research studies have shown that MgCl2, when used as a deicer, causes much more severe deterioration to concrete than NaCl or CaCl2. This is due to the reaction between Mg2+ and the hydrated products in cement paste /18-22/, which has been reported to be responsible for the degradation of concrete matrix caused by MgCl2 and CMA /10/. It has also been found that concrete exposed to CaCl2 deteriorated in a similar pattern to those exposed to MgCl2, although at a slower and less severe pace /23/. Both MgCl2 and CaCl2 deicers are known to deteriorate concretes containing reactive dolomite aggregates by accelerating the alkali-carbonate reaction /19-20/. Recent research has found that the acetate/formate deicers could induce increased levels of expansion in concrete with ASR-susceptible aggregates, and could trigger ASR in concrete that previously did not show ASR susceptibility /24-26/.
When using chloride-based deicers for snow and ice control, the average cost due to corrosion and environmental effects are estimated at three times as high as the nominal cost /27/. One study has estimated that the use of road salts imposes infrastructure corrosion costs of at least $615 per ton, vehicular corrosion costs of at least $113 per ton, aesthetic costs of $75 per ton if applied near environmentally sensitive areas, in addition to uncertain human health costs /28/. The estimated cost of installing corrosion protection measures in new bridges and repairing old bridges in the Snowbelt states is between $250 million and $650 million annually /29/. Parking garages, pavements, roadside hardware, and non-highway objects near winter maintenance activities are also exposed to the corrosive effects of road salts. It should be noted that any repairs to the infrastructure translate to costs to the user in terms of construction costs, traffic delays and lost productivity. Indirect costs are estimated to be greater than ten times the cost of corrosion maintenance, repair and rehabilitation /30/.
This review paper presents a synthesis of information regarding the corrosion of common deicers to metals in transportation infrastructure, with a focus on steel rebar in concrete structures. The following section documents the corrosion impacts that NaCl, CaCl2 and MgCl2 have on metals compared with those of alternative deicers, which is followed by discussions of methods to quantify and manage deicer impacts to metals.
2. Deicer Impacts on Metals
2.1 Chloride-Based Deicer Impacts on Steel Rebar
Chloride ingress, either from marine environments or from chloride-based deicers, is one of the primary forms of environmental attack for reinforced concrete structures /31-32/, which leads to rebar corrosion and a subsequent reduction in the strength, serviceability, and aesthetics of the structure. The chloride permeability of concrete is thus considered a critical intrinsic property of the concrete /33/. The remediation of concrete bridges in the U.S., undertaken as a direct result of chloride-induced rebar corrosion, would cost the U.S. highway departments $5 billion per year /34/. Premature
A-56
deterioration of bridge decks, as well as the contamination of parking garages due to the application of deicing salts has been reported /29/.
In addition to the chloride-induced rebar corrosion, chloride-based deicers can exacerbate the scaling problem and freeze-thaw damage of concrete. The use of properly cured, air-entrained Portland cement concrete, however, can prevent such physical deterioration of concrete. Otherwise, in cold-climate regions, the synergy of freeze-thaw cycles and rebar corrosion may lead to problems against reinforced concrete structures, with serious economic and safety implications.
2.1.1 Mechanism for Chloride-Induced Corrosion of Steel Rebar
Concrete normally provides both chemical and physical protection for the embedded steel reinforcement. The cement hydration leads to the high alkalinity (pH 13-14) of concrete pore solution, which promotes the formation of an approximately 10-nm thick oxide/hydroxide film at the steel surface /35/. This protective passive film effectively insulates the steel and electrolytes so that the corrosion rate of steel is negligible. The concrete cover also prevents or at least retards the ingress of aggressive substances toward the rebar surface.
Localized corrosion of rebar may occur when water and oxygen are available at the steel surface and the passive film is jeopardized by a decrease in the pH of concrete pore solution and/or by the presence of enough water-soluble (free) chloride ions /9/. Chloride-induced corrosion of steel rebar generally proceeds in the following steps /36-39/:
A. Ingress of chloride into the concrete to a point where a threshold chloride concentration is reached at the embedded reinforcement depth.
Corrosive agents (e.g., deicer solution) may penetrate through the concrete via capillary absorption, hydrostatic pressure, or diffusion. The ingress of gases, water or ions dissolved in aqueous solutions into concrete takes place through pore spaces in the cement paste, at the cement paste-aggregate interfaces or through micro-cracks. For the durability of concrete, permeability is believed to be the most important characteristic /40/, which is related to its micro-structural properties, such as the size, distribution, and interconnection of pores and micro-cracks /41/.
It is generally believed that only the free chlorides can promote pitting corrosion, while the bound chlorides such as those adsorbed on C-S-H (calcium silicate hydrate) or chemically bound with concrete C3A (tricalcium aluminate) or C4AF phases (e.g., Friedel’s salt, 3CaO•Al2O3•CaCl2•10H2O) do not. However, a recent study suggests that bound chlorides also play a role in corrosion initiation, as a large part of them is released as soon as the pH drops to values below 12/42/. The concentration ratio of free chloride to total chloride in concrete may range from 0.35 to 0.90, depending on the constituents and history of the concrete /43/.
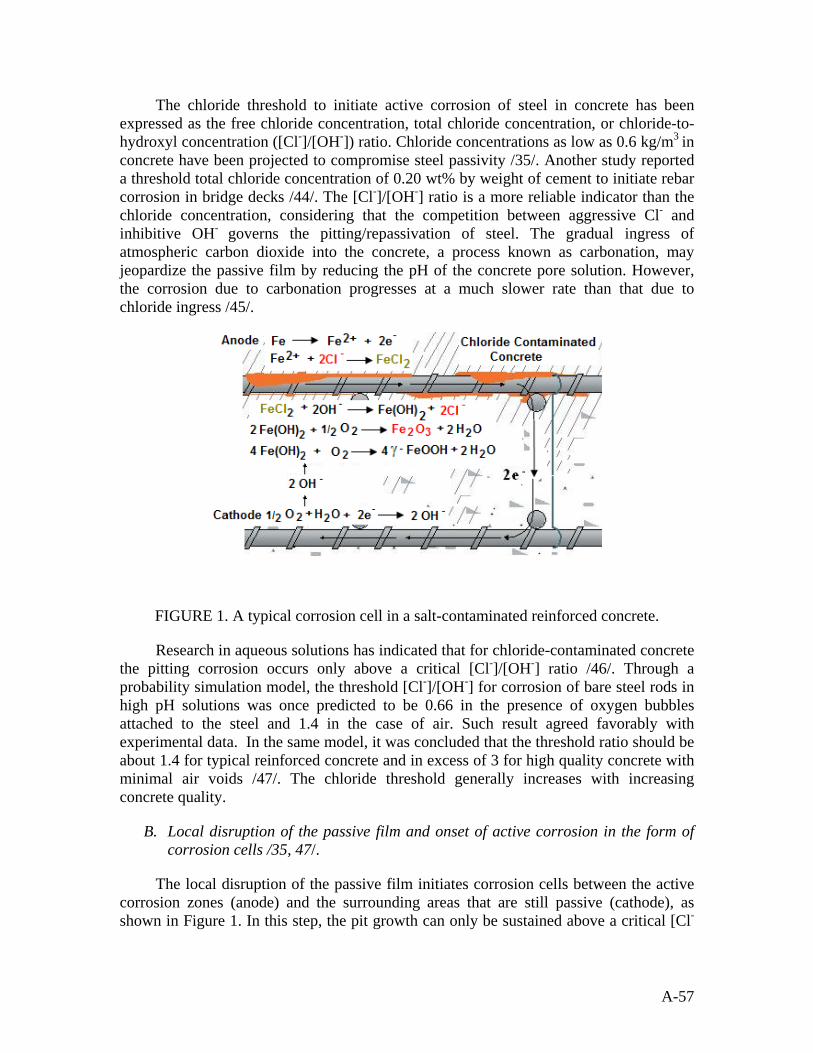
A-57
The chloride threshold to initiate active corrosion of steel in concrete has been expressed as the free chloride concentration, total chloride concentration, or chloride-to-hydroxyl concentration ([Cl-]/[OH-]) ratio. Chloride concentrations as low as 0.6 kg/m3 in concrete have been projected to compromise steel passivity /35/. Another study reported a threshold total chloride concentration of 0.20 wt% by weight of cement to initiate rebar corrosion in bridge decks /44/. The [Cl-]/[OH-] ratio is a more reliable indicator than the chloride concentration, considering that the competition between aggressive Cl- and inhibitive OH- governs the pitting/repassivation of steel. The gradual ingress of atmospheric carbon dioxide into the concrete, a process known as carbonation, may jeopardize the passive film by reducing the pH of the concrete pore solution. However, the corrosion due to carbonation progresses at a much slower rate than that due to chloride ingress /45/.
FIGURE 1. A typical corrosion cell in a salt-contaminated reinforced concrete.
Research in aqueous solutions has indicated that for chloride-contaminated concrete the pitting corrosion occurs only above a critical [Cl-]/[OH-] ratio /46/. Through a probability simulation model, the threshold [Cl-]/[OH-] for corrosion of bare steel rods in high pH solutions was once predicted to be 0.66 in the presence of oxygen bubbles attached to the steel and 1.4 in the case of air. Such result agreed favorably with experimental data. In the same model, it was concluded that the threshold ratio should be about 1.4 for typical reinforced concrete and in excess of 3 for high quality concrete with minimal air voids /47/. The chloride threshold generally increases with increasing concrete quality.
B. Local disruption of the passive film and onset of active corrosion in the form of corrosion cells /35, 47/.
The local disruption of the passive film initiates corrosion cells between the active corrosion zones (anode) and the surrounding areas that are still passive (cathode), as shown in Figure 1. In this step, the pit growth can only be sustained above a critical [Cl-
A-58
]/[OH-] ratio, or the rebar surface will be re-passivated by forming an iron oxide/hydroxide layer /48/.
As implied in the cathodic and anodic reactions above, aside from pH, temperature and oxygen content play important roles in rebar corrosion. Corrosion of reinforcing steel was found to vary with oxygen contents and temperatures of the corrosion-inhibitor-added deicing salt and salt substitute solutions /49/. Oxygen contents in solutions under the control condition decreased as the amount of deicers increased. The reinforcing steels under the freeze-thaw cycle condition showed the least corrosion, whereas those under the dry-wet cycle condition showed the most severe corrosion /49/.
C. Accumulation of solid corrosion products (oxides/hydroxides) in the concrete pore space near the rebar surface and buildup of tensile hoop stresses around the rebar /50/.
D. Cracking or spalling of the concrete covering the reinforcement.
As a result of this step, moisture, oxygen, and chlorides can gain more direct access to the embedded steel, leaving it more vulnerable to environmental conditions. Therefore, the corrosion rate may be further accelerated /51/.
2.1.2 Comparing Chloride-Based Deicers in Terms of Rebar Corrosion
For practical purposes, all chloride-based deicers were ranked equally high in causing corrosion of the reinforcing steel in a recent NCHRP study, even though hygroscopic chlorides of magnesium and calcium can be more aggressive to the exposed metals than NaCl because of the longer time of wetness /10/. One laboratory study evaluated the corrosivity of various 3% deicer solutions by intermittently spraying them on carbon steel coupons at room temperature and found that the relative order of deicer corrosivity was as follows from the highest to the lowest: CaCl2, MgCl2, NaCl, NaCl with a corrosion inhibitor, MgCl2 with another corrosion inhibitor, CMA, and H2O /52/.
A study using simulated concrete pore solutions indicated that the corrosion behavior of galvanized steel in the presence of chlorides was controlled by the pH value of the electrolyte, which varies with the cation associated with the chloride anion /53/. MgCl2-based deicers applied onto concrete could reduce the pore solution pH (from 12.6 to 9.0 for saturated solutions) by replacing Ca(OH)2 with Mg(OH)2, which could result in the loss of iron oxide layer at the rebar surface even in the absence of chloride ions /54/. Therefore, MgCl2 decreases the threshold chloride level to initiate corrosion and promotes the rebar corrosion /55,56/.
The cation (Na+, Ca2+, or Mg2+) associated with Cl- also affects the chloride diffusion coefficient /20/ and the ranking of diffusion coefficients seem to be independent of the salt concentrations used /10/. In one laboratory study /20/, the chloride diffusion coefficient in Ordinary Portland Cement (OPC) mortar (water-to-cement ratio, w/c=0.5) was measured at 9.1, 22.9, and 29.0 × 10⁻¹² m2/s respectively for NaCl, CaCl2 and MgCl2 at saturated concentrations. In another laboratory study of much more dilute salt solutions /57/, the chloride diffusion coefficient in OPC paste (w/c not specified) was measured at
A-59
6.6, 9.9, and 20.8 × 10⁻¹² m2/s respectively for NaCl, CaCl2 and MgCl2 at 0.5 M concentration. The chloride diffusion coefficients for MgCl2
are typically two to three times greater than NaCl /20,56,57/, which may significantly reduce the time-to-corrosion-initiation for the rebar in concrete. The effective diffusion coefficient of CaCl2 was found to fall between that of NaCl and MgCl2 /20, 57/. It should be noted that temperature variations have a significant impact on diffusion coefficients and the related transport process, as indicated by a pioneering study by Page et al. /58/. More recent studies by others /59-63/ on concrete or mortar with various w/c ratios suggest that the chloride diffusion coefficient tends to increase with temperature and with w/c values and is also affected by the type of cement used.
2.2 Acetate/Formate-Based Deicer Impacts on Metals
A questionnaire of U.S. airports in 2006 indicated that KAc and sand were most widely used at U.S. airports for snow and ice control of airfield pavements, followed by airside urea, NaAc, sodium formate, propylene glycol-based fluids, ethylene glycol-based fluids, etc. /64/. Acetate-based deicers (KAc, NaAc, and CMA) have also been used on some winter roadways as non-corrosive alternatives to chlorides.
Acetate/formate-based deicers are widely used on airport pavements because they were considered non-corrosive deicer alternatives to chlorides, despite their possible role in accelerating corrosion via some increase in the electrolyte conductivity /10/. It was found that changing from NaCl to an acetate deicer decreased the corrosion rate of steel rebar in a simulated concrete pore solution by more than a factor of ten /65/. Recently, however, potassium formate was reported to cause serious corrosion to landing gear and associated wiring of some Boeing airplane models and the corrosion risk of acetate/formate-based deicers to cadmium-plated steel has raised concerns by aircraft manufacturers and airlines /64/. A recent study in our laboratory revealed that while NaAc- or KAc-based deicers were non-corrosive to mild steel, they were comparably corrosive as chloride-based deicers to galvanized steel /2/.
CMA is generally considered to be less corrosive to metals than NaCl /29/, even though this consensus is mostly based on existing laboratory studies involving the direct exposure of rebar or steel coupons to CMA solutions, which may not represent the case where the rebar is embedded in concrete /10/. Electrochemical and weight loss tests of 14-17 month duration indicated that bridge structural metals, including steel, cast iron, aluminum, and galvanized steel corroded considerably less in CMA solutions than in NaCl solutions /66/. Full and half immersion, vapor space, sprays, and dip testing of ASTM A-36, A-325, and A-588 steel, gray cast iron, and aluminum indicated that CMA solutions were less corrosive to all the metals tested than NaCl solutions /67/. However, similar to NaCl, CMA caused a substantial shift of the potential of steel in mortar, simulated pore solutions, and concrete slabs, indicating the increased risk for steel corrosion /67/. This may be attributed to the fact that CMA reduced the pH of simulated pore solutions, by precipitating OH- ions as Ca(OH)2 and Mg(OH)2 /67/. It is noteworthy that in another study, the steel embedded in concrete ponded with CMA solutions did not show any significant potential shifts or corrosion whereas the steel embedded in concrete ponded with NaCl solution did /68/. In CMA solutions of 2 wt.% and higher, reverse
A-60
polarization scans indicated an unusual electrochemical behavior occurred with three current reversals. It is proposed that carbon dioxide is formed as a consequence of an electrochemical reaction involving the acetate ion. The carbon dioxide then dissolved in the solution, leading to the precipitation of insoluble carbonates at cathodic sites on the steel surface /69/.
Currently there are conflicting data as to whether CMA can be used as an effective corrosion inhibitor for chloride-induced corrosion of reinforcing steel. The ASTM G 109 ponding test results suggested that CMA as an additive to NaCl (in a ratio of 1 to 2) did not inhibit the rebar corrosion in concrete /70/. One study confirmed that sodium acetate, urea and CMA were only marginally effective as corrosion inhibitors for rebar in concrete, by examining the electrochemical behavior of iron in cured cement pastes /71/. In contrast, another study indicated that adding CMA to a steel-concrete system undergoing active chloride-induced corrosion slowed corrosion after 30 days and stopped corrosion after 60 days /72/. Compared with salt solution made with pure NaCl, a solution made with 20/80 NaCl/CMA mixture (w/w) was 45 percent less corrosive to steel /73/. The impedance and voltammetric measurements confirmed that adding CMA to a simulated pore solution diminished the corrosion rate and increased the protectiveness of surface films /74/.
3. Quantification of Deicer Impacts to Metals
3.1 Common Test Methods of Deicer Corrosivity
The following sections describe common methods for testing deicer corrosivity. Other test methods such as ASTM B117 are not included since they are rarely used for the evaluation or quality assurance of deicer products.
3.1.1 PNS/NACE Test Method
This test method is based on the National Association of Corrosion Engineers (NACE) Standard TM0169-95 as modified by the Pacific Northwest Snowfighters (PNS). The test procedure uses 30 ml of a 3% chemical deicer solution per square inch of coupon surface area for the corrosion test /75/. The PNS/NACE test involves a gravimetric method that entails cyclic immersion (10 minutes in the solution followed by 50 minutes exposed to air) of multiple parallel coupons for 72 hours on a custom design machine. The gravimetric method gives the average corrosion rate over a period of time. The weight loss result in MPY (milli-inch per year) is translated into a percentage, or percent corrosion rate (PCR), in terms of the solution corrosivity relative to a eutectic salt brine.
3.1.2 SAE J2334 Test Method
This test method developed by the Society of Automotive Engineers (SAE) places metal specimens in an enclosed chamber and exposes them to changing climates over time. The test procedure is cyclic in nature, consisting of humid stage, salt application stage, and dry stage; and the number of cycles and test duration can be variable /76/. It has been found that 80 cycles of such accelerated laboratory test corresponded well with five years of outdoor, on-vehicle testing for steel /77/. One challenge in implementing the
A-61
SAE laboratory test method lies in the need to precisely control the relative humidity of the test environment.
3.1.3 SHRP H-205.7 Test Method
This Strategic Highway Research Program (SHRP) test method covers evaluation of the corrosive effects of deicers on metal substrates through continuous immersion, and is used to evaluate the corrosivity of other aqueous, near neutral pH solutions /78/. The test requires longer exposure time (a few weeks) before weight loss data are collected. This test method is also intended to evaluate the effectiveness of corrosion inhibiting additives to deicing chemicals. One drawback in the SHRP laboratory test method lies in the lack of wet-dry cycles that simulate the field exposure of metals to deicers.
3.1.4 A Proposed Test Method
We consider electrochemical techniques an attractive alternative to the gravimetric methods described above, as they allow rapid determination of corrosion rate of metals and reveal information pertinent to the corrosion mechanism and kinetics /79-81/. In many practical applications, the use of linear polarization resistance (LPR) is preferred due to its simplicity and LPR testing is referenced in ASTM G 3 (Standard Practice for Conventions Applicable to Electrochemical Measurements in Corrosion Testing); ASTM G 96 (Standard Guide for On-Line Monitoring of Corrosion in Plant Equipment [Electrical and Electrochemical Methods]); ASTM G 102 (Standard Practice for Calculation of Corrosion Rates and Related Information from Electrochemical Measurements); and ASTM B 117 (Standard Method of Salt-Spray [Fog] Apparatus). However, there are concerns over its validity and reliability when LPR is used to quantify the corrosion rate, as it is prone to measuring errors of the test instrument and other variations. For Tafel polarization, the limitation is that the applied perturbation of large amplitude may lead to significant change in the surface state of electrodes, in the solution composition, or in the controlling corrosion mechanism and kinetics. Shi and Song found that the corrosion potential (Ecorr) and corrosion current density (icorr) derived from weak polarization curves were useful to predict the PCR value at reasonable accuracies /82/. The electrochemical technique was able to rapidly evaluate the corrosivity of deicer products in the presence and absence of corrosion inhibitors. The authors also suggest the use of multi-electrode array (also known as wire beam electrode) in place of the one-piece working electrode in order to enhance the reliability of the electrochemical test and to allow possible investigation of non-uniform corrosion /83/.
To bring to fruition an electrochemical polarization-based standard test protocol for deicer corrosivity, wet-dry cycles and the control of test environment (temperature, relative humidity, etc.) should be incorporated into the test procedure and weak polarization curves of metal coupons should be periodically measured for deicer products typically used by maintenance agencies at various concentrations. We envision that there would be a strong correlation between the electrochemical data and the PNS/NACE test results.
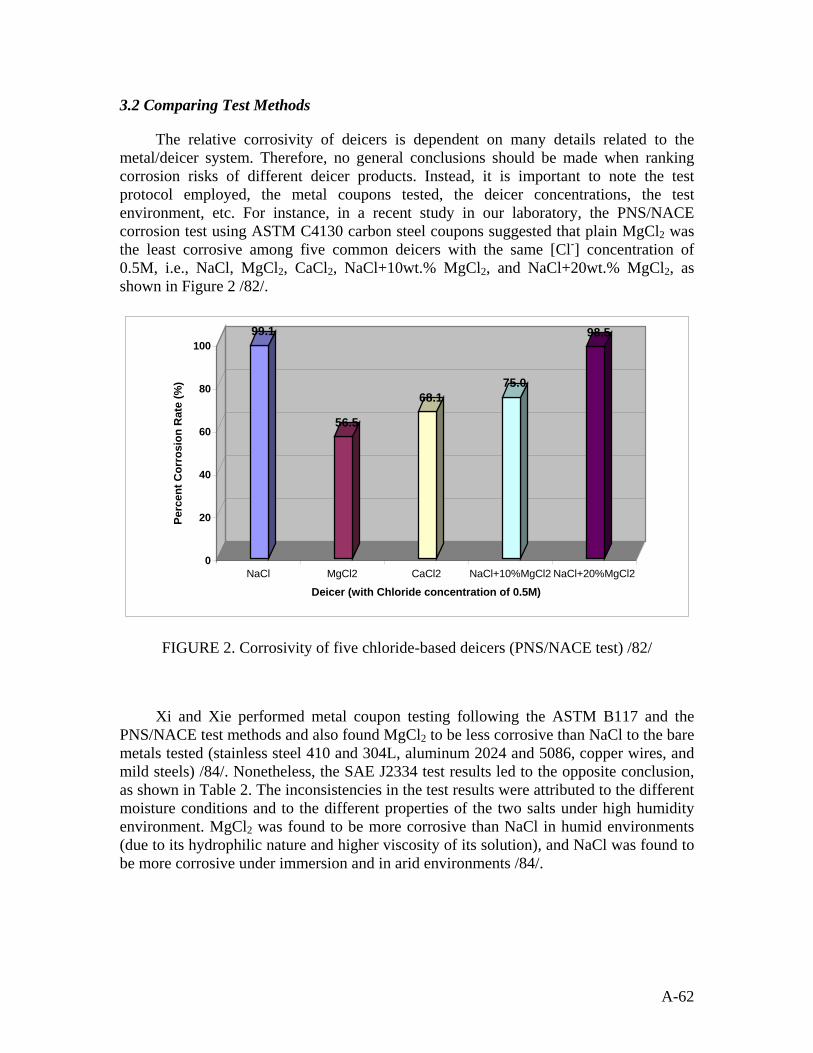
A-62
3.2 Comparing Test Methods
The relative corrosivity of deicers is dependent on many details related to the metal/deicer system. Therefore, no general conclusions should be made when ranking corrosion risks of different deicer products. Instead, it is important to note the test protocol employed, the metal coupons tested, the deicer concentrations, the test environment, etc. For instance, in a recent study in our laboratory, the PNS/NACE corrosion test using ASTM C4130 carbon steel coupons suggested that plain MgCl2 was the least corrosive among five common deicers with the same [Cl-] concentration of 0.5M, i.e., NaCl, MgCl2, CaCl2, NaCl+10wt.% MgCl2, and NaCl+20wt.% MgCl2, as shown in Figure 2 /82/.
99.1
56.5
68.175.0
98.5
0
20
40
60
80
100
Perc
ent C
orro
sion
Rat
e (%
)
NaCl MgCl2 CaCl2 NaCl+10%MgCl2 NaCl+20%MgCl2
Deicer (with Chloride concentration of 0.5M)
FIGURE 2. Corrosivity of five chloride-based deicers (PNS/NACE test) /82/
Xi and Xie performed metal coupon testing following the ASTM B117 and the PNS/NACE test methods and also found MgCl2 to be less corrosive than NaCl to the bare metals tested (stainless steel 410 and 304L, aluminum 2024 and 5086, copper wires, and mild steels) /84/. Nonetheless, the SAE J2334 test results led to the opposite conclusion, as shown in Table 2. The inconsistencies in the test results were attributed to the different moisture conditions and to the different properties of the two salts under high humidity environment. MgCl2 was found to be more corrosive than NaCl in humid environments (due to its hydrophilic nature and higher viscosity of its solution), and NaCl was found to be more corrosive under immersion and in arid environments /84/.
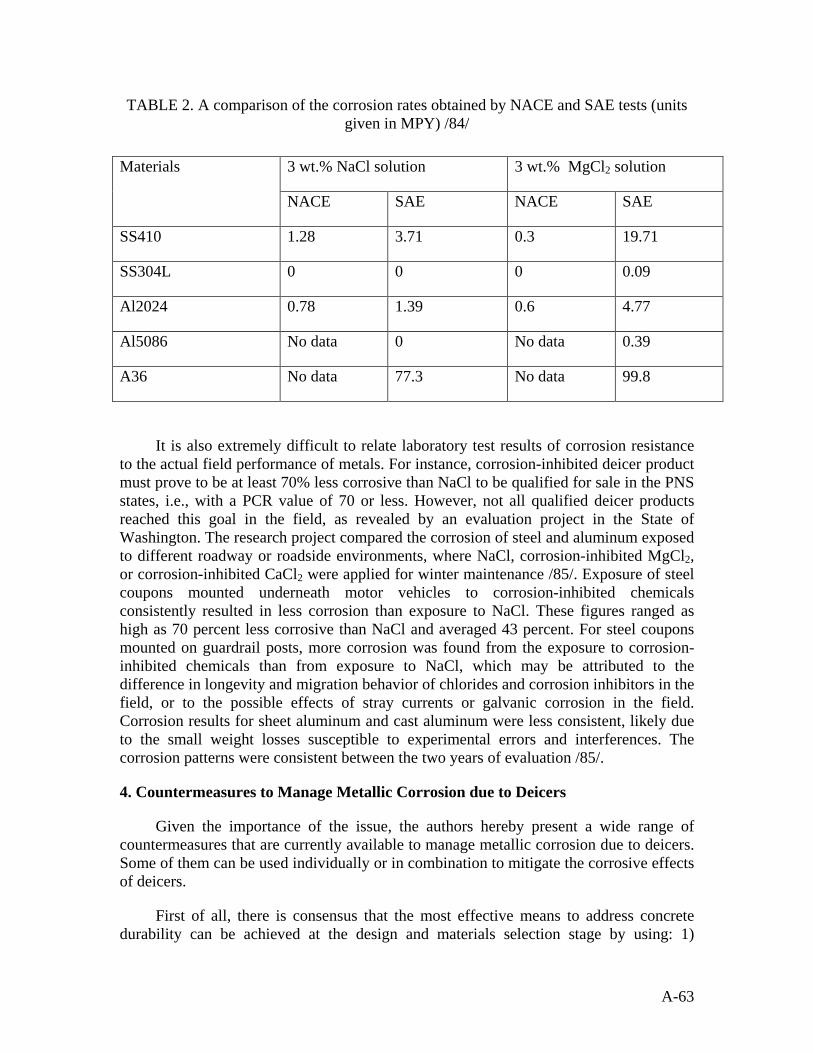
A-63
TABLE 2. A comparison of the corrosion rates obtained by NACE and SAE tests (units given in MPY) /84/
It is also extremely difficult to relate laboratory test results of corrosion resistance to the actual field performance of metals. For instance, corrosion-inhibited deicer product must prove to be at least 70% less corrosive than NaCl to be qualified for sale in the PNS states, i.e., with a PCR value of 70 or less. However, not all qualified deicer products reached this goal in the field, as revealed by an evaluation project in the State of Washington. The research project compared the corrosion of steel and aluminum exposed to different roadway or roadside environments, where NaCl, corrosion-inhibited MgCl2, or corrosion-inhibited CaCl2 were applied for winter maintenance /85/. Exposure of steel coupons mounted underneath motor vehicles to corrosion-inhibited chemicals consistently resulted in less corrosion than exposure to NaCl. These figures ranged as high as 70 percent less corrosive than NaCl and averaged 43 percent. For steel coupons mounted on guardrail posts, more corrosion was found from the exposure to corrosion-inhibited chemicals than from exposure to NaCl, which may be attributed to the difference in longevity and migration behavior of chlorides and corrosion inhibitors in the field, or to the possible effects of stray currents or galvanic corrosion in the field. Corrosion results for sheet aluminum and cast aluminum were less consistent, likely due to the small weight losses susceptible to experimental errors and interferences. The corrosion patterns were consistent between the two years of evaluation /85/.
4. Countermeasures to Manage Metallic Corrosion due to Deicers
Given the importance of the issue, the authors hereby present a wide range of countermeasures that are currently available to manage metallic corrosion due to deicers. Some of them can be used individually or in combination to mitigate the corrosive effects of deicers.
First of all, there is consensus that the most effective means to address concrete durability can be achieved at the design and materials selection stage by using: 1)
Materials 3 wt.% NaCl solution 3 wt.% MgCl2 solution
NACE SAE NACE SAE
SS410 1.28 3.71 0.3 19.71
SS304L 0 0 0 0.09
Al2024 0.78 1.39 0.6 4.77
Al5086 No data 0 No data 0.39
A36 No data 77.3 No data 99.8
A-64
adequate concrete cover and 2) high-quality concrete. Increasing the thickness of the concrete cover over the steel rebar can be beneficial /54/, with the increased concrete thickness acting as a barrier to prevent various aggressive species from migrating towards the rebar surface, and therefore increase the time for rebar corrosion to initiate. However, the cover thickness cannot exceed certain limits for mechanical and practical reasons /45/. The water-to-cement ratio can be as important as the concrete cover in controlling chloride-induced corrosion of the reinforcing steel. One laboratory study of rebar-concrete prism specimens exposed to 600-day seawater spray cycles identified the w/c ratio from 0.45 to 0.76 as the dominant factor that controls rebar corrosion, while the Cl− concentration relative to OH− of the pore fluid was of the secondary importance /8/. Another study of steel-reinforced concrete cylinders subjected to various laboratory conditions indicated that the rebar in high performance concrete (HPC) specimens (w/c=0.33, concrete thickness: 75 mm) performed much better than those in OPC specimens (w/c=0.6, concrete thickness: 75 mm) in resisting chloride-induced corrosion /86/.
In addition to an appropriate concrete mix design, permeability-reducing admixtures (e.g., mineral and polymer admixtures) are expected to reduce the risk of rebar corrosion and enhance the concrete durability /87-92/. For instance, the chloride diffusion coefficient for NaCl, CaCl2 and MgCl2 at saturated concentrations was significantly reduced to 1.4, 1.5, and 1.8 × 10⁻¹² m2/s respectively in slag-blended cement mortar (w/c=0.5), confirming the beneficial effects of mineral admixtures /20/. There are two types of concrete porosity that can affect chloride diffusion: macroporosity due to entrapped or entrained air and capillary porosity due to the presence of free water. Silica fume and other pozzolans can reduce macroporosity since they make concrete more compact, while decreasing the w/c ratio can reduce capillary porosity /93/. As such, concrete with silica fume or other pozzolands can have diffusion coefficients lower than 10-12 m2/s, especially when the water-to-cementitious-materials ratio is lower than 0.4.
Other best practices at this stage include: the addition of corrosion-inhibiting admixtures to fresh concrete /88-89, 94-98/, the surface treatment of steel rebar /99-106/; or the use of alternative reinforcement materials /107-108/. For instance, the use of steel fiber reinforcement in concrete limits the deterioration of concrete, while improving the concrete resistance against damage under severe conditions /109/.
Secondly, the corrosive effects of deicers to rebar in concrete deicers can be mitigated by controlling the ingress and accumulation of deleterious species. Existing research generally agrees that a hydrophobic surface treatment with good quality products (e.g., silanes and siloxanes) helps delay/reduce the ingress of chlorides and moisture into the concrete and thus improves the durability of reinforced concrete structures /110-118/. However, there are conflicting data regarding whether such treatment would benefit existing concrete decks with a relatively high level of chloride contamination in the concrete.
Previous research has indicated that once chloride-induced corrosion of the reinforcing steel is initiated in the concrete structure, the only effective means to stop corrosion are the electrochemical methods such as cathodic protection (CP) and
A-65
electrochemical chloride extraction (ECE) /119/. CP can stop further corrosion of the reinforcing steel regardless of the chloride content in the concrete, by directly shifting the steel potential from its natural state (corrosion potential) to a value below the equilibrium potential of steel and thus stopping the anodic dissolution /120/. While measured chloride profiles indicated that little chloride migration occurred at low CP current densities of 0.01 A/m2, migration away from the rebar and general chloride depletion in its vicinity were observed at current densities of 0.05 A/m2 or higher /121-122/. CP was demonstrated to induce microstructure alternations and some micro-cracking, while effectively retarding corrosion-induced crack initiation and propagation /123/. While both techniques proved to extend the service life of the treated structure, ECE offers more advantages over the use of CP such as the elimination of regular maintenance, as it is a one-time treatment electrically removing Cl- from contaminated concrete while generating beneficial hydroxyl ions (OH-) at the rebar /124-127/. While ECE gradually gains acceptance by practitioners as a viable rehabilitation measure, numerous studies have been devoted to examine its efficiency, influential factors, and limitations /128-134/. ECE can alter the chemistry and morphology of the cement paste especially near the steel-concrete interface, leading to Na-rich, Ca-Al-rich, Fe-rich, or Ca-rich crystals and an alkali-silica rich gel at the interface /128-129/ and a higher number of pores with a smaller pore size /131/ in concrete.
Thirdly, the corrosive effects of deicers to rebar in concrete can be mitigated by injecting beneficial species into concrete. Alkanolamines and amines and their salts with organic and inorganic acids have been patented as corrosion inhibitors for surface treatment of chloride-contaminated concrete, often as active ingredients of migrating corrosion inhibitors (MCIs). Such organic inhibitors have been claimed to penetrate rapidly into concrete due to their high vapor pressure under atmospheric conditions, but existing research related to their penetration behavior into concrete has been inconclusive so far, likely due to the diversity in porosity and chemistry of concretes investigated and test methods used /135-137/. Treatment of corroding reinforced concrete with one MCI product was able to decrease the corrosion rate of rebar corrosion induced by concrete carbonation, both for laboratory conditions and site structures /137/. Another MCI product was able to reduce the corrosion rate only when the initial chloride content was below 0.16 wt.% (by weight of cement, w/c=0.4 and 0.6), whereas there was no beneficial effect when the initial chloride content was greater than 0.43 wt.% /138/.
Electrical injection of corrosion inhibitors (EICI) is a relatively new technique that uses a setup similar to ECE to drive inhibitor ions into concrete while at the same time removing Cl- ions out of concrete. The feasibility of this technique was first demonstrated in late 1980s /124/, when quaternary ammonium and phosphonium corrosion inhibitors were developed specifically for electrical injection into concrete (w/c=0.5). The study showed that such inhibitor injection could provide adequate corrosion protection to rebars embedded in chloride-contaminated concrete. Limited studies have been published since the SHRP study, likely due to the high cost of aforementioned corrosion inhibitors. A recent study investigated the electromigration of two organic base corrosion inhibitors, ethanolamine (pKa 9.5) and guanidine (pKa 13.6) /17/. In this EICI process, an electric field was applied between steel embedded in concrete and an external anode, with the cathodic current density galvanostatically controlled in the range of 1~5 A/m2 for 3-14
A-66
days. Experiments with the same conditions but without an electric field were also conducted, by applying the corrosion inhibitors to similar saturated concrete surfaces from external electrolyte. The inhibitor concentration profiles indicated that the two inhibitors were effectively injected into carbonated reinforced concretes investigated and their electrical injection in non-carbonated concrete was far less effective. In carbonated concrete, the inhibitors became concentrated near the embedded steel. In non-carbonated concrete (w/c =0.65, pH>13), guanidine penetration was accelerated to a modest extent by the applied field but a 2-week, 5A/m2 treatment did not cause sufficient inhibitor to reach the rebar at a cover depth of 35mm. Ethanolamine penetration in non-carbonated concrete was not significantly enhanced by the electric field. These findings were explained in terms of the influence of the pH of the concrete pore solution on the degree of ionization of the organic bases and hence on their tendencies to migrate and neutralize cathodically-generated hydroxyl ions /139/. In a recent study in our laboratory, we assessed the potential applicability of EICI as a routine electrochemical treatment /140/. Eight organic chemicals were selected for preliminary evaluation in terms of their corrosion inhibition effectiveness for ASTM A588 steel in chloride-containing simulated pore solutions. The best performers (tetrabutylammonium bromide and tetraethylammonium bromide) were then further evaluated for their diffusion coefficient in concrete (w/c=0.5) via a customized electro-migration test. The study identified the selection of corrosion inhibitors as a critical component to the successful implementation of EICI practice as a rehabilitative measure for salt-contaminated concrete. The modeling results indicated that when an appropriate corrosion inhibitor was utilized, it was feasible to electrically inject sufficient amount of inhibitor into salt-contaminated concrete within a reasonable time frame /140/.
Furthermore, the use of an applied electric field has been demonstrated effective to realkalize carbonated concrete /141/, to drive Li+ into concrete and mitigate ASR /142/, and to inject cations (e.g, Zn2+) to rehabiliate concrete cracks /143/.
Finally, in order to minimize the corrosive effects of deicers to metals in transportation infrastructure, it is important for maintenance agencies to continuously seek non-corrosive deicer alternatives /1/ and optimize the application rates of deicers using advanced technologies such as snowplows equipped with sensors /144/. It should be cautioned that deicer products non-corrosive to one metal might be actually corrosive to other metals /1/ and additives used to inhibit certain metallic corrosion may have little to no inhibition effect on other metals /10/.
5. Conclusions
In cold-climate regions such as the northern U.S. and Canada, the growing use of deicers has raised concerns about their effects on motor vehicles, transportation infrastructure, and the environment. Chloride ingress, either from marine environments or from chloride-based deicers, is one of the primary forms of environmental attack for reinforced concrete structures. Localized corrosion of rebar may occur when water and oxygen are available at the steel surface and the passive film is jeopardized by a decrease in the pH of concrete pore solution and/or by the presence of enough water-soluble chloride ions. Chloride-based deicers can exacerbate the scaling problem and freeze-thaw
A-67
damage of concrete. Deicers may also pose detrimental effects on concrete infrastructure through their reactions with the cement paste and thus reduce concrete integrity and strength, which in turn may foster the ingress of moisture, oxygen and other aggressive agents onto the rebar surface and promote the rebar corrosion.
For practical purposes, all chloride-based deicers were ranked equally high in causing corrosion of the reinforcing steel in a recent NCHRP study, even though hygroscopic chlorides of magnesium and calcium can be more aggressive to the exposed metals than NaCl because of the longer time of wetness. The cation (Na+, Ca2+, or Mg2+) associated with Cl- also affects the pH value of the electrolyte and the chloride diffusion coefficient in concrete and thus poses different levels of corrosion risk to the rebar in concrete.
Acetate/formate-based deicers are widely used on airport pavements because they were considered non-corrosive deicer alternatives to chlorides. A recent study in our laboratory revealed that while NaAc- or KAc-based deicers were non-corrosive to mild steel, they were comparably corrosive as chloride-based deicers to galvanized steel.
We consider electrochemical techniques an attractive alternative to the gravimetric methods commonly used to evaluate deicer corrosivity (PNS/NACE, SAE, and SHRP methods), as they allow rapid determination of corrosion rate of metals and reveal information pertinent to the corrosion mechanism and kinetics.
The relative corrosivity of deicers is dependent on many details related to the metal/deicer system. Therefore, no general conclusions should be made when ranking corrosion risks of different deicer products. Instead, it is important to note the test protocol employed, the metal coupons tested, the deicer concentrations, the test environment, etc. It is also extremely difficult to relate laboratory test results of corrosion resistance to the actual field performance of metals.
There are many ways to manage the corrosive effects of deicers, such as: selection of high-quality concrete, adequate concrete cover and alternative reinforcement, control of the ingress and accumulation of deleterious species, injection of beneficial species into concrete, and use of non-corrosive deicer alternatives and optimal application rates.
6. References
1. L. Fay, K. Volkening, C. Gallaway, and X. Shi, in Proceedings (DVD-ROM) of the 87th Annual Meeting of Transportation Research Board
2. Salt Institute.
(held in Washington D.C., January 2008), eds. Transportation Research Board, (2008), Paper No. 08-1382.
http://www.saltinstitute.org/33, last accessed on October 22, 2008. 3. D.R. Buckler and G.E. Granato, Assessing biological effects from highway runoff
constituents
4. Federal Highway Administration,
. U.S. Department of the Interior and U.S. Geological Survey, Open-File Report 99-240, 1999.
Corrosion costs and preventative strategies in the United States. Publication No. FHWA-RD-01-156, 2002.
A-68
5. J.T. Johnson, Corrosion costs of motor vehicles,
6. C. Amrhein, J.E. Strong and P.A. Mosher, Environm. Sci. Tech., 26(4) (1992), 703-709.
2002. http://www.corrosioncost.com/pdf/transportation.pdf, accessed in July 2007.
7. H.K. Cook and W.J. McCoy, in Chloride Corrosion of Steel in Concrete
8. P.S. Mangat and B.T. Molloy, Materials and Structures 25(151) (1992), 404–411.
, ASTM STP 629; eds. D.E. Tonini and S.W. Dean, ASTM, Philadelphia. 1977, pp. 20-29.
9. A. Neville, Materials and Structures 28(176) (1995), 63–70. 10. Levelton Consultants Ltd., Guidelines for the selection of snow and ice control
materials to mitigate environmental impacts
11. S. Chatterji, N. Thaulow, and A.D. Jensen, Cement Conc. Res. 17(5), (1987), 777–783.
. NCHRP REPORT 577. National Cooperative Highway Research Program, National Research Council, Washington, D.C. http://onlinepubs.trb.org/onlinepubs/nchrp/nchrp_rpt_577.pdf, accessed in July 2008.
12. P.J. Nixon, C.L. Page, I. Canham, and R. Bollinghaus, Adv. Cement Res. 1(1) (1988), 99– 105.
13. M. Kawamura, K. Takemoto, and M. Ichise, in Proceedings of the 8th International Conference on AAR
14. M. Kawamura, K. Takeuchi, and A. Sugiyama, Cement Conc. Res. 24(4) (1994), 621–632.
, (held in Kyoto, Japan, August 1989), eds. K. Okada, S. Nishibayashi and M. Kawamura. Society of Materials Sciences, (1989), 115–120.
15. M. Kawamura and K. Takeuchi, Cement Conc. Res. 26(12) (1996), 1809–1819. 16. R.G. Sibbick, “The Susceptibility of Various UK Aggregates to Alkali–Silica
Reaction”, Ph.D. Dissertation, Aston University, Birmingham, UK, 1993. 17. R.G. Sibbick and C.L. Page, in Proceedings of the 10th International Conference on
AAR18. R.D. Cody, A.M. Cody, P.G. Spry, and G.-L. Gan, Environm. Eng. Geosci. 2(4)
(1996), 575-588.
(held in Melbourne, Australia, 1996), eds. A. Shayan. (1996), 822–829.
19. H. Lee, R.D. Cody, A.M. Cody, and P.G. Spry, in Mid-Continent Transportation Symposium Proceedings 2000
20. J. Deja and G. Loj, in
(held in Ames, Iowa, May 15-16, 2000), eds. Center for Transportation Research and Education, Iowa State University. (2000), 151-155.
Proceedings: Infrastructure Regeneration and Rehabilitation Improving the Quality of Life through Better Construction - A Vision for the Next Millennium
21. R.D. Cody, P.G. Spry, A.M. Cody, and G.-L. Gan,
(held in Sheffield, 28 June - 2 July 1999), eds. R. Narayan Swamy. Sheffield Academic Press, Sheffield, ROYAUME-UNI (1999), 603-620.
The role of magnesium in concrete deterioration
22. L. Sutter, K. Peterson, G. Julio-Betancourt, D. Hooton, T. Vam Dam, and K. Smith,
. The Iowa Highway Research Board, Final Report - Iowa DOT HR-355, 1994.
The deleterious chemical effects of concentrated deicing solutions on Portland cement concrete
23. S. Monosi and M.S. Collepardi, Il Cemento 87(1-3) (1990), 3-8.
. Final report for the South Dakota Department of Transportation, 2008.
24. P. R. Rangaraju, K.R. Sompura, J. Olek, S. Diamond, and J. Lovell, in Proceedings of the 8th International Conference on Concrete Pavements (held in Colorado
A-69
Springs, Colorado, USA, from August 14-18, 2005), eds. International Society for Concrete Pavements, (2005).
25. P.R. Rangaraju, K.R. Sompura, and J. Olek, TRR (J. Transp. Res. Board) 2020(1) (2007), 50-60.
26. P. R. Rangaraju and J. Desai, in Proceedings (CD-ROM) of the 85th Annual Meeting of Transportation Research Board
27. X. Shi, in
(held in Washington D.C., January 2006), eds. Transportation Research Board, (2006), Paper No. 06-3010.
Proceedings of the ITE District 6 Annual Meeting
28. D. Vitaliano, J. Policy Anal. Mgmt. 11(3) (1992), 397-418.
(held in Kalispell, Montana, July 10-13, 2005), eds. Institute of Transportation Engineers, (2005).
29. Transportation Research Board, Highway de-icing: comparing salt and calcium magnesium acetate
30. M. Yunovich, N.G. Thompson, T. Balvanyos, and L. Lave, . National Research Council. Special Report 235, 1991.
Corrosion costs of highway bridges, 2002. http://www.corrosioncost.com/pdf/highway.pdf, accessed in July 2007.
31. L.M. Samples and J.A. Ramirez, Methods of corrosion protection and durability of concrete bridge decks reinforced with epoxy-coated bars, Phase I
32. A. Poonguzhali, H. Shaikh, R.K. Dayal, and H.S. Khatak, Corr. Reviews, 26(4) (2008), 215-294.
. FHWA/IN/JTRP-98/15. Purdue University, IN, 1999.
33. T.H. Wee, A.K. Suryavanshi, and S.S. Tin, ACI Mater. J., 97(2) (2000), 221-232. 34. G.K. Glass and N.R. Buenfield, Prog. Struct. Engng. Mater. 2(4) (2000), 448-458. 35. W.H. Hartt, G.P. Rodney, L. Virginie, and D.K. Lysogorski, A critical literature
review of high-performance corrosion reinforcements in concrete bridge applications
36. L. Bertolini, B. Elsener, P. Pedeferri, and R. B. Polder, . FHWA-HRT-04-093, 2004.
Corrosion of Steel in Concrete: Prevention, Diagnosis, Repair
37. V. Chaker, , Wiley-VCH, 2004, 91-104.
Corrosion Forms and Control for Infrastructure
38. F.M. Li and Z.J. Li,
, ASTM International, 1992, 232-245.
in Mechanisms of Chemical Degradation of Cement-based Systems: Proceedings of the Material Research Society's Symposium on Mechanisms of Chemical Degradation of Cement-based Systems (held in Boston, USA, 27-30 November 1995)
39. B. Borgard, C. Warren, S. Somayaji, and R. Heidersbach,
, eds K.L. Scrivener and J.F. Young, Taylor & Francis, 1997, 159-166.
Corrosion Rates of Steel in Concrete: Proceedings of a symposium (held in Baltimore, MD, 1988)
40. M. Baykal,
, eds. N. S. Berke, V. Chaker, and D. Whiting, ASTM International, 1990, 174-186.
Implementation of durability models for Portland cement concrete into performance-based specifications
41. B.Z. Savas,
. Austin, TX: The University of Texas at Austin, 2000.
Effects of microstructure on durability of concrete
42. L. Bertolini, B. Elsener, P. Pedeferri, and R. Polder,
. Raleigh, NC: North Carolina State University, 1999.
Corrosion of Steel in Concrete: Prevention, Diagnosis, Repair. Wiley-VCH, Verlag GmbH & Co. KgaA, Weinheim, 2004.
A-70
43. K.C. Clear and R.E. Hay, Time-to-corrosion of reinforcing steel in concrete slab. Volume 1: Effect of mix design and construction parameters
44. K.C. Clear,
. Report No. FHWA-RD-73-32, Federal Highway Administration, Washington, DC, April 1973.
Time-to-corrosion of reinforcing steel in concrete slabs. Volume 3: Performance after 830 daily salt applications
45. L. Basheer, J. Kropp, and D.J. Cleland, Constrn. Bldg. Mater. 15(2-3) (2001), 93-113.
. Report No. FHWA-RD-76-70, Federal Highway Administration, Washington, DC, April 1976.
46. O.A. Kayyali and M.N. Hague, Cement Conc. Res. 18(7) (1988), 895-901. 47. D.A. Hausmann, Mater. Perform. 37(10) (1998): 64-68. 48. C.L. Page, N.R. Short, and W.R. Holden, Cement Conc. Res. 16(1) (1986), 79-86. 49. J.-W. Jang, I. Iwasaki, H.J. Gillis, and P.W., Weiblen, Advn. Cem. Bas. Mat. 2(4)
(1995), 152-160. 50. J.P. Broomfield, Corrosion of Steel in Concrete, Understanding, Investigation and
Repair51. W.H. Hartt, ASTM special technical publication (1370) (1999): 1-16.
, E and FN Spon, London, 1997.
52. J. McGraw, D. Iverson, and G. Schmidt, Effect of corrosion inhibitive deicers (Draft report)
53. A. Macias and C. Andrade, Corrs. Sci. 30(4-5) (1990), 393-407. . Minnesota Department of Transportation, August 2001.
54. C.J. Newton and J.M. Sykes, Cement Conc. Res. 17(4) (1987), 765-776. 55. L. Mammoliti, C. M. Hansson, ACI Mater. J., 102(4) (2005) 279-285. 56. B.T. Mussato, O.K. Gepraegs, and G. Farnden, in Proceedings (CD-ROM) of the
83th Annual Meeting of Transportation Research Board
57. R. Kondo, M. Satake, and H. Ushiyama, in Proceedings of the 28th General Assembly of the Cement Association of Japan (held in Tokyo, Japan, 1974), eds. Cement Association of Japan, (1974), 41-43.
(held in Washington D.C., January 2004), eds. Transportation Research Board, (2004).
58. C.L. Page, N.R. Short, and A. EI. Tarras, Cement Cons. Res., 11(1981), 395-406. 59. M. R. Jones, R. K. Dhir, and J. P. Gill, Cement Conc. Res., 25(1), (1995), 197-208. 60. W.A. AI-Khaja, Const. Build. Mater., 11(1) (1997) 9-13. 61. E. Samsom and J. Marchand, Cement Conc. Res., 37 (2007), 455-468. 62. S. Caré, Const. Build. Mater., 22 (2008), 1560-1573. 63. T.S. Nguyen, S. Lorente, M. Carcasses, Const. Build. Mater., 23 (2009), 795-803. 64. X. Shi, Impact of Airport Pavement Deicing Products on Aircraft and Airfield
Infrastructure. ACRP Synthesis 6. Airport Cooperative Research Program, Transportation Research Board, National Academies, Washington, D.C. April 2008. http://onlinepubs.trb.org/onlinepubs/acrp/acrp_syn_006.pdf last accessed in December 2009.
65. M.C. Man, L.B. Hazell, and R.P. Smith, On-Line Measurement of Simulated Reinforcement Corrosion in Concrete under Action of De-Icers
66. K.J. Kennelley, “Corrosion Electrochemistry of Bridge Structural Metals in Calcium Magnesium Acetate”, Ph.D. Dissertation, Diss. Abstr. Int. 47(4) (1986), 328.
. Elsevier Applied Science, London, U.K., 1990, 384-394.
67. C.E. Locke, K.J. Kennelley, and M.D. Boren, TRR (J. Transp. Res. Board) 1113(1) (1987), 30-38.
A-71
68. B.H. Chollar and Y.P. Virmani, Public Roads 51(4) (1988): 113-115. 69. K.J. Kennelley and C.E. Locke Jr., Corrosion 46(11) (1990), 888-895. 70. M.R. Callahan, TRR (J. Transp. Res. Board) 1211(1) (1990), 12-17. 71. W.M. Ushirode, J.T. Hinatsu, and F.R. Foulkes, J. Appl. Electrochem. 22(3) (1992),
224-9. 72. C.J. Fritzsche, Water Environm. Tech. 4(1) (1992): 44-51. 73. A. Ihs and K. Gustafson, in Proceedings of the Fourth International Symposium on
Snow Removal and Ice Control Technology
74. J. Flis, H.W. Pickering, and K. Osseo-Asare, Electrochim. Acta 43(12-13) (1998), 1921-1929.
(held in Washington, D.C., 1997), eds. Transportation Research Board, National Research Council, (1997).
75. Pacific Northwest Snowfighters, “Snow and ice control chemical products specifications and test protocols for the PNS association of British Columbia, Idaho, Montana, Oregon and Washington”, 2004.
76. SAE J2334, “Cosmetic corrosion lab test”, SAE International, Warrendale, PA, June 1998.
77. Y. Wang, R.S. Underhill, and B. Klassen, Review of corrosion control programs and research activities for army vehicles. Defence R&D Canada – Atlantic. Technical Memorandum. DRDC Atlantic TM 2006-055. August 2006. http://pubs.drdc.gc.ca/PDFS/unc53/p526285.pdf accessed in July 2008.
78. C.C. Chappelow, A.D. McElroy, R.R. Blackburn, D. Darwin, F.G. de Noyelles, and C.E. Locke, Handbook of test methods for evaluating chemical deicers
79. R. G. Kelly,
, Strategic Highway Research Program Report No. H-332 (SHRP H-205.7), National Research Council, 1992.
Electrochemical Techniques in Corrosion Science and Engineering
80. J.R. Scully, D.C. Silverman, and M.W. Kendig,
, CRC Press, 2003, 125-150.
Electrochemical Impedance: Analysis and Interpretation
81. J. R. Kearns, , ASTM International, 1993 23-36.
Electrochemical Noise Measurement for Corrosion Applications
82. X. Shi and S. Song, in
, ASTM International, 1996, 79-92.
Proceedings of the 16th International Corrosion Congress
83. Y.-J. Tan, S. Bailey, and B. Kinsella, Corrs. Sci. 43(10) (2001), 1931-1937.
(held in Beijing, China, September 19-24, 2005).
84. Y. Xi and Z. Xie, Corrosion effects of magnesium chloride and sodium chloride on automobile components
85. E.V. Baroga,
. Technical report for the Colorado Department of Transportation, CDOT-DTD-R-2002-4, 2002.
2002-2004 Salt Pilot Project
86. M. E. Ismail and H.R. Soleymani, Can. J. Civ. Eng. 29(6) (2002), 863–874.
. Final Report for the Washington State Department of Transportation, 2005.
87. P.S. Mangat and K. Gurusamy, J. Mater. Sci. 22 (10) (1987), 3103–3110. 88. W. Hartt, S. Charvin, and S. Lee, Influence of permeability reducing and corrosion
inhibiting admixtures in concrete upon initiation of salt induced embedded metal corrosion
89. P.C. Aïtcin, . Final report prepared for the Florida Department of Transportation, 1999.
Cement Conc. Comps. 25(4-5) (2003), 409-420. 90. Y.-S. Choi, J.-G. Kim, and K.-M. Lee, Corrs. Sci. 48(7) (2006), 1733-1745.
A-72
91. X. He and X. Shi, TRR (J. Transp. Res. Board) 2070 (2008), 13-21. http://dx.doi.org/10.3141/2070-03.
92. Yang, Z., Shi, X., Creighton, A. T., and Peterson, M. M. “Effect of Styrene-Butadiene Rubber Latex on the Chloride Permeability and Microstructure of Portland Cement Mortars”. Construction and Building Materials, 23(6) (2009), 2283-2290.
93. M. Collepardi, S. Biagini, ERMCO (1989), 1-8. 94. N.S. Berke, M.P. Dallaire, M.C. Hicks, and R.J. Hoopes, Corrs. Eng. 49(11) (1993)
934-943. 95. X. Shi, Yang, Z., Nguyen, T.A., Suo, Z., Avci, R., and Song, S. “An
Electrochemical and Microstructural Characterization of Steel-Mortar Admixed with Corrosion Inhibitors”. Science in China, Series E: Technological Sciences, 52(1) (2009), 52-66.
96. H.A.F. Dehwah, M. Maslehuddin and S.A. Austin, Cement Conc. Comps. 24(1) (2002), 17-25. N.G. Thompson, M. Yunovich, and D.R. Lankard, Procedures for evaluating corrosion-inhibiting admixtures for structural concrete. NCHRP Web Document 29, 2000. http://onlinepubs.trb.org/onlinepubs/nchrp/nchrp_w29.pdf accessed in July 2008.
97. N.G. Thompson, M. Yunovich, and D.R. Lankard, Procedures for evaluating corrosion-inhibiting admixtures for structural concrete. NCHRP Web Document 29, 2000. http://onlinepubs.trb.org/onlinepubs/nchrp/nchrp_w29.pdf accessed in July 2008.
98. P. Montes, T.W. Bremner, and F. Castellanos, Materials and Structures 39(2) (2006), 201-210.
99. A. Sanjurjo, S. Hettiarachchi, K. Lau, B. Wood, and P. Cox, Development of Metallic Coatings for Corrosion Protection of Steel Rebars
100. S.R. Yeomans, S.R., Corrs. Eng. 50(1) (1994)72-81.
. Strategic Highway Research Program, SHRP-I-622, National Research Council, Washington, DC, 1993.
101. M.M. Al-Zahrani, S.U. Al-Dulaijan, M. Ibrahim, H. Saricimen and F. M. Sharif, Cement Conc. Comps. 24(1) (2002), 127-137.
102. A. Almusallam, F.M. Khan, S.U. Dulaijan and O.S.B. Al-Amoudi, Cement Conc. Comps. 25(4-5) (2003), 473-481.
103. M. Nagi and S. Alhassan, in Proceeding of CORROSION/2005 Symposium
104. T. Bellezze, M. Malavolta, A. Quaranta, N. Ruffini and G. Roventi,
(held in Houston, TX, USA, April 3-7, 2005), eds. National Association of Corrosion Engineers, (2005), pp. 15.
Cement Conc. Comps. 28(3) (2006), 246-255.
105. M. Morris, M. Vázquez, and S.R. Sánchez, J. Mater. Sci. 35(8) (2000), 1885-1890. 106. D.G. Manning, Construct. Bldg. Mater. 10(5) (1996), 349–365. 107. G.G. Clemeña and Y.P. Virmani, Concrete Intl. (11) (2004), 39-49. 108. R. Schnell and J. Magee, in Proceedings of the International Bridge Conference
109. R. Mu, C. Miao, X. Luo, and W. Sun, Cement Conc. Res. 32(5) (2002), 1061-1066.
(held in Pittsburgh, PA, USA, June 12-14, 2006), Paper No. IBC-06-61.
A-73
110. D.W. Pfeifer and M.J. Scali, Concrete sealers for protection of bridge structures. Transportation Research Board, NCHRP report 244, National Research Council, Washington, DC, 1981.
111. D. Whiting, B. Ost, M. Nagi, and P.D. Cady, Condition evaluation of concrete bridges relative to reinforcement corrosion. Volume 5: Methods for evaluating the effectiveness of penetrating sealers
112. P.D. Cady,
. National Research Council, Strategic Highway Research Program, SHRP-S/FR-92-107, Washington, DC, 1992.
Sealers for Portland cement concrete highway facilities
113. P.D. Carter,
. Transportation Research Board, NCHRP Synthesis 209, National Research Council, Washington, DC, 1994.
Evaluation of dampproofing performance and effective penetration depth of silane sealers in concrete
114. J. Żemajtis and R.E. Weyers, TRR (J. Transp. Res. Board) 1561(1) (1996), 1-5.
. American Concrete Institute, Special Publication 151, 1994.
115. P.A.M. Basheer, L. Basheer, D.J. Cleland, and A.E. Long, Construct. Bldg. Mater. 11(7-8) (1997), 413-429.
116. R.E. Weyers, Intl. J. Mater. Product Tech. 23(3-4) (2005), 177-186, 117. U. Attanayake, X. Liang, S. Ng, and H. Aktan, J. Bridge Engrg. 11(5) (2006), 533-
540. 118. I.H.P. Mamaghan, C. Morette, B.A. Dockter, L. Falken, and J. Tonneson, in
Proceedings (DVD-ROM) of the 87th Annual Meeting of Transportation Research Board
119. S.R. Sharp, G.G. Clemena, Y.P. Virmani, G.E. Stoner, and R.G. Kelly,
(held in Washington D.C., January 2008), eds. Transportation Research Board, (2008), Paper No. 08-1382.
Electrochemical chloride extraction: Influence of concrete surface on treatment
120. L. Bertolini, F. Bolzoni, P. Pedeferri, L. Lazzari, and T. Pastore, J. Appl. Electrochem. 28(12) (1998), 1321-1331.
. Federal Highway Administration, FHWA-RD-02-107, Washington, DC, Sept. 2002.
121. J.S. Polland and J.A. Page, Investigation of chloride migration in reinforced concrete under application of cathodic protection
122. G. Mussinelli, M. Tettamanti, and P. Pedeferri, in the
. Report no. ME-87-11, Ontario Ministry of Transportation, Downsview, Ontario, 1988.
Proceedings of the 2nd International Conference on Deterioration and Repair of Reinforced Concrete in the Arabian Gulf
123. J. Hu, D.A. Koleva, and P. Stroeven, in
(held in Bahrain, Egypt, 1987), eds. CIRIA, (1987), vol. 1, pp. 99-120.
Proceedings of the 16th International Corrosion Congress
124. S. Hettiarachchi, A.T. Gaynor, and M.F. Asaro, (held in Beijing, China, September 19-24, 2005), (2005).
Electrochemical chloride removal and protection of concrete bridge components (Injection of synergistic inhibitors)
125. J.K, Bennett, T.J. Schue, K.C. Clear, D.L. Lankard, W.H. Hartt, and W.J. Swiat, W.J.,
, Strategic Highway Research Program, SHRP-S-310. National Research Council, Washington, DC, 1987.
Electrochemical chloride removal and protection of concrete bridge components: laboratory studies, Strategic Highway Research Program, SHRP S-657. National Research Council, Washington, DC, 1993.

A-74
126. J.K. Bennett, F. Fong, and T.J. Schue, T.J., Electrochemical chloride removal and protection of concrete bridge components: field trials
127. C. Arya, Q. Sa’id-Shawqi, and P.R.W. Vassie, Cement Conc. Res. 26(6) (1996), 851-860.
, Strategic Highway Research Program, SHRP S-669. National Research Council, Washington, DC, 1993.
128. T.D. Marcotte, C.M. Hansson, and B.B. Hope, Cement Conc. Res. 29(10) (1999), 1561-1568.
129. J. Orellan, G. Escadeillas, and G. Arliguie, Cement Conc. Res. 34(2) (2004), 227-234.
130. N. Ihekwaba, B. Hope, and C. Hansson, Cement Conc. Res. 26(1) (1996), 165-174. 131. M. Siegwart, J. Lyness, and B. Mcfarland, Cement Conc. Res. 33(8) (2003), 1211-
1221. 132. J. Tritthart, K. Pettersson, B. Sorensen, Cement Conc. Res. 23(5) (1993) 1095-
1104. 133. J. Tritthart, Adv. Cement Res. 11(4) (1999) 149-160. 134. J. Tritthart, Mater. Sci. Conc. 5 (1998) 401-441. 135. B. Elsener, Corrosion Inhibitors for Steel in Concrete. State of the Art Report
136. L. Holloway, K. Nairn, and M. Forsyth, Cement Conc. Res. 34(8) (2004), 1435-1440.
. European Federation of Corrosion Publications Number 35. Published by Maney on behalf of the Institute of Materials. 2001.
137. R. Heiyantuduwa, M.G. Alexander, and J.R. Mackechnie, J. Mater. Civil Eng. 18(6) (2006), 842-850.
138. W. Morris, A. Vico and M. Vázquez, J. Appl. Electrochem. 33(12) (2003), 1183-1189.
139. S. Sawada, C.L. Page, and M. M. Page, Corrs. Sci. 47(8) (2005), 2063-2078. 140. T. Pan, T.A. Nguyen and X. Shi, TRR (J. Transp. Res. Board) 2004 (2008), 51-60. 141. J.A. Gonzalez, A. Cobo, M.N. Gonzalez, and E. Otero, Materials and Corrosion
51(1) (2000), 97-103. 142. D. Whitmore and S. Abbott, in Proceedings of the 11th Intl. Conf. on Alkali-
Aggregate Reaction
143. J.-S. Ryu, and N. Otsuki, J. Appl. Electrochem. 32(4) (2002), 635-639.
(held in Quebec, Canada. June 11-16, 2000), eds. M.A. Berube, et al. (2000), pp. 1089-1098.
144. X. Shi, C.K. Strong, R. Larson, D.W. Kack, E.V. Cuelho, N. El Ferradi, A. Seshadri, K. O’Keefe, and L.E. Fay, Vehicle-based technologies for winter maintenance: The state of the practice
. Final Report for the NCHRP Project 20-07/Task 200. National Cooperative Highway Research Program, National Research Council, Washington, DC, September 2006.