
Effectofadenoma&surveillance&on& colorectal&cancer ... · ≥3 1337(11%) 16 231 0.49(0.27 H0.88)...
16
Effect of adenoma surveillance on colorectal cancer incidence: a multicentre cohort study Wendy Atkin FMedSci OBE Cancer Screening and Prevention Research Group Department of Surgery and Cancer Imperial College London
-
Upload
dinhnguyet -
Category
Documents
-
view
219 -
download
4
Transcript of Effectofadenoma&surveillance&on& colorectal&cancer ... · ≥3 1337(11%) 16 231 0.49(0.27 H0.88)...

Effect of adenoma surveillance on colorectal cancer incidence: a multicentre cohort study
Wendy Atkin FMedSci OBE
Cancer Screening and Prevention Research GroupDepartment of Surgery and Cancer
Imperial College London

• Colorectal cancer (CRC) is the 2nd most frequent cause of cancer death in Western world.
• Endoscopic removal of adenomas, precursors of most CRCs, reduces CRC incidence and mortality.
• After adenoma removal, colonoscopy surveillance is offered to those perceived to be at increased CRC risk.
• Adenoma surveillance guidelines stratify patients into risk groups based on advanced adenoma (≥ 1cm, ≥ 25% villous, high-grade dysplasia) detection at 1st surveillance
• Guidelines not supported by evidence on CRC risk
Background

Atkin WS, Saunders BP. Gut 2002;;51 suppl 5:V6-9.;; NICE:, 2011
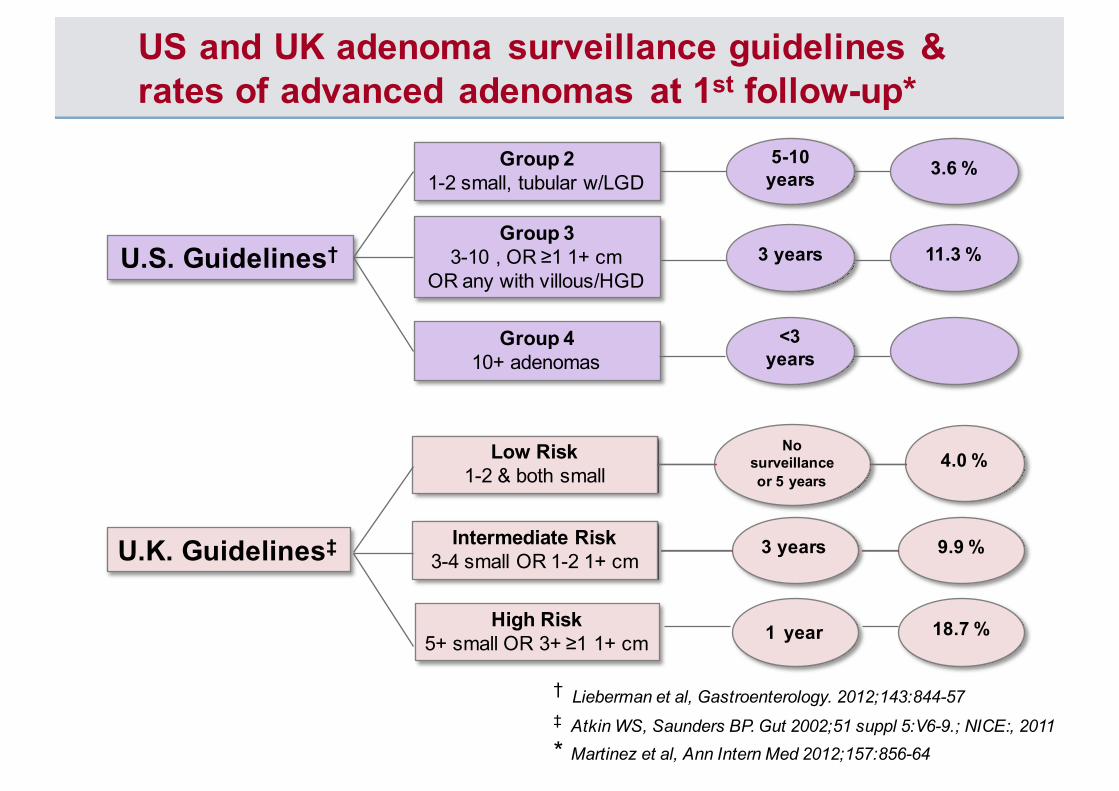
US and UK adenoma surveillance guidelines & rates of advanced adenomas at 1st follow-up*
U.S. Guidelines†
Group 21-2 small, tubular w/LGD
Group 33-10 , OR ≥1 1+ cm
OR any with villous/HGD
Group 410+ adenomas
U.K. Guidelines‡
Low Risk1-2 & both small
Intermediate Risk3-4 small OR 1-2 1+ cm
High Risk5+ small OR 3+ ≥1 1+ cm
5-10 years
3 years
<3 years
No surveillance or 5 years
3 years
1 year
3.6 %
11.3 %
9.9 %
18.7 %
4.0 %
† Lieberman et al, Gastroenterology. 2012;;143:844-57 ‡ Atkin WS, Saunders BP. Gut 2002;;51 suppl 5:V6-9.;; NICE:, 2011* Martinez et al, Ann Intern Med 2012;;157:856-64

To address following questions
• What is the CRC incidence after colonoscopic removal of intermediate risk adenomas with no surveillance?
• Is CRC risk higher than in general population?
• Does colonoscopy surveillance reduce that risk?
• Does risk vary within the intermediate risk group?
• Is colonoscopy surveillance warranted in all intermediate risk patients?
Aims of the study
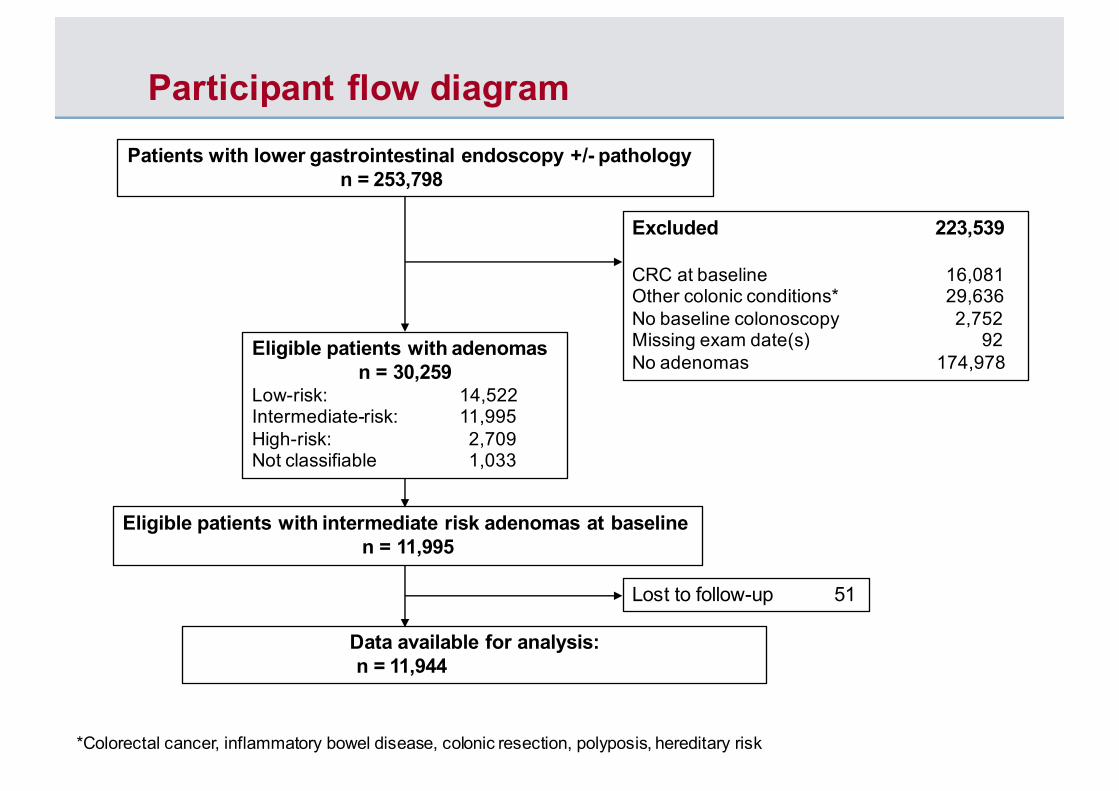
Participant flow diagramPatients with lower gastrointestinal endoscopy +/- pathology
n = 253,798
Excluded 223,539
CRC at baseline 16,081Other colonic conditions* 29,636No baseline colonoscopy 2,752Missing exam date(s) 92No adenomas 174,978
Eligible patients with adenomas n = 30,259
Low-risk: 14,522Intermediate-risk: 11,995High-risk: 2,709Not classifiable 1,033
Eligible patients with intermediate risk adenomas at baselinen = 11,995
Lost to follow-up 51
Data available for analysis:n = 11,944
*Colorectal cancer, inflammatory bowel disease, colonic resection, polyposis, hereditary risk

• Included all patients having lower GI pathology between 1990 and 2010 from 17 hospitals.
• Identified patients having ≥1 colonoscopy and intermediate risk adenomas diagnosed
• Divided each patient’s endoscopies into “visits”, defined as: one or more endoscopies performed in close succession to complete an examination and remove all detected lesions
• Hierarchy of rules to define values for lesion characteristics (number, size, histology etc) and quality of examination
• Ascertained CRCs from hospital reports and NHS data repositories for England and Scotland and deaths from Office of National Statistics
• Censored patients at CRC Dx, death, emigration or 31 Dec 2014
Methods
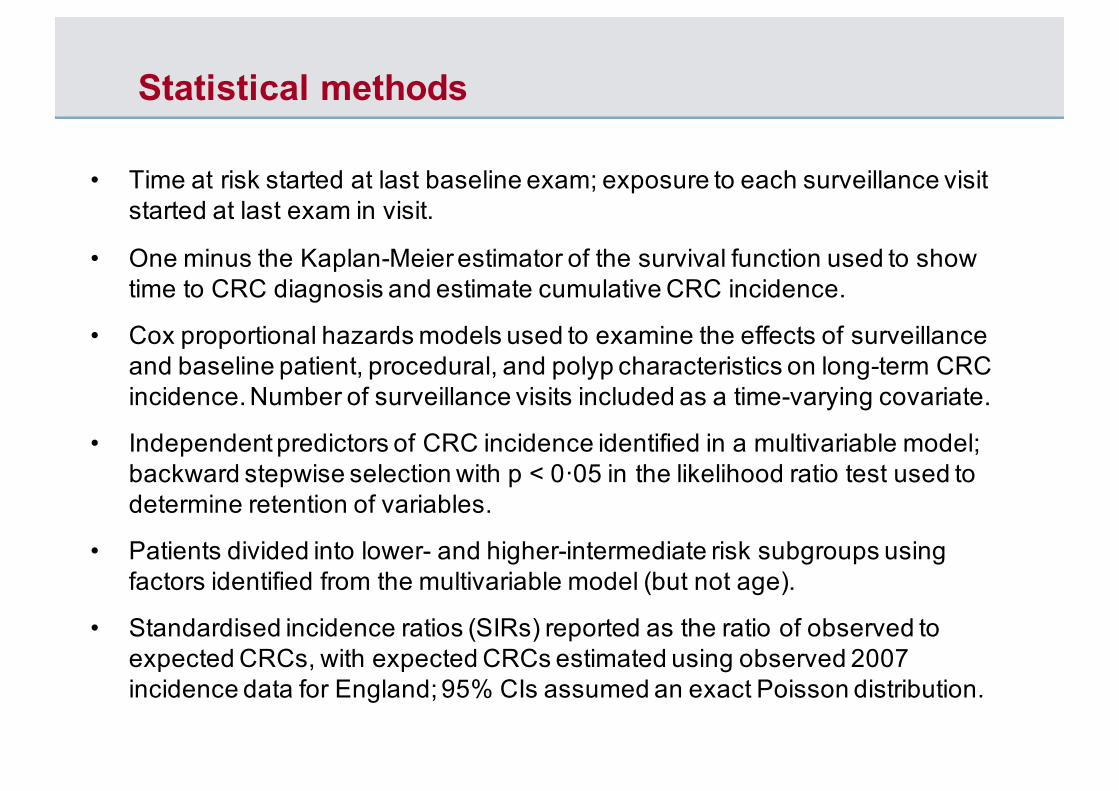
• Time at risk started at last baseline exam;; exposure to each surveillance visit started at last exam in visit.
• One minus the Kaplan-Meier estimator of the survival function used to show time to CRC diagnosis and estimate cumulative CRC incidence.
• Cox proportional hazards models used to examine the effects of surveillance and baseline patient, procedural, and polyp characteristics on long-term CRC incidence. Number of surveillance visits included as a time-varying covariate.
• Independent predictors of CRC incidence identified in a multivariable model;; backward stepwise selection with p < 0·05 in the likelihood ratio test used to determine retention of variables.
• Patients divided into lower- and higher-intermediate risk subgroups using factors identified from the multivariable model (but not age).
• Standardised incidence ratios (SIRs) reported as the ratio of observed to expected CRCs, with expected CRCs estimated using observed 2007 incidence data for England;; 95% CIs assumed an exact Poisson distribution.
Statistical methods
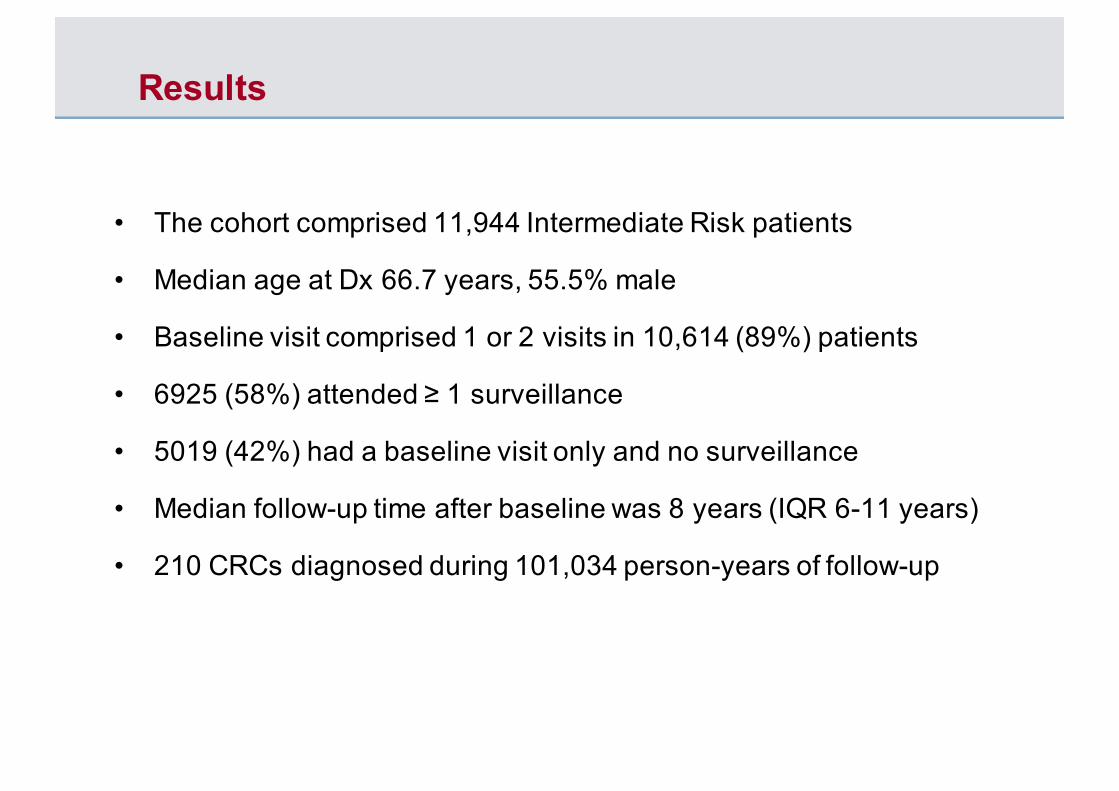
• The cohort comprised 11,944 Intermediate Risk patients
• Median age at Dx 66.7 years, 55.5% male
• Baseline visit comprised 1 or 2 visits in 10,614 (89%) patients
• 6925 (58%) attended ≥ 1 surveillance
• 5019 (42%) had a baseline visit only and no surveillance
• Median follow-up time after baseline was 8 years (IQR 6-11 years)
• 210 CRCs diagnosed during 101,034 person-years of follow-up
Results
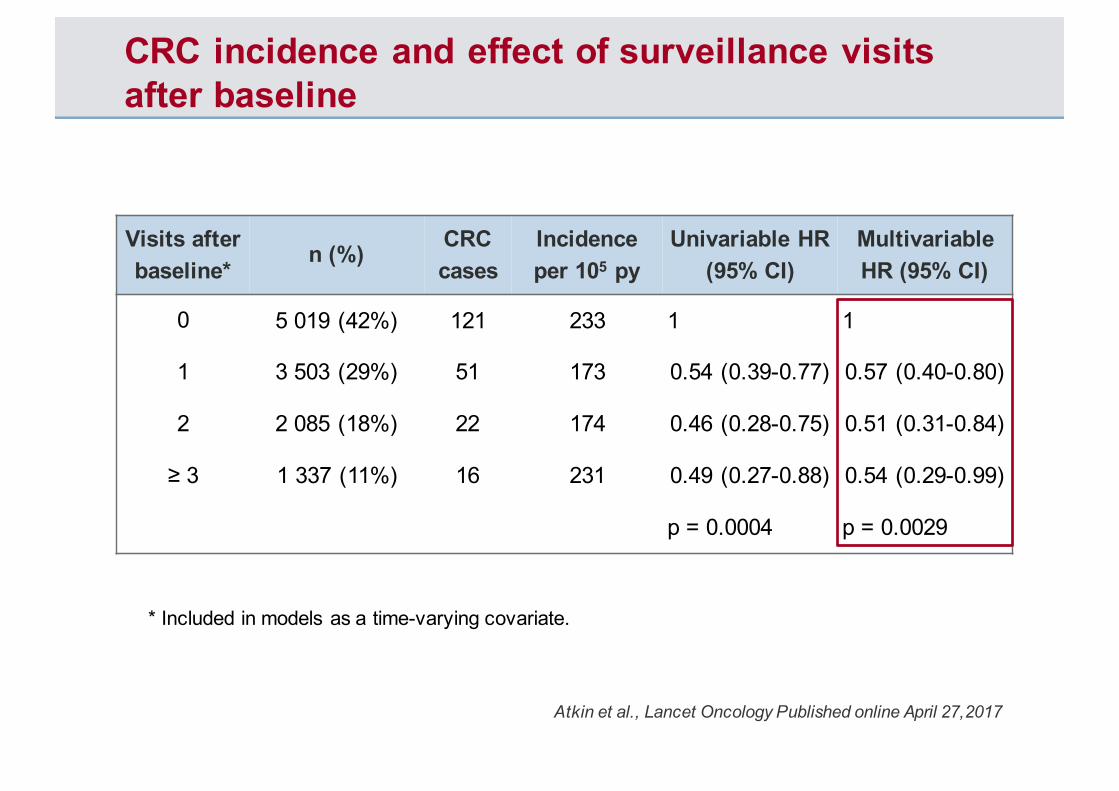
CRC incidence and effect of surveillance visits after baseline
Visits after baseline*
n (%) CRC cases
Incidence per 105 py
Univariable HR (95% CI)
Multivariable HR (95% CI)
0 5 019 (42%) 121 233 1 1
1 3 503 (29%) 51 173 0.54 (0.39-0.77) 0.57 (0.40-0.80)
2 2 085 (18%) 22 174 0.46 (0.28-0.75) 0.51 (0.31-0.84)
≥ 3 1 337 (11%) 16 231 0.49 (0.27-0.88) 0.54 (0.29-0.99)
p = 0.0004 p = 0.0029
Atkin et al., Lancet Oncology Published online April 27,2017
* Included in models as a time-varying covariate.

CRC incidence by baseline risk factors
Baseline risk factor n CRC cases
Incidence per 105 py
Multivariable HR (95% CI)
p value
Adenoma size (mm) 0.0335<10 1029 10 120 110-19 6857 116 198 1.97 (1.01-3.81)≥20 4058 84 246 2.28 (1.06-4.50)Adenoma dysplasia 0.0033High grade 1994 51 322 1.69 (1.21-2.36)Proximal polyps 0.0004Yes 3649 73 254 1.76 (1.30-2.38)Colonoscopy 0.0001Incomplete or not known 2928 86 299 1.80 (1.34-2.41)Bowel prep quality 0.0452Excellent or good 3956 53 159 1Satisfactory 1922 29 213 1.51 (0.95-2.39)Poor 671 16 356 2.09 (1.19-3.67)
Atkin et al., Lancet Oncology Published online April 27,2017
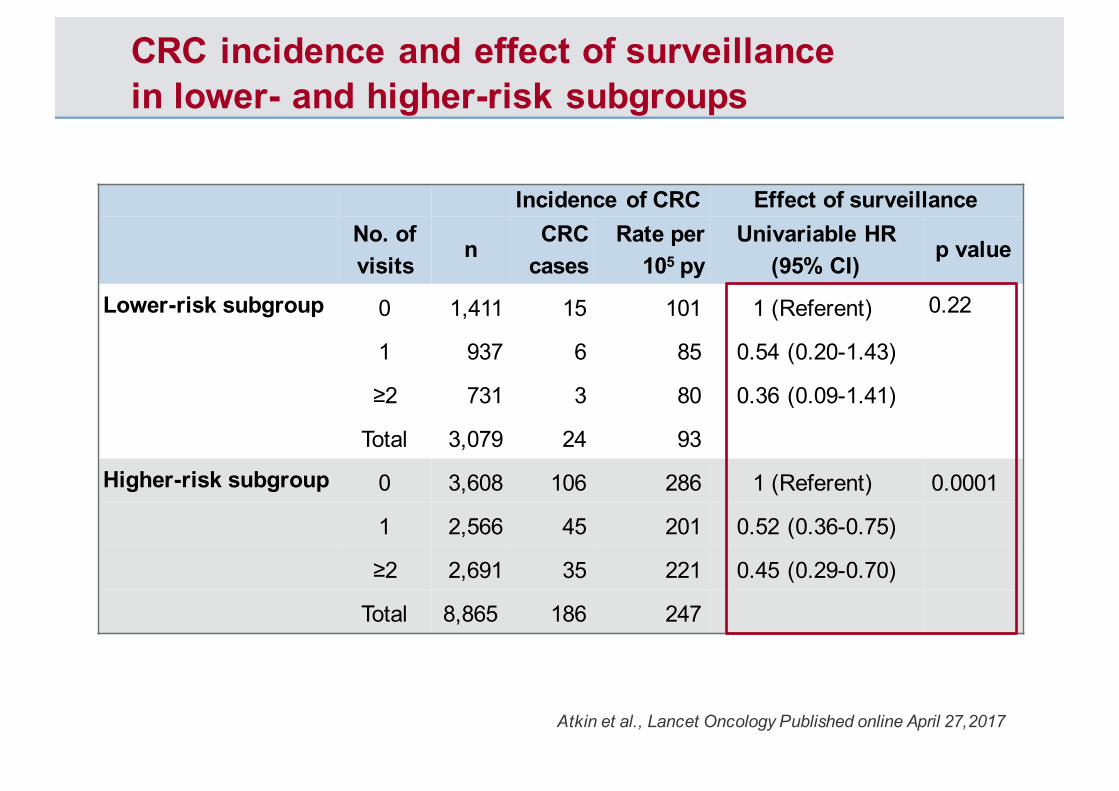
CRC incidence and effect of surveillance in lower- and higher-risk subgroups
Incidence of CRC Effect of surveillanceNo. of visits
n CRC cases
Rate per 105 py
Univariable HR (95% CI)
p value
Lower-risk subgroup 0 1,411 15 101 1 (Referent) 0.22
1 937 6 85 0.54 (0.20-1.43)
≥2 731 3 80 0.36 (0.09-1.41)
Total 3,079 24 93
Higher-risk subgroup 0 3,608 106 286 1 (Referent) 0.0001
1 2,566 45 201 0.52 (0.36-0.75)
≥2 2,691 35 221 0.45 (0.29-0.70)
Total 8,865 186 247
Atkin et al., Lancet Oncology Published online April 27,2017

Reason classified as higher-risk
Incidence of CRC Effect of surveillanceNo. of visits
n CRC cases
Rate per 105
Univariable HR (95% CI)
p value
Poor quality exam only 0 613 18 253 1 (Referent) 0.25
1 451 8 170 0.49 (0.21-1.18)
≥2 490 10 286 0.81 (0.32-2.04)
Total 1,554 36 235
High risk polyps only 0 2,223 52 231 1 (Referent) 0.0098
1 1,631 24 187 0.59 (0.36-0.98)
≥2 1,620 14 173 0.40 (0.21-0.77)
Total 5,474 90 207
Poor quality exam & high risk 0 772 36 484 1 (Referent) 0.0084
1 484 13 270 0.44 (0.23-0.86)
≥2 581 11 258 0.34 (0.15-0.76)
Total 1,837 60 363
Atkin et al., Lancet Oncology Published online April 27,2017

Cumulative CRC incidence after baseline
Atkin et al., Lancet Oncology Published online April 27,2017
Whole Intermediate Cohort Stratified by Subgroup

Cumulative CRC incidence and SIRs after baseline and first surveillance
nTotal CRC cases
Cumulative incidence at 10 years
No. of CRCs
expected
Standardised incidence ratio (SIR) (95% CI)
After baseline (no surveillance)
Whole cohort 11,944 121 2.7% 111 1.09 (0.91-1.30)
Lower-risk subgroup 3,079 15 1.1% 29 0.51 (0.29-0.84)
Higher-risk subgroup 8,865 106 3.3% 82 1.30 (1.06-1.57)
p<0.0001*
After one surveillance onlyWhole cohort 6,925 51 2.3% 64 0.80 (0.59-1.05)
Lower-risk subgroup 1,668 6 0.7% 14 0.42 (0.16-0.92)
Higher-risk subgroup 5,257 45 2.8% 50 0.90 (0.66-1.21)
p=0.0431*
Atkin et al., Lancet Oncology Published online April 27,2017
* p-value from log-rank test comparing incidence in higher-risk vs lower-risk subgroup.

![class ads / legals - The Sidney Sun-TelegraphJan 10, 2018 · 69162-0316 (308) 254-5595 [Published in the Sidney Sun-Tele-graph on December 27,2017,January 3,10,2018] L17-777 NOTICE](https://static.fdocuments.net/doc/165x107/5ecf6fd9ace104478711f47d/class-ads-legals-the-sidney-sun-jan-10-2018-69162-0316-308-254-5595-published.jpg)


