Effective Monitoring for Demanding Operations Environments · Effective Monitoring for Demanding...
31
Effective Monitoring for Demanding Operations Environments Rodrigue Chakode Nagios World Conference, Saint-Paul, US 2013-10-01
Transcript of Effective Monitoring for Demanding Operations Environments · Effective Monitoring for Demanding...

Effective Monitoring for Demanding Operations Environments
Rodrigue Chakode
Nagios World Conference, Saint-Paul, US2013-10-01
Agenda
● Introduction, Background● Challenges for Effective Monitoring● Move to Business Service Management (BSM)● RealOpInsight: An Advanced Software for BSM● Experience Feedback
Rodrigue Chakode
Author & Leader PhD, R&D HPC/Cloud Software Engineer
Community Manager
http://fr.linkedin.com/in/rodriguechakode
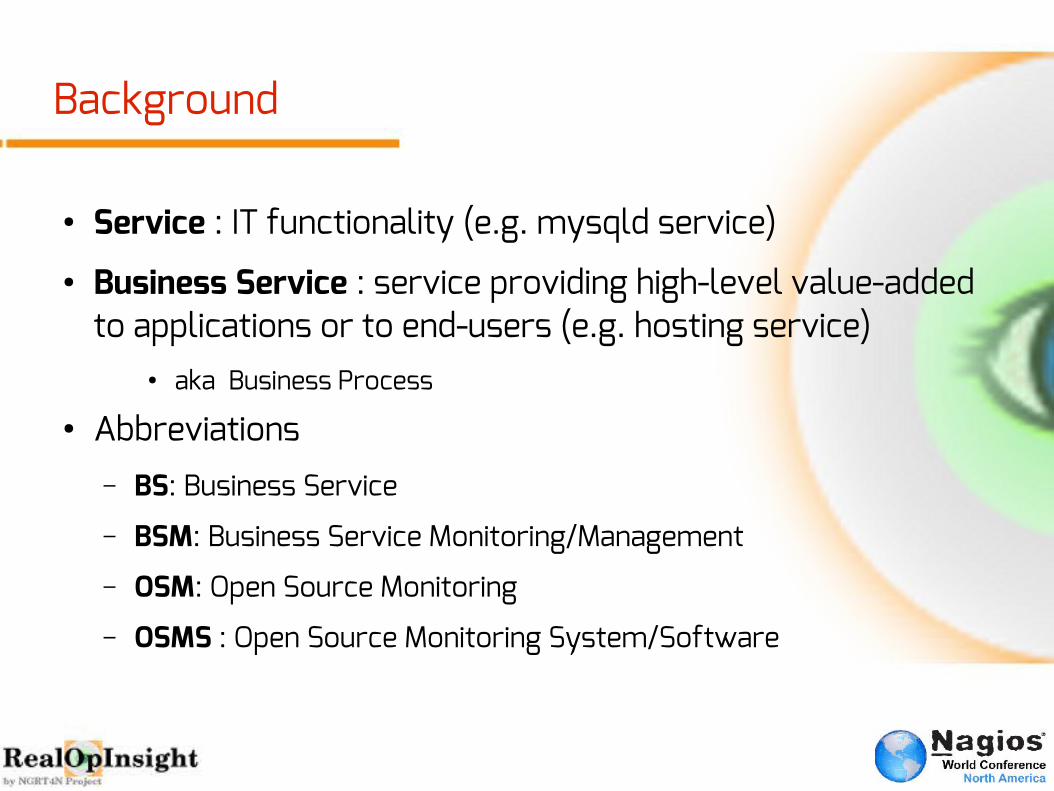
Background
● Service : IT functionality (e.g. mysqld service)● Business Service : service providing high-level value-added
to applications or to end-users (e.g. hosting service)● aka Business Process
● Abbreviations– BS: Business Service
– BSM: Business Service Monitoring/Management
– OSM: Open Source Monitoring
– OSMS : Open Source Monitoring System/Software
“Too many alarms kill alarm” S. Bortzmeye
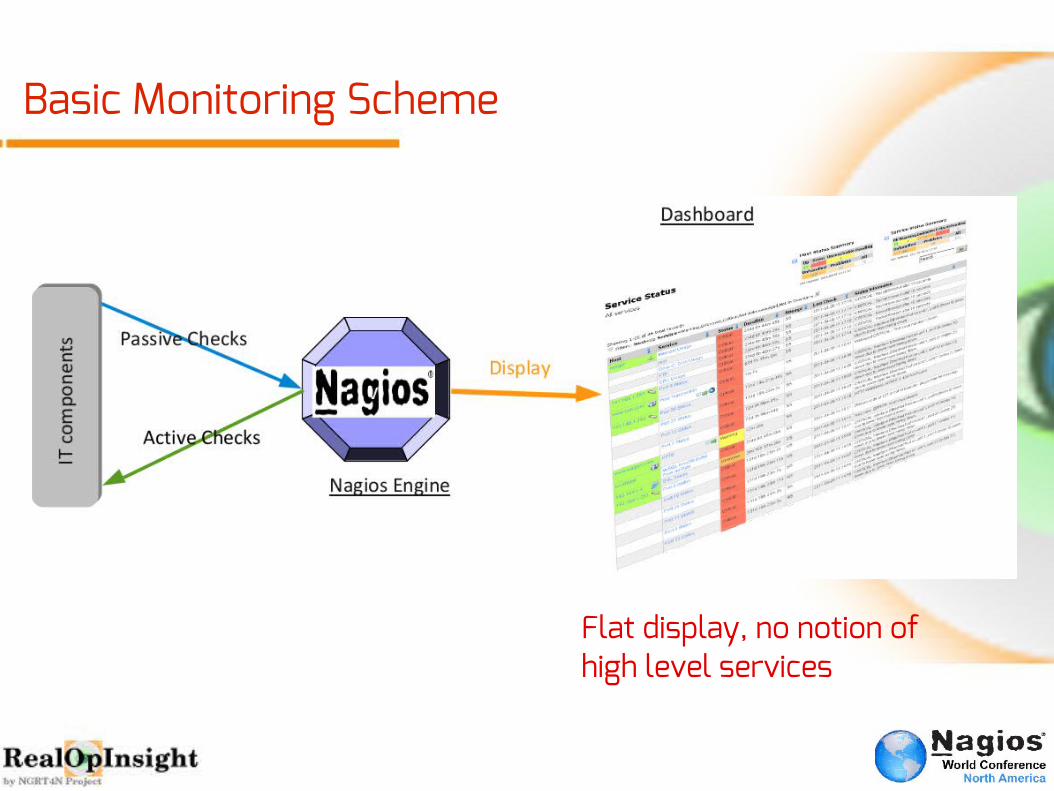
Basic Monitoring Scheme
Flat display, no notion of high level services
Today's IT infrastructures facts
● Huge number of checks to handle– E.g. 100 hosts, 8 checks/host => 8,00 checks
● False alerts are the bane of administrators– Not a matter of being a lazy admin
● No way to be effective with flat display !
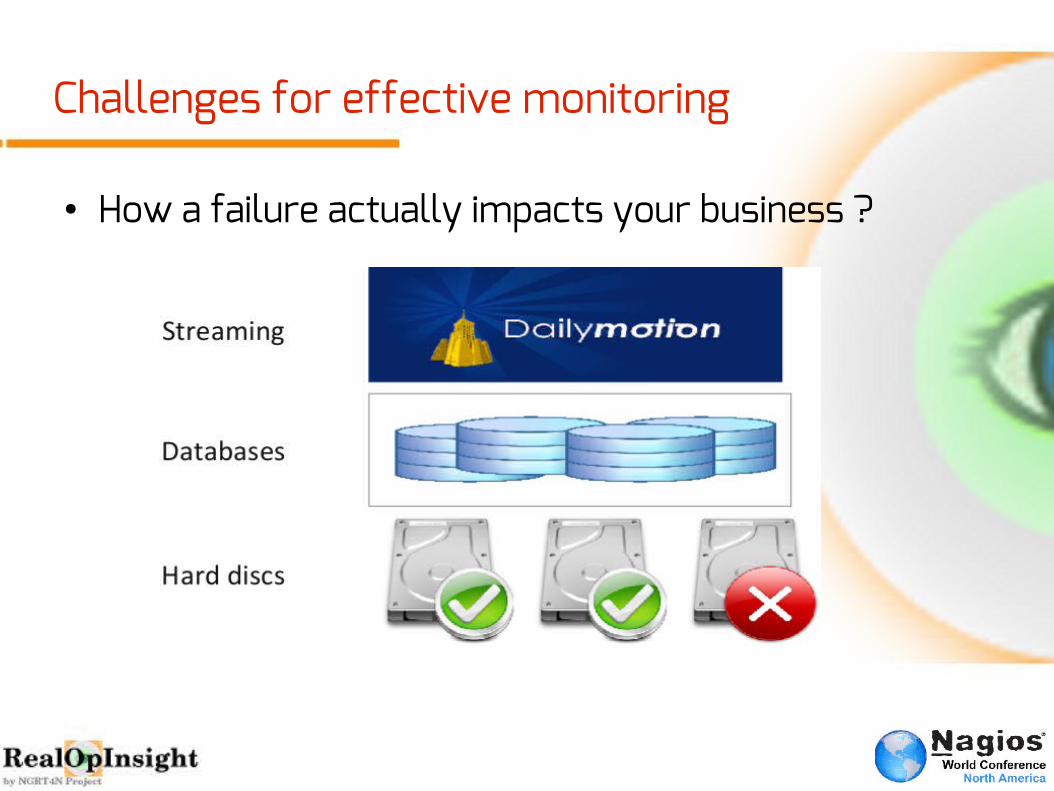
Challenges for effective monitoring
● How a failure actually impacts your business ?
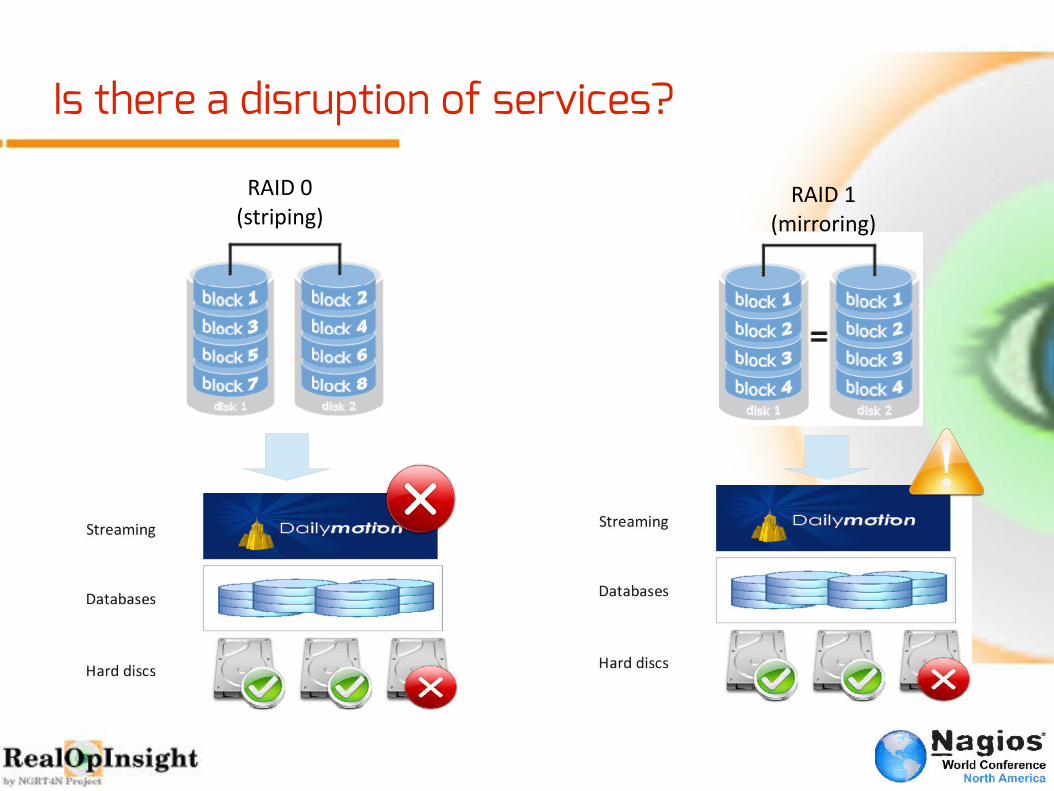
Is there a disruption of services?
RAID 0(striping)
RAID 1(mirroring)
“Network tools cannot actually determine what is and is not important. Only the
owner of applications can do that” Anonymous
“prioritize and orchestrate work based on business needs”
http://www.bmc.com/solutions/bsm/
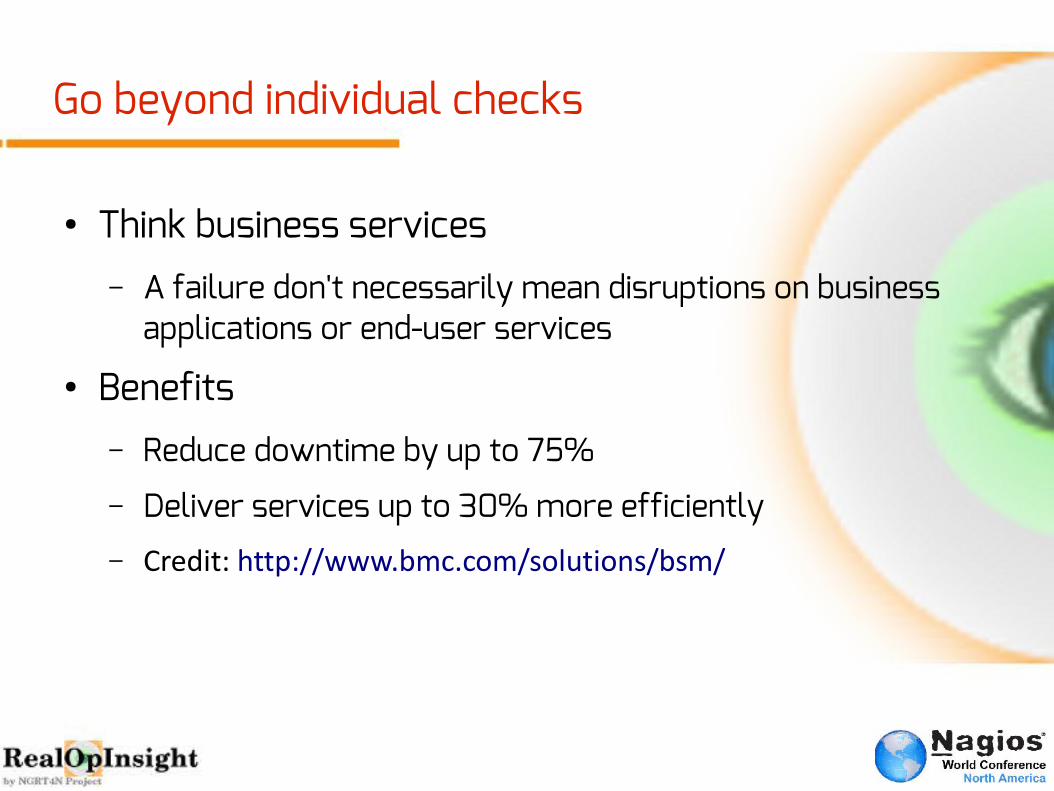
Go beyond individual checks
● Think business services– A failure don't necessarily mean disruptions on business
applications or end-user services
● Benefits– Reduce downtime by up to 75%
– Deliver services up to 30% more efficiently– Credit: http://www.bmc.com/solutions/bsm/

Think relational services
● A business service may depend on :– one or many IT services, and/or on
– other business services
– E.g. Streaming ← Web Server ← Databases ← Network ← Operating System ← Hardware Devices...
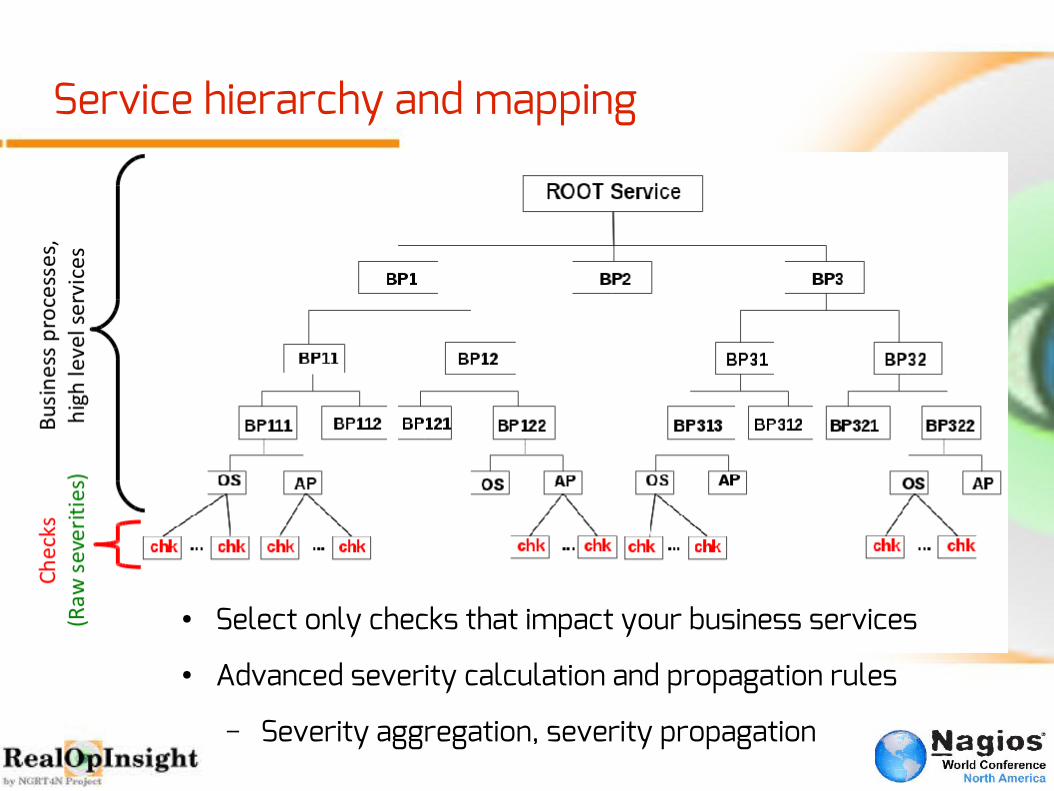
Service hierarchy and mapping
● Select only checks that impact your business services
● Advanced severity calculation and propagation rules
– Severity aggregation, severity propagation

Service hierarchy and mapping
Service map ISN'T Netw
ork map

Use cases
● RAID 0 ● RAID 1
● Merchant-site ● Redundant databases
“Takes the IT you already have, and adds to it the visibility and control of a unified platform”
http://www.bmc.com/

Nagios BP Add-on
● Good starting point– Service tree, aggregation rules, no propagation rules
– No service map, not suited for a huge number of services

RealOpInsight
● Powerful and easy-to-use BSM dashboard toolkit– C++/Qt-based GUI application
● Cross-platform (Linux, Windows, OS X)● Better interactiveness vs Web interfaces
● Generic and scalable Add-on– Central dashboard for distributed environments
● Up to 10 monitoring servers simultaneously
● http://realopinsight.com
“small and efficient and gets the job done” lukaswhite, SourceForget.net
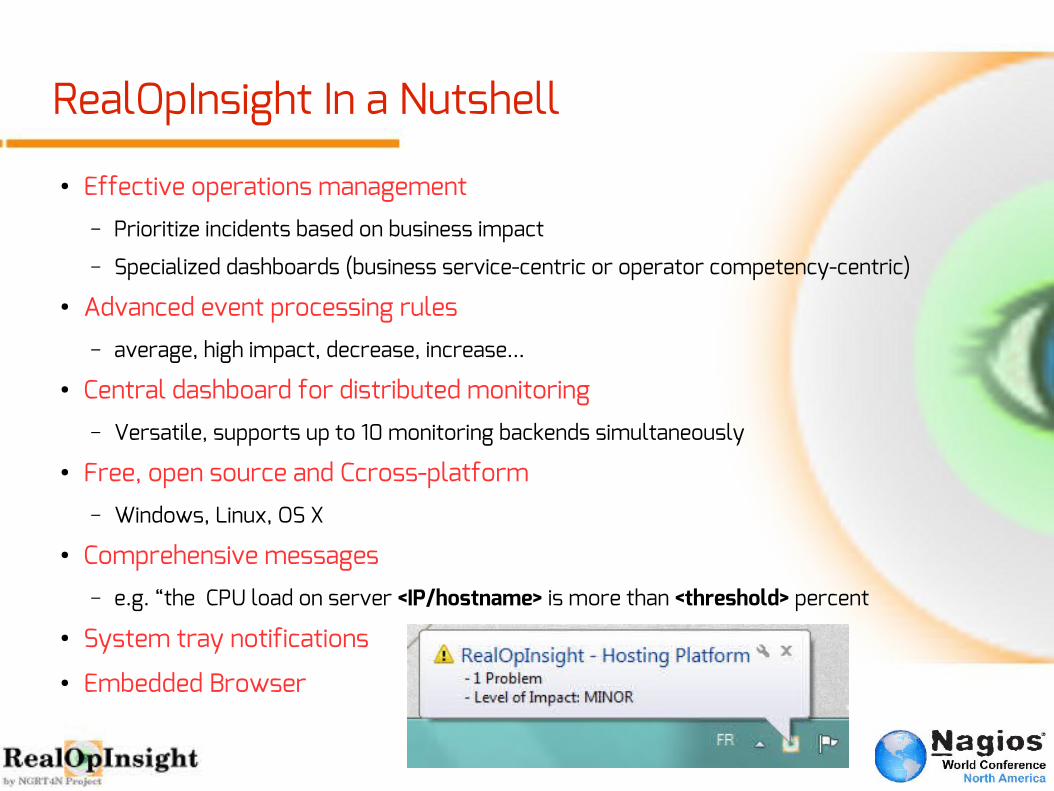
RealOpInsight In a Nutshell
● Effective operations management– Prioritize incidents based on business impact
– Specialized dashboards (business service-centric or operator competency-centric)
● Advanced event processing rules– average, high impact, decrease, increase...
● Central dashboard for distributed monitoring– Versatile, supports up to 10 monitoring backends simultaneously
● Free, open source and Ccross-platform – Windows, Linux, OS X
● Comprehensive messages – e.g. “the CPU load on server <IP/hostname> is more than <threshold> percent
● System tray notifications ● Embedded Browser

TreeView, Map and Events in One Console
Service Tree
● Tooltips
● Focus
● Service-related message filtering...
Message Console● Trouble view filtering...
Service Mapping● Tooltips, Zooming, Dragging and
Scrolling, Focus, Service-related message filtering...
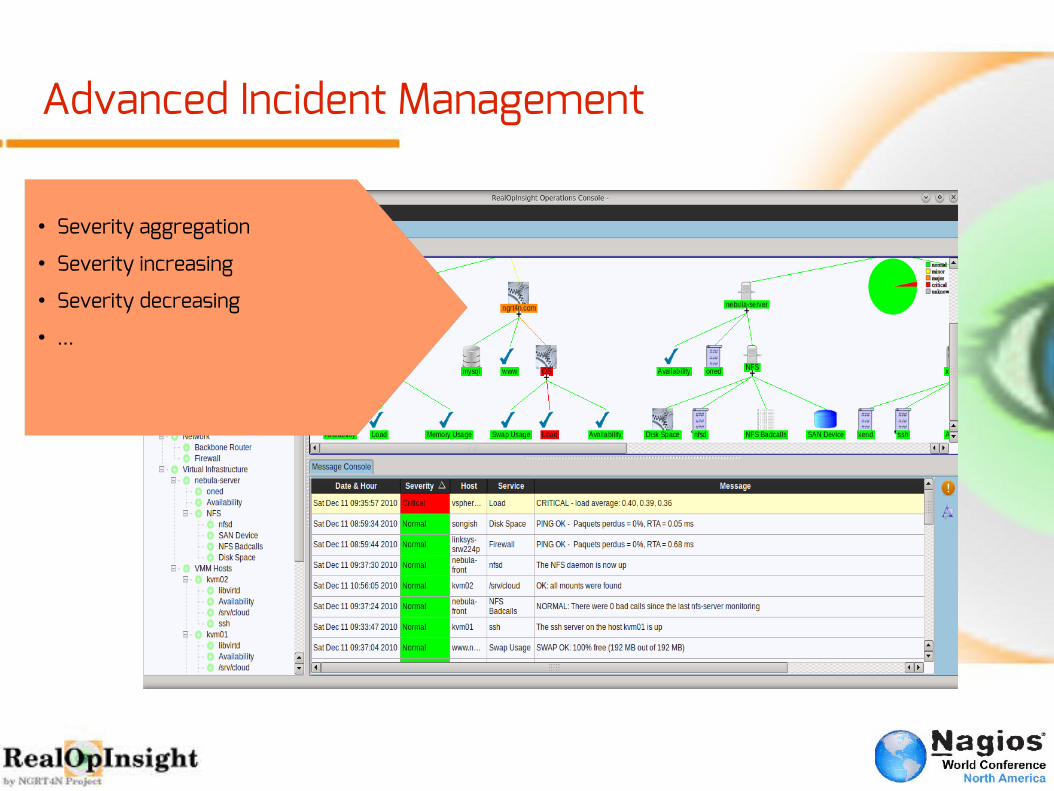
Advanced Incident Management
● Severity aggregation● Severity increasing● Severity decreasing● ...
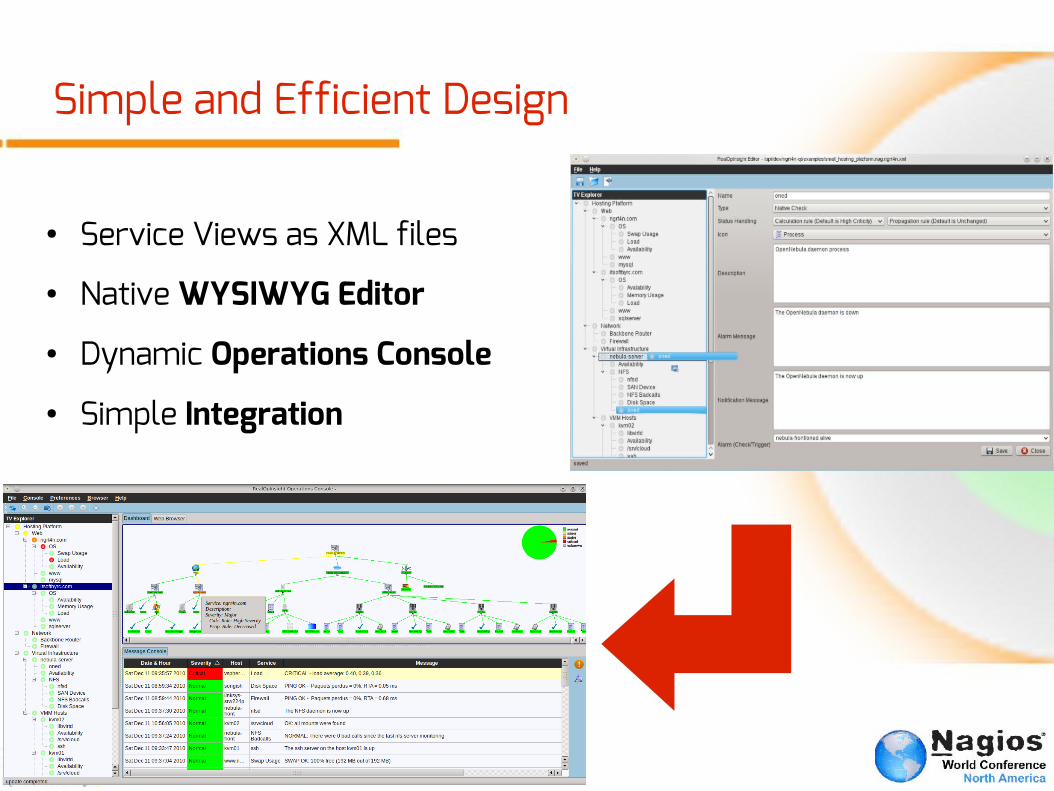
Simple and Efficient Design
● Service Views as XML files
● Native WYSIWYG Editor
● Dynamic Operations Console
● Simple Integration
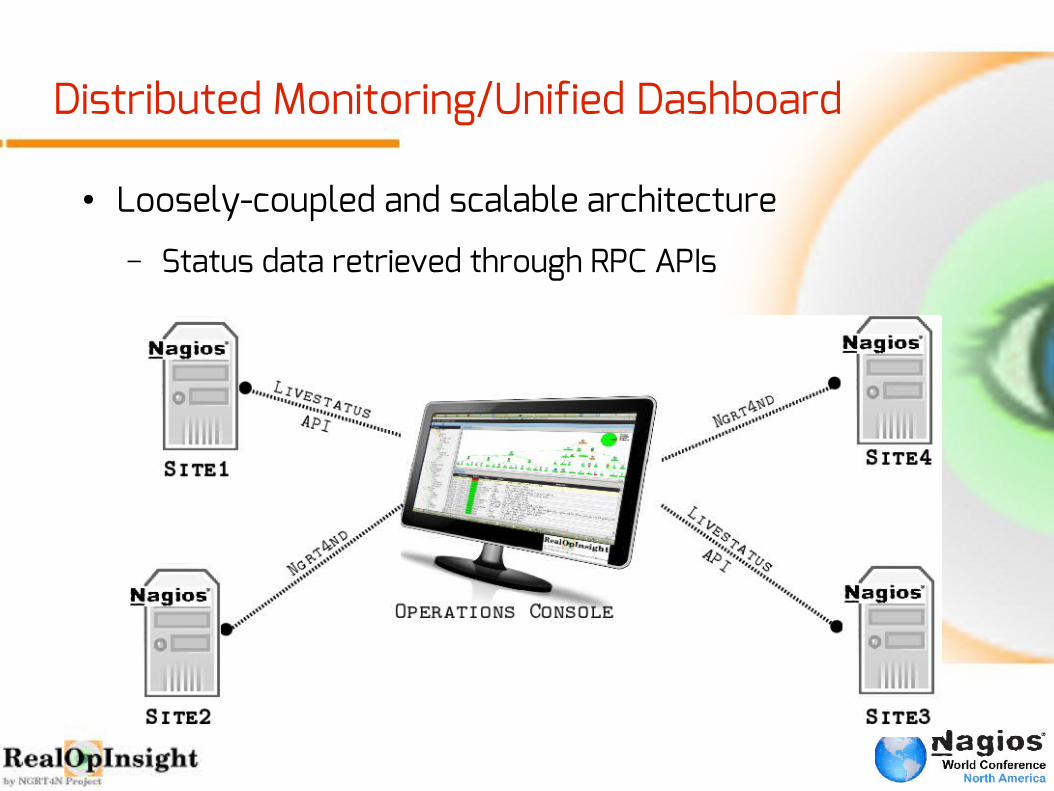
Distributed Monitoring/Unified Dashboard
● Loosely-coupled and scalable architecture
– Status data retrieved through RPC APIs
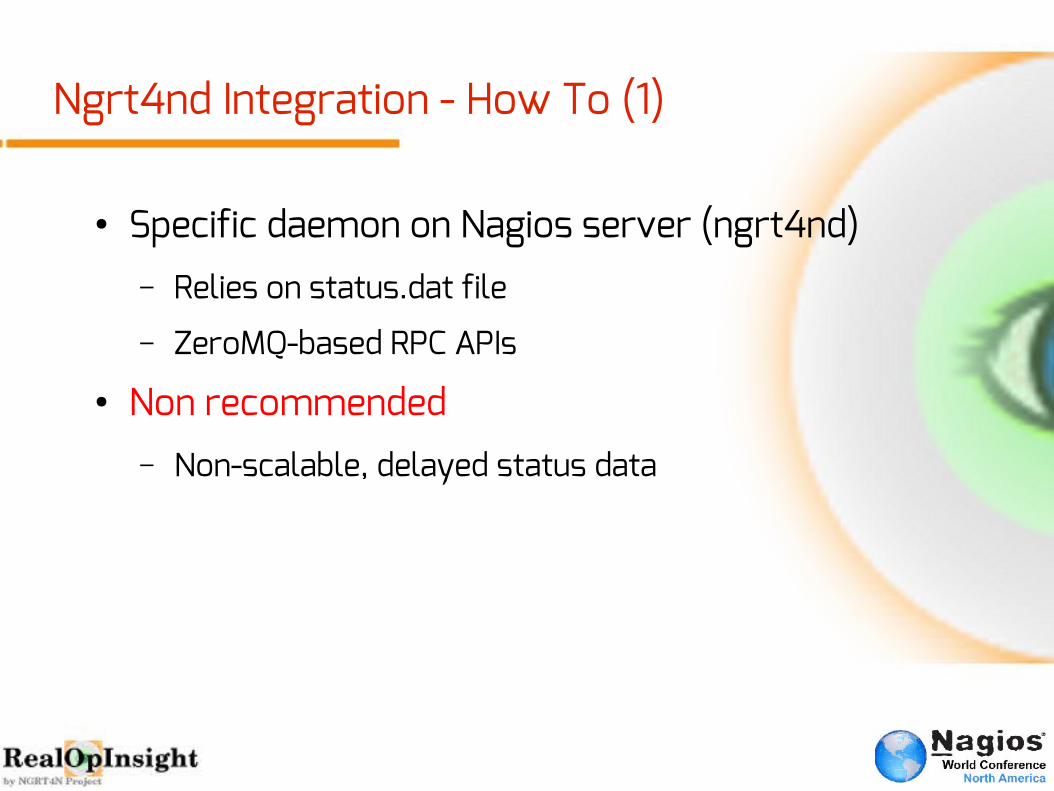
Ngrt4nd Integration - How To (1)
● Specific daemon on Nagios server (ngrt4nd)– Relies on status.dat file
– ZeroMQ-based RPC APIs
● Non recommended– Non-scalable, delayed status data

Livestatus Integration - How To (2)
● Xinetd TCP-based data retrieving – Xinetd socket over the native LS NEB socket
– /etc/xinetd.d/livestatus
● Recommended– Scalable, NEB up-to-date data→
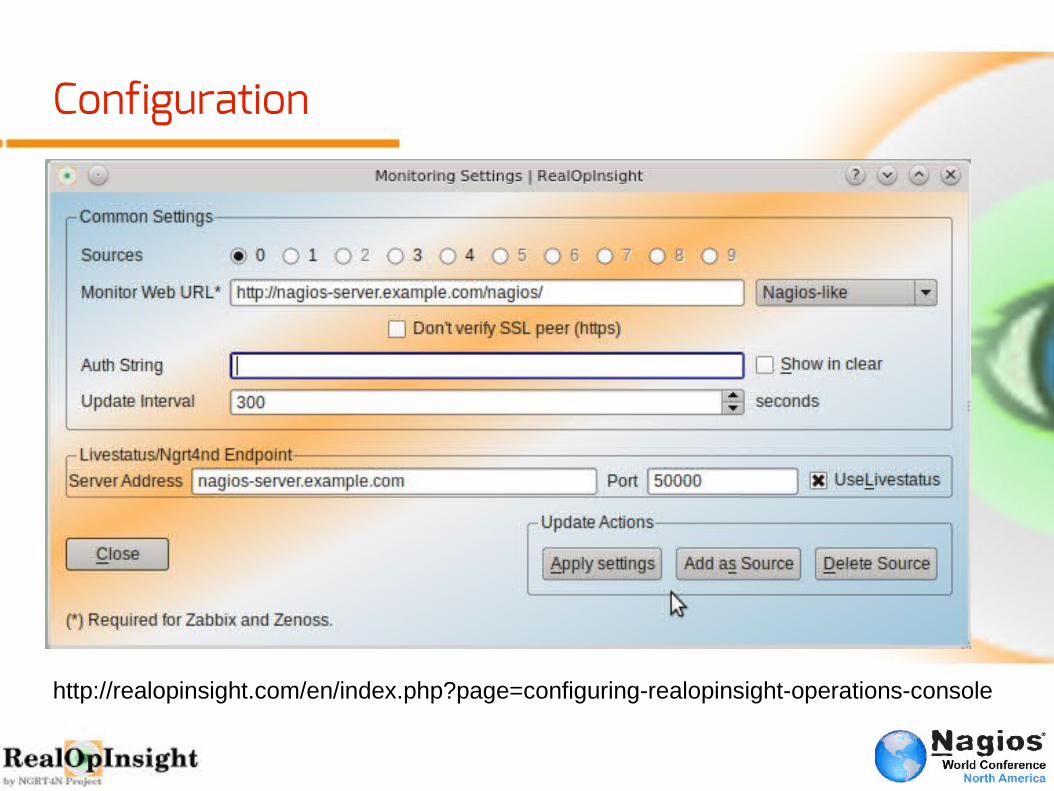
Configuration
http://realopinsight.com/en/index.php?page=configuring-realopinsight-operations-console
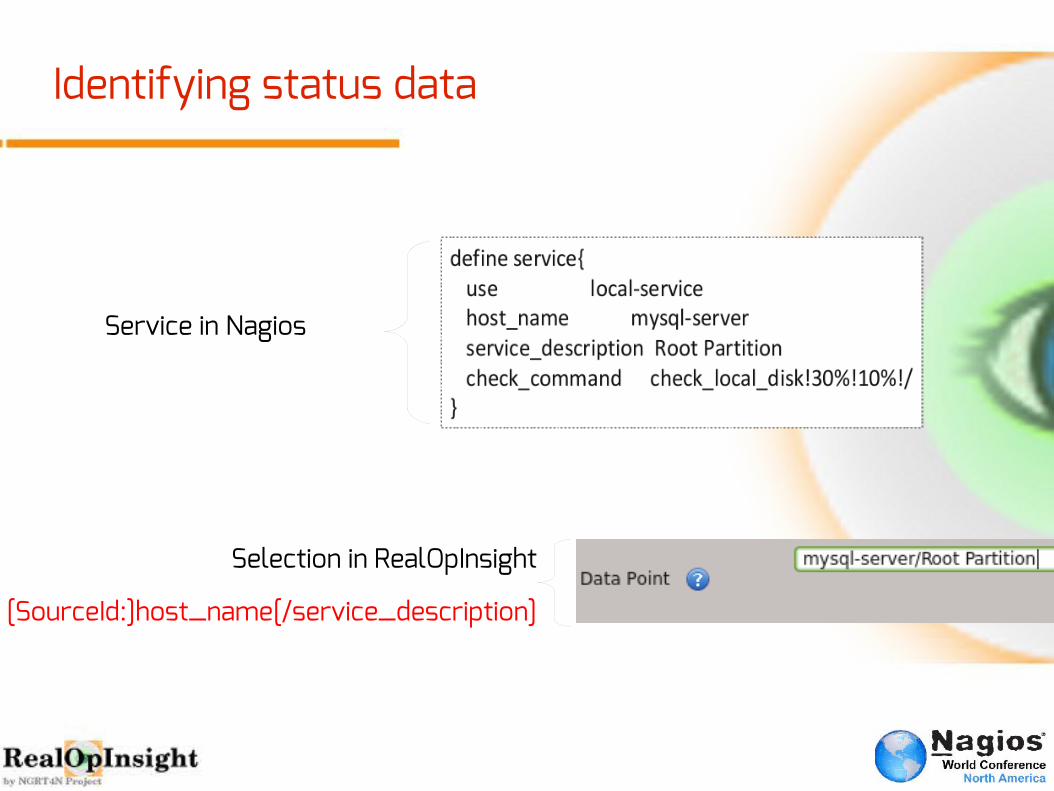
Identifying status data
Service in Nagios
Selection in RealOpInsight
[SourceId:]host_name[/service_description]
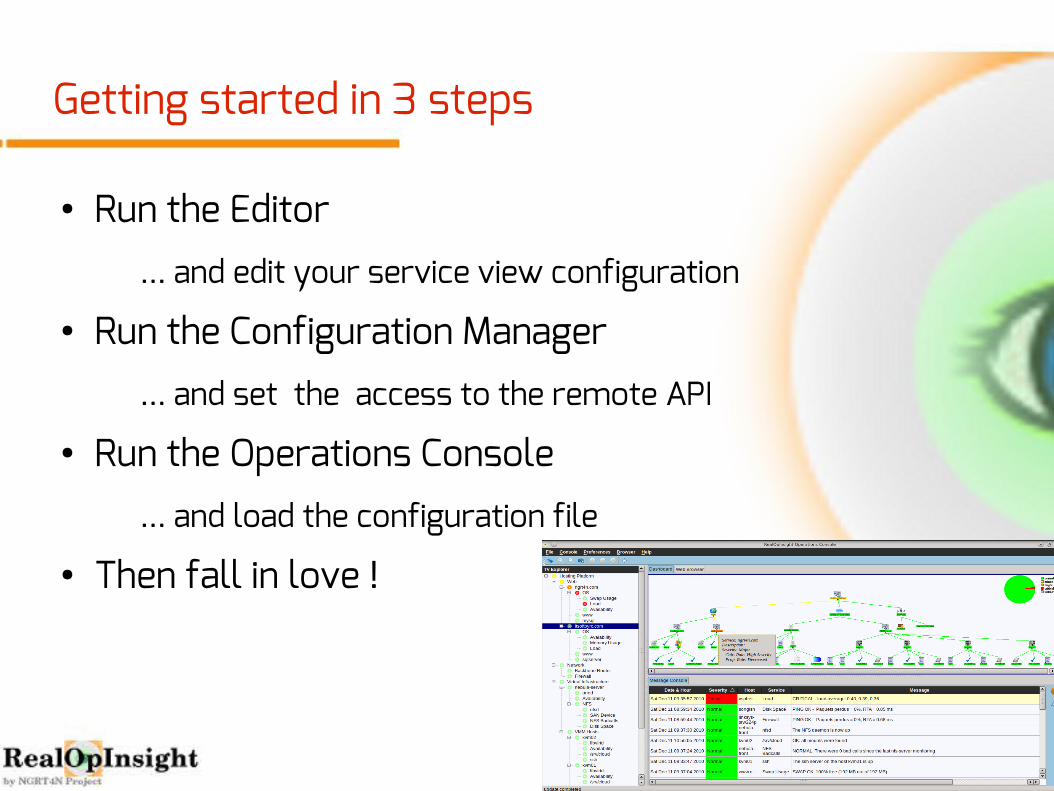
Getting started in 3 steps
● Run the Editor
… and edit your service view configuration
● Run the Configuration Manager
… and set the access to the remote API
● Run the Operations Console
… and load the configuration file
● Then fall in love !
History: The birth
● 2008 : the Idea
● May 2010 : 1st lines of code
● March 2011 (1st release, 1.0)
– <30 downloads a month● May - August 2012 (version 2.0)
– New architecture, GPLv3 License
– SourceForge.net, Nagios Exchange
– Windows Installer
– 200 downloads a month
Today: The life cycle
● A major release every 3/4 months
– V2.1, December 2012
– V2.2, March 2013
– V2.3, May 2013 (Support for Livestatus API)
– V2.4, September 2013 (support for distributed environments)● Downloads and statistics
– Source tarballs, Binaries for Windows, Fedora, openSUSE, Debian
– ~7k+ downloads from 120+ countries, last 12 months
– 700+ downloads a month– Nagios Affiliate

And the story continues..., Thanks
● 2014 : Web Edition
http://realopinsight.com/index.php?page=contribute
@ngrt4n
http://fr.linkedin.com/in/rodriguechakode