Effect of compositional variability of distillers’ grains on cellulosic ethanol ... ·...
9
Effect of compositional variability of distillers’ grains on cellulosic ethanol production Youngmi Kim a , Rick Hendrickson a , Nathan S. Mosier a , Michael R. Ladisch a, * , Bryan Bals b , Venkatesh Balan b , Bruce E. Dale b , Bruce S. Dien c , Michael A. Cotta c a Laboratory of Renewable Resources Engineering, Potter Engineering Center, 500 Central Drive, Purdue University, West Lafayette, IN 47907-2022, United States b Biomass Conversion Research Laboratory, Department of Chemical Engineering and Material Science, Michigan State University, 3270 Engineering Building, East Lansing, MI 48824, United States c National Center for Agricultural Utilization Research, USDA Agricultural Research Service, 1815 North University Street, Peoria, IL 61604, United States article info Article history: Received 12 March 2009 Received in revised form 11 February 2010 Accepted 11 February 2010 Available online 12 March 2010 Keywords: Distillers’ grains DDGS Ethanol Inhibition Xylose fermentation abstract In a dry grind ethanol plant, approximately 0.84 kg of dried distillers’ grains with solubles (DDGS) is pro- duced per liter of ethanol. The distillers’ grains contain the unhydrolyzed and unprocessed cellulosic frac- tion of corn kernels, which could be further converted to ethanol or other valuable bioproducts by applying cellulose conversion technology. Its compositional variability is one of the factors that could affect the overall process design and economics. In this study, we present compositional variability of dis- tillers’ grains collected from four different dry grind ethanol plants and its effect on enzymatic digestibil- ity and fermentability. We then selected two sources of distillers grains based on their distinctive compositional difference. These were pretreated by either controlled pH liquid hot water (LHW) or ammonia fiber expansion (AFEX) and subjected to enzymatic hydrolysis and fermentation. Fermentation of the pretreated distillers’ grains using either industrial yeast or genetically engineered glucose and xylose co-fermenting yeast, yielded 70–80% of theoretical maximum ethanol concentration, which varied depending on the batch of distillers’ grains used. Results show that cellulose conversion and ethanol fer- mentation yields are affected by the compositions of distillers’ grains. Distillers’ grains with a high extrac- tives content exhibit a lower enzymatic digestibility but a higher fermentability. Ó 2010 Elsevier Ltd. All rights reserved. 1. Introduction In response to the rapidly growing demand for fuel ethanol, US ethanol production capacity has achieved 10 billion gallons per year in 2009. Additional production capacity is currently under construction (RFA Annual Ethanol Industry Outlook, 2010). Most of the corn ethanol is produced via dry grind processes (approxi- mately 80%) while the remainder is produced via wet milling. In a dry grind ethanol plant, corn is ground and the corn starch is hydrolyzed and fermented to produce ethanol. The unutilized, and unfermented components of the corn kernel, which are mostly hull (fiber), germ, and protein, are marketed as DDG (dried distill- ers’ grains), DDGS (dried distillers’ grains with soluble), WDG (wet distillers’ grains, wet cake) and CDS (condensed distillers’ soluble or syrup). Due to their high nutritional value, these co-products have been mainly utilized as supplementary livestock feed. Most studies, therefore, have focused on their application as an alterna- tive protein and nutrients source in livestock diet (Klopfenstein et al., 2008; Koster, 2007; Lumpkins et al., 2004). As the production of ethanol grows, the amount of co-products from the biorefineries also increases. According to the US grains council and RFA, the pro- duction of DDGS, the major co-product of dry milling process, from the corn biorefineries reached 25 million metric tons in 2009, and is expected to climb further in the near future (RFA Annual Ethanol Industry Outlook, 2010). Considering the expected increase of tra- ditional co-products output from the expanding corn-to-ethanol biorefineries, it is critical to identify and develop new value added co-products that will open up new markets for fermentation by- products. While the production of fuel ethanol from corn is a mature tech- nology, research is ongoing to further improve process economics and long-term competitiveness of the industry by developing high- er quality hybrid corn seed varieties (Weller et al., 1988; Murthy et al., 2008), improving process efficiency for more gallon of etha- nol per bushel of corn processed (Kim et al., 2008a,b; Dien et al., 2008; Lau et al., 2008; Sharma et al., 2008; Srinivasan et al., 2007; Bals et al., 2006; Bothast and Schlicher, 2005), and identify- ing new applications for current co-products (Sharma et al., 2008; Selling and Woods, 2008; Wang et al., 2008; West and Nemmers, 0960-8524/$ - see front matter Ó 2010 Elsevier Ltd. All rights reserved. doi:10.1016/j.biortech.2010.02.054 * Corresponding author. E-mail address: [email protected] (M.R. Ladisch). Bioresource Technology 101 (2010) 5385–5393 Contents lists available at ScienceDirect Bioresource Technology journal homepage: www.elsevier.com/locate/biortech
Transcript of Effect of compositional variability of distillers’ grains on cellulosic ethanol ... ·...

Bioresource Technology 101 (2010) 5385–5393
Contents lists available at ScienceDirect
Bioresource Technology
journal homepage: www.elsevier .com/locate /bior tech
Effect of compositional variability of distillers’ grains on cellulosicethanol production
Youngmi Kim a, Rick Hendrickson a, Nathan S. Mosier a, Michael R. Ladisch a,*, Bryan Bals b,Venkatesh Balan b, Bruce E. Dale b, Bruce S. Dien c, Michael A. Cotta c
a Laboratory of Renewable Resources Engineering, Potter Engineering Center, 500 Central Drive, Purdue University, West Lafayette, IN 47907-2022, United Statesb Biomass Conversion Research Laboratory, Department of Chemical Engineering and Material Science, Michigan State University, 3270 Engineering Building, East Lansing,MI 48824, United Statesc National Center for Agricultural Utilization Research, USDA Agricultural Research Service, 1815 North University Street, Peoria, IL 61604, United States
a r t i c l e i n f o
Article history:Received 12 March 2009Received in revised form 11 February 2010Accepted 11 February 2010Available online 12 March 2010
Keywords:Distillers’ grainsDDGSEthanolInhibitionXylose fermentation
0960-8524/$ - see front matter � 2010 Elsevier Ltd. Adoi:10.1016/j.biortech.2010.02.054
* Corresponding author.E-mail address: [email protected] (M.R. Ladisch
a b s t r a c t
In a dry grind ethanol plant, approximately 0.84 kg of dried distillers’ grains with solubles (DDGS) is pro-duced per liter of ethanol. The distillers’ grains contain the unhydrolyzed and unprocessed cellulosic frac-tion of corn kernels, which could be further converted to ethanol or other valuable bioproducts byapplying cellulose conversion technology. Its compositional variability is one of the factors that couldaffect the overall process design and economics. In this study, we present compositional variability of dis-tillers’ grains collected from four different dry grind ethanol plants and its effect on enzymatic digestibil-ity and fermentability. We then selected two sources of distillers grains based on their distinctivecompositional difference. These were pretreated by either controlled pH liquid hot water (LHW) orammonia fiber expansion (AFEX) and subjected to enzymatic hydrolysis and fermentation. Fermentationof the pretreated distillers’ grains using either industrial yeast or genetically engineered glucose andxylose co-fermenting yeast, yielded 70–80% of theoretical maximum ethanol concentration, which varieddepending on the batch of distillers’ grains used. Results show that cellulose conversion and ethanol fer-mentation yields are affected by the compositions of distillers’ grains. Distillers’ grains with a high extrac-tives content exhibit a lower enzymatic digestibility but a higher fermentability.
� 2010 Elsevier Ltd. All rights reserved.
1. Introduction
In response to the rapidly growing demand for fuel ethanol, USethanol production capacity has achieved 10 billion gallons peryear in 2009. Additional production capacity is currently underconstruction (RFA Annual Ethanol Industry Outlook, 2010). Mostof the corn ethanol is produced via dry grind processes (approxi-mately 80%) while the remainder is produced via wet milling. Ina dry grind ethanol plant, corn is ground and the corn starch ishydrolyzed and fermented to produce ethanol. The unutilized,and unfermented components of the corn kernel, which are mostlyhull (fiber), germ, and protein, are marketed as DDG (dried distill-ers’ grains), DDGS (dried distillers’ grains with soluble), WDG (wetdistillers’ grains, wet cake) and CDS (condensed distillers’ solubleor syrup). Due to their high nutritional value, these co-productshave been mainly utilized as supplementary livestock feed. Moststudies, therefore, have focused on their application as an alterna-tive protein and nutrients source in livestock diet (Klopfenstein
ll rights reserved.
).
et al., 2008; Koster, 2007; Lumpkins et al., 2004). As the productionof ethanol grows, the amount of co-products from the biorefineriesalso increases. According to the US grains council and RFA, the pro-duction of DDGS, the major co-product of dry milling process, fromthe corn biorefineries reached 25 million metric tons in 2009, andis expected to climb further in the near future (RFA Annual EthanolIndustry Outlook, 2010). Considering the expected increase of tra-ditional co-products output from the expanding corn-to-ethanolbiorefineries, it is critical to identify and develop new value addedco-products that will open up new markets for fermentation by-products.
While the production of fuel ethanol from corn is a mature tech-nology, research is ongoing to further improve process economicsand long-term competitiveness of the industry by developing high-er quality hybrid corn seed varieties (Weller et al., 1988; Murthyet al., 2008), improving process efficiency for more gallon of etha-nol per bushel of corn processed (Kim et al., 2008a,b; Dien et al.,2008; Lau et al., 2008; Sharma et al., 2008; Srinivasan et al.,2007; Bals et al., 2006; Bothast and Schlicher, 2005), and identify-ing new applications for current co-products (Sharma et al., 2008;Selling and Woods, 2008; Wang et al., 2008; West and Nemmers,
5386 Y. Kim et al. / Bioresource Technology 101 (2010) 5385–5393
2008; Tatara et al., 2008; Romero et al., 2007). Recently, significantcollaborative efforts have been put forth to add value to distiller’sgrains by further processing them into fermentable sugars, ethanol,and a protein rich co-product. These studies were published in aspecial edition of Bioresource Technology journal (Ricke et al.,2008).
In processing cellulosic biomass to produce ethanol in a largescale, it is important to supply a feedstock of consistent composi-tion and characteristics to maintain a constant productivity andyield of fuel ethanol. Composition of distiller’s grains is expectedto vary depending upon the composition of feedstock corn kernels,manufacturing plant process efficiency and design. If distillers’grains were to vary significantly depending upon its origin anddry grind facilities, this variability would complicate design andimplementation of process modifications as well as estimates ofits economics.
Compositional variability of distillers’ grains was extensivelystudied by several researchers (Belyea et al., 2004; Spiehs et al.,2002). However, these studies were mainly focused on the compo-sition of DDGS only and its nutritional value, as its main utilizationhas been as animal feed. An extensive compositional analysis ofdifferent types of dry grind co-products including DDGS, WDGand thin stillage as a source of additional fermentable sugars to in-crease overall bioethanol production has been completed by Kimet al. (2008a). Thin stillage is also an important dry grind co-prod-uct that has a significant role in cellulose conversion technology. Itcan be used as a recycle water stream for the pretreatment andhydrolysis stages to minimize the fresh water consumption inthe overall process (Kim et al., 2008c). The study has shown thatdistillers’ grains contain as much as 30–35% wt/wt carbohydrates,which are available for fermentation to ethanol. However, only onespecific batch of each co-product obtained from a single dry grindfacility was utilized.
In this study, we examine compositional variability of variousdry milling co-products, such as DDGS, WDG, and thin stillage, col-lected from four different dry grind ethanol plants in the Midwest-ern area of US, all located in Corn Belt states. Two separate batchesof distillers’ grains samples with significant compositional differ-ences were further studied and compared in terms of enzymaticdigestibility and fermentability. The selection of the two differentsamples was based on rationale that differences in processingand fermentation yield would be most readily observed for distill-ers’ grain with significant compositional differences. Enzymaticdigestibility and fermentability of those selected distillers’ grainswere further examined by applying different types of pretreatmenttechnologies (liquid hot water or ammonia fiber expansion),hydrolysis methods (low or high solids loadings; with or withoutsupplementary xylanase enzymes), and yeast strains (industrialyeast or xylose-fermenting recombinant yeast) for fermentationin consideration of various conditions applicable in cellulosic eth-anol production.
2. Methods
2.1. Materials
DDGS, wet distiller’s grains (WDG or wet cake), and thin stillagewere obtained from four different dry grind facilities, all located inthe Midwestern US, and each owned and operated independently.Annual ethanol production capacity of the selected dry grind facil-ities ranges from 50 to 110 million gallon per year.
Spezyme CP (cellulase) and Multifect Pectinase PE were pro-vided by Genencor International, Inc. (Rochester, NY) and Nov-ozym 188 (b-glucosidase, Novo Nordisk, Novo Allé, Denmark)was purchased from Sigma (Cat. No. C6150). Depol 740L (feruloyl
esterase) was provided by Biocatalysts Enzymes (Wales, UK). Allother reagents and chemicals, unless otherwise noted, were pur-chased from Sigma–Aldrich (St. Louis, MO).
2.2. Compositional analysis
Composition of the collected DDGS, WDG, and stillage sampleswere analyzed by procedures (cellulosic biomass compositionalanalyses) described in Kim et al. (2008a). The components ana-lyzed were extractives, crude protein, glucan, xylan, arabinan andash. Each sample was analyzed for complete compositions by threedifferent laboratories. All measurements were in triplicates. Thevalues obtained were averaged and errors were calculated at the95% confidence level using Microsoft Excel. The F test in single fac-tor analysis of variance (ANOVA) was carried out in order to testthe significance of the variability of the components. Statisticalanalysis was done by Data Analysis Tool pack in Microsoft Excel.The p values of <0.05 were considered as significant.
2.3. Pretreatment
Two different pretreatment technologies were applied: liquidhot water (LHW) pretreatment and ammonia fiber expansion(AFEX) on the selected distillers’ grains with the most significantdifference in compositions to examine the compositional variabil-ity on enzymatic digestibility. All pretreatment runs were in tripli-cates. Error bars represent 95% CI of a mean.
2.3.1. Liquid hot water pretreatmentThe aqueous pretreatment of distillers’ grains consisted of mix-
ing the substrate with thin stillage at 15% solids loading (w/w, gdry solids per g total) and heating at 160 �C for 20 min underpressure in order to keep the water in a liquid state. Reactionswere conducted in 1 in. OD � 0.083 in. (2.54 cm � 2.1 mm) wallthickness, 316 stainless steel tubing capped at either end with 1in. (2.54 cm) Swagelok tube end fittings (Swagelok, Indianapolis,IN). Each tube was 4.5 in. (11.4 cm) in length and 45 mL in totalvolume. The sample volume was kept at 33.7 mL to give approx-imately 25% of head space for liquid expansion during heating to160 �C (Kim et al., 2009). The reactor tube containing the slurry ofdistillers’ grains and thin stillage was heated by placing it in a Te-cam� SBL-1 fluidized sand bath (Cole-Parmer, Vernon Hills, IL) setto 160 �C for 24 min, which included a 4 min heat-up and 20 minreaction time. After pretreatment, each tube was cooled byquenching in water and transferring to an ice-water slurry. Thepretreated material was enzymatically hydrolyzed and fermentedas described in the following sections.
2.3.2. Ammonia fiber expansion (AFEX) treatmentThe AFEX pretreatment process was performed in a 300 mL 316
stainless steel pressure vessel. For each batch, 40 g dry weight ofdistillers’ grains at 60% moisture content (total weight basis) wasadded to the vessel. Glass spheres were added to minimize voidspace, thereby minimizing the amount of ammonia in the vaporphase within the reactor. The reactor was sealed and charged withammonia by connecting a pressure cylinder containing 15.0 g of li-quid anhydrous ammonia. Approximately 1 g of ammonia re-mained in the sample cylinder after charging, so that the totalammonia loading was 0.80:1 g/g dry biomass. The reactor washeated to 90 �C using a 400 W PARR heating mantle (Parr Instru-ment Company, Moline, IL), requiring between 14 and 18 min,and allowed to stand at a constant temperature (±2 �C) for 5 min.At these conditions, the final pressure of the reactor ranged from350 to 430 psi. The pressure was explosively released by rapidlyturning the exhaust valve. The treated biomass was removed andplaced in a fume hood overnight to evaporate residual ammonia.

Y. Kim et al. / Bioresource Technology 101 (2010) 5385–5393 5387
Multiple batches were combined and thoroughly mixed beforebeing used for future experiments.
2.4. Enzymatic hydrolysis test
Enzymatic digestibility of the pretreated distillers’ grains wasexamined at a very low solids loading (5% w/w) as well as at ahigher dry solids loading (15%). The low solids hydrolysis was tomeasure digestibility of biomass with minimal end-product inhibi-tion during the hydrolysis, while the higher solids hydrolysis wasto measure saccharification yield at a more economically feasiblelevel. All hydrolysis runs were in triplicates. Error bars represent95% CI of a mean.
2.4.1. Low-solids enzymatic hydrolysisEnzymatic saccharification of LHW or AFEX pretreated distillers’
grains were done by following a modified LAP 009 procedure(Brown and Torget, 1996). The procedure was modified by scal-ing-up the masses and volumes by a factor of 10. The materialwas used as is without grinding. Enzyme loading for the hydrolysiswas 15 FPU of Spezyme CP cellulase activity and 40 CBU of Nov-ozym 188 b-glucosidase activity per g glucan (equivalent to32 mg total protein per g glucan or 6.4 mg total protein per g drysubstrate). Enzymes and the pretreated substrate at about 5% drysolids loading (w/w) were added to 250 mL Nalgene bottles andthe bottles placed in a New Brunswick Scientific model G24 Envi-ronmental Incubator Shaker (Edison, NJ) set at 50 �C and an agita-tion rate of 200 rpm. The pretreated slurry was allowed to digest at50 �C for up to 72 h. A 1.0 mL sample was removed at regular inter-vals for the analysis.
2.4.2. High-solids enzymatic hydrolysisDistillers’ grains, pretreated at a solids level of 15% dry solids w/
w, was hydrolyzed by Spezyme CP at 15 FPU cellulase and Nov-ozym 188 at 40 CBU b-glucosidase per g glucan. In some cases sup-plementary xylanses were added: Multifect Pectinase at 50 Uxylanase and Depol 740L at 2 U feruloyl esterase per g dry solids.The entire slurry of the high dry solids pretreated distillers’ grainswas subjected to the hydrolysis without any further dilution. ThepH of the LHW pretreated distillers’ grains was about 4.5 whichis already close to the optimal pH of the cellulase enzymes. Hydro-lysis was carried out without adjusting the pH, at 50 �C and200 rpm. Duration of the hydrolysis was varied depending on theexperiment. Further details are presented in the Section 3.
2.5. Fermentability test
Fermentability of enzymatically hydrolyzed distillers’ grainswas examined using two different yeast strains: industrial Saccha-romyces cerevisiae D5A and Saccharomyces cerevisiae 424A (LNH-ST). The latter is a genetically modified glucose–xylose co-ferment-ing yeast developed by Dr. Nancy Ho of Purdue University.
Distillers’ grains, pretreated as described previously, was pre-hydrolyzed at 15% dry solids loading (w/w) by cellulase enzymesat a loading of 32 mg total protein per g glucan (15 FPU SpezymeCP and 40 CBU Novo 188 per g glucan) for 24 h. The hydrolysisconditions were as described in the previous section. After 24 hthe entire hydrolysate (100 mL total volume) was transferred intoside-arm flask, pH adjusted to 5.5–6.0 with ammonium hydroxide,then inoculated with either S. cerevisiae D5A or S. cerevisiae 424A(LNH-ST).
For inocula generation, 8 mL of seed culture were used to inoc-ulate 100 mL YEPD (YEP plus 2% glucose) in a 500 mL baffled Erlen-meyer flask equipped with a side-arm. The inoculation cultureswere incubated in a shaker at 28 �C and 200 rpm and grownaerobically for 24 h (final O.D. 500–550 KU). The yeast was
harvested by centrifugation at 3000g for 5 min at room temperature.The supernatant was discarded and the cells were transferred intoa 300 mL baffled Erlenmeyer flask containing the WDG hydrolysate.The flasks were subsequently sealed with Saran plastic wrap to al-low fermentation to be carried out micro-aerobically. The SSF wascarried out at 28 �C, 200 rpm for 72 h. At regular intervals 1 mLsamples of the culture were removed for monitoring the fermenta-tion. All fermentations were run in duplicate. Error bars represent95% CI of a mean.
2.6. HPLC analysis
Measurements of sugars, ethanol, and fermentation by-prod-ucts were performed using a HPLC system consisting of a Varian9010 Solvent Delivery System, Waters 717plus Auto sampler,Aminex HPX-87H column (Biorad, Hercules, CA), Waters2414Refractive Index Detector, Waters 2487 Dual k AbsorbanceDetector, and a Hewlett Packard HP3396G Integrator. The mobilephase was 5 mM H2SO4 filtered through 0.2 lm nylon filter (Milli-pore) and degassed. The mobile phase flow rate was 0.6 mL/minand the column temperature was maintained at 60 �C by an Eppen-dorf CH-30 Column Heater controlled by an Eppendorf TC-50.
3. Results and discussion
3.1. Compositional variability of DDGS, WDG and thin stillage
Compositions of DDGS, WDG and thin stillage collected fromfour different dry grind ethanol plants are summarized inTable 1A. The values are the average of data provided by PurdueUniversity, Michigan State University (MSU), and the National Cen-ter for Agricultural Research (NCAUR). DDGS were uniform in com-position; the average coefficient of variation for all componentswas less than 5.7%. Ether extractives (mostly oil) content was onaverage 11.7 ± 0.7% and crude protein 30.1 ± 1.4%. Glucan contentwas 18.2–20.1% which was divided between cellulose (2/3) andresidual starch (1/3). The hemicellulose fraction was 15.8–18.0%.If combined, this gives 35–39% of total carbohydrates.
The mass closure was excellent with over 95% of the mass ac-counted for the distillers’ grains. The 110% mass closure on sample4 is due to some of components in the water extractives being dou-ble-counted. The water extractives are mostly residual mono- andoligo-saccharides, organic acids, and fermentation by-products.Kim et al. (2008a,b,c) found that about 10% of the total proteinand carbohydrates were recovered during the hot water extraction.This explains the mass balance of over 100% for all DDGS samplesand WDG sample 4 in Table 1(A), all of which contain evaporatedstillage.
As shown in the ANOVA test P-values in Table 1(C) and (D), glu-can, xylan and ash contents in the four different DDGS sampleswere not statistically different while the major difference was inthe extractives content among the samples. The ANOVA analysisbetween the samples indicated that the #4 DDGS sample’s extrac-tives content is significantly different from the other samples at thep < 0.05 level. Comparisons between WDG samples also showedthat #4 WDG is statistically different from other samples in termsof xylan, ash, protein and extractives contents. With the exceptionof sample #4, all the other three WDG samples were found to havesimilar compositions. The WDG sample #4 contained greateramounts of water and ether extractives and less carbohydrate thanother WDG samples. In particular water extractives content, whichare mostly fermentation by-products, soluble sugars, soluble pro-teins, and organic acids, was more than three times greater thanmeasured for the other WDG samples. In a conventional dry grindfacility, evaporated stillage, which is generally referred as ‘‘syrup”,

Table 1Compositions of various dry grind co-products collected from four different dry grind plants. (A) Compositions of DDGS and WDG by% dry weight (B) thin stillage by concentrationin g/L and (C) ANOVA test p-values of DDGS and WDG compositions comparisons at significance level of 0.05. Compositions numbers are average of Purdue, MSU and USDA-NCAUR results. Errors in 95% CI are less than 6% for all values.
(A) DDGS WDG (wet cake)
1 2 3 4 1 2 3 4
Dry matter (%) 90.3 90.7 90.0 90.4 36.9 36.1 36.2 51.7Water extractives (%) 23.1 23.0 24.6 21.7 7.8 8.4 8.7 31.9Ether extractives (%) 12.0 12.3 11.8 10.7 8.7 8.5 7.9 12.7Crude protein (%) 28.0 31.1 30.4 30.9 33.3 35.6 35.5 28.7Glucan (total) (%) 20.1 18.2 19.0 18.3 20.2 18.8 19.6 17.6Starch (%) 6.1 4.7 6.1 5.9 5.5 4.2 4.7 5.8Cellulose (%) 14.0 13.5 12.9 12.4 14.7 14.5 14.9 11.9Xylan and arabinan (%) 18.0 16.4 15.8 16.7 23.1 21.4 21.0 14.9Xylan (%) 11.9 10.7 10.4% 10.8 14.4 13.5 13.4 9.7Arabinan (%) 6.2 5.7 5.5 5.8 8.8 7.8 7.7 5.2Ash (%) 4.69 4.52 4.37 4.50 2.23 2.19 2.04 5.55Total dry matter mass closure (%) 105.9 105.5 106.0 102.8 95.3 94.8 94.7 111.3
(B) Thin stillage
1 2 3
Glucan (g/L) 15.3 11.4 11.3Glucose (g/L) 0.2 0.1 3.7Xylan (g/L) 3.1 1.8 3.2Xylose (g/L) 0.9 1.0 0.0Arabinan (g/L) 1.3 1.1 1.0Arabinose (g/L) 0.2 0.2 0.2Glycerol (g/L) 15.6 16.7 17.9Acetic Acid (g/L) 0.9 0.9 0.9Ethanol (g/L) 0.6 0.5 0.8
(C) ANOVA test p-values
DDGS Glucan Xylan Protein Ash Water extractives Ether extractives
1 vs. 2 vs. 3 vs. 4 0.310 0.306 0.045 0.393 0.003 0.0001 vs. 2 >0.05 >0.05 0.004 >0.05 0.876 0.0111 vs. 3 >0.05 >0.05 0.056 >0.05 0.069 0.6351 vs. 4 >0.05 >0.05 0.060 >0.05 0.001 0.0032 vs. 3 >0.05 >0.05 0.418 >0.05 0.084 0.0022 vs. 4 >0.05 >0.05 0.830 >0.05 0.020 0.0013 vs. 4 >0.05 >0.05 0.711 >0.05 0.008 0.003
WDG Glucan Xylan Protein Ash Water extractives Ether extractives
1 vs. 2 vs. 3 vs. 4 0.343 0.036 0.012 3.2E-05 7.9E-15 6.4E-081 vs. 2 >0.05 0.559 0.277 0.662 0.279 0.2791 vs. 3 >0.05 0.499 0.291 0.318 0.002 0.4811 vs. 4 >0.05 0.026 0.064 0.001 3.6E-08 1.2E-042 vs. 3 >0.05 0.886 0.933 0.422 0.012 0.0012 vs. 4 >0.05 0.021 0.014 0.001 2.0E-08 3.6E-063 vs. 4 >0.05 0.031 0.013 0.002 1.8E-08 1.2E-06
5388 Y. Kim et al. / Bioresource Technology 101 (2010) 5385–5393
is mixed with WDG prior to drying into DDGS. We believe thatsample #4 was taken after DG was mixed with thin stillage. Thisparticular sample was likely collected after mixing of the syrupand prior to drying step, as suggested from the significantly higherwater extractives content. The thin stillage consisted mainly of sol-uble gluco-oligomers and glycerol (Table 1B). In summary, thecompositional analysis showed that the WDG samples 1, 2, and 3are similar in compositions, while sample 4 exhibited significantlydifferent composition from the others.
Further studies were conducted using WDG samples #2 and #4to study the effect of the compositional variability on enzymaticdigestibility and fermentability. The #2 WDG sample was selectedas a representative sample of a normal WDG. The #4 WDG samplewas chosen as its composition was distinctively different from theother samples. The #4 WDG was of particular interest as it containssignificant amount of components that are accumulated in the pro-cess and dissolved in the ‘‘syrup”. Process water is commonly recy-cled in commercial ethanol plants and various fermentation by-products, including acetic acid and glycerol, accumulate (Galbeand Zacchi, 1992, 1994). As a result, these substances, which couldbe toxic to yeast fermentation, are present at high concentrations
in the evaporated stillage (syrup). Their concentrations are ex-pected to be even higher in a modified dry grind process that con-verts distillers’ grains to ethanol (Kim et al., 2008c). Therefore,sample 4 with its higher concentrations of condensed substances,enables us to examine their effect and compare WDG with its low-er extractives content.
3.2. Enzymatic digestibility test
Enzymatic digestibility of #2 and #4 WDG samples were testedat 5% dry solids loading (50 g dry solids/L or 10 g glucan/L) withcommercial cellulase enzymes. The enzyme loading was 15 FPUcellulase (Spezyme CP) and 40 IU b-glucosidase (Novozym 188)per g glucan. A low solids concentration was selected to minimizeinhibition effects due to end-products or other substances releasedduring the hydrolysis, as well as mass transfer resistance due tomixing difficulties. With reduced inhibition effects at this low sol-ids level, the yields were expected to reflect mainly intrinsic char-acteristics of the biomass, including those that limit access of thecellulase enzymes to cellulose, and whose effect is moderated bythe pretreatment (Zeng et al., 2007).
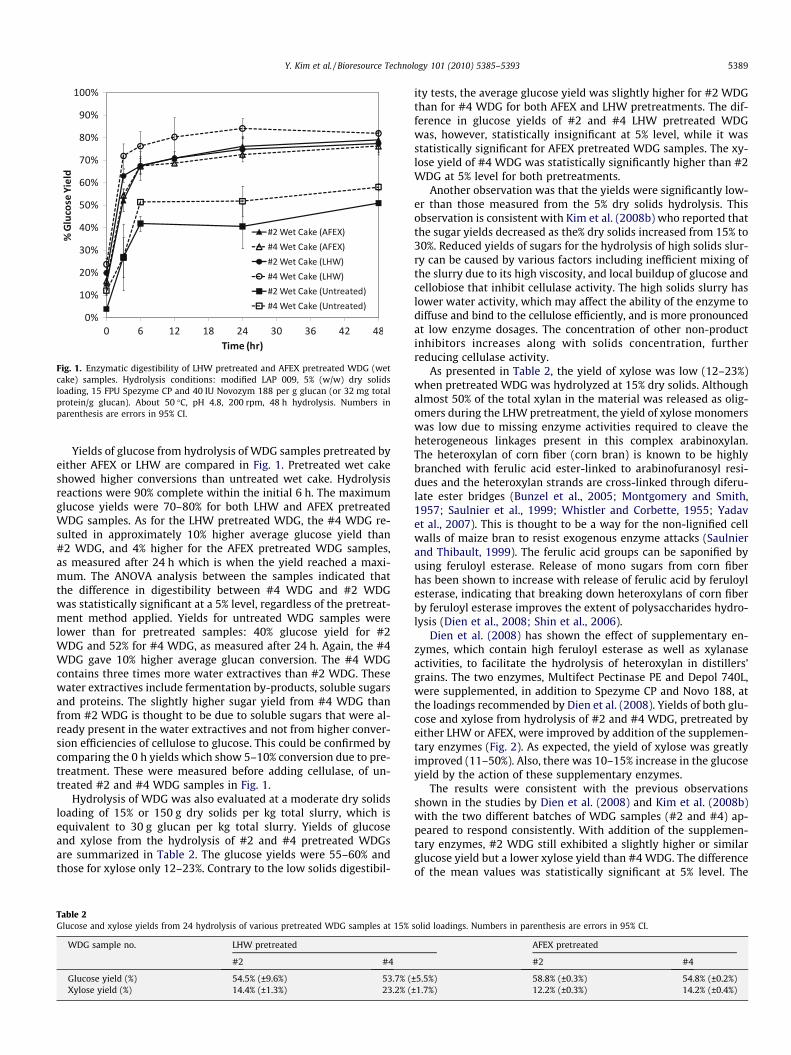
Fig. 1. Enzymatic digestibility of LHW pretreated and AFEX pretreated WDG (wetcake) samples. Hydrolysis conditions: modified LAP 009, 5% (w/w) dry solidsloading, 15 FPU Spezyme CP and 40 IU Novozym 188 per g glucan (or 32 mg totalprotein/g glucan). About 50 �C, pH 4.8, 200 rpm, 48 h hydrolysis. Numbers inparenthesis are errors in 95% CI.
Y. Kim et al. / Bioresource Technology 101 (2010) 5385–5393 5389
Yields of glucose from hydrolysis of WDG samples pretreated byeither AFEX or LHW are compared in Fig. 1. Pretreated wet cakeshowed higher conversions than untreated wet cake. Hydrolysisreactions were 90% complete within the initial 6 h. The maximumglucose yields were 70–80% for both LHW and AFEX pretreatedWDG samples. As for the LHW pretreated WDG, the #4 WDG re-sulted in approximately 10% higher average glucose yield than#2 WDG, and 4% higher for the AFEX pretreated WDG samples,as measured after 24 h which is when the yield reached a maxi-mum. The ANOVA analysis between the samples indicated thatthe difference in digestibility between #4 WDG and #2 WDGwas statistically significant at a 5% level, regardless of the pretreat-ment method applied. Yields for untreated WDG samples werelower than for pretreated samples: 40% glucose yield for #2WDG and 52% for #4 WDG, as measured after 24 h. Again, the #4WDG gave 10% higher average glucan conversion. The #4 WDGcontains three times more water extractives than #2 WDG. Thesewater extractives include fermentation by-products, soluble sugarsand proteins. The slightly higher sugar yield from #4 WDG thanfrom #2 WDG is thought to be due to soluble sugars that were al-ready present in the water extractives and not from higher conver-sion efficiencies of cellulose to glucose. This could be confirmed bycomparing the 0 h yields which show 5–10% conversion due to pre-treatment. These were measured before adding cellulase, of un-treated #2 and #4 WDG samples in Fig. 1.
Hydrolysis of WDG was also evaluated at a moderate dry solidsloading of 15% or 150 g dry solids per kg total slurry, which isequivalent to 30 g glucan per kg total slurry. Yields of glucoseand xylose from the hydrolysis of #2 and #4 pretreated WDGsare summarized in Table 2. The glucose yields were 55–60% andthose for xylose only 12–23%. Contrary to the low solids digestibil-
Table 2Glucose and xylose yields from 24 hydrolysis of various pretreated WDG samples at 15%
WDG sample no. LHW pretreated
#2 #4
Glucose yield (%) 54.5% (±9.6%) 53.7% (Xylose yield (%) 14.4% (±1.3%) 23.2% (
ity tests, the average glucose yield was slightly higher for #2 WDGthan for #4 WDG for both AFEX and LHW pretreatments. The dif-ference in glucose yields of #2 and #4 LHW pretreated WDGwas, however, statistically insignificant at 5% level, while it wasstatistically significant for AFEX pretreated WDG samples. The xy-lose yield of #4 WDG was statistically significantly higher than #2WDG at 5% level for both pretreatments.
Another observation was that the yields were significantly low-er than those measured from the 5% dry solids hydrolysis. Thisobservation is consistent with Kim et al. (2008b) who reported thatthe sugar yields decreased as the% dry solids increased from 15% to30%. Reduced yields of sugars for the hydrolysis of high solids slur-ry can be caused by various factors including inefficient mixing ofthe slurry due to its high viscosity, and local buildup of glucose andcellobiose that inhibit cellulase activity. The high solids slurry haslower water activity, which may affect the ability of the enzyme todiffuse and bind to the cellulose efficiently, and is more pronouncedat low enzyme dosages. The concentration of other non-productinhibitors increases along with solids concentration, furtherreducing cellulase activity.
As presented in Table 2, the yield of xylose was low (12–23%)when pretreated WDG was hydrolyzed at 15% dry solids. Althoughalmost 50% of the total xylan in the material was released as olig-omers during the LHW pretreatment, the yield of xylose monomerswas low due to missing enzyme activities required to cleave theheterogeneous linkages present in this complex arabinoxylan.The heteroxylan of corn fiber (corn bran) is known to be highlybranched with ferulic acid ester-linked to arabinofuranosyl resi-dues and the heteroxylan strands are cross-linked through diferu-late ester bridges (Bunzel et al., 2005; Montgomery and Smith,1957; Saulnier et al., 1999; Whistler and Corbette, 1955; Yadavet al., 2007). This is thought to be a way for the non-lignified cellwalls of maize bran to resist exogenous enzyme attacks (Saulnierand Thibault, 1999). The ferulic acid groups can be saponified byusing feruloyl esterase. Release of mono sugars from corn fiberhas been shown to increase with release of ferulic acid by feruloylesterase, indicating that breaking down heteroxylans of corn fiberby feruloyl esterase improves the extent of polysaccharides hydro-lysis (Dien et al., 2008; Shin et al., 2006).
Dien et al. (2008) has shown the effect of supplementary en-zymes, which contain high feruloyl esterase as well as xylanaseactivities, to facilitate the hydrolysis of heteroxylan in distillers’grains. The two enzymes, Multifect Pectinase PE and Depol 740L,were supplemented, in addition to Spezyme CP and Novo 188, atthe loadings recommended by Dien et al. (2008). Yields of both glu-cose and xylose from hydrolysis of #2 and #4 WDG, pretreated byeither LHW or AFEX, were improved by addition of the supplemen-tary enzymes (Fig. 2). As expected, the yield of xylose was greatlyimproved (11–50%). Also, there was 10–15% increase in the glucoseyield by the action of these supplementary enzymes.
The results were consistent with the previous observationsshown in the studies by Dien et al. (2008) and Kim et al. (2008b)with the two different batches of WDG samples (#2 and #4) ap-peared to respond consistently. With addition of the supplemen-tary enzymes, #2 WDG still exhibited a slightly higher or similarglucose yield but a lower xylose yield than #4 WDG. The differenceof the mean values was statistically significant at 5% level. The
solid loadings. Numbers in parenthesis are errors in 95% CI.
AFEX pretreated
#2 #4
±5.5%) 58.8% (±0.3%) 54.8% (±0.2%)±1.7%) 12.2% (±0.3%) 14.2% (±0.4%)

Fig. 2. Enzymatic digestibility of LHW pretreated and AFEX pretreated WDG (wetcake) with addition of supplementary enzymes (Multifect Pectinase PE and Depol740L). Hydrolysis conditions: 15% (w/w) dry solids loading, 50 �C, pH 4.8, 200 rpm,48 h hydrolysis. Control: 15 FPU Spezyme CP and 40 IU Novozym 188 per g glucan.Supplementary enzymes were added at 50 U/g dry solids xylanase (MultifectPectinase PE) and 2 U/g dry solids feruloyl esterase (Depol 740). Numbers inparenthesis are errors in 95% CI.
5390 Y. Kim et al. / Bioresource Technology 101 (2010) 5385–5393
hydrolysates of WDG were evaluated for fermentation to ethanolusing a commercial Saccharomyces yeast strain and a recombinant
Fig. 3. Simultaneous saccharification and fermentation time course of LHW pretreated an#2 WDG, LHW; (B) #4 WDG, LHW; (C) #2 WDG, AFEX; (D) #4 WDG, AFEX. Pre-hydroly40 IU Novozym 188 per g glucan, 50 �C, pH 4.8, 200 rpm. SSF conditions: entire pre-hydrCI. Data without error bars are average of duplicate runs.
xylose-co-fermenting yeast (424A (LNHST)), results from whichare discussed in the next sections.
3.3. Fermentability tests
SSF of Pretreated WDG Hydrolysate using S. cerevisiae D5A: TheWDG samples. #2 and #4, upon LHW or AFEX pretreatment, wereenzymatically pre-hydrolyzed by adding 15 FPU Spezyme CP and40 IU Novo 188 per g glucan at 15% dry solids loading and incubat-ing at 50 �C for 24 h. The whole slurry was inoculated with Saccha-romyces cerevisiae D5A and fermented for 72 h. The yields of sugarsfollowing the 24 h pre-hydrolysis are summarized in Table 2. Thefermentation time courses are plotted in Fig. 3. The initial glucoseconcentration for WDG pretreated with LHW was higher than forAFEX treated due to the thin stillage added in for the LHW samples,which contained additional sugar oligomers. Xylose concentrationswere below 5 g/L for all cases. Glucose was completely consumedwithin the first 12 h of fermentation. As measured at its highestpoint, the metabolic ethanol yield was 0.56–0.59 g/g (or 110–115% of the maximum ethanol theoretical yield) for the LHW pre-treated WDG and 0.63–0.68 g/g (or 123–133%) for the AFEX treatedWDG, implying that additional glucose was generated probablyfrom cellulose and fermented during the SSF. AFEX treated hydro-lysate contains higher nitrogen than LHW pretreated hydrolysateprobably due to ammonia carried over from the pretreatment pro-cess (Kim et al., 2008b). The higher metabolic ethanol yield for the
d AFEX pretreated WDG (wet cake) samples using Saccharomyces cerevisiae D5A. (A)sis conditions: 15% (w/w) dry solids loading for 24 h using 15 FPU Spezyme CP andolysate, Saccharomyces cerevisiae D5A, 28 �C, 100 rpm 72 h. Error bars represent 95%
Y. Kim et al. / Bioresource Technology 101 (2010) 5385–5393 5391
AFEX versus LHW treated WDG hydrolysate may suggest the ben-eficial effect this additional nitrogen has on yeast metabolism.
Ethanol production yields, calculated based on the maximumtheoretical ethanol concentration, are summarized in Table 3 andcalculated as below.
Ethanol production yieldð%Þ ¼measured ethanol concentration
theoretical max:sugar conc: based on raw biomassðg=LÞ � 0:511�100
Table 3Ethanol production yield based on the maximum theoretical ethanol concentration during f95% CI. Data without errors are average of duplicate runs.
WDG sample no.
Saccharomyces D5A(SSF)a
Xylose-co-fermenting Saccharomyces 424A (LNH-ST)b including contribution of xylos
a Conversion scheme: 24 h pre-hydrolysis (Spezyme CP + Novo188) + 72 h SSF.b Conversion scheme: 48 hydrolysis (Spezyme CP + Novo188 + Multifect Pectinase + D
fermentation of liquid hydrolysate only.c Yield calculated based on the maximum theoretical ethanol concentration from glu
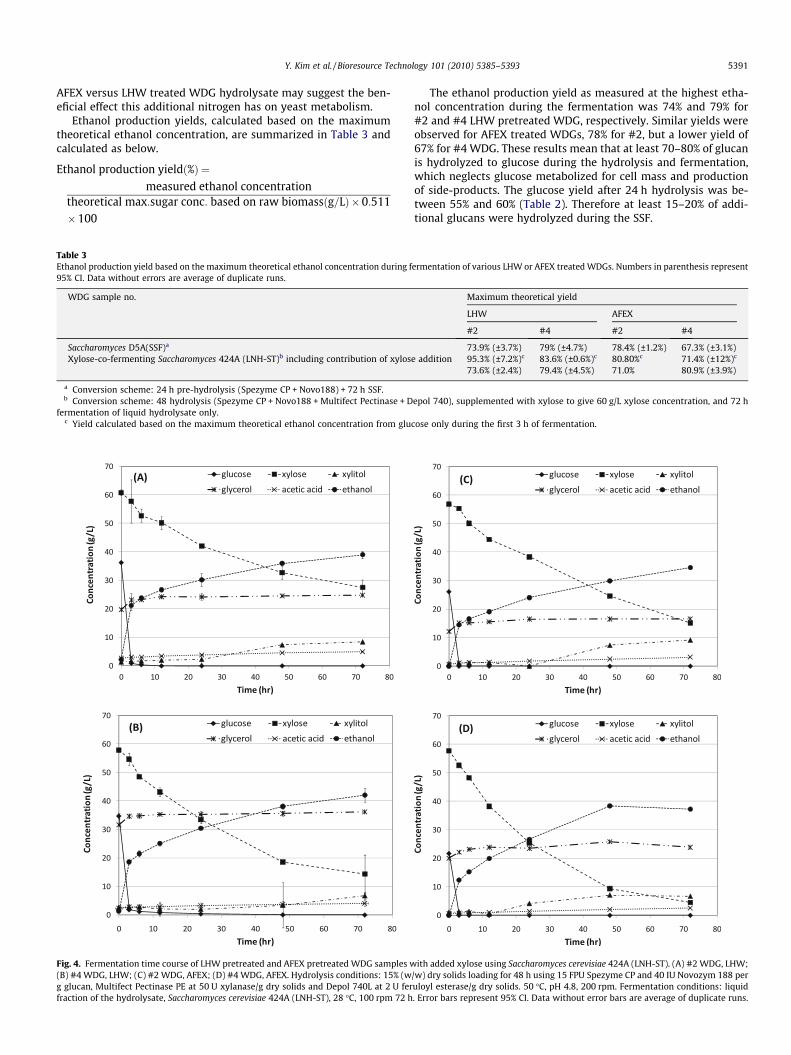
Fig. 4. Fermentation time course of LHW pretreated and AFEX pretreated WDG samples w(B) #4 WDG, LHW; (C) #2 WDG, AFEX; (D) #4 WDG, AFEX. Hydrolysis conditions: 15% (wg glucan, Multifect Pectinase PE at 50 U xylanase/g dry solids and Depol 740L at 2 U ferfraction of the hydrolysate, Saccharomyces cerevisiae 424A (LNH-ST), 28 �C, 100 rpm 72 h
The ethanol production yield as measured at the highest etha-nol concentration during the fermentation was 74% and 79% for#2 and #4 LHW pretreated WDG, respectively. Similar yields wereobserved for AFEX treated WDGs, 78% for #2, but a lower yield of67% for #4 WDG. These results mean that at least 70–80% of glucanis hydrolyzed to glucose during the hydrolysis and fermentation,which neglects glucose metabolized for cell mass and productionof side-products. The glucose yield after 24 h hydrolysis was be-tween 55% and 60% (Table 2). Therefore at least 15–20% of addi-tional glucans were hydrolyzed during the SSF.
ermentation of various LHW or AFEX treated WDGs. Numbers in parenthesis represent
Maximum theoretical yield
LHW AFEX
#2 #4 #2 #4
73.9% (±3.7%) 79% (±4.7%) 78.4% (±1.2%) 67.3% (±3.1%)e addition 95.3% (±7.2%)c 83.6% (±0.6%)c 80.80%c 71.4% (±12%)c
73.6% (±2.4%) 79.4% (±4.5%) 71.0% 80.9% (±3.9%)
epol 740), supplemented with xylose to give 60 g/L xylose concentration, and 72 h
cose only during the first 3 h of fermentation.
ith added xylose using Saccharomyces cerevisiae 424A (LNH-ST). (A) #2 WDG, LHW;/w) dry solids loading for 48 h using 15 FPU Spezyme CP and 40 IU Novozym 188 peruloyl esterase/g dry solids. 50 �C, pH 4.8, 200 rpm. Fermentation conditions: liquid. Error bars represent 95% CI. Data without error bars are average of duplicate runs.
5392 Y. Kim et al. / Bioresource Technology 101 (2010) 5385–5393
As shown in Fig. 3, the LHW pretreated WDG samples were fer-mented at a similar rate and, as a result, the ethanol productionyields were also similar. However, the fermentation time courseof AFEX pretreated #2 and #4 WDG were notably different fromeach other. The glucose from the AFEX treated #4 WDG was con-sumed at a faster rate than that from #2 WDG and the final ethanolproduction yield was significantly higher for #2 WDG than for #4WDG. The lower ethanol production yield for the AFEX treated#4 WDG was expected as the sugar concentration at the endof the-pre-hydrolysis was lower than for #2 WDG. The fastersugar consumption rate of AFEX treated #4 WDG reflected apossible beneficial effect of the high extractives content duringthe fermentation of AFEX treated biomass.
Glucose/xylose co-fermentation of pretreated WDG hydrolysate:Fig. 4 shows the fermentation time course of WDG, pretreatedand hydrolyzed for 48 h with the cocktail of enzymes listed previ-ously. Unlike the previous experiment, solids (including residualcellulose) were removed prior to fermentation. Also, instead ofusing a native Saccharomyces strain only capable of fermentinghexoses, the cultures were inoculated with a recombinant Saccha-romyces cerevisiae strain (424A (LNH-ST) engineered for xylose co-fermentation. This recombinant yeast was previously reported toefficiently co-ferment xylose and glucose in hydrolysate preparedfrom various lignocellulosic biomasses (Sedlak and Ho, 2004a,b).Since the initial xylose concentration in the hydrolysate of WDGwas too low (10–15 g/L) to observe effectiveness of the xylose fer-mentation, reagent grade xylose was added to the hydrolysate un-til a final xylose concentration of 60 g/L was reached. Thetheoretical maximum xylose concentration for the solids loadingused here is 20 g/L for #2 WDG and 25 g/L for #4 WDG. Therefore,60 g/L xylose is beyond what can be achieved here. However, thisconcentration can be achieved by raising the solids loading to30% (w/w) and increasing the hydrolysis efficiency to 100%, albeitachieving this could be challenging due to various factors de-scribed in the introduction.
The ethanol production yields calculated in Table 3 suggest thatat least 74–80% of the fermentable sugars (glucose and xylose com-bined) present in the initial WDG and added xylose were convertedto ethanol during the xylose co-fermentation. Metabolic ethanolyield (% of theoretical ethanol based on the consumed sugars)was 103–105% for all runs. Some oligomeric sugars, present inthe liquid hydrolysate, may have been further hydrolyzed and con-verted by the yeast to ethanol during the fermentation.
As illustrated in Fig. 4, glucose was completely consumed with-in the initial 3 h of fermentation. Ethanol production yield in termsof maximum theoretical yield at 3 h, based only upon glucose, was85% for #2 WDG and 77% for #4 WDG pretreated by LHW (Table 3).It was 81% and 71%, respectively, for AFEX treated #2 and #4 WDG.Xylose was also quickly consumed as the fermentation proceeded.Xylose was consumed at a faster rate for #4 WDG than for #2 WDGirrespective of pretreatment. Even when the fermentation wascontinued for more than 120 h, more residual xylose was presentfor #2 than for #4 WDG. As a result, ethanol production yield after72 h fermentation, based on the maximum theoretical ethanol con-centration from both glucose and xylose, was slightly higher for #4WDG (80% for both LHW and AFEX treated) than for #2 (74% forLHW pretreated and 71% for AFEX treated), as presented in Table 3.The difference was statistically significant at 5% level.
As discussed earlier, the #4 WDG contains approximately fourtimes more water extractives on a dry mass basis than the otherWDG samples, which is probably due to presence of evaporatedstillage on the wet cake. Water extractable compounds promotexylose metabolism by 424A (LNH ST). Hence syrup from condensedstillage, should be added as a nutrient supplement for the yeastfermentation, especially to improve xylose fermentation. Furtherbuffering effect of the syrup maintained the pH at 5.5–5.9 during
the fermentation. This reduced the toxic effect of fermentationinhibitors such as acetic acid, a well-known strong yeast inhibitorpresent ubiquitously in various cellulosic biomass. The beneficiaryeffect of the condensed stillage on the yeast fermentation deservesfurther study.
4. Summary and conclusions
By-product streams originating from four dry grind plants wereanalyzed for composition. DDGS compositions were uniform; vary-ing by an average of 5.7%. With the exception of sample 4 (con-tained evaporated thin stillage) WDG compositions were alsouniform and varied by an average of 5.4%. The mass closure for setswas excellent with 105% and 99.0% of the mass accounted for inDDGS and WDG respectively. The overall results show that ethanolyields per bushel of corn may be increased by 7–10% when wetcake is pretreated and hydrolyzed. The condensed stillage wasfound to be beneficial to xylose fermentation either because itadded to the nutrient quality of the media or because it added buf-fering capacity, which putatively slowed the drop in pH during thefermentation.
Acknowledgements
This work was supported by US Department of Energy (Con-tract: DE-FG36-04GO14220) in cooperation with Midwest Con-sortium for Biobased Products and Bioenergy. We thankGenencor, a Danisco Division, for gifts of the enzymes used inthis work and the dry grind plants for providing distillers’ grainsproducts. We also thank Drs. Nancy W. Ho and Miroslav Sedlakfor providing the xylose co-fermenting Purdue yeast 424A(LNH-ST) and Ms. Patricia O’Bryan for technical help with thework done at NCAUR. We would like to thank Miroslav Sedlakand Eduardo Ximenes for their internal review of this paperand for helpful suggestions.
References
Bals, B., Dale, B.E., Balan, V., 2006. Enzymatic hydrolysis of distiller’s dry grain andsolubles (DDGS) using ammonia fiber expansion pretreatment. Energy Fuels 20,2732–2736.
Belyea, R.L., Rausch, K.D., Tumbleson, M.E., 2004. Composition of corn and distillers’dried grains with solubles from dry grind ethanol processing. Bioresour.Technol. 94, 293–298.
Bothast, R.J., Schlicher, M.A., 2005. Biotechnological processes for conversion of corninto ethanol. Appl. Microbial. Biotechnol. 67, 19–25.
Brown, L., Torget, R., 1996. Enzymatic Saccharification of Lignocellulosic Biomass.Chemical analysis and testing task laboratory analytical procedures (LAP 009),NREL Biomass Program.
Bunzel, M., Ralph, J., Funk, C., Steinhart, H., 2005. Structural elucidation of newferulic acid-containing phenolic dimers and trimers isolated from maize bran.Tetrahedron Lett. 46, 5845–5850.
Dien, B.S., Ximenes, E.A., O’Bryan, P.J., Moniruzzaman, M., Li, X.L., Balan, V., Dale, B.,Cotta, M.A., 2008. Enzyme characterization for hydrolysis of AFEX and liquidhot-water pretreated distillers’ grains and their conversion to ethanol.Bioresour. Technol. 99, 5216–5225.
Galbe, M., Zacchi, G., 1992. Simulation of ethanol production processes based onenzymatic hydrolysis of lignocellulosic materials using ASPEN PLUS. Appl.Biochem. Biotech. 34–35, 93–104.
Galbe, M., Zacchi, G., 1994. Simulation of ethanol production processes based onenzymatic hydrolysis of woody biomass. Computers Chem. Engng. 18, S687–S691.
Kim, Y., Mosier, N.S., Hendrickson, R., Ezeji, T., Blaschek, H., Dien, B., Cotta, M., Dale,B., Ladisch, M.R., 2008a. Composition of corn dry-grind ethanol by-products:DDGS, wet cake, and thin stillage. Bioresour. Technol. 99, 5165–5176.
Kim, Y., Hendrickson, R., Mosier, N.S., Ladisch, M.R., Bals, B., Balan, V., Dale, B.E.,2008b. Enzyme hydrolysis and ethanol fermentation of liquid hot water andAFEX pretreated distillers’ grains at high-solids loadings. Bioresour. Technol. 99,5206–5215.
Kim, Y., Mosier, N., Ladisch, M.R., 2008c. Process simulation of modified dry grindethanol plant with recycle of pretreated and enzymatically hydrolyzeddistillers’ grains. Bioresour. Technol. 99, 5177–5192.
Y. Kim et al. / Bioresource Technology 101 (2010) 5385–5393 5393
Kim, Y., Hendrickson, R., Mosier, N.S., Ladisch, M.R., 2009. Liquid hot waterpretreatment of cellulosic biomass. In: Mielenz, J.R. (Ed.), Methods in MolecularBiology: Biofuels, vol. 581. The Humana Press, Totowa, NJ, pp. 93–102.
Klopfenstein, T.J., Erickson, G.E., Bremer, V.R., 2008. Use of distillers’ by-products inthe beef cattle feeding industry. J. Animal Sci. 86, 1223–1231.
Koster, H., 2007. Dry milling ethanol by-products for animal feed. Int. Sugar J. 109,210–216.
Lau, M.W., Dale, B.E., Balan, V., 2008. Ethanolic fermentation of hydrolysates fromammonia fiber expansion (AFEX) treated corn stover and distillers’ grainwithout detoxification and external nutrient supplementation. Biotechnol.Bioeng. 99, 529–539.
Lumpkins, B.S., Batal, A.B., Dale, N.M., 2004. Evaluation of distillers’ dried grainswith solubles as a feed ingredient for broilers. Poultry Sci. 83, 1891–1896.
Montgomery, R., Smith, F., 1957. Structure of corn hull hemicellulose. 3.Identification of the methylated aldobiouronic acid obtained from methylcorn hull hemicellulose. J. Am. Chem. Soc. 79, 695–697.
Murthy, G.S., Sall, E.D., Metz, S.G., Foster, G., Singh, V., 2008. Evaluation of a dry cornfractionation process for ethanol production with different hybrids. Ind. CropsProd. 29, 67–72.
RFA Annual Ethanol Industry Outlook, 2010. Renewable Fuels Association,Washington, DC.
Ricke, S.C., Pandey, A., Ladisch, M., Dale, B., 2008. Special issue: cellulose conversionin dry grind plants. Bioresour. Technol. 99 (12), 5155–5250.
Romero, E., Bautista, J., Garcia-Martinez, A.M., Cremades, O., Parrado, J., 2007.Bioconversion of corn distiller’s dried grains with solubles (CDDGS) toextracellular proteases and peptones. Process Biochem. 42, 1492–1497.
Saulnier, L., Thibault, J.F., 1999. Ferulic acid and diferulic acids as components ofsugar-beet pectins and maize bran heteroxylans. J. Sci. Food Agric. 79, 396–402.
Saulnier, L., Crepeau, M.J., Lahaye, M., 1999. Isolation and structural determinationof two 5,50-diferuloyl oligosaccharides indicate that maize heteroxylans arecovalently cross-linked by oxidatively coupled ferulates. Carbohydr. Res. 320,82–92.
Sedlak, M., Ho, N.W.Y., 2004a. Characterization of the effectiveness of hexosetranspoters for transporting xylose during glucose and xylose co-fermentationby recombinant Saccharomyces yeast. Yeast 21, 671–684.
Sedlak, M., Ho, N.W.Y., 2004b. Production of ethanol from cellulosic biomasshydrolysates using genetically engineered Saccharomyces yeast capable ofcofermenting glucose and xylose. Appl. Biochem. Biotechnol. 113, 403–416.
Selling, G.W., Woods, K.K., 2008. Improved isolation of zein form corn gluten mealusing acetic acid and isolate characterization as solvents. Cereal Chem. 85, 202–206.
Sharma, V., Moreau, R.A., Singh, V., 2008. Increasing the value of hominy feed as acoproduct by fermentation. Appl. Biochem. Biotechnol. 149, 145–153.
Shin, H.D., McClendon, S., Le, T., Taylor, F., Chen, R.R., 2006. Complete enzymaticrecovery of ferulic acid from corn residues with extracellular enzymes fromNeosartorya spinosa NRRL185. Biotechnol. Bioeng. 95, 1108–1115.
Srinivasan, R., Dien, B.S., Rausch, K.D., Tumbleson, M.E., Singh, V., 2007. Fiberseparated from distillers’ dried grains with solubles as a feedstock for ethanolproduction. Cereal Chem. 84, 563–566.
Spiehs, M.J., Whitney, M.H., Shurson, G.C., 2002. Nutrient database for distillers’dried gains with solubles produced from new ethanol plants in Minnesota andSouth Dakota. J. Animal Sci. 80, 2639–2645.
Tatara, R.A., Rosentrater, K.A., Suraparaju, S., 2008. Design properties for molded,corn-based DDGS-filled phenolic resin. Ind. Crops Prod. 29, 9–15.
Wang, L., Weller, C.L., Schlegel, V.L., Carr, T.P., Cuppett, S.L., 2008. Supercritical CO2
extraction of lipids from grain sorghum dried distillers’ grains with solubles.Bioresour. Technol. 99, 1373–1382.
Weller, C.L., Paulsen, M.R., Steinberg, M.P., 1988. Correlation of starch recovery withassorted quality factors of 4 corn hybrids. Cereal Chem. 65, 392–397.
West, T.P., Nemmers, B., 2008. Curdlan production by Agrobacterium sp. ATCC 31749on an ethanol fermentation coproduct. J. Basic Microb. 48, 65–68.
Whistler, R.L., Corbette, W.M., 1955. Oligosaccharides from partial acid hydrolysis ofcorn fiber hemicellulose. J. Am. Chem. Soc. 77, 6328–6330.
Yadav, M.P., Moreau, R.A., Hicks, K.B., 2007. Phenolic acids, lipids, and proteinsassociated with purified corn fiber arabinoxylans. J. Agric. Food Chem. 55, 943–947.
Zeng, M., Mosier, N.S., Huang, C., Sherman, D.M., Ladisch, M.R., 2007. Microscopicexamination of changes of plant cell structure in corn stover due to hotwater pretreatment and enzymatic hydrolysis. Biotechnol. Bioeng. 97, 265–278.