Effect of Competency and Compensation Through ...
12
Volume 5, Issue 10, October – 2020 International Journal of Innovative Science and Research Technology ISSN No:-2456-2165 IJISRT20OCT186 www.ijisrt.com 556 Effect of Competency and Compensation Through Organizational Commitment on the Public Service Performance of Local Government Employees South Sulawesi Province Ahmad 1), Djabir Hamzah 2), Siti Haerani 2), Fauziah Umar 2) 1) YAPMI Indonesian College of Management, 2) Faculty of Economics and Business, Hasanuddin University Makassar Abstract:- Public services are basic services in government administration. Public services as an important indicator in the assessment of government performance, both at the central and regional levels. Most of the agency services in South Sulawesi Province are still classified as poor and fall into the red zone of local government compliance with the Public Service Law. To realize a good employee work attitude, various ways are needed that can be done by agencies (SKPD) as a government organization, including by implementing a competency system, a compensation system and strengthening organizational commitment to be able to improve employee performance in achieving organizational goals as a public service agency. This study aims to determine the relationship between competence, compensation and organizational commitment and their effects on the performance of public services for local government employees of South Sulawesi Province. The research design was expalanatory, with a positivistic paradigm approach, and a quantitative study of perceptions, with a sample size of 180 people (respondents) who were proportionally selected by random sampling area. Data was collected through questionnaires distributed to 216 staff (ASN) in 4 (four) Service Offices (Education Office, Health Service, Social Service, and Cooperative and UKM Services) in 3 (three) Wilaya (South Sulawesi Province, Makassar City, and Parepare City). Structural Equation Modeling (SEM) analysis of the AMOS statistical software package, to determine the relationship between competence, compensation, and organizational commitment with the performance of public services for local government employees of South Sulawesi Province. The results show that there are three types of influence that will be presented in the structural model, namely the direct effect (Standardized Direct Effect), the indirect effect (Standardized Indirect Effect), and the total effect (Standardized Total Effect). Testing the direct effect hypothesis is carried out by testing the Critical Ratio (CR) on each direct effect partially. If the CR value is> 1.96 or the P value <0.05, it can be concluded that there is a significant effect, conversely, if the CR value is <1.96 or the P value> 0.05, it can be concluded that there is no effect. The complete analysis results are contained in the SEM analysis results, can be seen in the Appendix. The following shows the results of testing the Standardized Direct Effect hypothesis. Direct Effects: 1. Competence on Organizational Commitment, with Standardizerd value (0.446), Critical Ratio (5.094), and Probability (0.000); significant. 2. Competence on Public Service Performance, with a standardized value (0.311), Critical Ratio (3.397), and Probability (0.000); significant. 3. Compensation for Organizational Commitment with Standardized Value (0.171), Critical Ratio (2.092), and Probability (0.036); significant. 4. Compensation for Public Service Performance, with standardized value (0.013), Critical Ratio (0.161), and Probability (0.872); significant. 5. Organizational commitment to Public Service Performance, with a standardized value (0.233), Critical Ratio (2.512), and Probability (0.012); significant. The indirect effect test is used from several results of the direct effect test. The coefficient of indirect effect is obtained from the product of the two coefficients of direct effect that make it up. The indirect effect is said to be significant if the two coefficients of the direct effect that form it are significant. In full, the results of the indirect effect test are presented in the following table. Indirect Effect: Based on the table it is shown that there is an indirect influence between Competence (X1) on Employee Public Service Performance (Y2) through the intermediary variable Organizational Commitment (Y1) of 0.104, and there is an indirect influence between Compensation (X2) on Service Performance Public (Y2) through the intermediary variable Organizational Commitment (Y1) is 0.039. It is concluded that 1). Competence (X1) has a direct and significant effect on the Employee Public Service Performance (Y2) of the Regional Government of South Sulawesi Province. 2). Compensation (X2) has no direct effect on Employee Public Service Performance (Y2). 3). Competence (X1) has an indirect and significant effect on Employee Public Service Performance (Y2) of the Regional Government of South Sulawesi Province through Organizational Commitment (Y1). It is hoped that the leaders of organizations / SKPD and organizational units of Regional Government agencies in
Transcript of Effect of Competency and Compensation Through ...

Volume 5, Issue 10, October – 2020 International Journal of Innovative Science and Research Technology
ISSN No:-2456-2165
IJISRT20OCT186 www.ijisrt.com 556
Effect of Competency and Compensation Through
Organizational Commitment on the Public Service
Performance of Local Government Employees South
Sulawesi Province
Ahmad 1), Djabir Hamzah 2), Siti Haerani 2), Fauziah Umar 2)
1) YAPMI Indonesian College of Management,
2) Faculty of Economics and Business, Hasanuddin University
Makassar
Abstract:- Public services are basic services in
government administration. Public services as an
important indicator in the assessment of government
performance, both at the central and regional levels.
Most of the agency services in South Sulawesi Province
are still classified as poor and fall into the red zone of
local government compliance with the Public Service
Law. To realize a good employee work attitude, various
ways are needed that can be done by agencies (SKPD) as
a government organization, including by implementing a
competency system, a compensation system and
strengthening organizational commitment to be able to
improve employee performance in achieving
organizational goals as a public service agency. This
study aims to determine the relationship between
competence, compensation and organizational
commitment and their effects on the performance of
public services for local government employees of South
Sulawesi Province. The research design was
expalanatory, with a positivistic paradigm approach, and
a quantitative study of perceptions, with a sample size of
180 people (respondents) who were proportionally
selected by random sampling area. Data was collected
through questionnaires distributed to 216 staff (ASN) in
4 (four) Service Offices (Education Office, Health
Service, Social Service, and Cooperative and UKM
Services) in 3 (three) Wilaya (South Sulawesi Province,
Makassar City, and Parepare City). Structural Equation
Modeling (SEM) analysis of the AMOS statistical
software package, to determine the relationship between
competence, compensation, and organizational
commitment with the performance of public services for
local government employees of South Sulawesi Province.
The results show that there are three types of influence
that will be presented in the structural model, namely
the direct effect (Standardized Direct Effect), the
indirect effect (Standardized Indirect Effect), and the
total effect (Standardized Total Effect). Testing the
direct effect hypothesis is carried out by testing the
Critical Ratio (CR) on each direct effect partially. If the
CR value is> 1.96 or the P value <0.05, it can be
concluded that there is a significant effect, conversely, if
the CR value is <1.96 or the P value> 0.05, it can be
concluded that there is no effect. The complete analysis
results are contained in the SEM analysis results, can be
seen in the Appendix. The following shows the results of
testing the Standardized Direct Effect hypothesis. Direct
Effects: 1. Competence on Organizational Commitment,
with Standardizerd value (0.446), Critical Ratio (5.094),
and Probability (0.000); significant. 2. Competence on
Public Service Performance, with a standardized value
(0.311), Critical Ratio (3.397), and Probability (0.000);
significant. 3. Compensation for Organizational
Commitment with Standardized Value (0.171), Critical
Ratio (2.092), and Probability (0.036); significant. 4.
Compensation for Public Service Performance, with
standardized value (0.013), Critical Ratio (0.161), and
Probability (0.872); significant. 5. Organizational
commitment to Public Service Performance, with a
standardized value (0.233), Critical Ratio (2.512), and
Probability (0.012); significant. The indirect effect test is
used from several results of the direct effect test. The
coefficient of indirect effect is obtained from the product
of the two coefficients of direct effect that make it up.
The indirect effect is said to be significant if the two
coefficients of the direct effect that form it are
significant. In full, the results of the indirect effect test
are presented in the following table. Indirect Effect:
Based on the table it is shown that there is an indirect
influence between Competence (X1) on Employee Public
Service Performance (Y2) through the intermediary
variable Organizational Commitment (Y1) of 0.104, and
there is an indirect influence between Compensation
(X2) on Service Performance Public (Y2) through the
intermediary variable Organizational Commitment (Y1)
is 0.039. It is concluded that 1). Competence (X1) has a
direct and significant effect on the Employee Public
Service Performance (Y2) of the Regional Government
of South Sulawesi Province. 2). Compensation (X2) has
no direct effect on Employee Public Service Performance
(Y2). 3). Competence (X1) has an indirect and significant
effect on Employee Public Service Performance (Y2) of
the Regional Government of South Sulawesi Province
through Organizational Commitment (Y1). It is hoped
that the leaders of organizations / SKPD and
organizational units of Regional Government agencies in
Volume 5, Issue 10, October – 2020 International Journal of Innovative Science and Research Technology
ISSN No:-2456-2165
IJISRT20OCT186 www.ijisrt.com 557
South Sulawesi, especially those related to services to the
community (public), pay attention to the following
matters: 1). Implementing a competency system in the
placement and development of employees, so that they
can carry out their respective duties in providing
services to the community (public), with good
performance. 2). Forming and strengthening good
organizational commitment, so that employees always
feel optimistic and enthusiastic about carrying out their
duties in achieving organizational goals.
Keywords:- Competence, Compensation, Organizational
Commitment, and Public Service Performance.
I. INTRODUCTION
Local government, seen from the Indonesian
government system, is the spearhead of the Government of
the Unitary State of the Republic of Indonesia. The image of
the government bureaucracy as a whole will be largely
determined by the performance of local government
organizations. Regional Government Work Units (SKPD),
which are Local Government Agencies, are public service
agencies that are required to improve and constantly carry
out reforms and anticipate developments and community needs.
In order to improve the image, work and performance
of government agencies towards professionalism and
support the creation of good governance (good governance),
it is necessary to unify directions and views for all levels of
government employees which can be used as guidelines or
references in carrying out both managerial and operational
tasks throughout. field of duties and organizational units of
Government Agencies in an integrated manner.
Public services are basic services in government administration. Public services as an important indicator in
the assessment of government performance, both at the
central and regional levels. Administration of governance is
said to be good if the public services carried out are oriented
towards the interests of the community. Good and quality
services give satisfaction implications to the community,
because people directly assess the performance of the
services provided. The indicator of community satisfaction
is the benchmark for the success of governance.
Law Number 25 of 2009 concerning Public Services in Article 1 paragraph (1) states that Public Services are
activities in order to fulfill service needs in accordance with
statutory regulations for every citizen / resident for goods,
services, and / or administrative services provided by public
service providers. It is emphasized in paragraph (7) that
service standards are benchmarks used as guidelines for
service delivery, and service quality assessment references
as obligations and promises of providers to the public in the
framework of "quality, fast, easy, affordable, and
measurable" services.
The Minister of PAN and RB has also issued a
Regulation of the Minister of Administrative Reform and Bureaucratic Reform of the Republic of Indonesia Number
15 of 2014 concerning Guidelines for Service Standards.
This PAN and RB Permen is a reference in compiling
Service Standards which will serve as guidelines for the
work of ASN for implementing public services in carrying
out their services in accordance with their respective duties.
The guideline lists the components that must be present and
their existence should be considered in providing services.
The components that must be known by the public include:
(a). Requirements, (b), systems, mechanisms, and
procedures, (c). Duration of service, (d). Fees / rates, (e).
Product of service (f). Handling complaints, suggestions and input.
In order for public services to run efficiently and
effectively, each leader of the SKPD / service delivery unit
must formulate a vision, mission, goals, and targets in each
organization. Because the performance of an organization is
measured based on the achievement of the vision, mission,
goals and objectives of each organization. Because
performance is a description of the level of achievement of
the implementation of the tasks contained in the strategic
planning formulation of the organization. This is stated in the form of a regional planning document, which is divided
into a 20-year Regional Long-Term Development Plan
(RPJPD), a 5-year Regional Medium-Term Development
Plan (RPJMD), as well as a 1-year Short-Term Development
Plan (RPJPD).
The Government Agency Accountability Report
(LAKIP) must provide relevant data and information for
decision makers in order to interpret successes and failures
more broadly and in depth. Performance accountability
analysis includes a description of the relationship between
the achievement of activity performance in programs and activities in realizing the vision, mission, goals, objectives
set in the strategic plan. This analysis also explains the
development of conditions for achieving goals and
objectives in an efficient and effective manner, in
accordance with the established policies and activity
programs. Analysis is carried out using information or data
obtained in a complete and accurate manner, and whenever
possible, a policy evaluation is carried out to determine the
accuracy and effectiveness of both the policy itself and the
system and process of its implementation (Amin, 2012).
Good performance of public service administration,
according to Kepmenpan No. 25 of 2004 concerning
General Guidelines for Preparation of Community
Satisfaction Index for Government Agency Service Units,
including: (a) Simplicity, (b) Clarity, (c) Certainty and
timeliness, (d) Accuracy, (e) Non-discriminatory, (f)
Responsible answer, (g) Completeness of facilities and
infrastructure, (h) Ease of Access, (i) Honesty, (j) Accuracy,
(k) Discipline, politeness, Friendliness, (l) Security and
comfort.

Volume 5, Issue 10, October – 2020 International Journal of Innovative Science and Research Technology
ISSN No:-2456-2165
IJISRT20OCT186 www.ijisrt.com 558
To realize Public Service Performance according to
community needs, the Central Government has issued RI Government Regulation No. 65/2005 concerning Guidelines
for the Formulation and Determination of Minimum Service
Standards.
Then followed by the Decree of the Minister of State
Apparatus Empowerment (KEMENPAN and RB) Number
63 / KEP / 7/2005, that every implementation of public
services must have service standards and be published as a
guarantee and certainty for service recipients. Service
standards are a measure that is carried out in the
implementation of public services which must be obeyed by
the providers and / or the recipients of services.
Service standards, at least must include the following
points:
1. Service Procedure; Service procedures are carried out for
service providers and recipients, including complaints.
2. Completion Time; The time for completion is determined
from the time the application is submitted to the
completion of the service, including complaints.
3. Service Fee; Service fees / rates including details that are
determined in the service provider process.
4. Product service; Service products that will be received are in accordance with predetermined conditions.
5. Facilities and infrastructure; Provision of adequate service
facilities and infrastructure by public service providers.
6. Competence of service officers; The competence of
service providers must be determined appropriately
based on the required knowledge, expertise, skills,
attitudes and behavior.
Therefore, the six points above regarding service
standards in public services must pay attention to and apply
the six points because these points are service standards that
must be obtained by service recipients so that they feel satisfied with the services provided. If the six points are not
implemented, then it is certain that the service recipients will
rate the service as poor and slow and they are not satisfied.
In order to realize the things that have been stipulated
in the above laws and regulations, the Central and Regional
Governments have prepared a budget for public service
facilities / facilities and infrastructure. The Regional
Government of South Sulawesi Province has provided
educational service places at the senior secondary level, both
public and private. In 2014/2015 there were 586 units (SMU) with 228,620 students, with 16,886 teachers. In
2015/2016 there were 586 units, with 228,620 students and
16,886 teachers. Meanwhile, Vocational High Schools
(SMK) 2014/2015 had 415 units, with 123,119 students and
12,196 teachers. The latest data for 2015/2016 recorded 456
units, 127,193 students and 12,243 teachers. (Source:
Provincial Education Office and BPS, 2017
Of the number of service units in the education sector,
it is certainly not optimal if the government does not equip
reading facilities. Therefore, the Provincial Government of South Sulawesi also provides reading centers in the form of
libraries such as the Regional National Library and Archives
Office of South Sulawesi Province, the Regional Library of
South Sulawesi Province, the Bakti Mappanyukki Library, the Governor's Library, and School Libraries throughout the
South Sulawesi Province.
For health services, the Regional Government of South
Sulawesi Province together with the Municipal and Regency
Governments have built quite representative Regional
Hospitals, plus Puskesmas in each region.
The number of civil servants (ASN) of the Regional
Government of South Sulawesi Province is 10,238, spread
across 27 agencies or SKPD. Meanwhile, the population is
8,035 million people (9,522,503). Thus, 1 ASN only serves about 83 residents. According to the ideal ratio, 1 ASN
serves 90-120 residents. This means that the number of ASN
in the Provincial Government of Prov. South Sulawesi
experienced an excess of 37 people. This condition causes
the accumulation of employees in several SKPD so that it is
inefficient. To overcome this, it is necessary to make an
even distribution of employees in 27 SKPDs in the South
Sulawesi Provincial Government. (Source: Rakyatku. Com.
Makassar, March 2017).
Bureaucratic reforms rolled along with the total reforms launched by the Indonesian nation in 1998. One of
the central targets in bureaucratic reform is to improve and
improve the quality of public services (Dwiyanto, 2008).
This target is an issue that is always interesting, because
improvements and enhancements to the quality of public
services in Indonesia tend to run in place (Surjadi, 2009).
The results of Silalahi's research (2003) show that
before the reformation, public satisfaction with the services
provided by the state apparatus was categorized as low, only
33.7%. After four years of reform, Dwiyanto et al. (2002)
concluded that the performance of government bureaucratic services had not changed significantly. The state apparatus
or bureaucracy still shows a low degree of accountability,
responsibility and efficiency in the delivery of public
services. In 2009 or less than a decade of reform, the value
of Public Service Integrity (IPP) given to central and local
agencies was only 6.64 each on a scale of 1 to 10. The IPP
score is one indicator of improving the quality of public
services.
Until today, we can feel it ourselves or maybe we can
hear the experiences of family members, colleagues, relatives, or even we can read public complaints through
mass media, or other communication channels about how
they "feel" the public services they need. So what's wrong
with this. Why is this happening after a long time this
republic was formed. What is wrong with the
implementation of public services from various government
agencies that carry out services for the community.
Most of the services of agencies in the South Sulawesi
Province (Sulsel) and Makassar City (Pemkot) are still very
bad and fall into the red zone of local government compliance with the Public Service Law. This was conveyed
by the Ombudsman of the Republic of Indonesia (RI)
Volume 5, Issue 10, October – 2020 International Journal of Innovative Science and Research Technology
ISSN No:-2456-2165
IJISRT20OCT186 www.ijisrt.com 559
Representative of South Sulawesi. The Head of the South
Sulawesi Ombudsman (Subhan) stated that the results of the research were based on a survey of the community and
research on 17 Regional Government Work Units (SKPD)
within the scope of the City Government, and 14 Provincial
Government SKPDs. He detailed, 10 municipal government
SKPDs that fall into the red zone, and 11 SKPDs come from
Pemprov ". If presented, 58 percent of the municipal
government public service units are in the red zone.
Meanwhile, the other 78 percent are from the provincial
government. This is a picture of public dissatisfaction with
public services, "said Subhan (Head of Ombudsman South
Sulawesi) to journalists, at the Coffee House, Saturday
7/12/2015 (Sindonews.Com. Saturday, December 7 2015).
From this research, it is hoped that the Provincial
Government. South Sulawesi and the City Government.
Makassar is improving itself. The SKPD that is meant
specifically for the Makassar City Government, namely the
Building Spatial Planning Office, PDAM, Public Works
Service (PU), and Parking Regional Companies (PD).
Education Office (Disdik), Regional Revenue Service
(Dispenda), Health Service (Dinkes), National and Political
Unity Service (Kesbanpol), Regional Environmental Agency
(BLHD), and Social Service (Dinsos). Whereas SKPDs within the South Sulawesi Provincial Government that
receive red report cards are the Highways Office, the Health
Service, the Transportation Service, the Regional Investment
Coordinating Board (BKPMD), the Regional Environmental
Agency (BLHD), the Manpower Office (Disnaker), the
Resource Management Office. Daya Air, the Plantation
Service, Education Office, Social Service, and Labuang Baji
General Hospital (RSU).
The Ombudsman Expert Team, Zainuddin
(Sindonews.Com. Saturday, December 7 2015) explained
several important points regarding the substance of the study in determining the SKPD in the red zone. Among other
things, rampant illegal fees, lack of transparency of legal
basis instructions against Public Service Standards, and not
working according to Standard Operating Procedures (SOP).
These government agencies are also deemed not to
have standard cost information, minimum service facilities,
lack of security officers, lack of attributes, and officer ID
cards, lack of provision of parking areas at several agencies,
poor number of officers in the field, poor ethics or behavior
of officers in serving, and the absence of vulnerable group facilities, or access for persons with disabilities in office
administration services. In addition, the lack of special
officers for persons with disabilities, poor management of
complaint facilities, and lack of follow-up in complaint
management are also a separate note. "We can see the rise of
extortion under the guise of education, as well as brokers or
third persons who play in licensing agencies. Many work
units do not know what they want to do.
The results of this study not only classify SKPD as low
compliance or red zone, but a number of SKPDs fall into the yellow zone or moderate compliance, and the green zone
means SKPD that are highly compliant (Sindonews.com.
Saturday, December 7 2015).
Specifically for the Makassar City Government,
SKPDs that are included in the yellow zone, each Makassar
Samsat office, Licensing Administration Service Office,
Transportation Service, Regional Civil Service Agency
(BKD), and RSU Daya. While those that are included in the
green zone are the Department of Population and Civil
Disability, as well as the Manpower Office. Meanwhile for
the Provincial Government. South Sulawesi, SKPDs that are
included in the yellow zone are Disperindag and Mother and
Child Hospital. Meanwhile, only Haj Hospital is blocking
the green zone. If accumulated, only 29.41 percent of municipal government SKPDs are included in the yellow
zone, and 11.76 percent in the green zone. For the provincial
government, 14 percent is the yellow zone, and the green
zone is 7.14 percent (Sindonews.com. Saturday, December
7, 2015).
The research was conducted scientifically, and in
accordance with the orders of Law No.25 of 2009
concerning Public Services. As an anti-corruption warning,
with the hope that a cleaner, more transparent and maximum
governance can be realized.
It is unfortunate that the government, both central and
regional, has spent large amounts of funds to prepare service
facilities, and hired and paid many employees to be able to
provide excellent service to the entire community, but there
are still many public highlights on the service performance
of the State Civil Apparatus at SKPD or administrative
units. public service.
To be able to satisfy public services, local
governments need to implement good and maximum service
quality regarding assurance, responsiveness, tangible, realiability and empathy to achieve the operational
objectives of a government organization identified by
services provided to the community, at least meeting the
Minimum Service Standards (SPM) so that the development
process went as expected.
Human Resources (HR) development is an important
factor. Human Resources as planners, actors and
determinants for the achievement of organizational goals
(Rivai, 2004). Given the important role of human resources,
in order for an organization to survive in a climate of unlimited free competition, the role of Human Resource
Management is not only the responsibility of the leadership,
but also the responsibility of employees.
To realize a good employee work attitude, a number of
ways are needed that can be done by a leader of a
government organization, namely by applying the right
leadership style, implementing a competency system in
employee placement and development, implementing a
correct compensation system, and forming and
strengthening organizational commitment. the good one.
Volume 5, Issue 10, October – 2020 International Journal of Innovative Science and Research Technology
ISSN No:-2456-2165
IJISRT20OCT186 www.ijisrt.com 560
Assessment of the performance of an organization, and
measuring the level of work ability of each person, which is part of the planning process to review the strengths and
weaknesses of an organization. In the assessment of
organizational performance, one of the variables that must
be considered is employee competence. Because through
competency analysis the criteria for determining
management effectiveness can be clarified, as well as the
system used to test performance evaluation whether it is
effective or needs improvement. Likewise a good
compensation system, both direct compensation (financial)
and indirect compensation (non-financial) will be a strong
encouragement to employees to carry out tasks with good
performance in achieving organizational goals. Another thing that is no less important to the attention of
organizational leaders is to form and build a strong
organizational commitment so that employees always feel
part of the organization, so that they always try to carry out
their respective duties to provide services to the community
(public) with the best performance.
II. LOCATION/OBJECT AND METHODS
Location and Object of Research
This research is included in explanatory research. This study seeks to analyze various factors associated with the
object of research. The object of this research includes
several variables, namely: leadership style, competence, and
organizational commitment, as well as their influence on the
performance of public service employees of the Regional
Government of South Sulawesi Province. This research was
carried out in the Regional Work Units (SKPD) or Dinas
which are public service units in the South Sulawesi
Province, especially the Makassar City and Parepare City
areas of South Sulawesi Province, namely: the Education
Office, the Health Office, the Social Service, and the
Cooperative and UKM. Because there are many variables to be studied in this study, it involves several main variables to
determine the effect of one variable on another. This
research includes a positivistic (quantitative) paradigm
approach, which prioritizes study in the form of quantitative
perceptions.
Population
The population is all employees (ASN) of the Regional
Government of South Sulawesi Province, amounting to
1,805 people. So sampling to represent the population used
simple random sampling technique (Simple Random Sampling). Given the large number of employees
(population), the researcher limits the population as the
research target, by using the Area Sampling technique. This
means that the sample selection is based on a predetermined
population area based on its scattered geographic location.
This method is applied if the location factor is an important
consideration in sample selection (Indrianto and Sopomo,
2002: 129).
Sample
The sample is a number of individuals who are representatives of the population to be studied. Based on the
above statement, the number of respondents who will be
selected in this study is 10% of 1,805 employees
(population), so the sample is 180 people / employee.
Method of collecting data
The techniques used to obtain the data needed in
research are carried out in various ways, including:
1. Kuessioner
Riduwan (2003: 25) states that a questionnaire
(Questionnaire) is a list of questions given to others, and is willing to respond according to user requests. Based on the
indicators of all research variables, a list of statements was
made to the SKDP leadership starting from the Head of the
Division, Secretary, Head of Section to functional officials
and ordinary staff as population representatives in each
district / city that were sampled in the research. this by the
number of 216 people. The main objectives of giving
questionnaires are to: (a) obtain information relevant to the
research objectives, (b) obtain information relevant to the
research objectives as well as the level of reliability and
validity of the data required in this study (Ssingarimbun, 1995).
2. Interview
Rahim and Rahman (2004), Mulyana (2004: 180),
Moleong (2006: 186), Harun (2007: 69), Bungin (2007: 134-
138), and Parker (2008: 142-143) state data collection
through The interview is nothing but an interview process
with the researcher. The interview can be carried out in at
least three stages, namely: (1) the researcher collected data
through observation and interviewed several local
government officials in South Sulawesi Province, (2) the
researcher conducted in-depth interviews, in order to obtain accurate information, (3) In-depth interviews to get more
comprehensive data. These three methods are carried out
with the aim of obtaining direct data from the object of
research orally, namely by holding direct questions and
answers with interested parties in the hope of obtaining the
required information, for example interviews with the head
of SKPD and employees in related organizational units. The
information obtained is expected to clarify or support the
answers conveyed through the questionnaire.
3. Documentation Documentation is data collection by collecting and
investigating documents relevant to the research variables.
Documents relevant to this research include: population
data, employee data of each SKPD / Dinas which is the
object of research (Education, Health, Social, and
Cooperatives and UKM), data on the performance of public
service employees from each SKPD / Dinas. (Education,
Health, Social, and Cooperatives and UKM).

Volume 5, Issue 10, October – 2020 International Journal of Innovative Science and Research Technology
ISSN No:-2456-2165
IJISRT20OCT186 www.ijisrt.com 561
III. RESEARCH RESULT
Profile /Characteristics of Respondents
Respondents in this study were employees of the
Education Office, Health Service Office, Social Service
Office, and South Sulawesi Provincial Cooperative and
UKM Office, Education Office Staff, Health Service Office,
Social Service Office, and Makassar City Cooperative and
UKM Office. Employees of the Education Office, Health
Office, Social Service Office, and Parepare City
Cooperative and UKM Office. Of the four agencies,
employees (ASN) were selected to represent the sample
(respondents) at each service office, namely: 2 Heads of
Divisions, 4 Heads of Sub. Section, 4 Section Heads, and 8 Functional Staff. Of the 216 questionnaires that were
distributed to 216 employees (ASN) in the 4 service offices
mentioned above, only 180 were returned (answered) by the
respondents. This shows a very good return rate for the
questionnaire (Sudjana, 2002).
1. Characteristics of Respondents Based on Gender
Gender
Frequency
Percentage (%)
Male 105 58,33
Women 75 41,67
Total 180 100
Source: Data processed, 2020
Based on the table above, the respondents in this study
were mostly men, namely as many as 105 people (58.33%),
while women were 75 people (41.67%). This shows that
employees in the Regional Government of South Sulawesi
Province are dominated by men.
2. Characteristics of Respondents by Age
Age (Years)
Frequency
Percentage (%)
24 - 34 50 27,78
35 - 45 75 41,67
46 - 55 55 30,56
Total 180 100
Source: Data processed, 2020.
Based on table 5.10 above, the respondents in this
study were mostly aged 35 to 45 years, namely as many as
75 people (41.67%), while those aged 46 s.d. 55 years as
many as 55 people (30.56%), and only 50 people aged 24 to
34 years (27.78%). This shows that employees in the
Regional Government of South Sulawesi Province are
dominated by prime age, so they are expected to be able to
carry out their duties properly. Carry out its duties and
responsibilities to provide maximum service, according to
the needs of the community as the main mission of
government organizations.
3. Characteristics of Respondents Based on Tkt. Education
Level of
education
Frequency
Percentage (%)
D3 55 30,56
pelayananS1 80 44,45
S2 45 25
Total 180 100
Source: Data processed, 2020.
Based on table 5.11 above, most of the respondents in
this study had a Bachelor's degree (S1), namely 80 people
(44.45%), and 55 people (30.56%) had a D3 education,
while those with a Masters degree (S2) only 45 people
(25%). This shows that employees in the Regional
Government of South Sulawesi Province are dominated by
employees with a Bachelor's degree (S1), meaning that they
have the ability to understand and carry out their work well, according to organizational goals.
4. Characteristics of Respondents Based on Period of
Service
Years of service
Frequency
Percentage(%)
≤ 5 tahun 62 34,44
> 5 tahun 118 65,56
Total 180 100
Source: Data processed, 2020.
Based on the table above, the majority of respondents
in this study had a working period of more than 5 years,
namely 118 people (65.56%), while those who had a service
period of ≤ 5 years were 62 people (34.44%).
Hypothesis Testing Results
1. Goodnes of Fit SEM Testing
The theoretical model in the research conceptual
framework is said to be fit if it is supported by empirical
data. The results of testing the goodness of fit model,
according to the value of the analysis with the help of the
AMOS 25 program, are presented in full in the Appendix. In
essence, the Goodness of Fit is to find out whether the
hypothetical model is supported by empirical data. The test results are presented in the table as follows:
Goodness of Fit Overall Model Test Results
Criteria
Cut-off
value
Test
result
Description
CMIN/DF ≤ 2,00 2,130 Not Fit yet
Probability ≥ 0,05 0,000 Not Fit yet
CFI ≥ 0,95 0,942 Not Fit yet
TLI ≥ 0,95 0,926 Not Fit yet
RMSEA ≤ 0,08 0,079 Fit
Source: Primary data processed, 2020 (Attachment)
Volume 5, Issue 10, October – 2020 International Journal of Innovative Science and Research Technology
ISSN No:-2456-2165
IJISRT20OCT186 www.ijisrt.com 562
Based on the table above, the results of the Goodness
of Fit Overall test show that only the RMSEA criteria show good criteria (fit). According to Arbuckle and Wothke
(1999), the best criteria used as an indication of the
goodness of the model are CMIN / DF values that are less
than 2, and RMSEA which is below 0.08. In this study, only
the RMSEA value met the cut off value.
The analytical tool to test the hypothesis in this study
is Structural Equation Modeling (SEM). In SEM, there are
two testing models, namely a measurement model and a
structural model.
2. Testing the Measurement Model in SEM. The measurement model is measured from the loading
factor value on each indicator to the research variable. The
loading factor value shows the weight of each indicator as a
measure of each variable. An indicator with a large loading
factor shows that this indicator is the strongest (dominant)
measure of the variable. In the SEM output in the Appendix,
the loading factor is symbolized by standardized regression
weights.
Competency Variable (X1)
Competency indicators consist of three indicators, namely knowledge competence (X1.1), understanding
competence (X1.2), and skills competency (X1.3). The
indicator is declared significant to measure the variable if
the CR value is> 1.96 and the P value is <0.05.
The results of measurement model analysis on
indicators of the Competency variable (X1) can be presented
in the following table:
Results of Testing the Competency Variable
Measuring Indicator (X1)
Indicator Valueloading
factor ()
CR P
X1.1 0,369 4,744 0,000
X1.2 0,869 11,158 0,000
X1.3 0,848 Fix Fix
Source: Primary data processed, 2020 (Attachment)
Based on the table above, it can be seen that the three
indicators significantly measure the Competency variable
(X1). The table above shows that the second indicator
(X1.2) is the strongest indicator for measuring the
Competency variable.
CompensationVariable (X2)
The compensation indicator consists of three
indicators, namely payroll (X2.1), provision of honoraria
and incentives (X2.2), and allowances (X2.3). The indicator
is declared significant to measure the variable if the CR value> 1.96 and the P value <0.05.
The results of measurement model analysis on
indicators of the Compensation variable (X2) can be
presented in the following table:
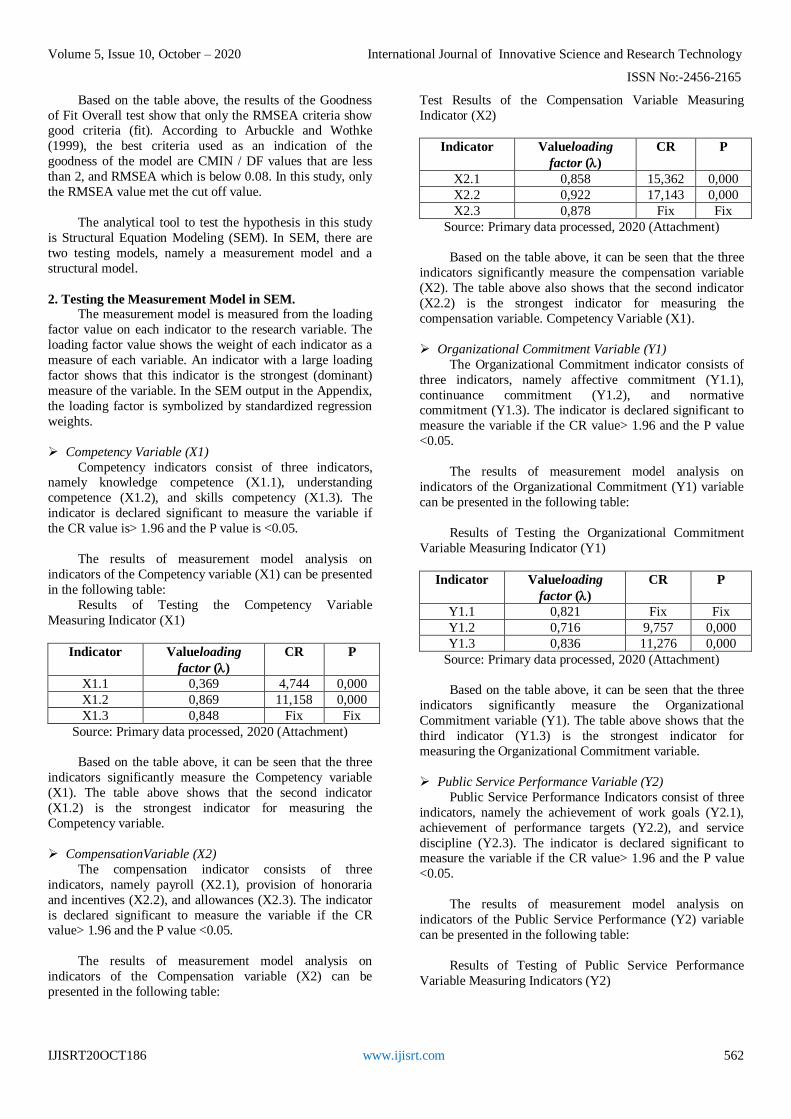
Test Results of the Compensation Variable Measuring
Indicator (X2)
Indicator Valueloading
factor ()
CR P
X2.1 0,858 15,362 0,000
X2.2 0,922 17,143 0,000
X2.3 0,878 Fix Fix
Source: Primary data processed, 2020 (Attachment)
Based on the table above, it can be seen that the three
indicators significantly measure the compensation variable
(X2). The table above also shows that the second indicator
(X2.2) is the strongest indicator for measuring the
compensation variable. Competency Variable (X1).
Organizational Commitment Variable (Y1)
The Organizational Commitment indicator consists of
three indicators, namely affective commitment (Y1.1),
continuance commitment (Y1.2), and normative commitment (Y1.3). The indicator is declared significant to
measure the variable if the CR value> 1.96 and the P value
<0.05.
The results of measurement model analysis on
indicators of the Organizational Commitment (Y1) variable
can be presented in the following table:
Results of Testing the Organizational Commitment
Variable Measuring Indicator (Y1)
Indicator Valueloading
factor ()
CR P
Y1.1 0,821 Fix Fix
Y1.2 0,716 9,757 0,000
Y1.3 0,836 11,276 0,000
Source: Primary data processed, 2020 (Attachment)
Based on the table above, it can be seen that the three
indicators significantly measure the Organizational
Commitment variable (Y1). The table above shows that the
third indicator (Y1.3) is the strongest indicator for
measuring the Organizational Commitment variable.
Public Service Performance Variable (Y2)
Public Service Performance Indicators consist of three
indicators, namely the achievement of work goals (Y2.1),
achievement of performance targets (Y2.2), and service
discipline (Y2.3). The indicator is declared significant to measure the variable if the CR value> 1.96 and the P value
<0.05.
The results of measurement model analysis on
indicators of the Public Service Performance (Y2) variable
can be presented in the following table:
Results of Testing of Public Service Performance
Variable Measuring Indicators (Y2)

Volume 5, Issue 10, October – 2020 International Journal of Innovative Science and Research Technology
ISSN No:-2456-2165
IJISRT20OCT186 www.ijisrt.com 563
Indicator Valueloading
factor ()
CR P
Y1.1 0,821 Fix Fix
Y1.2 0,716 9,757 0,000
Y1.3 0,836 11,276 0,000
Source: Primary data processed, 2020 (Attachment)
Based on the table above, it can be seen that these
three indicators significantly measure the Public Service Performance (Y2) variable. The table above shows that the
second indicator (Y2.2) is the strongest indicator in
measuring the Public Service Performance variable.
3. Testing the Structural Model in SEM
Hypothesis testing in this study can be seen in the
structural model. There are three types of influence that will
be presented in the structural model, namely the direct effect
(Standardized Direct Effect), the indirect effect (Standardized Indirect Effect), and the total effect
(Standardized Total Effect).
Testing the direct effect hypothesis is carried out by
testing the Critical Ratio (CR) on each direct effect partially.
If the value of CR> 1.96 or the value of Probability (P)
<0.05, it can be concluded that there is a significant effect,
on the contrary if the value of CR <1.96 or the value of
Probability (P)> 0.05, it can be concluded that there is no
influence. The complete analysis results are contained in the
SEM analysis results, can be seen in the Appendix. The
following table presents the results of testing the Standardized Direct Effect hypothesis.
Hypothesis Testing Results Direct Effect
The relationship between variables
Standardized
Value
CR
P
Description
Organizational Commitment Competence
0,446 5,094 0,000
Significant
Public Service PerformanceCompetence
0,311 3,397 0,000
Significant
Organizational Commitment Compensation
0,171 2,092 0,036
Significant
Public Service Performance Compensation
0,013 0,161 0,872
Insignificant
Public Service Performance Organizational Commitment 0,233 2,512 0,012
Significant
Source: Primary data processed, 2020 (Attachment).
From the table (Direct Effect Hypothesis testing
results) above, it shows that the compensation variable does
not have a significant effect on public service performance, because the probability value (significance) = 0.872> 0.05.
This is because the compensation system is implemented
based on statutory regulations, so that employees never
make an issue.
IV. DISCUSSION
The discussion of the results of this study is to answer
the problems that have been formulated and the proposed
hypotheses. To answer this hypothesis, the researchers
analyzed the results of the research obtained from
distributing questionnaires using Structural Equation Modeling (SEM) analysis tools. The model of measuring the
causal relationship between the Influence of Leadership
Style and Competence on Public Service Performance,
through Organizational Commitment. This has been
explained in the previous chapter that the measurement of
public service performance in addition to being directly
influenced by leadership style and competence, is also
indirectly influenced by the two variables above through
organizational commitment.
1. Testing the Measurement Model in SEM.
The measurement model is measured from the loading
factor value on each indicator to the research variable. The loading factor value shows the weight of each indicator as a
measure of each variable. An indicator with a large loading
factor shows that this indicator is the strongest (dominant)
measure of the variable. In the SEM output in the Appendix,
the loading factor is symbolized by standardized regression
weights.
Competency Variable (X1)
Competency indicators consist of three indicators,
namely knowledge competence (X1.1), understanding
competence (X1.2), and skills competency (X1.3). The
indicator is declared significant to measure the variable if the CR value> 1.96 and the P value <0.05.
The results of measurement model analysis on indicators of
the Competency variable (X1) can be presented in the
following table.
Results of Testing the Competency Variable
Measuring Indicator (X1)

Volume 5, Issue 10, October – 2020 International Journal of Innovative Science and Research Technology
ISSN No:-2456-2165
IJISRT20OCT186 www.ijisrt.com 564
Indicator Valueloading
factor ()
CR P
X1.1 0,369 4,744 0,000
X1.2 0,869 11,158 0,000
X1.3 0,848 Fix Fix
Source: Primary data processed, 2020 (Attachment)
Based on the table above, it can be seen that the three
indicators significantly measure the Competency variable (X1). The table above shows that the second indicator
(X1.2) is the strongest indicator for measuring the
Competency variable.
Variable Compensation (X2)
The compensation indicator consists of three
indicators, namely payroll (X2.1), provision of honoraria
and incentives (X2.2), and allowances (X2.3). The indicator
is declared significant to measure the variable if the CR
value> 1.96 and the P value <0.05.
The results of measurement model analysis on indicators of the Compensation variable (X2) can be
presented in the following table:
Test Results of the Compensation Variable Measuring
Indicator (X2)
Indicator Valueloading
factor ()
CR P
X2.1 0,858 15,362 0,000
X2.2 0,922 17,143 0,000
X2.3 0,878 Fix Fix
Source: Primary data processed, 2020 (Attachment)
Based on the table above, it can be seen that the three
indicators significantly measure the compensation variable
(X2). The table above also shows that the second indicator
(X2.2) is the strongest indicator for measuring the
compensation variable.
Organizational Commitment Variable (Y1)
The Organizational Commitment indicator consists of
three indicators, namely affective commitment (Y1.1),
continuance commitment (Y1.2), and normative
commitment (Y1.3). The indicator is declared significant to
measure the variable if the CR value> 1.96 and the P value
<0.05.
The results of measurement model analysis on
indicators of the Organizational Commitment (Y1) variable can be presented in the following table.
Results of Testing the Organizational Commitment
Variable Measuring Indicator (Y1)
Indicator Valueloading
factor ()
CR P
Y1.1 0,821 Fix Fix
Y1.2 0,716 9,757 0,000
Y1.3 0,836 11,276 0,000
Source: Primary data processed, 2020 (Attachment)
Based on the table above, it can be seen that the three
indicators significantly measure the Organizational Commitment variable (Y1). The table above shows that the
third indicator (Y1.3) is the strongest indicator for
measuring the Organizational Commitment variable.
Public Service Performance Variable (Y2)
Public Service Performance Indicators consist of three
indicators, namely the achievement of work goals (Y2.1),
achievement of performance targets (Y2.2), and service
discipline (Y2.3). The indicator is declared significant to
measure the variable if the CR value> 1.96 and the P value
<0.05.
The results of measurement model analysis on
indicators of the Public Service Performance (Y2) variable
can be presented in the following table.
Results of Testing of Public Service Performance
Variable Measuring Indicators (Y2)
Indicator Valueloading
factor ()
CR P
Y2.1 0,902 16,756 0,000
Y2.2 0,917 18,562 0,000
Y2.3 0,870 Fix Fix
Source: Primary data processed, 2020 (Attachment)
Based on the table above, it can be seen that the three
indicators significantly measure the variable Public Service
Performance (Y2). The table above shows that the second indicator (Y2.2) is the strongest indicator in measuring the
Public Service Performance variable.
V. CONCLUSIONS AND RECOMMENDATIONS
1. Conclusion
Referring to the formulation of the problem, research
objectives, hypotheses, results of the analysis and discussion
that have been stated in the previous chapter, the following
conclusions can be drawn:
1. Competence (X1) has a direct and significant effect on the Employee Public Service Performance (Y2) of the
Regional Government of South Sulawesi Province. This
means that the application of a competency system in the
placement and development of employees will encourage
employee performance improvements in providing
services to the community.
2. Competence (X1) has a direct and significant effect on
Organizational Commitment (Y1). This means that the
application of a competency system in the placement and
development of employees will encourage improvement
and strengthening of organizational commitment. 3. Competence (X1) has an indirect and significant effect on
Employee Public Service Performance (Y2) of the
Regional Government of South Sulawesi Province,
through Organizational Commitment (Y1). This means
that the application of a competency system in the
placement and development of employees and by
developing and strengthening organizational

Volume 5, Issue 10, October – 2020 International Journal of Innovative Science and Research Technology
ISSN No:-2456-2165
IJISRT20OCT186 www.ijisrt.com 565
commitment will encourage employee performance
improvement in providing services to the community. 4. Compensation (X2) has no direct effect on the Employee
Public Service Performance (Y2) of the Regional
Government of South Sulawesi Province. This means
that the application of the compensation system does not
encourage employee performance improvement, because
the compensation system, especially direct compensation
(financial) has been regulated in laws and regulations.
5. Compensation (X2) has a direct and significant effect on
Organizational Commitment (Y1). This means that
implementing a good compensation system will
strengthen organizational commitment.
6. Compensation (X2) has an indirect and significant effect on Employee Public Service Performance (Y2) of the
Regional Government of South Sulawesi Province,
through Organizational Commitment (Y1). This means
that implementing a good compensation system and
developing and strengthening organizational
commitment will encourage employee performance
improvements in providing services to the community.
7. Organizational Commitment (Y1) has a direct and
significant effect on Employee Public Service
Performance (Y2) of the Regional Government of South
Sulawesi Province. This means that developing and strengthening organizational commitment will encourage
employee performance improvement in providing
services to the community.
2. Suggestions
Leaders of organizations / SKPD and organizational
units of Regional Government agencies in South Sulawesi,
especially those related to services to the community
(public), should pay attention to the following matters:
1. Applying the right leadership style, according to the
conditions of the organization and employees so that it
can influence employees to carry out their duties in order to achieve organizational goals.
2. Develop and implement a competency system in
assigning and assigning tasks to employees /
subordinates, so that they can carry out their respective
duties with good performance.
3. Implement a good compensation system, both direct
compensation (financial) and indirect compensation
(non-financial), so that employees feel that their needs
and careers are paid attention to.
4. Fostering and strengthening good organizational
commitment, so that employees always feel as an inseparable part of the organization so that they always
try their best in carrying out their duties to achieve
organizational goals / government agencies as public
service agencies.
REFERENCES
[1]. Abelio Petrik dan Fransisca Andreani, 2015. Analisa
Pengaruh Gaya Kepemimpinan Transformasional
Terhadap Kinerja Karyawan, dengan Kepuasan Kerja
sebagai variabel antara pada PT. Anugrah Baru
denpasar. Agora Vol. 3, 2. Prodi Manajemen,
Universitas Kristen Petra.
[2]. Adi, Iwayan, Asdita. dan Sadha, I Made, S. 2012.
Pengaruh komitmen Organisasi, Budaya Organisasi
dan Kepuasan Pengguna SIMDA pada Kinerja Satuan
Kerja Perangkat Daerah. E-Jurnal Ekonomi dan
Bisnis, Unud Bali.
[3]. Agung, Dewa, Made. Wiguna, Putra. Darmadiaksa, Bagus, I De. 2016. Pengaruh Penerapan Sistem
Informasi Akuntansi terhadap Kinerja Individual
dengan Budaya Organisasi sebahgai Pemoderasi, E-
Jurnal, Vol. 17, 1. Unud Bali.
[4]. Amins, 2012. Manajemen Kinerja Pemerintahan
Daerah. Laksbang Presindo, Yogyakarta.
[5]. Andi Veny Anggreany M, 2017. Pengaruh
Kompetensi, Motivasi, dan Lingkungan Kerja fisik
terhadap Kinerja Pegawai pada Kantor Dinas Energi
dan Sumber Daya Mineral Kabupaten Donggala. e
Jurnal Katalogis, Volume 5 Nomor 1Januari 2017 hlm 44-51
[6]. Angle, H.L. Perry, J.L. 1985. An Empirical Assesment
of Organizational Commitment and Organizational
Affectiveness, Adminitrative Science Quarterly, p. 1-
14.
[7]. Anggreany, Andi. Veni, M. 2017. Pengaruh
Kompetensi, Motivasi, dan Lingkungan Kerja Fisik
Terhadap Kinerja Pegawai pada Kantor Dinas Energi
dan Sumber Daya Mineral Kabupaten Donggala, e
Jurnal Katalogis, Volume 5 Nomor 1, Januari 2017
hlm 44-51.
[8]. Alan Bryman, Emma Bell, 2007. Business Research Methods, second edition, Oxford University Press.
[9]. Aucoin, P. 1990. Administrative Reform in Public
Management: Paradigms, Prinsiples Paradays and
Pandulums Governmance, A International Journal of
Policy and Administration, Vol. 3, No.2.
[10]. Amstrong, Atkinson, A. Anthony, 1997. A Stakeholder
Apoach to Strategic Performance Measurement, Sloan
Management Review, Spring, 25-37.
[11]. Basuki, Rakhmat. 2016. Pengaruh Gaya
Kepemimpinan dan Komitmen Organisasi terhadap
Kinerja PNS Fakultas Teknik Universitas Sebelas Maret Surakarta, dengan Motivasi sebagai
pemoderasi, Prodi. Magister Manajemen, Sekolah
Pascasarjana Universitas Muhammadiyah Surakarta.
[12]. Bruce, J. Waldman, D.A. dan Entein, W.O. 1998.
Transformasional Leadership in A Management Game
simulation: Group and Organizational Studies, Vol. 13,
p. 59-80.
Volume 5, Issue 10, October – 2020 International Journal of Innovative Science and Research Technology
ISSN No:-2456-2165
IJISRT20OCT186 www.ijisrt.com 566
[13]. Bernard, Bass, M. 1985. Leadership and Performance
Beyond Expectation. New York: The Free Press. [14]. Bernard, Bass, M. dan Bruce Avolio J. 1994.
Improfing Organizational Effectiveness Throuugh
Transformational Leadership: Leadership in Leading
Organizations Perspectives for A New Era. Gill
Robinson Hickman (Editor). Sage Publication, Inc.
[15]. Bernard, Bass M. Bruce, Avolio J. dan Berson Yair.
2003. Predicting Unit Performance by Assessing
Transformational and Transactional Leadership.
Woshingtong DC.
[16]. Barman, M. W.D. Reisel. Dan Probost, T.M. 2004.
Managerial and Personal Control Model: Predictions
of Work Alienation and Organizational Commitment in Hungary. Journal of Intern 192, p. 10 (3): 375-392.
[17]. Barman, Shawn, L. 1999. Does Stakeholder
Orientation Matter The Relationship Between
Stakeholder Management Model and Firm Financial
Performance, Accademy of Manegement journal Vol.
42, 488-506.
[18]. Brown. 2014. The Effects of Emotional Intelligence
(EI) and Leadership Style on Sales Performance.
Economic Insights – Trends and Challenges, Vol. 3,
No. 3, pp: 1-14.
[19]. Bungin. dan Burhan. 2007. Metodologi Penelitian Kualitatif, Penerbit PT. Raja Grafindo Persada,
Jakarta.
[20]. Burch, J. dan Grudnitski, G. 1986. Information System
Theory and Practice. New York: John Wiley and
Sons.
[21]. Burns, James, dan Gregor, Mc. 1987. Transctional
and transforming Leadership. Leadership in Leading
Organizations Perspectives for A New Era, Gill
Robinson Hikman (Editor), Sage Publication, Inc.
[22]. Bycio, Peter S. Aleen. and Rick D. Hacket, 1995.
Futher Assesment of Bass’s. 1995. Conceptualization
on Transacttional and Transformasional Leadership. Journal of Applied Psyvhology, vol. 80, No. 4. P. 468-
478.
[23]. Colvin, Robert E. 1998. Transactional Leadership: A
Perescription for Contemporary Organizations,
http//www. Google.com.
[24]. Daniel, Jonson. 2000. The Impact of Internalization
and Globalization of the Economy Upon, Legal
Institution and Leal Proffesion in an Age of
Computerization and Globalization, Yayasan Hak
Asasi Manusia , Demokrasi dan Supermasi hukum.
[25]. Flippo, Edwin, B. 2006. Principle Of Personnel Management. Eighth Edition. Tokyo: Mcgraw-Hill,
Kogakhusa Ltd.
[26]. Forster, Nick. 2005. Maximum Performance : A
Practical Guide To Leading And Managing People At
Work. Northampton: Edward Elgar Publishing, Inc.
[27]. Gibson. 1997. Organisasi, Perilaku, struktur dan
Proses, Jilid 2 Edisi Kedelapan,Binarupa Aksaera
Jakarta.
[28]. Gordon, Ivancevic, Donnely. 1998. Organisasi
Perilaku Struktur dan Proses, PT. Aksara Pratama,
Jakarta.
[29]. Handoko, Hani T, danReksohadiprodjo,Sukanto. 1996.
Organisasi Perusahaan. EdisikeduaYogyakarta : BPFE.
[30]. Handoko. 2012. Manajemen Personalia dan Sumber
Daya Manusia. Yogyakarta: BPFE.
[31]. Haryanto. 2013. Pengaruh Penerapan Sistem
Informasi Perpustakaan terhadap Kinerja
Pelayanan Sirkulasi di Perpustakaan Universitas Gaja
Mada.
[32]. Hasibuan, M.S.P. 2009.
ManajemenSumberDayaManusia. Jakarta: PT.
BumiAksara.
[33]. Hood, C. 1991. A Public Management for All Seasson?
Public Administration Vol. 69, No.1. [34]. Hughes, 2003. New Public Management, A
Partimentry Prespective Working Paper Faculty of
Business and Mcnas University.
[35]. ---------- , 1998. Pulic Management and
Administration,St. Martines Press INC, 1998.
[36]. Jan jonker, Bertjan J.W. Pennink, Sri Wahyuni, 2011.
Motodologi Penelitian; Panduan untuk Master dan
Ph.D., Bidang Manajemen. Penerbit Salemba Empat.
[37]. Katauneh, Ahmad, Izzoh. Dan Osman, Abdullah.
2014. The impact of Core Competencies in improving
the Organization commitment of employees in Mutah University in Jordan, International Journal of
Academic Research in Business and Social Sciences,
August 2014, Vol. 4, No. 8 ISSN: 2222-6990.
[38]. KeputusanMenteriPendayagunaanAparatur Negara
Nomor 63 Tahun
2005,tentangPedomanPelayananPublik.
[39]. Kreitner, R., Kinicki, A, 2005.PerilakuOrganisasi 5
ed. Jakarta: SalembaEmpat.
[40]. Locke, As’ad M, 2003. Psikologi Industri; Seri
Sumber Daya manusia, Yogyakarta Liberty.
[41]. Luthans, (1998: 125). Perilakuorganisasi, EdisiBahasa
Indonesia. Yogyakarta: Andi. [42]. Mahdi, Omar Rabeea.Shafizan, ErzanBin Gulam.dan
Almsafir,Mahmoud Mohd Khalid. 2013.
DampakPerilakuKepemimpinanTerhadapKomitmenOr
ganisasipada Perusahaan Perkebunan di Malaysia,
2nd World Conference On Business, Economics And
Management -WCBEM 2013.
[43]. Nawawi, Muh. 2012. Pengaruh Motivasi dan
Kompetensi Tenaga Kesehatan terhadap Kinerja Pusat
Kesehatan Masyarakat.MIMBAR, Vol. XXVIII, No.
1 (Juni, 2012): 93-102, Fisip. Universitas Tadulako.
[44]. Osbone, D. And Gaebler, 1993. Reinveting Government: How the Entreprenewral Spirit is
Transforming The Public sektor, Prentce Hol India
Private Limited, New delhi.
[45]. Pollit, C. 2000. Public Management Reform:
Comparative Analysis, Orford University Press Online
Summary.
[46]. Pradita, Mokhamad, Yanuar. 2017.Pengaruh
Kompensasi, Gaya Kepemimpinan dan Karakteristik
Tenaga pemasarn pada PT. BRI Persero (Tbk)
Cabang Jombang.Jurnal Bisnis dan Manajemen Vol. 4
No.2, Juni 2017, p 153-164
Volume 5, Issue 10, October – 2020 International Journal of Innovative Science and Research Technology
ISSN No:-2456-2165
IJISRT20OCT186 www.ijisrt.com 567
[47]. Prayatna, Agus Heri. dan Made Subudi. 2016.
Pengaruh Gaya Kepemimpinan Terhadap Stres Kerja dan Kepuasan Kerja Karyawan Pada Fave Hotel
Seminyak. E-Jurnal Manajemen Unud, 5(2): pp: 845-
872.
[48]. Rafieia, Mojtaba. Anib, Mohammad, Taghi. Dan
Foroozandehc, Navid. 2014.Studying the impact of the
organizational commitment on the job
performance.Management Science Letters 4 (2014)
1841–1848, Contents lists available at
GrowingScience Management Science Letters,
homepage: www.GrowingScience.com/msl.
[49]. Rahidin, Muhammad. 2013. Pengaruh moral
danKomitmenOrganisasiterhadapKinerjaPegawai, dengan Organizational Citizenship Behavior (OCB)
sebagaivariabel intervening
padaDinaspertanianTanamanPanganKabupatenKrinci
, Artikel Prodi. Manajemen PPs. Universitas Bung
Hatta.