The Effect of Compensation Disclosure on Compensation ... effect of compensation... · 2 The Effect...
34
1 The Effect of Compensation Disclosure on Compensation Benchmarking: Evidence from China Wei Jiang Department of Accounting, School of Management Center for Management Accounting Research Jinan University Guangzhou 510275, China Email: [email protected] Xinxin Liao School of Business Sun Yat-Sen University Guangzhou 510275, China Email: [email protected] Bingxuan Lin College of Business Administration University of Rhode Island Kingston, RI 02881 Email: [email protected] 1-401-874-4895 Yunguo Liu* School of Business Sun Yat-Sen University Guangzhou 510275, China Email: [email protected] Wei Jiang acknowledges the financial support of the National Natural Science Foundation of China (71272212), the Humanities and Social Science Foundation of the China Ministry of Education (11YJC630076), Institute of Enterprise Development at Jinan University (2014ZD001) and the Fundamental Research Funds for the Central Universities at Jinan University (12JNYH003). * Contact Author
Transcript of The Effect of Compensation Disclosure on Compensation ... effect of compensation... · 2 The Effect...

1
The Effect of Compensation Disclosure on Compensation Benchmarking:
Evidence from China
Wei Jiang
Department of Accounting, School of Management
Center for Management Accounting Research
Jinan University
Guangzhou 510275, China
Email: [email protected]
Xinxin Liao
School of Business
Sun Yat-Sen University
Guangzhou 510275, China
Email: [email protected]
Bingxuan Lin
College of Business Administration
University of Rhode Island
Kingston, RI 02881
Email: [email protected]
1-401-874-4895
Yunguo Liu*
School of Business
Sun Yat-Sen University
Guangzhou 510275, China
Email: [email protected]
Wei Jiang acknowledges the financial support of the National Natural Science Foundation of China (71272212),
the Humanities and Social Science Foundation of the China Ministry of Education (11YJC630076), Institute of
Enterprise Development at Jinan University (2014ZD001) and the Fundamental Research Funds for the Central
Universities at Jinan University (12JNYH003).
* Contact Author

2
The Effect of Compensation Disclosure on Compensation Benchmarking:
Evidence from China
Abstract
Improved compensation disclosure might minimize unscrupulous compensation
behavior by entrenched executives, and it could allow better benchmarking against
peer groups. Meanwhile, with improved disclosure, executives can collectively defend
their high salaries by engaging in opportunistic peer selection behavior. Better
disclosure also forces companies to pay their executives market salaries. Using a
sample of Chinese companies, we find that industry benchmarking is prevalent in
China. Moreover, since the amended regulation for executive compensation
disclosure in 2005, executives whose compensations are above the industry average
have experienced much smaller pay raises, and executives whose compensations are
below the industry average have had much higher pay raises. The results of our study
are robust after controlling for various firm and industry characteristics. The results
also show that companies controlled by different entities (i.e., central government,
local government or non-government) behave very differently in response to
enhanced compensation disclosure. These findings highlight the importance for
policymakers of understanding how different firms react to improved disclosure, and
how various firms face different incentives concerning disclosure.

3
The demand for greater corporate compensation disclosure has increased
considerably in recent years, especially since the 2008 financial crisis. However,
studies on executive compensation disclosure have yielded many different results. On
the one hand, improved compensation disclosure is associated with better governance,
higher pay-for-performance sensitivity and improved monitoring by stakeholders (Lo,
2003; Perry and Zenner, 2001; Vafeas and Afxentiou, 1998). On the other hand,
compensation disclosure regulations appear to have very little effect in mitigating the
problems involved in corporate compensation practices (Faulkender and Yang, 2013).
There might also be unintended consequences of better disclosure, as disclosure may
aggravate agency problems and affect related costs (Hermalin and Weisbach, 2012).
Compensation disclosure in emerging markets can be especially difficult to analyze
due to weak corporate governance, lax enforcement of security laws and a poor
disclosure environment. Leuz and Wysocki (2008) point out that there have been
major changes in disclosure regulations in many emerging markets. However, these
regulations may have different effects in various markets due to the diversity of
institutional and economic factors.
Executive compensation disclosure in China is fairly limited. In 1998, the
China Security Regulatory Commission (CSRC) required listed firms in China to
disclose information about top executive compensation. However, this regulation only
required companies to report the total compensation for the three highest-paid
managers. As corporate governance in China slowly improved and demand for
corporate disclosure became greater, the CSRC issued new rules in 2005. Under the

4
new disclosure regulation, all listed firms are required to report the compensation,
including the salaries, bonuses, stipends and other benefits for the top three executives
separately. This disclosure regulation of 2005 is in many ways comparable to the
1992 United States Securities and Exchange Commission (SEC) revisions to its rules
governing disclosure of executive compensation.
Although the CSRC 2005 disclosure regulation does not require firms to
reveal their compensation peers (as the 2006 U.S. SEC rule does), it does give firms
access to peer compensation information at the individual level, which allows for
better benchmarking. The extant literature suggests that firms are likely to benchmark
against their peers, and the use of benchmarking has a significant effect on CEO
compensation (Bizjak et al., 2008; Bizjak et al., 2011; Albuquerque et al., 2013).
In this study, we examine how executive compensation benchmarking
behavior has changed in response to the new 2005 regulation. We find that under the
amended regulation, executives whose compensations are above the industry average
have experienced much smaller pay raises, and executives whose compensations are
below the industry average have seen much higher pay raises. The results of our study
are robust after controlling for various firm and industry characteristics. Furthermore,
we find that companies controlled by different entities (i.e., central government, local
government or non-government) behave very differently in response to enhanced
compensation disclosure. Specifically, executives whose compensations are above the
industry average generally receive lower pay increases in the subsequent year. After
2005, this effect has been stronger for firms controlled by the central government, but

5
weaker for firms controlled by local governments or non-government entities.
Meanwhile, executives whose compensations are below the industry average have
received higher pay increases in the subsequent year. This effect, however, has been
weaker for firms controlled by the central government and stronger for firms
controlled by local governments. Also, the 2005 regulation does not seem to have any
effect on firms controlled by private entities. Our findings suggest that due to agency
conflicts and labor market competition, firms controlled by different entities tend to
react differently to the disclosure policy change.
Our study contributes to the literature in the following ways. First, we provide
a direct analysis of the 2005 CSRC compensation disclosure, showing that increased
disclosure leads to both intended and unintended economic consequences that vary
among different types of firms. Although China has become the world’s largest
economy, its governance and disclosure environment remain weak (Fan et al., 2007;
Jiang et al., 2010). It is therefore important to understand how the requirement for
compensation disclosure might have varying effects on corporate behavior. Second,
we extend the study of Ezzamel and Watson (1998), which suggests that managers
who are paid more than their peers and managers who are paid less than their peers
face different pressures and incentives for inflating their pay, and they often do so by
using peer groups as benchmarks. Finally, we contribute to the growing literature that
examines CEO compensation in China. Previous studies on the Chinese market have
examined many aspects of executive compensation, including pay-for-performance
sensitivity (Firth et al., 2006; Gu et al., 2010), corporate governance (Conyon and He,

6
2011), managerial power and entrenchment (Chen et al., 2011; Lin and Lu, 2009) or
executive compensation in family firms (Cheng et al., 2014). However, very few
studies have explored benchmarking behavior in China. Our study fills this gap in the
research and shows how benchmarking behavior can change in response to the new
disclosure requirement.
The remainder of this study is organized as follows. Section 2 discusses the
related literature and introduces our hypotheses. Section 3 presents our sample
description, the variable definitions and the empirical methodology. Section 4 reports
our empirical analysis. Section 5 gives the results of robustness tests, and Section 6
offers conclusions from the study.
2. Literature Review and Hypotheses Development
Corporate disclosure regulation can result in both firm-specific benefits and
costs. On the one hand, greater disclosure is often associated with improved market
liquidity (Verrecchia, 2001), reduced agency cost (Shleifer and Wolfenzon, 2002) and
lower cost of capital (Lambert et al., 2007). On the other hand, improved disclosure
exposes firms to indirect costs, as firm-specific information can disclose the firm’s
disadvantages to competitors or regulators (Verrecchia, 1983; Feltham et al., 1992).
Ernstberger and Gruning (2013) show that a country’s regulatory environment
interacts with firm governance arrangements to affect the quality of disclosure. It is
therefore helpful to examine the pros and cons of disclosure in different regulatory
settings. Leuz and Wysocki (2008) review the literature on disclosure regulation and

7
suggest that the extant literature focuses heavily on regulatory changes in the U.S.
market, and that the major regulatory or enforcement changes in other countries are
largely ignored. Examining the effect of regulatory disclosure in China can therefore
provide us with new insights with respect to how regulatory disclosure might result in
different kinds of corporate behavior in regulatory environments outside the U.S.
We specifically focus on the effect of compensation disclosure on
compensation peer benchmarking in China1
. In the U.S., market compensation
disclosure has become a focal point of public interest since the early 1990s. The SEC
disclosure rules of 1992 and 2006 are major regulations that specify the information
to be released in company compensation disclosures. Many studies have shown that
better compensation disclosure results in improved corporate governance and better
pay-for-performance sensitivity (Franco et al., 2013; Vafeas and Afxentiou, 1998; Ke
et al., 1999; Lo, 2003). The SEC rule of 2006 requires firms to disclose the pay-
setting process by revealing which compensation peer groups are considered. This
disclosure allows researchers to look inside the black box and explore how firms pick
their peer groups. Faulkender and Yang (2010) analyze firms in the S&P 500 and the
S&P 400 Midcap firms. These researchers find that firms tend to select highly paid
peers to justify their CEO compensations. In a subsequent study, Faulkender and
Yang (2013) conclude that strategic peer benchmarking has remained prevalent since
the SEC 2006 disclosure requirement. The findings of these researchers suggest that
1 For a comprehensive review of compensation policy in China, please refer to Conyon and He (2011)
and Beaulier et al. (2012).

8
disclosure regulation does very little to mitigate the agency problems involved in
compensation practice. However, Cadman and Carter (2013) use a broader sample
and find that opportunism is not the main motive behind such peer group selection.
Compensation disclosure in China started in 1997, when the CSRC required
all listed firms to disclose compensation information for their executives. However,
the 1997 regulation was so vague that companies could often bury the compensation
disclosure amidst lengthy corporate annual reports. The CSRC modified its rule in
2001 and required a separate section in the annual report dedicated to compensation
disclosure. Furthermore, the CSRC 2001 rule required firms to disclose more specific
compensation information, such as the process of setting the compensation, the total
compensation, the sub-totals of compensation for the three most highly paid managers,
the allowance for independent directors and the intervals of compensation (Beaulieu
et al., 2012). In 2005, the CSRC issued another update and required that listed
companies report individual executive compensations, instead of the aggregate
compensations of the top three executives. Following the 2005 update, corporate
reports disclosed executive compensation at the individual level for the first time.
This change allowed companies to figure out the exact compensation earned by other
executives in firms of the same industry or of similar size.
Bizjak et al. (2008) show that the category of firms in the same industry is one
of the most popular benchmarks used by companies, and that managers usually target
their pay at or above the median (mean) level of their industry peers. We hypothesize
that Chinese companies normally use the industry average compensation as their

9
benchmark to set executive compensation. In many cases, we have observed
companies such as Shenzhen Wanke (ticker 000002) explicitly stating that they set
their executive compensation based on the compensation level in the same industry.
Given the more detailed disclosure requirements since 2005, firms have had easier
access to executive pay information about their peers. Therefore, many firms find it
convenient to benchmark against their peers in the same industry. Hence, we propose
the following hypotheses:
H1a: Chinese companies use industry benchmarking to determine executive
compensation.
H1b: This benchmarking behavior has grown more prevalent since 2005.
Compensation benchmarking might result in different outcomes for executives
who are paid above the benchmark and for those who are paid below it. Using social
comparison and equity theories, Ezzamel and Watson (1998, 2002) find that external
labor markets and internal pay comparisons are critical factors in determining
executive pay. Furthermore, these researchers find evidence that shows asymmetric
adjustment to prior-period pay anomalies. Specifically, the pay of relatively under-
paid executives displays much higher sensitivity to comparison with external market
pay levels. With greater compensation disclosure, we should expect that the under-
paid executives2 have a much stronger case for requesting higher pay. At the same
time, we should expect that the over-paid executives are under greater pressure to
2 In this study, the terms under-/over-paid refer to compensation levels below/above industry average.

10
curb excessive compensation. We therefore suggest the following additional
hypotheses:
H2a: Executives whose compensations are above the industry average will
receive lower pay increases in the subsequent year, and executives whose
compensations are below the industry average will receive higher pay
increases in the subsequent year.
H2b: The asymmetric adjustments in salary between the over-paid and under-
paid executives are more striking since 2005.
Adjustments in salary are also closely linked to various other factors such as
management incentives and labor market competition. One of the unusual
characteristics of Chinese companies is their diversity in forms of ownership control.
Firms can either be controlled by the government as state-owned enterprises (SOEs)
or owned by private entities. Among SOEs, there are also major differences between
SOEs affiliated with the central government (SOECGs) and SOEs affiliated with local
governments (SOELGs).
Chen et al. (2009) show that SOECGs are subject to strict supervision.
Executives in SOECGs are appointed by the central government, and many of them
eventually become vice ministers of state. The levels of compensation in these firms
are thus less important to the executives than their political careers. In extreme cases,
we can expect SOECG executives to sacrifice their compensation levels for the sake
of career advancement. Hence, we would expect the pay of SOECG executives to
11
adjust more slowly, even if they have been relatively under-paid in the past. When
compensation disclosure becomes more transparent after 2005, we expect managers in
SOECGs to have fewer incentives to increase their monetary compensation, since
they derive greater benefit from political advancement rather than direct
compensations. Meanwhile, the central government has also issued several
regulations to limit the compensation for SOECG executives, and this in turn would
create greater pressure for over-paid executives to receive lower pay increases (even
pay cut) if compensation information becomes public. Therefore, if there is greater
transparency in compensation disclosure after 2005, SOECG executives who were
over-paid compared to the industry average would expect to receive much lower pay
increases.
SOELGs, however, are subject to weaker supervision and management (Chen
et al., 2009). Jiang et al. (2010) find that tunneling behavior is more severe for
SOELGs than for SOECGs, which suggests a more severe agency problem for
SOELGs. We therefore hypothesize that executives of SOELGs are more likely to
engage in opportunistic benchmarking behavior. If peer compensation information
becomes available, SOELG executives can justify a higher pay raise using selective
benchmarks. We expect under-paid SOELG executives to increase their compensation
faster after 2005. For over-paid executives, we also expect their salaries to be less
responsive to the industry benchmarks, due to the heightened agency conflicts within
SOELGs. They will have greater incentives to engage in selective benchmarking
behavior in order to maintain their higher pay level.

12
For private non-SOE firms, the compensation for executives is more directly
driven by the competitive labor market, and we expect under-paid executives to have
greater salary increases after 2005 when peer compensation information becomes
more available. Overall, we propose the following hypotheses:
H3a: Over-paid (under-paid) executives in SOECGs will receive less (more)
pay increase in the following year; however, this pattern is more (less)
pronounced since 2005.
H3b: Over-paid (under-paid) executives in SOELGs and non-SOE firms will
receive less (more) pay increases in the following year, and this pattern is less
(more) pronounced since 2005.
3. Data, Variable Definition and Empirical Methodology
3.1 Data and Definitions of Variables
Our sample includes all firms listed in the China Stock Market and
Accounting Research (CSMAR) database during the period between 2003 and 2007.
We use data from the two years before and after 2005 to construct the sample for
comparison. We exclude firms in the financial sector, because their financial data are
not directly comparable to those of other firms. We also remove observations with
missing financial information, ownership data or compensation information, and firms
missing two consecutive years of information on managerial compensation, sales
growth, debt, ROA or firm size. To mitigate the influence of possible spurious outliers,

13
we also winsorize all variables at the 1% and 99% level. We obtain a final sample of
2878 firm-year observations.
One of the key variables of interest is the change in compensation from year t-
1 to year t. As companies only disclosed the sum of their top three executives’
compensations prior to 2005, we can only examine the compensation benchmarking
behavior for the top three executives as a whole. We define Compen as the total
compensation of the three highest-paid executives in the firm. ∆Compen is computed
as Compen in the current year (t) minus Compen in the previous year (t-1), scaled by
Compen in year t-1. To measure the effect of peer benchmarking, we first identify
peer firms as those operating in the same industry (as classified by the CSRC). We
then define the mean and the median of the total compensation reported by these firms
as PeerMean and PeerMed. The measure of peer benchmarking (BMark) is the
difference between company compensation and peer compensation, which are defined
as BmarkMean = (PeerMean-Compen)/PeerMean, or BmarkMed = (PeerMed-
Compen)/PeerMed. Hence, if executives are paid above the industry average,
BmarkMean and BmarkMed should be negative. To facilitate the interpretation of our
results, we use the absolute value of these variables when conducting the empirical
tests.
Following previous studies, we control for corporate governance and company
financial characteristics. As in the studies by Albuquerque et al. (2013), Bizjak et al.
(2008; 2011) and Cadma and Carter (2014), we control for the ultimate owner of the
firm. Ownership equals 1 if a firm is controlled by the state, and 0 otherwise. We also
14
control for ownership by the largest shareholders. Topshare is measured as the
number of shares owned by the largest shareholder divided by the total shares
outstanding. Duality equals 1 if the CEO is also the chairman of the board, and 0
otherwise. Board independence (BIndepen) is proxied by the number of independent
directors in relation to the total number of directors. Board size (Bsize) is the natural
log of the number of directors on the board. ∆Growth represents change in sales
growth, with sales growth measured by (Salest-Salest-1)/Salest-1. ∆Lev represents
change in leverage, and is measured by (Levt-Levt-1)/Levt-1. Lev is defined as total
debts over total assets. ∆ROA represents change in return on total assets, and is
measured by NIt/Total Assett –NIt-1/Total Assett-1. ∆Size is the change in firm size, and
firm size is measured as the natural log of total assets. To control for the effect of the
2005 split-share structure reform (Liao et al., 2014), we also control for the number of
non-tradable shares (Ntradeshares) issued by the firm. Finally, we define a dummy
variable Period05 that equals 1 if the observation occurs after 2005, and 0 otherwise.
Insert Table 1 Here
Table 2 shows the summary of statistics for our sample. The mean (median)
value for the dependent variable, ∆Compen, is 0.0175 (0.0114). BmarkMean has a
mean of 0.0271 and a median of 0.0245. BmarkMed has very similar results,
suggesting that very little difference exists between the two industry peer benchmarks.
We also find that 69.85% of our observations are SOEs. We therefore further classify
our sample into SOEs controlled by the central government and SOEs controlled by

15
local governments. We classify 11.02% of our observations as SOECGs and 58.83%
as SOELGs.
Insert Table 2 Here
3.2 Empirical Models
Following Bizjak, Lemmom and Naveen (2008), we use the following two
models to test the effects of industry compensation benchmarking:
∆Compen = β0 + β1 |BMark| + β2 Period05 + β3 Ownership + β4 Topshare
+ β5 Duality + β6 BIndepen + β7 Bsize + β8 ∆Growth + β9 ∆Lev
+ β10∆ROA + β11 ∆Size + β12 Ntradeshares + Σ Year + Σ Industry (1)
∆Compen = β0 + β1 |Bmark| + β2 |Bmark| × Period05 + β3 Period05 + β4 Ownership
+ β5 Topshare + β6 Director + β7 Indepen + β8 Bsize + β9 ∆Growth
+ β10 ∆Lev + β11 ∆ROA + β12 ∆Size +β13 Ntradeshares + Σ Year
+ Σ Industry (2)
In both models we control for the year and industry fixed effects. The industry
benchmarking measure Bmark is either the mean compensation benchmark
(BmarkMean) or the median compensation benchmark (BmarkMed).
4. Empirical Results

16
The results for model 1 using the full sample are shown in Table 3. The
coefficient for BmarkMean (BmarkMed) is 0.1747 (0.1871) and is significant at the 1%
level. This result suggests that industry benchmarking is evident in the Chinese
market.
We then divide the full sample into two groups: those in which executives are
paid above the mean level of their industry peers, and those in which executives are
paid below that level. In general, increases in size and firm performance (∆ROA) are
associated with positive pay increases. It is worth noting that BmarkMean is negative
if the executives are paid more than their peers. To make interpretation easier, we use
the absolute value of BmarkMean in these tests. We can then interpret the negative
and significant coefficient for BmarkMean as evidence suggesting that executives
who are paid above the industry average tend to subsequently receive lower pay raises.
The coefficients for BmarkMean and BmarkMed are -0.4711 and -0.4823,
respectively. For the group of executives paid below the industry average, the
coefficients for BmarkMean and BmarkMed are both positive and they are significant.
These results suggest that the more an executive is under-paid, the greater a pay
increase she will receive in the subsequent year. These results are consistent with
hypotheses 1a and 2a.
Insert Table 3 Here
We next run model 2 and examine the effects of the 2005 compensation
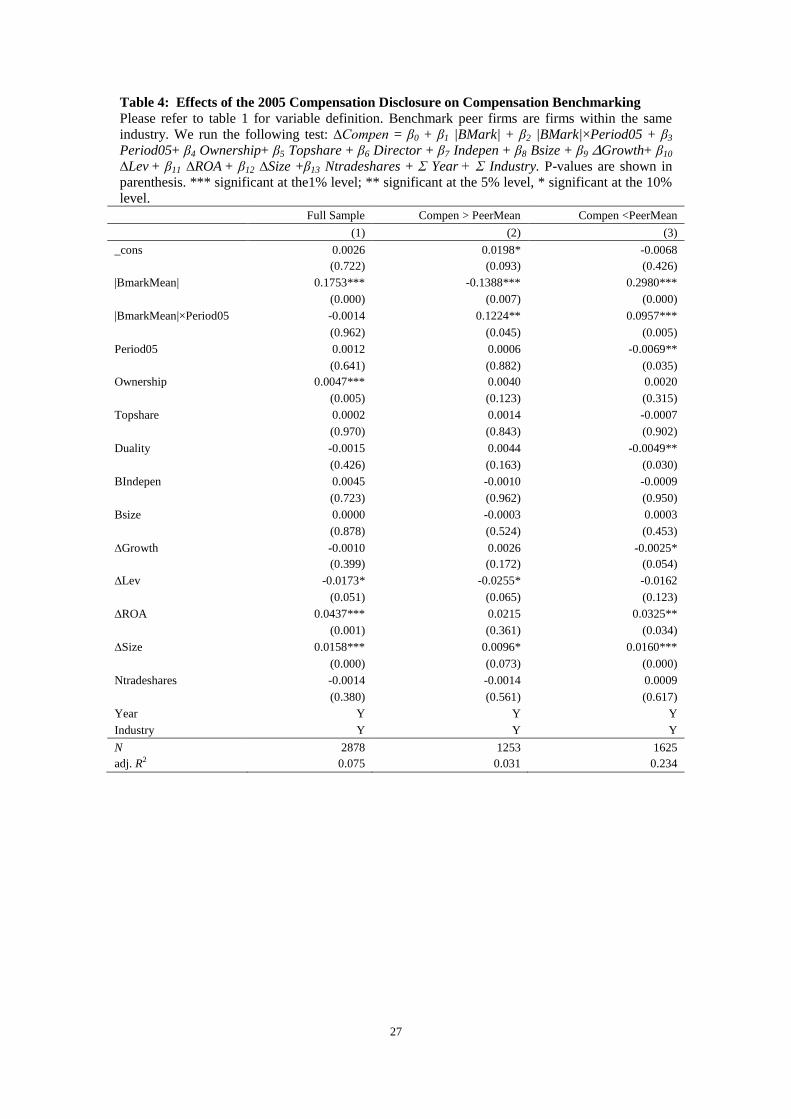
disclosure requirement. The results are shown in Table 4. Interestingly, the
17
coefficients for BmarkMean3 are positive and significant for the full sample and for
two sub-samples. However, the coefficient for the interaction term between
BmarkMean and the Period05 dummy variable is insignificant, which suggests no
significant effect since the 2005 compensation disclosure requirement. Further
analysis using subsamples reveals that the coefficients for the interaction term are
both significant. If executives are paid above the industry average, they will thus
receive lower pay raises in the subsequent year (negative coefficient for BmarkMean).
However, this effect is weaker since 2005 (positive coefficient for the interaction
term). These findings suggest that in response to requirements for more transparent
disclosure, executives might engage in opportunistic benchmarking, and therefore
find it easy to maintain their high compensation levels. This result is also consistent
with a greater completion in the labor market after 2005. In order to retain talented
executives, firms have to offer a more competitive compensation package (Bryson et
al. 2014). Meanwhile, those executives who are paid below the industry average will
receive higher pay raises in the subsequent year (the coefficient for BmarkMean is
0.1753). After 2005, we observe a faster adjustment rate (the coefficient for the
interaction term is -0.0014). If an executive perceives her pay as below the market
average, then compensation disclosure by her peer companies allows her to justify a
greater increase in compensation. It is therefore important to realize that
compensation disclosure might have different effects on the benchmarking behavior
3 In the following analysis, the results using BmarkMean and BmarkMed are all qualitatively similar. Therefore,
we only report results using BmarkMean in the subsequent portions of our study.

18
of over-paid and under-paid executives. Overall, our results as shown in Table 4
support hypotheses 2b.
Insert Table 4 Here
Our final test examines the differences in benchmarking behavior among
SOECG, SOELG and Non-SOE firms. As the over-paid and under-paid executives
display different benchmarking characteristics, we first divide our sample into these
two groups. Then we run the tests for the SOECG, SOELG and Non-SOE samples
separately. In Table 5, we see that if executives are paid above the industry average,
they will receive lower pay increases subsequently (the coefficients for BmarkMean
are negative for all three sub-samples). Interestingly, the interaction term between
BmarkMean and Period05 is negative for the SOECG sample. This result shows the
executives of SOECGs have received lower increases in compensation since the
improved disclosure requirement of 2005. This finding is consistent with the common
observation that SOECGs are highly monitored, and their executives are not mainly
incentivized by levels of compensation. However, the opposite situation applies for
SOELGs and Non-SOEs. It seems that executives in these types of firms are more
likely to engage in opportunistic benchmarking to secure their higher pay levels. For
the under-paid executives, we see in Column B of Table 5 that the coefficients for
BmarkMean are all positive, which suggests an upward pay adjustment in the
subsequent year. Although the executives of SOECGs received lower pay raises after
2005, the executives of SOELGs received greater increases in pay. For Non-SOEs,
the coefficient for the interaction term is insignificant. The striking differences among

19
the SOECG, SOELG and Non-SOE firms suggest that different agency issues and
incentives directly affect the outcomes of the disclosure policy. Specifically,
transparency in compensation deters executives in SOECGs from acquiring excessive
compensation, but executives in SOELGs and Non-SOEs may use the disclosed
information to engage in opportunistic peer benchmarking.
Insert Table 5 Here
5. Robustness Check
In the previously reported tests, we use all firms in the same industry as
benchmark firms. Some observers, however, might argue that firms tend to
benchmark against peers with the same ownership types. To ensure that our results are
robust, we re-run all of the tests using only firms with the same ownership types
within the same industry as benchmark firms. Although this method reduces the
number of peer firms in the same industry, our results as shown in Tables 6 through 8
are very similar to those reported in Tables 3 through 5.
Instead of using all firms in the same industry, we follow the approach taken
by Brookman and Thistle (2013) and define peer companies as firms of comparable
size (0.5-2 times the firm size) in the same industry. The results, shown in Tables 9,
10 and 11 are also very similar to those reported earlier.
6. Conclusions

20
Improved compensation disclosure allows firms to better benchmark executive
compensation against their peers. However, such benchmarking can also result in
opportunistic behavior in which managers strategically choose their peers to inflate
their overall compensation. Studies on the 2006 SEC regulation have found mixed
evidence with respect to the effect of greater disclosure on compensation contracting.
As the pros and cons of disclosure are closely related to institutional and market
conditions, we examine the effects of the compensation disclosure rule in China as
issued by the CSRC in 2005. We find evidence suggesting industry peer
benchmarking in China. Over-paid executives tend to receive lower pay increases in
the subsequent year. However, it seems that these over-paid executives have been able
to use peer disclosure to justify their compensation and to reduce the effect of
downward pay adjustment. We find that under-paid executives tend to receive
significant pay increases in the subsequent period, and this pattern has grown stronger
since 2005 when detailed information on executive compensation became available.
Overall, it seems that improved compensation disclosure has had an overall positive
effect on the levels of executive compensation.
More importantly, we show that firms with different ownership types behave
differently toward compensation disclosure. We provide additional evidence showing
that executives in SOECGs are under stricter monitoring, and both the under-paid and
over-paid executives have been more likely to reduce their pay increases since 2005.
However, executives of SOELG and non-SOE firms are more likely to use improved
compensation disclosure to secure higher pay.

21
Our study explores the effect of compensation disclosure in an emerging
market, and the results show how firms with different forms of ownership benchmark
executive compensation differently for their under- or over-paid executives. In future
studies, it would be interesting to examine whether China continues to improve its
compensation disclosure and how compensation contracting, specifically
benchmarking behavior, might further evolve as more and more Chinese companies
are listed on foreign exchanges.

22
References:
Albuquerque, A., Franco, G. and Verdi, R., 2013, Peer Choice in CEO Compensation. Journal of Financial Economics, 108, 160-181.
Beaulieu P, Ding S, Qu B. 2012, Compensation disclosure in China., Asia-Pacific Journal of Accounting & Economics, 19, 253-277.
Bizjak, J., Lemmom, M. and Naveen, L., 2008, Does the Use of Peer Groups Contribute to Higher Pay and Less Efficient Compensation? Journal of Financial Economics, 90, 152-168.
Bizjak, J., Lemmom, M. and Nguyen,T., 2011, Are All CEOs above Average? An Empirical Analysis of Compensation Peer Groups and Pay Design. Journal of Financial Economics, 100, 538-555.
Brookman J T, Thistle P D. 2013, Managerial compensation: Luck, skill or labor markets? Journal of Corporate Finance, 21, 252-268.
Bryson A, J Forth and M Zhou (2014), "Same or Different? The CEO Labour Market in China's Public Listed Companies", The Economic Journal, 124, F90-F108
Cadman B, Carter M E. 2013, Compensation peer groups and their relation with CEO pay. Journal of Management Accounting Research, 26, 57-82.
Chen, G, Firth, M, Xu, L ,2009. Does the type of ownership control matter? Evidence from China’s listed companies. Journal of Banking and Finance, 33, 171-181.
Chen, J., Ezzamel M. and Cai, Z., 2011, Managerial power theory, tournament theory, and executive pay in China., Journal of Corporate Finance, 17, 1176–1199.
Cheng, M.Y, Lin, B.X., and Wei. M.H., 2014, Executive compensation in family firms: The effect of multiple family members., Journal of Corporate Finance, forthcoming.
Conyon, M. and He, L., 2011. Executive compensation and corporate governance in China Journal of Corporate Finance, 17, 1158–1175.
Ernstberger, J. and Grüning, M., 2013. How do Firm- and Country-Level Governance Mechanisms Affect Firms’ Disclosure? Journal of Accounting and Public Policy , 32, 50-67.
Ezzamel M., and Watson, R., 1998, Market Comparison Earnings and the Bidding-Up of Executive Cash Compensation: Evidence from the United Kingdom. Academy of Management Journal, 41, 221-231.
Ezzamel M, Watson R. 2002, Pay comparability across and within UK boards: An empirical analysis of the cash pay awards to CEOs and other board members. Journal of Management Studies, 39, 207-232.
Fan, J., Wong, T. and Zhang, T., 2007, Politically connected CEOs, corporate governance, and Post-IPO performance of China’s. Journal of Financial Economics, 84, 330-357.
Faulkender, M., and Yang, J., 2010, Inside the Black Box: the Role and Composition of Compensation Peer Groups. Journal of Financial Economics, 96, 257-270.
Faulkender, M., and Yang, J., 2013. Is Disclosure an Effective Cleansing Mechanism? The Dynamics of Compensation Peer Benchmarking. Review of Financial Studies, 20, 806-839.
Feltham, G.A. and Xie J.Z., 1992, Voluntary financial disclosure in an entry game with continua of types. Contemporary Accounting Research, 9, 46-80.
Firth, M., Fung, P., & Rui, O. M. 2006. Corporate performance and CEO compensation in China. Journal of Corporate Finance, 12, 693–714.
23
De Franco G, Hope O K, Larocque S. 2013, The effect of disclosure on the pay-performance relation. Journal of Accounting and Public Policy, 32, 319-341.
Gu, Z., Wang, K., Xiao, X., 2010. Government Control and Executive Compensation: Evidence from China. Working Paper.
Hermalin B E, Weisbach M S. 2012, Information disclosure and corporate governance. Journal of Finance, 67, 195-233.
Jiang, G., Lee, C., Yue, H., 2010. Tunneling through intercorporate loans: The China experience. Journal of Financial Economics, 98, 1–20.
Ke, B., Petroni, K. & Safieddine, A, 1999. Ownership concentration and sensitivity of executive pay to accounting performance measures: Evidence from publicly and privately-held insurance companies. Journal of Accounting and Economics, 28, 185–209.
Lambert R, Leuz C, Verrecchia R E. 2007, Accounting information, disclosure, and the cost of capital. Journal of Accounting Research, 45, 385-420.
Leuz, C., and P. Wysocki. 2008. Economic consequences of financial reporting and disclosure regulation: A review and suggestions for future research. Working Paper.
Liao L, Liu B, Wang H. 2014, China's Secondary Privatization: Perspectives from the Split-Share Structure Reform. Journal of Financial Economics, 113, 500-518.
Lin B X, Lu R. 2009, Managerial power, compensation gap and firm performance—Evidence from Chinese public listed companies. Global Finance Journal, 20, 153-164.
Lo K. 2003, Economic consequences of regulated changes in disclosure: the case of executive compensation. Journal of Accounting and Economics, 35, 285-314.
Perry T, Zenner M. 2001, Pay for performance? Government regulation and the structure of compensation contracts. Journal of Financial Economics, 62, 453-488.
Shleifer A, Wolfenzon D. 2002, Investor protection and equity markets. Journal of Financial Economics, 66, 3-27.
Vafeas N, Afxentiou Z. 1998, The association between the SEC's 1992 compensation disclosure rule and executive compensation policy changes. Journal of Accounting and Public Policy, 17, 27-54.
Verrecchia R E. 1983, Discretionary disclosure. Journal of Accounting and Economics, 5: 179-194.
Verrecchia R E. 2001, Essays on disclosure. Journal of Accounting and Economics, 32, 97-180.

24
Table 1: Variable Definition
Variables Definition
∆Compen
computed as Compen in the current year (t) minus Compen
the previous year (t-1), and scaled by Compen in year t-1,
where Compen is the total compensation of the three highest-
paid executives in the firm
The difference
between
managerial pay
and industry
peers
BmarkMean
(PeerMean-Compen)/PeerMean, where PeerMean is the mean
of the total compensation reported by firms operating in the
same industry
BmarkMed
(PeerMed-Compen)/PeerMed, where PeerMed is the median
of the total compensation reported by firms operating in the
same industry
Period05 dummy variable, taking the value 1 if the year is 2006 or
2007, and 0 otherwise
Ownership dummy variable, taking the value 1 if the ultimate controller
is the state, and 0 otherwise
SOECG dummy variable, taking the value 1 if the ultimate controller
is the central-government, and 0 otherwise
SOELG dummy variable, taking the value 1 if the ultimate controller
is the local-government, and 0 otherwise
Topshare proportion of shareholdings of the largest shareholder
Duality dummy variable, taking the value 1 if CEO is the Chairman,
and 0 otherwise
BIndepen ratio of number of independent directors to number of total
directors
Bsize natural log size of the board
∆Growth
change of sales growth during period t and period t-1, where
sales growth is change of sales during period t and period t-1,
and scaled by sales in year t-1
∆Lev change of leverage during period t and period t-1, where
leverage is the ratio of total debts to total assets
∆ROA change of ROA during period t and period t-1, where ROA is
the ratio of net incomes to total assets
∆Size change of firm size during period t and period t-1, where firm
size is the natural log of total assets
Ntradeshares
dummy variable, taking the value 1 if non-tradable shares of
the firm are above the mean of all firms in the same industry,
and 0 otherwise

25
Table 2: Descriptive Statistics
Please refer to table 1 for variable definitions. The total number of observation for the sample is
3830. We report the minimum (Min), maximum (Max), mean, median and standard deviation
(STD) for the complete sample here.
Variable Min Max Mean Median STD
Compen
(ten thousands RMB) 18 1400 73 54 75
∆Compen -0.0795 0.1431 0.0175 0.0114 0.0344
BmarkMean -0.1729 0.2047 0.0271 0.0245 0.0655
BmarkMed -0.1682 0.2097 0.0330 0.0298 0.0654
Ownership 0.0000 1.0000 0.6985 1.0000 0.4590
SOECG 0.0000 1.0000 0.1102 0.0000 0.3132
SOELG 0.0000 1.0000 0.5883 1.0000 0.4922
Topshare 0.0899 0.7678 0.3928 0.3721 0.1631
Duality 0.0000 1.0000 0.1151 0.0000 0.3192
BIndepen 0.0000 0.5455 0.3445 0.3333 0.0521
Bsize 5.0000 15.0000 9.5961 9.0000 2.0385
∆Growth -2.9544 2.7859 0.0263 0.0191 0.5858
∆Lev -0.2219 0.2910 0.0171 0.0111 0.0835
∆ROA -0.2493 0.1760 -0.0009 0.0008 0.0532
∆Size -0.4192 0.9642 0.1230 0.0962 0.2121
Ntradeshares 0.0000 1.0000 0.4962 0.0000 0.5000

26
Table 3: Test on Compensation Industry Benchmarking
Please refer to table 1 for variable definition. Benchmark peer firms are firms within the same
industry. We run the following model here ∆Compen = β0 + β1 |BMark| + β2 Period05 + β3 Ownership + β4 Topshare + β5 Duality + β6 BIndepen + β7 Bsize + β8 ∆Growth + β9 ∆Lev +
β10∆ROA +β11 ∆Size +β12 Ntradeshares +Σ Year +Σ Industry . P-values are shown in parenthesis.
*** significant at the1% level; ** significant at the 5% level, * significant at the 10% level.
Full sample Compen >
PeerMean
Compen >
PeerMed
Compen <
PeerMean
Compen <
PeerMed
(1) (2) (3) (4) (5) (6)
_cons 0.0026 0.0009 0.0196** 0.0187** -0.0127 -0.0117
(0.716) (0.897) (0.027) (0.032) (0.121) (0.158)
|BmarkMean| 0.1747*** -0.4711*** 0.3573***
(0.000) (0.000) (0.000)
|BmarkMed| 0.1871*** -0.4823*** 0.3404***
(0.000) (0.000) (0.000)
Period05 0.0011 0.0020 0.0047* 0.0063** 0.0014 0.0020
(0.556) (0.278) (0.057) (0.013) (0.512) (0.356)
Ownership 0.0047*** 0.0049*** 0.0012 0.0010 0.0021 0.0016
(0.005) (0.003) (0.547) (0.607) (0.274) (0.402)
Topshare 0.0002 0.0002 -0.0016 -0.0010 -0.0016 -0.0047
(0.970) (0.964) (0.762) (0.861) (0.768) (0.369)
Duality -0.0016 -0.0016 0.0054** 0.0053** -0.0041* -0.0042*
(0.424) (0.406) (0.022) (0.030) (0.058) (0.053)
BIndepen 0.0045 0.0058 0.0038 0.0031 0.0006 0.0001
(0.723) (0.645) (0.809) (0.851) (0.965) (0.992)
Bsize 0.0000 0.0001 0.0010*** 0.0011*** 0.0004 0.0003
(0.879) (0.743) (0.006) (0.003) (0.359) (0.389)
∆Growth -0.0010 -0.0011 -0.0003 -0.0001 -0.0025** -0.0026**
(0.399) (0.350) (0.817) (0.966) (0.043) (0.041)
∆Lev -0.0173* -0.0179** -0.0449*** -0.0428*** -0.0137 -0.0163*
(0.051) (0.041) (0.000) (0.000) (0.175) (0.097)
∆ROA 0.0437*** 0.0430*** -0.0076 0.0026 0.0343** 0.0388***
(0.001) (0.001) (0.669) (0.892) (0.020) (0.007)
∆Size 0.0158*** 0.0166*** 0.0239*** 0.0194*** 0.0156*** 0.0176***
(0.000) (0.000) (0.000) (0.000) (0.000) (0.000)
Ntradeshares -0.0014 -0.0015 -0.0030* -0.0032* 0.0010 0.0015
(0.380) (0.338) (0.096) (0.082) (0.579) (0.401)
Year Y Y Y Y Y Y
Industry Y Y Y Y Y Y
N 2878 2878 1253 1147 1625 1731
adj. R2 0.075 0.086 0.445 0.453 0.293 0.272
27
Table 4: Effects of the 2005 Compensation Disclosure on Compensation Benchmarking
Please refer to table 1 for variable definition. Benchmark peer firms are firms within the same
industry. We run the following test: ∆Compen = β0 + β1 |BMark| + β2 |BMark|×Period05 + β3 Period05+ β4 Ownership+ β5 Topshare + β6 Director + β7 Indepen + β8 Bsize + β9 ∆Growth+ β10 ∆Lev + β11 ∆ROA + β12 ∆Size +β13 Ntradeshares + Σ Year + Σ Industry. P-values are shown in
parenthesis. *** significant at the1% level; ** significant at the 5% level, * significant at the 10%
level.
Full Sample Compen > PeerMean Compen <PeerMean
(1) (2) (3)
_cons 0.0026 0.0198* -0.0068
(0.722) (0.093) (0.426)
|BmarkMean| 0.1753*** -0.1388*** 0.2980***
(0.000) (0.007) (0.000)
|BmarkMean|×Period05 -0.0014 0.1224** 0.0957***
(0.962) (0.045) (0.005)
Period05 0.0012 0.0006 -0.0069**
(0.641) (0.882) (0.035)
Ownership 0.0047*** 0.0040 0.0020
(0.005) (0.123) (0.315)
Topshare 0.0002 0.0014 -0.0007
(0.970) (0.843) (0.902)
Duality -0.0015 0.0044 -0.0049**
(0.426) (0.163) (0.030)
BIndepen 0.0045 -0.0010 -0.0009
(0.723) (0.962) (0.950)
Bsize 0.0000 -0.0003 0.0003
(0.878) (0.524) (0.453)
∆Growth -0.0010 0.0026 -0.0025*
(0.399) (0.172) (0.054)
∆Lev -0.0173* -0.0255* -0.0162
(0.051) (0.065) (0.123)
∆ROA 0.0437*** 0.0215 0.0325**
(0.001) (0.361) (0.034)
∆Size 0.0158*** 0.0096* 0.0160***
(0.000) (0.073) (0.000)
Ntradeshares -0.0014 -0.0014 0.0009
(0.380) (0.561) (0.617)
Year Y Y Y
Industry Y Y Y
N 2878 1253 1625
adj. R2 0.075 0.031 0.234

28
Table 5: Effects of the 2005 Compensation Disclosure on Compensation Benchmarking for
Different Types of Firms
Please refer to table 1 for variable definition. Benchmark peer firms are firms within the same
industry. We run the following test: ∆Compen = β0 + β1 |BMark| + β2 |BMark|×Period05 + β3 Period05+ β4 Ownership+ β5 Topshare + β6 Director + β7 Indepen + β8 Bsize + β9 ∆Growth+ β10 ∆Lev + β11 ∆ROA+ β12 ∆Size +β13 Ntradeshares + Σ Year + Σ Industry . P-values are shown in
parenthesis. *** significant at the1% level; ** significant at the 5% level, * significant at the 10%
level.
Compen > PeerMean Compen < PeerMean
SOECG SOELG Non-SOEs SOECG SOELG Non-SOEs
(1) (2) (3) (4) (5) (6)
_cons 0.0375 0.0288** 0.0121 -0.0312 -0.0081 0.0004
(0.165) (0.013) (0.525) (0.269) (0.430) (0.980)
|BmarkMean| -0.2794*** -0.5873*** -0.6196*** 0.4735*** 0.2741*** 0.3876***
(0.006) (0.000) (0.000) (0.000) (0.000) (0.000)
|BmarkMean|×Period05 -0.1891* 0.1834*** 0.1522** -0.2005* 0.1895*** 0.0624
(0.079) (0.000) (0.011) (0.068) (0.000) (0.246)
Period05 -0.0106 0.0060* -0.0037 0.0243** -0.0118*** -0.0002
(0.423) (0.052) (0.476) (0.040) (0.003) (0.964)
Topshare 0.0029 0.0005 0.0019 0.0020 -0.0008 -0.0057
(0.845) (0.940) (0.855) (0.916) (0.892) (0.602)
Duality 0.0227* 0.0041 0.0030 -0.0018 -0.0047 0.0001
(0.092) (0.219) (0.414) (0.822) (0.106) (0.985)
BIndepen -0.0188 -0.0123 0.0212 -0.0044 0.0085 -0.0308
(0.674) (0.541) (0.535) (0.946) (0.617) (0.265)
Bsize 0.0003 0.0010** 0.0016* 0.0009 0.0001 0.0003
(0.715) (0.040) (0.076) (0.480) (0.762) (0.694)
∆Growth 0.0034 -0.0034 0.0007 -0.0040 -0.0013 -0.0030
(0.280) (0.120) (0.758) (0.375) (0.492) (0.107)
∆Lev 0.0096 -0.0550*** -0.0601*** -0.0318 -0.0241* 0.0004
(0.670) (0.001) (0.001) (0.418) (0.087) (0.983)
∆ROA 0.0808** -0.0129 -0.0609** -0.0008 0.0404* 0.0289
(0.045) (0.635) (0.041) (0.988) (0.053) (0.218)
∆Size 0.0065 0.0310*** 0.0254*** -0.0003 0.0195*** 0.0169**
(0.440) (0.000) (0.000) (0.988) (0.000) (0.012)
Ntradeshares 0.0057 -0.0050** 0.0020 -0.0078 0.0023 0.0013
(0.226) (0.046) (0.603) (0.255) (0.372) (0.693)
Year Y Y Y Y Y Y
Industry Y Y Y Y Y Y
N 188 727 338 145 976 504
adj. R2 0.455 0.448 0.517 0.188 0.286 0.344

29
Table 6 Test on Compensation Industry Benchmarking
Please refer to table 1 for variable definition. Benchmark peer firms are firms with the same
ownership property within the same industry. We run the following model here ∆Compen = β0 +
β1 |BMark| + β2 Period05 + β3 Ownership + β4 Topshare + β5 Duality + β6 BIndepen + β7 Bsize +
β8 ∆Growth + β9 ∆Lev + β10∆ROA +β11 ∆Size +β12 Ntradeshares +Σ Year +Σ Industry . P-values
are shown in parenthesis. *** significant at the1% level; ** significant at the 5% level, *
significant at the 10% level.
Full Sample Compen > PeerMean Compen < PeerMean
(1) (2) (3)
_cons -0.0004 0.0192* -0.0165*
(0.963) (0.071) (0.094)
|BmarkMean| 0.1959*** -0.4954*** 0.3800***
(0.000) (0.000) (0.000)
Period05 0.0044** 0.0035 0.0052**
(0.024) (0.146) (0.016)
Ownership 0.0057*** 0.0058** 0.0039*
(0.005) (0.024) (0.078)
Topshare -0.0038 -0.0028 -0.0073
(0.450) (0.648) (0.199)
Duality -0.0007 0.0067** -0.0031
(0.754) (0.013) (0.230)
BIndepen -0.0014 0.0002 -0.0166
(0.929) (0.992) (0.342)
Bsize 0.0001 0.0011** 0.0003
(0.771) (0.012) (0.562)
∆Growth -0.0017 0.0006 -0.0022
(0.224) (0.730) (0.132)
∆Lev -0.0250** -0.0452*** -0.0204*
(0.011) (0.000) (0.052)
∆ROA 0.0338** -0.0214 0.0426***
(0.030) (0.328) (0.008)
∆Size 0.0146*** 0.0192*** 0.0144***
(0.000) (0.000) (0.000)
Ntradeshares -0.0008 -0.0053** 0.0004
(0.684) (0.023) (0.833)
Year Y Y Y
Industry Y Y Y
N 2071 825 1246
adj. R2 0.080 0.464 0.267

30
Table 7: Effect of the 2005 Compensation Disclosure on Compensation Benchmarking
Please refer to table 1 for variable definition. Benchmark peer firms are firms with the same
ownership property within the same industry. We run the following test: ∆Compen = β0 + β1 |BMark| + β2 |BMark|×Period05 + β3 Period05+ β4 Ownership+ β5 Topshare + β6 Director + β7 Indepen + β8 Bsize + β9 ∆Growth+ β10 ∆Lev + β11 ∆ROA+ β12 ∆Size +β13 Ntradeshares + Σ Year + Σ Industry . P-values are shown in parenthesis. *** significant at the1% level; ** significant at the
5% level, * significant at the 10% level.
Full Sample Compen > PeerMean Compen < PeerMean
(1) (2) (3)
_cons 0.0014 0.0220** -0.0123
(0.878) (0.038) (0.216)
|BmarkMean| 0.1648*** -0.6314*** 0.3142***
(0.000) (0.000) (0.000)
|BmarkMean|×Period05 0.0476 0.1763*** 0.1067***
(0.190) (0.000) (0.006)
Period05 0.0015 0.0011 -0.0022
(0.601) (0.658) (0.517)
Ownership 0.0057*** 0.0056** 0.0040*
(0.005) (0.027) (0.069)
Topshare -0.0037 -0.0047 -0.0069
(0.464) (0.441) (0.229)
Duality -0.0008 0.0066** -0.0033
(0.710) (0.014) (0.198)
BIndepen -0.0014 -0.0019 -0.0168
(0.931) (0.925) (0.336)
Bsize 0.0001 0.0010** 0.0003
(0.766) (0.019) (0.498)
∆Growth -0.0016 0.0004 -0.0021
(0.232) (0.821) (0.146)
∆Lev -0.0248** -0.0425*** -0.0203*
(0.012) (0.001) (0.052)
∆ROA 0.0335** -0.0261 0.0429***
(0.031) (0.230) (0.008)
∆Size 0.0146*** 0.0196*** 0.0145***
(0.000) (0.000) (0.000)
Ntradeshares -0.0008 -0.0049** 0.0001
(0.680) (0.032) (0.955)
Year Y Y Y
Industry Y Y Y
N 2071 825 1246
adj. R2 0.080 0.473 0.271
31
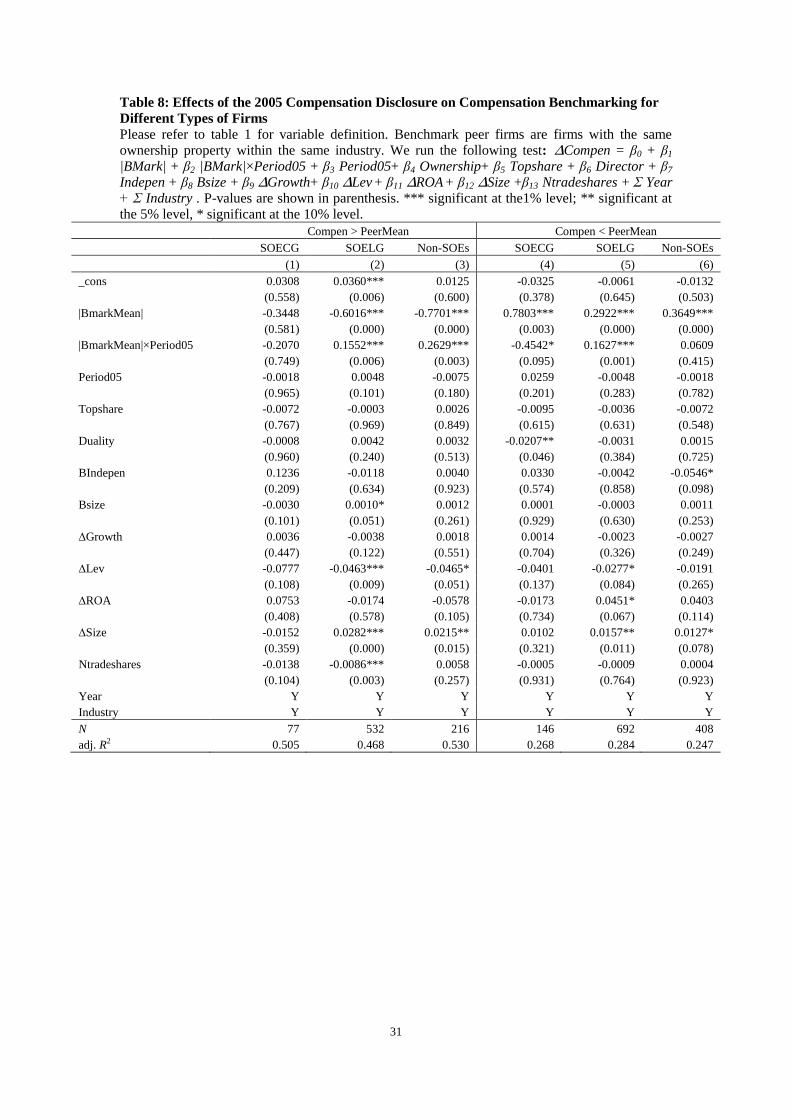
Table 8: Effects of the 2005 Compensation Disclosure on Compensation Benchmarking for
Different Types of Firms
Please refer to table 1 for variable definition. Benchmark peer firms are firms with the same
ownership property within the same industry. We run the following test: ∆Compen = β0 + β1 |BMark| + β2 |BMark|×Period05 + β3 Period05+ β4 Ownership+ β5 Topshare + β6 Director + β7 Indepen + β8 Bsize + β9 ∆Growth+ β10 ∆Lev + β11 ∆ROA + β12 ∆Size +β13 Ntradeshares + Σ Year
+ Σ Industry . P-values are shown in parenthesis. *** significant at the1% level; ** significant at
the 5% level, * significant at the 10% level.
Compen > PeerMean Compen < PeerMean
SOECG SOELG Non-SOEs SOECG SOELG Non-SOEs
(1) (2) (3) (4) (5) (6)
_cons 0.0308 0.0360*** 0.0125 -0.0325 -0.0061 -0.0132
(0.558) (0.006) (0.600) (0.378) (0.645) (0.503)
|BmarkMean| -0.3448 -0.6016*** -0.7701*** 0.7803*** 0.2922*** 0.3649***
(0.581) (0.000) (0.000) (0.003) (0.000) (0.000)
|BmarkMean|×Period05 -0.2070 0.1552*** 0.2629*** -0.4542* 0.1627*** 0.0609
(0.749) (0.006) (0.003) (0.095) (0.001) (0.415)
Period05 -0.0018 0.0048 -0.0075 0.0259 -0.0048 -0.0018
(0.965) (0.101) (0.180) (0.201) (0.283) (0.782)
Topshare -0.0072 -0.0003 0.0026 -0.0095 -0.0036 -0.0072
(0.767) (0.969) (0.849) (0.615) (0.631) (0.548)
Duality -0.0008 0.0042 0.0032 -0.0207** -0.0031 0.0015
(0.960) (0.240) (0.513) (0.046) (0.384) (0.725)
BIndepen 0.1236 -0.0118 0.0040 0.0330 -0.0042 -0.0546*
(0.209) (0.634) (0.923) (0.574) (0.858) (0.098)
Bsize -0.0030 0.0010* 0.0012 0.0001 -0.0003 0.0011
(0.101) (0.051) (0.261) (0.929) (0.630) (0.253)
∆Growth 0.0036 -0.0038 0.0018 0.0014 -0.0023 -0.0027
(0.447) (0.122) (0.551) (0.704) (0.326) (0.249)
∆Lev -0.0777 -0.0463*** -0.0465* -0.0401 -0.0277* -0.0191
(0.108) (0.009) (0.051) (0.137) (0.084) (0.265)
∆ROA 0.0753 -0.0174 -0.0578 -0.0173 0.0451* 0.0403
(0.408) (0.578) (0.105) (0.734) (0.067) (0.114)
∆Size -0.0152 0.0282*** 0.0215** 0.0102 0.0157** 0.0127*
(0.359) (0.000) (0.015) (0.321) (0.011) (0.078)
Ntradeshares -0.0138 -0.0086*** 0.0058 -0.0005 -0.0009 0.0004
(0.104) (0.003) (0.257) (0.931) (0.764) (0.923)
Year Y Y Y Y Y Y
Industry Y Y Y Y Y Y
N 77 532 216 146 692 408
adj. R2 0.505 0.468 0.530 0.268 0.284 0.247

32
Table 9 Test on Compensation Industry Benchmarking
Please refer to table 1 for variable definition. Benchmark peer firms are firms with size 0.5 to 2
times the size of the company. We run the following model here ∆Compen = β0 + β1 |BMark| + β2 Period05 + β3 Ownership + β4 Topshare + β5 Duality + β6 BIndepen + β7 Bsize + β8 ∆Growth +
β9 ∆Lev + β10∆ROA+β11 ∆Size +β12 Ntradeshares +Σ Year +Σ Industry . P-values are shown in
parenthesis. *** significant at the1% level; ** significant at the 5% level, * significant at the 10%
level.
Full sample Compen > PeerMean Compen < PeerMean
(1) (2) (3)
_cons 0.0000 0.0207** -0.0112
(0.996) (0.018) (0.209)
|BmarkMean| 0.0701*** -0.2664*** 0.1709***
(0.000) (0.000) (0.000)
Period05 -0.0052*** -0.0092*** -0.0020
(0.000) (0.000) (0.264)
Ownership -0.0021 -0.0017 -0.0038**
(0.124) (0.339) (0.035)
Topshare -0.0027 -0.0073 0.0001
(0.501) (0.164) (0.976)
Duality -0.0007 0.0016 0.0004
(0.656) (0.411) (0.850)
BIndepen 0.0188 0.0023 0.0268
(0.141) (0.886) (0.102)
Bsize 0.0002 0.0001 0.0007**
(0.478) (0.672) (0.046)
∆Growth -0.0003 0.0035** -0.0022
(0.770) (0.017) (0.141)
∆Lev 0.0110 0.0039 0.0068
(0.137) (0.702) (0.456)
∆ROA 0.0280** 0.0259* 0.0204
(0.010) (0.076) (0.131)
∆Size -0.0051* 0.0001 -0.0008
(0.065) (0.971) (0.815)
Ntradeshares 0.0023* 0.0009 0.0027
(0.068) (0.602) (0.110)
Year Y Y Y
Industry Y Y Y
N 2105 1042 1063
adj. R2 0.023 0.266 0.114

33
Table 10 Effect of the 2005 Compensation Disclosure on Compensation Benchmarking
Please refer to table 1 for variable definition. Benchmark peer firms are firms with size 0.5 to 2
times the size of the company. We run the following test: ∆Compen = β0 + β1 |BMark| + β2 |BMark|×Period05 + β3 Period05+ β4 Ownership+ β5 Topshare + β6 Director + β7 Indepen + β8 Bsize + β9 ∆Growth+ β10 ∆Lev + β11 ∆ROA + β12 ∆Size +β13 Ntradeshares + Σ Year + Σ Industry .P-values are shown in parenthesis. *** significant at the1% level; ** significant at the 5%
level, * significant at the 10% level.
Full sample Compen > PeerMean Compen < PeerMean
(1) (2) (3)
_cons 0.0003 0.0243*** -0.0103
(0.966) (0.006) (0.247)
|BmarkMean| 0.0641*** -0.3329*** 0.1460***
(0.005) (0.000) (0.000)
|BmarkMean|×Period05 0.0092 0.1028*** 0.0383
(0.746) (0.001) (0.223)
Period05 -0.0057*** -0.0136*** -0.0035
(0.005) (0.000) (0.105)
Ownership -0.0021 -0.0017 -0.0038**
(0.124) (0.350) (0.034)
Topshare -0.0027 -0.0078 0.0002
(0.498) (0.135) (0.967)
Duality -0.0007 0.0016 0.0004
(0.652) (0.420) (0.860)
BIndepen 0.0189 0.0029 0.0273*
(0.139) (0.860) (0.096)
Bsize 0.0002 0.0001 0.0007**
(0.479) (0.814) (0.047)
∆Growth -0.0003 0.0034** -0.0022
(0.769) (0.020) (0.144)
∆Lev 0.0110 0.0043 0.0066
(0.138) (0.666) (0.468)
∆ROA 0.0280** 0.0252* 0.0202
(0.010) (0.082) (0.135)
∆Size -0.0051* 0.0003 -0.0008
(0.065) (0.930) (0.805)
Ntradeshares 0.0023* 0.0009 0.0027
(0.068) (0.588) (0.111)
Year Y Y Y
Industry Y Y Y
N 2105 1042 1063
adj. R2 0.022 0.274 0.114

34
Table 11: Effects of the 2005 Compensation Disclosure on Compensation Benchmarking for
Different Types of Firms
Please refer to table 1 for variable definition. Benchmark peer firms are firms with size 0.5 to 2
times the size of the company. We run the following test: ∆Compen = β0 + β1 |BMark| + β2 |BMark|×Period05 + β3 Period05+ β4 Ownership+ β5 Topshare + β6 Director + β7 Indepen + β8 Bsize + β9 ∆Growth+ β10 ∆Lev + β11 ∆ROA+ β12 ∆Size +β13 Ntradeshares + Σ Year + Σ Industry . P-values are shown in parenthesis. *** significant at the1% level; ** significant at the 5% level, *
significant at the 10% level.
Compen > PeerMean Compen < PeerMean
SOECG SOELG Non-SOEs SOECG SOELG Non-SOEs
(1) (2) (3) (4) (5) (6)
_cons 0.0213 0.0098 0.0234 -0.0132 -0.0016 0.0126
(0.529) (0.256) (0.208) (0.630) (0.863) (0.507)
|BmarkMean| -0.5708*** -0.0597** -0.3699*** 0.5149*** 0.0580** 0.1440**
(0.000) (0.045) (0.000) (0.000) (0.026) (0.012)
|BmarkMean|×Period05 0.1392 0.1155*** 0.1353** -0.2291** 0.0707** 0.1115
(0.156) (0.001) (0.014) (0.030) (0.025) (0.120)
Period05 -0.0332*** 0.0038 -0.0209*** -0.0113 -0.0035 -0.0040
(0.000) (0.136) (0.000) (0.159) (0.115) (0.390)
Topshare 0.0282 -0.0105* -0.0101 -0.0048 0.0030 -0.0070
(0.150) (0.056) (0.328) (0.807) (0.566) (0.522)
Duality -0.0002 0.0028 0.0034 -0.0060 0.0000 0.0057
(0.976) (0.230) (0.328) (0.555) (0.989) (0.201)
BIndepen 0.0751 -0.0076 0.0156 0.0376 0.0107 -0.0145
(0.278) (0.657) (0.620) (0.537) (0.526) (0.676)
Bsize -0.0031*** 0.0003 0.0003 0.0024* 0.0001 -0.0003
(0.007) (0.362) (0.694) (0.067) (0.731) (0.735)
∆Growth 0.0058 0.0021 0.0046* 0.0062 -0.0029* -0.0051**
(0.139) (0.236) (0.062) (0.265) (0.099) (0.044)
∆Lev 0.0384 -0.0106 0.0021 0.0140 -0.0030 0.0231
(0.210) (0.385) (0.893) (0.675) (0.766) (0.183)
∆ROA 0.0289 -0.0101 0.0267 -0.0026 0.0048 0.0422*
(0.558) (0.580) (0.218) (0.961) (0.749) (0.080)
∆Size -0.0113 -0.0017 -0.0072 0.0082 -0.0004 -0.0020
(0.314) (0.712) (0.245) (0.514) (0.920) (0.775)
Ntradeshares -0.0014 0.0013 0.0123*** -0.0058 0.0019 0.0189***
(0.772) (0.456) (0.001) (0.310) (0.258) (0.000)
Year Y Y Y Y Y Y
Industry Y Y Y Y Y Y
N 125 604 313 138 602 323
adj. R2 0.704 0.129 0.367 0.338 0.116 0.187