IESO QUERCUS SCHOOL URBANIZACIÓN EL ENCINAR – TERRADILLOS - SALAMANCA.

Efectos de la fragmentación del encinar en las interacciones
planta-suelo-microorganismos
Effects of forest fragmentation on the
plant-soil-microbial interactions
Dulce Yaahid Flores RenteríaTesis Doctoral
SynopsisThe ecological consequences of habitat fragmentation on soil functioning largely depend on the
influence of the plants that triggers a cascade of causal-effect relations that stimulates soil microbial activity. The negative effects of drought on the fragmented holm oaks forest could be
ameliorated by the increased fertility and water holding capacity of soils on the small fragments, especially in soils with historic adaptation to drought.
SinopsisLas consecuencias ecológicas de la fragmentación del hábitat sobre el funcionamiento del suelo dependen en gran medida de la influencia de las plantas que desencadenan una cascada de relaciones causa-efecto que estimula la actividad microbiana del suelo. Los efectos negativos de la sequía en los encinares fragmentados podrían ser modulados por el aumento de la capacidad de retención de agua y la fertilidad de los suelos en los fragmentos pequeños, especialmente en suelos con adaptación histórica a la sequía.


Fotografíade laportada: Borde de encinar fragmentado cerca deQuintanardelaOrden(Toledo),Junio2013.Autora:DulceY.Flores‐Rentería.


Efectosdelafragmentacióndelencinarenlasinteracciones
planta‐suelo‐microorganismos
Effectsofforestfragmentationontheplant‐soil‐microbialinteractions
TESISDOCTORAL
DULCEYAAHIDFLORESRENTERÍA
MADRID,JUNIODE2015
MemoriapresentadaparaoptaraltítulodeDoctorenEcologíaporlaUniversidadAutónomadeMadridatravésdelprogramade
DoctoradoenEcología.
Directores:FernandoValladaresRosJorgeCurielYusteDpto.deBiogeografíayCambioGlobalMuseoNacionaldeCienciasNaturales(MNCN‐CSIC)AnaRincónHerranzDpto.deProtecciónVegetalInstitutodeCienciasAgrarias(ICA‐CSIC)


Estetrabajohasidorealizadograciasalafinanciación proporcionada por losproyectosVULGLO (CGL201022180C0303),MyFUNCO(CGL2011‐29585‐C02‐02)y VERONICA (CGL2013‐42271‐P) delMinisterio de Economía ycompetitividad; REMEDINAL 3‐CM (ref.S2013/MAE‐2719) de la Comunidad deMadrid. Así como al Programa debecarios en el extranjero del ConsejoMexicano de Ciencia y Tecnología(CONACyT)delgobiernodeMéxico.


Índice
Abstract……………………………………………………………………………………… (3)
Resumen…………………………………………………………………………………… (5)
Capítulo1: Introduccióngeneral…………………………………………….. (7)
Estructurayobjetivosdelatesis…………………………… (21)
Regionesdestudio……………………………………………….. (26)
Capítulo2: Forestfragmentationindirectlyaffectstree‐soilsystemandmicrobialfunctioninginMediterraneanholmoakforests………………………………………………….. (39)
Capítulo3: AgriculturalmatrixaffectsdirectlythemicrobialcommunitystructureandindirectlytheirmetabolisminfragmentedMediterraneanholmoakforests…………………………………………………………………… (75)
Capítulo4: Habitatfragmentationcanmodulatedroughteffectsontheplant‐soil‐microbialsysteminMediterraneanholmoak(Quercusilex)forests………………………………. (123)
Capítulo5: Theinfluenceofforestfragmentationandbioclimaticregionoverthebio‐physicochemicalsoilcharacteristicsovershadowspotentialseedlingprovenanceeffectintheresistanceoftheplant‐soil‐microbialsystemtodrought…………………………………………………………………... (169)
Capítulo6: Discusióngeneralyconclusiones……………………………. (217)
Agradecimientos………………………………………………………………………….. (239)


ABSTRACT
3
Abstract
Forest fragmentation implies profound ecological transformations
worldwide, mainly threatening aboveground biodiversity. However, the
complex impacts of forest fragmentation on ecosystemprocesses are not
yetwellunderstood,especiallytakingintoaccounttheir interactionswith
other global change drivers such as the increasing drought, particularly
relevant in theMediterranean area. The interaction of the soil‐microbial
systemwiththestandingplantsiscrucialtofullyunderstandtheeffectsof
forestfragmentationoverecosystemprocesses.Themainobjectiveofthis
thesisistounderstandtheimpactsofforestfragmentationontheedaphic
propertiesandonthestructureofsoilmicrobialcommunities,aswellason
their capacity todecomposeandmetabolize soilorganicmatter.To fulfill
thisobjectivewehaveuseddifferentmethodologicalapproaches tostudy
thephysicochemicalcharacteristicsofsoilsandthestructureandfunction
of soil microbial communities, as influenced by holm oak trees and
seedlings.Thestudyhasbeencarriedout in fragmentedholmoak forests
immersed in an active agriculturalmatrix and located in two climatically
different regions of Spain. We have also focused on the functional
responses of the plant‐soil‐microbial system to drought, the most
importantclimatechange‐relatedthreatinMediterraneanecosystems.Our
results point out to a high complexity of the plant‐soil‐microbial system
and reveal important responses of this system to forest fragmentation.
Additionally,wehavefoundadifferentialresponsivenessofthesoil‐plant‐
microbial system to drought, depending on both the physicochemical
characteristics of soils and the historical adaptation of soil microbial
communities to specific bioclimatic conditions. We found that forest
fragmentationhasdirect effectsover themicrobial community (structure
anddiversity),andindirecteffectsoverthesoil‐microbialfunctioning(soil
respiration, enzymatic activities andmetabolic profile)mediated through
ABSTRACT
4
the influence of the tree size,which triggers in turn a cascade of causal‐
effect relations that stimulates soil microbial activity. Moreover, the
interaction found between drought and fragment size suggests that
depending on the local bioclimatic conditions, forest fragmentation could
amelioratetosomeextentthenegativeeffectofdroughtbyincreasingthe
fertilityandwaterholdingcapacityofsoils,especiallyinsoilswithhistoric
adaptationtodrought.
Keywords: forest fragmentation, enzymatic activity, soil respiration,
denaturing gradient gel electrophoresis, microbial community‐level
physiological profiles, microbial biomass, microbial alpha‐diversity,
microbialbeta‐diversity,structuralequationmodels.
ABSTRACT
5
Resumen
La fragmentación del hábitat implica profundas transformaciones
ecológicasentodoelmundo,amenazandoprincipalmentelabiodiversidad
delascomunidadessobreelsuelo.Sinembargo,elcomplejoimpactodela
fragmentacióndelosbosquesenlosprocesosecosistémicostodavíanose
comprende bien, especialmente tomando en cuenta las interacciones con
otros motores de cambio global como el incremento de la sequía,
particularmente relevante en los ecosistemas Mediterráneos. La
interacción del sistema suelo‐microorganismos con las plantas es crucial
para entender los efectos de la fragmentación del bosque sobre los
procesosdelecosistema.Elprincipalobjetivodeestatesisescomprender
losimpactosdelafragmentacióndelbosqueenlaspropiedadesedáficasy
enlaestructuradelascomunidadesmicrobianasdelsuelo,asícomoensu
capacidad de descomponer y metabolizar la materia orgánica del suelo.
Para cumplir con este objetivo se han utilizado diferentes enfoques
metodológicosparaestudiar lascaracterísticas físico‐químicasdelsueloy
laestructuray funcionalidadde lascomunidadesmicrobianasdelmismo,
asícomolainfluenciadeárbolesyplántulasdeencinas.Elestudiohasido
llevadoacaboenencinaresfragmentadosinmersosenunamatrizagrícola
activa, y localizados en dos regiones climáticamente distintas de España.
Tambiénnoshemoscentradoenlarespuestafuncionaldelsistemaplanta‐
suelo‐microorganismosa lasequía, laamenazarelacionadaconelcambio
climático más importante en los ecosistemas Mediterráneos. Nuestros
resultados señalan la elevada complejidad del sistema planta‐suelo‐
microorganismos y revelan respuestas importantes de este sistema a la
fragmentación de los bosques. Adicionalmente, hemos encontrado una
respuesta diferencial del sistema planta‐suelo‐microorganismos a la
sequía,dependiendotantodelascaracterísticasfísico‐químicasdelsueloy
de la adaptaciónhistóricade las comunidadesmicrobianas a condiciones

ABSTRACT
6
bioclimáticas específicas. Hemos encontrado que la fragmentación del
bosquetieneefectosdirectossobrelacomunidadmicrobiana(estructuray
diversidad),yefectosindirectossobreelfuncionamientodelsistemasuelo‐
microorganismos (respiración del suelo, actividades enzimáticas y perfil
metabólico)mediadas a través de la influencia del tamañodel árbol, que
desencadenaasuvezunacascadaderelacionescausa‐efectoqueestimula
la actividad microbiana del suelo. Además, se ha encontrado una
interacción entre sequía y tamaño del fragmento que sugiere que,
dependiendodelascondicionesbioclimáticas locales, la fragmentaciónde
los bosques podría aminorar, hasta cierto punto, el efecto negativo del
aumento de las sequías mediante el incremento de la fertilidad y la
capacidadde retencióndel aguade los suelos, especialmente en aquellos
suelosconadaptaciónhistóricaalasequía.
Palabras clave: fragmentación del bosque, actividades enzimáticas,
respiración del suelo, electroforesis en gel con gradiente de
desnaturalización, perfiles fisiológicos a nivel de comunidad microbiana,
biomasa microbiana, diversidad alfa microbiana, diversidad beta
microbiana,modelosdeecuacionesestructurales.

C
Introd
apítu
ducción
lo1
ngeneeral

CAPÍTULO1
9
Introducción
La intensa intervención humana es una característica común de los
ecosistemas mediterráneos (Grove y Rackham, 2003). A lo largo de los
siglos, sehanproducido talas selectivasomasivas, quemas, roturaciones,
pastoreo, reforestaciones e incremento del urbanismo, que han
determinado la estructura y dinámica de los bosques actuales, y que
tendránindudablesrepercusionesensurespuestafuturaalcambioglobal
(Valladares et al., 2004). Entre las transformaciones humanas que han
contribuido a la modificación de los bosques mediterráneos, la
fragmentación rápida e intensa del hábitat puede ser considerada como
una de las más importantes (Alados et al., 2004; Blondel, 2010). La
fragmentación de los bosques mediterráneos tiene importantes
implicacionespara lasestrategiasdeconservaciónymanejo (Saunderset
al., 1991) y se ha convertido, cada vezmás, en un importantemotor de
cambioglobalenlacuencamediterránea(MEA,2005).Estafragmentación
delosbosqueseninteracciónconelpronosticadoaumentodelasequíaen
losecosistemasmediterráneos(Fig.1.1;verMEA2005;Christensenetal.,
2007),sonenconjuntounaamenazacrecienteparaestosecosistemas.
La fragmentación se asocia a una modificación progresiva del
paisaje(cambiosentamañoydistribucióndelosfragmentosdelhábitat,en
distanciasentrefragmentosdeunmismohábitat,yenlaconexiónentrelos
fragmentos)ysueleacompañarse,además,deprocesosdealteracióndela
cubierta vegetal (Andrén, 1994). Como consecuencia, el impacto de la
fragmentación del hábitat en la composición y funcionamiento de las
comunidades dependerá, en primer lugar, de las condiciones bióticas y
abióticas tanto de los fragmentos remanentes como de la matriz
circundantey,ensegundolugar,deltamañodelosfragmentosresultantes,
pues cuanto más pequeño es el fragmento mayor es la influencia de la
matriz en la que está embebido (Fernández et al., 2002; Fischer y

INTRODUCCIÓN
10
Lindenmayer, 2007). El tamaño del fragmento no solo determina la
cantidad de recursos disponibles, sino también la influencia de lamatriz
circundante, debido a la creciente importancia de los efectos borde a
medidaquelafragmentaciónaumenta(Fernándezetal.,2002).
Figura 1.1 Impacto de los principales motores de cambio global sobre labiodiversidad y los servicios de los distintos tipos de ecosistemas. Elaborado apartirdeMillennium‐Ecosystem‐Assessment(2005)
Entrelasalteracionesabióticasocasionadasporlareduccióndelos
fragmentos forestales se encuentran el incremento de la insolación y la
exposición al viento, que repercuten notablemente sobre la humedad y
temperaturadelsueloydelaire (Saundersetal.,1991).Esteconjuntode
alteraciones podrían reducir la homeostasis climática de los paisajes
fragmentados (Janzen, 1986; Saunders et al., 1991). Por otra parte, las
alteraciones deprocesos bióticosderivadasde la fragmentaciónhan sido
Cambio hábitat
Cambio climático
Especies invasoras
Sobre-explotación ContaminaciónEcosistema
Bosque boreal
Bosque templado
Bosque tropical
Pastizal templado
Mediterráneo
Pastizal tropical y sabana
Desierto
Aguas continentales
Costas
Océanos
Islas
Montañas
Polar
Tendencia actual Impacto durante s. XX
Bajo
Moderado
Alto
Muy alto
Disminuye
Se mantiene
Aumenta
Aumenta rápidamente

CAPÍTULO1
11
ampliamente exploradas, principalmente las derivadas de la disminución
del tamañopoblacionaly ladiversidadde losmacroorganismos,asícomo
del incremento eventual de las especies exóticas. De manera general, la
fragmentacióndelhábitattieneunimpactonegativosobrelabiodiversidad
(Saunders et al., 1991; Didham et al., 1996; Fahrig, 2003; Fischer y
Lindenmayer, 2007), alterando el funcionamiento de los ecosistemas y
afectando importantesserviciosecosistémicos(IPCC,2007).Sinembargo,
aún no se ha alcanzado un consenso sobre el signo de los efectos de la
fragmentación del hábitat sobre la biodiversidad, habiéndose mostrado
ausencia de efectos significativos (Wolff et al., 1997; Parker yMacNally,
2002; Rantalainen et al., 2008), o incluso efectos positivos sobre ciertas
poblaciones (DooleyyBowers,1998;Díaz et al., 1999;Rantalainenet al.,
2005),asícomosobrelaproductividaddebellotasdelasencinas(Morán‐
Lópezetal.,2015).
La pérdida de biodiversidad, principalmente vegetal, como
consecuenciade la reducciónde los fragmentos forestales sehaasociado
conladisminucióndelavariabilidadgenéticaydelaadecuaciónbiológica,
locualsereflejaenunamenorsupervivencia(Lienert,2004;Aguilaretal.,
2006). Como consecuencia, los suelos de paisajes fragmentados pueden
enfrentarsea lapérdidade interaccionesbiológicasyauna reducciónde
losaportesdemateriaorgánica,disminuyendo ladisponibilidadyciclado
denutrientes(Garciaetal.,2002),yalterandolosciclosbiogeoquímicosy
otrosprocesosecosistémicosclaveparael funcionamientodelecosistema
(Lindenmayer y Fischer, 2006). Sin embargo, en el caso de paisajes
fragmentados con influencia de una matriz agrícola, los cambios en la
calidaddelhábitatpuedenconcurrirdebidoaotrosfactoresasociadoscon
eltipodeusodelamatriz,comolafertilizacióndelasáreasadyacentes,el
aradointensivo,elapisonamientoy/olaerosióndelsuelo(BoutinyJobin,

INTRODUCCIÓN
12
1998;Matesanzetal.,2009),alterandotambiénlaestructuradelpaisajey
ladispersióndesemillas(Morán‐Lópezetal.,2015).
En este sentido, la fragmentación del hábitat podría alterar la
estructura del suelo y su funcionalidad, en particular aquellos procesos
relacionadosconelcicladodecarbono.Estoesdeespecialinterésdebidoa
que los suelos son el principal almacén de carbono en los ecosistemas
terrestres, albergando hasta dos terceras partes del carbono del mundo
(Dixonetal.,1994;SchlesingeryAndrews,2000).
1.1Importanciadelciclodecarbonoenlosecosistemasterrestres
El contenidode carbonoen suelo es el resultadodeunbalance entre las
entradas demateria orgánica (compuesta en promedio de un 50%de C)
originada a través de la producción primaria neta del sistema
(aproximadamente el 50%de la producción primaria bruta; (Vicca et al.,
2012) y que consiste principalmente en hojarasca, raíces, exudados y
rizodeposición, y las salidas de carbonodel sistema a través de procesos
bióticostalescomolaoxidaciónaeróbicadelamateriaorgánica,yabióticos
comolafoto‐degradaciónolalixiviación,entreotros(Bond‐Lambertyetal.,
2004;Houghton,2005).
La respiración del suelo (Rs), que es el segundo flujo de carbono
más importante del ecosistema después de la producción primaria bruta
(Janssens et al., 2001), tiene un importante papel en la regulación de los
balances netos de C en los sistemas terrestres. Rs es el resultado de la
contribución prácticamente igualitaria de la respiración heterotrófica,
derivadadelaactividadaeróbicadelosmicroorganismos,ylarespiración
autotrófica, resultantede la respiraciónde las raícesde lasplantas y sus
microorganismos rizosféricos y simbióticos asociados (Fig. 1.2; Bond‐
Lamberty et al., 2004). Además,Rs es un flujo fuertemente sensible a los
cambiosenlascondicionesmicro‐climáticasdelsuelo(p.ej.temperaturay

CAPÍTULO1
13
humedad; ver Raich y Schlesinger, 1992; Reichstein et al., 2003; Cook y
Orchard,2008),asícomoenlaproductividaddelavegetación,responsable
delsuministrodecarbonoalaspartessubterráneasdelecosistema(Martin
et al., 2009). Concretamente en ecosistemasMediterráneos, la regulación
climática de la respiración del suelo está fuertemente modulada por la
humedaddelmismo,siendoelfactorlimitantedelaactividadautotróficay
heterotróficadurantebuenapartedelaño(CurielYusteetal.,2007;Matías
etal.,2012).
Sin embargo, aún no hay suficiente conocimiento de cómo estos
factores que regulan la respiración del suelo a las diferentes escalas
espaciales y temporales se verán afectados por otros factores de cambio
global tan importantes en la cuencaMediterránea como la fragmentación
delhábitat.Enestesentido,lascontribucionesalconocimientoenfocadasa
determinarlosmecanismosyfactoresresponsablesdelavariabilidaddela
respiracióndelsuelosondegranutilidadparareducirlaincertidumbreen
las estimaciones de emisiones de carbono en los ecosistemas terrestres
(Meiretal.,2006).
Entre los procesos implicados en la respiración del suelo se
encuentra la respiración heterotrófica, fruto de la actividad
descomponedoradelamateriaorgánicaporpartedelosmicroorganismos
del suelo. La descomposición de la materia orgánica del suelo depende
enormemente de la naturaleza y composición química del sustrato
(Gallardo y Merino, 1993; Cotrufo et al., 2013), las condiciones micro‐
ambientales (Schimel et al., 1999; Sierra et al., 2015) y la composición
(diversidadyabundancia)delosorganismosdelsuelo,tantomacrocomo
microorganismos(Fig.1.2)(Hättenschwileretal.,2005;CurielYusteetal.,
2007).Además,ladescomposicióndelamateriaorgánicaporpartedelas
comunidadesmicrobianasdelsueloocurremayoritariamenteatravésdela
liberación de enzimas extracelulares específicas para cada sustrato

INTRODUCCIÓN
14
(Nannipieri et al., 2003;Baldrian,2014).Al ser el agente inmediatode la
descomposición de la materia orgánica, las actividades enzimáticas,
representan un eslabón clave en la retroalimentación entre el clima, los
ecosistemasylasconcentracionesdeCO2enlaatmósfera.
Existe un amplio conjunto de enzimas extracelulares producidas
por losmicroorganismos del suelo (p. ej. bacterias y hongos) tales como
enzimas responsables de oxidación de o carbohidratos de diferente
complejidad(glucosidasas,oxidasas,hidrolasasoperoxidasas),ydepasos
metabólicosasociadosalciclodelnitrógeno(proteasas,peptidasas,ureasa
oquitinasa),delfósforoydelazufre(fosfatasasyarilsulfatasas)(Sardansy
Peñuelas,2005;Sardansetal.,2008;Sinsabaughetal.,2008;Burnsetal.,
2013; Baldrian, 2014). Aunque existen estudios sobre la sensibilidad de
algunasenzimasalcambioclimático(SardansyPeñuelas,2005;Schimelet
al.,2010;Gómez‐Lunaetal.,2012)einclusoalafragmentacióndelhábitat
(Lázaro‐Nogal et al., 2012), estamos lejos de entender la resistencia y/o
sensibilidadde lasdiferentesenzimasresponsablesde ladescomposición
delamateriaorgánicaalcambioglobal.
La descomposición de la materia orgánica del suelo también
depende fuertementede la cantidady calidadde lamateriaorgánica a la
quelosmicroorganismospuedenacceder(GallardoyMerino,1993;Burns
etal.,2013;Cotrufoetal.,2013).Enestesentido,loscompuestosorgánicos
queconstituyenlamateriaorgánicaconsistenenunavariedaddesustratos
que históricamente han sido divididos de una manera arbitraria en una
fracción lábil integradapor compuestosorgánicos fácilmente consumidos
por los microorganismos por su palatabilidad (p. ej. ácidos orgánicos,
aminoácidos, almidones, bio‐polimeros, celulosas, hemicelulosas, quitina,
peptidoglicanos, entre otros) y/o accesibilidad (disueltos en la solución
acuosa del suelo), y una fracción estable, constituida por compuestos
orgánicos químicamente más complejos (p. ej. ácidos fúlvicos, ácidos
CAPÍTULO1
15
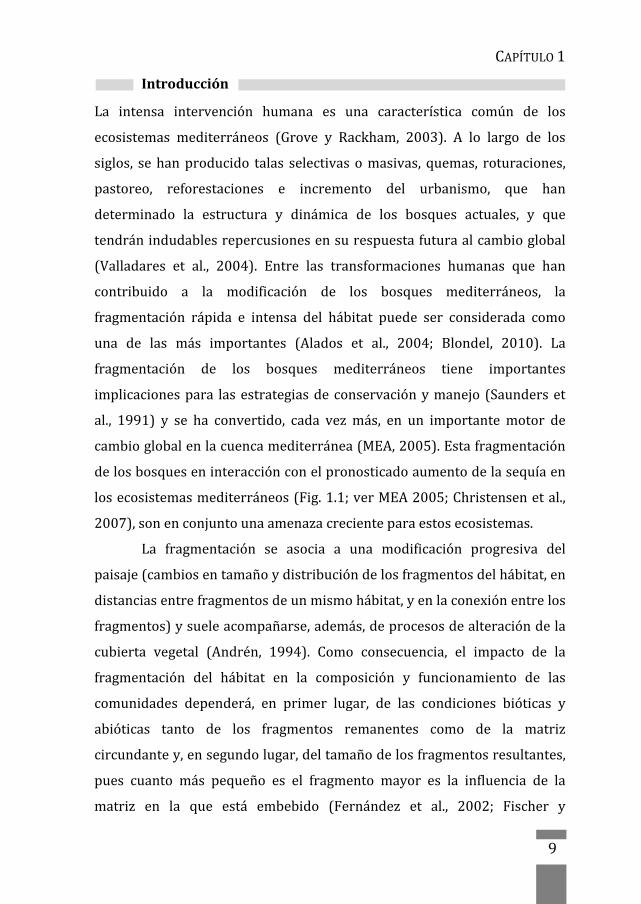
húmicosyhuminas;(Cochranetal.,2007)odedifícilaccesibilidadfísicao
geoquímica (Van Veen y Kuikman, 1990; Christensen, 2001). Esta
heterogeneidadestructuraldeloscompuestosorgánicosdelsuelorequiere
de la interaccióndediversos tiposdeenzimas,producidospordiferentes
grupos funcionales microbianos (Romaní et al., 2006). En general, las
bacterias se encargan de lamayor parte de la rápida descomposición de
sustratosfácilmentedisponibles,mientrasqueloshongospuedendegradar
compuestosorgánicosmás recalcitrantes (Wardle et al., 2004;Bardgett y
Wardle,2010)ysoncapacesdeadaptarsemejoralassequías(CurielYuste
etal.,2011;Grigulisetal.,2013;Fuchsluegeretal.,2014).
En este sentido, es importante entender la ecología de las
comunidades microbianas del suelo, su composición, estructura y
funcionamiento, ya que son responsables de la producción de enzimas y
descomposiciónde lamateriaorgánica.Laecologíadeestascomunidades
depende fuertemente de las propiedades del suelo, como el pH (Fierer y
Jackson,2006),lamateriaorgánica(Burnsetal.,2013)oladisponibilidad
denutrientes(O'Donnelletal.,2001;Baldrian,2014),entreotros.Además,
la estructura de las comunidades microbianas está regulada por las
condicionesambientales,comolasvariacionesdetemperatura(Pace,1997;
Criquetetal.,2002)y/olaprecipitaciónhistórica(CurielYusteetal.,2007;
EvansyWallenstein,2012).

INTRODUCCIÓN
16
Figura1.2Esquemade las interaccionesplanta‐suelo‐microorganismo.Laplantaproporcionaelcarbonoenformademateriaorgánicamuerta(hojas,ramas,raíces)y rizo‐deposición y exudados, modificando a su vez las condiciones micro‐ambientales del medio circundante (p. ej. aumentado la humedad del suelo ydisminuyendo la temperatura). Los organismos del suelo se encargan de ladescomposicióndelamateriaorgánicaydesuincorporaciónenlacadenatrófica.Tanto la planta como los microorganismos dependen de las característicasfisicoquímicasdelsuelo.Adicionalmente,hongosybacteriasrealizanprocesosdemineralizaciónde lamateria orgánica, liberandonutrientes.Algunoshongos soncapaces de establecer relaciones mutualistas con las plantas (micorrizas),estrechandolarelaciónplanta‐microorganismos.Losorganismosdelsueloliberannutrientes,modificanlaestructuradelsueloyofrecenproteccióncontrapatógenosa las plantas, entre otros. En el esquema semuestran los flujos de carbono delsistemacomoentradas(flechasnaranjas)ysalidas(flechasazules)delmismo.
C
CO2
CO2 CO2
CO2
Descomposición materia orgánica
Mineralización
Hongos Bacterias
Microorganism
osM
acroorganismos
CO2
Protección patógenos
Mutualistas
NutrientesEstructura del suelo
Pat
ógen
os

CAPÍTULO1
17
1.2Elpapelde las interaccionesplanta‐suelo‐microorganismo en los ciclosbiogeoquímicos
Porotraparte, lasplantasy susestrechasrelacionescausa‐efectocon los
microorganismos, juegan un papel determinante en la composición,
estructura y funcionamientode estas comunidades subterráneas (Aponte
etal.,2011;SardansyPeñuelas,2013;Rincónetal.,2014).Enestesentido,
lamayoríadelaspropiedadesquímicasyfísicasdelsueloqueafectanalas
que las comunidades microbianas (p. ej. disponibilidad de nutrientes,
contenidodehumedad, calidady cantidaddemateriaorgánica,pH, entre
otros) están fuertemente determinadas por la naturaleza de la cobertura
vegetal (Fig. 1.2); de esta manera, cambios en las propiedades
fisicoquímicasdelsueloderivadasdecambiosenlacomposicióny/ovigor
de lacoberturavegetalpuedenprovocaralteracionesen lascomunidades
microbianas que, a su vez, puede afectar a la capacidad de estas
comunidades para reciclar los nutrientes necesarios para garantizar la
supervivencia y crecimiento de la planta, creando una retroalimentación
negativa con el consecuente colapso ecosistémico (Aponte et al., 2011;
Fuchsluegeretal.,2014).
La planta, además, provee substrato tanto a los organismos
descomponedoresde lamateria orgánica (macro ymicroorganismos, Fig.
1.2), como a los organismos asociados a las raíces (rizosféricos y
simbióticos), a través de los aportes en la parte aérea (hojarasca, ramas,
etc.) y en la parte subterránea (raíces, exudados, rizodeposición, etc.). Al
descomponer la materia orgánica de las plantas, los microorganismos
regulan indirectamenteel crecimientode lasmismas,puesdeterminanel
suministrodenutrientesdisponiblesdelsuelo.Losorganismosasociadosa
las raíces (p. ej. mutualistas y patógenos) influyen en la planta de una
maneramás directa, principalmente en la calidad, direccionalidad y flujo
tanto de energía como de nutrientes (Fig. 1.2)(Wardle et al., 2004). Sin

INTRODUCCIÓN
18
embargo, estudios recientes indican que las interacciones planta‐suelo‐
microorganismo sonmuchomás complejas que las estudiadas hasta este
momento(Rincón et al., 2007; Bardgett y Wardle, 2010; Grigulis et al.,
2013; Sardans y Peñuelas, 2013), especialmente si se tieneen cuenta su
respuestaaestresesambientalescomolosderivadosdelcambioglobal.
En este sentido, también se esperaría que la diversidad de los
microorganismos sea importante para el mantenimiento de los procesos
delsuelo(incluyendoladescomposicióndelamateriaorgánica),yquesu
reducciónpudierainterrumpiroafectarnegativamenteal funcionamiento
delsistemasueloy,porende,delecosistemaengeneral(Waggetal.,2014).
Sin embargo, los estudios hasta ahora realizados respecto a la relación
entreestructura(diversidadyensamblajedeespecies)yfuncionalidadde
las comunidades microbianas presentan resultados inconclusos y/o
contradictorios (Griffiths et al., 2000; O'Donnell et al., 2001; Bell et al.,
2005;Langenhederetal.,2010;Levineetal.,2011;CurielYusteetal.,2014;
Mendesetal.,2015),porloqueesnecesariodiseñarnuevasestrategiasde
estudio para ampliar nuestro conocimiento de esta relación y así poder
predecirsurespuestaalasalteracionesasociadasalelcambioglobal.
Ante una alteración ambiental, se han descrito diferentes
estrategiasque lascomunidadesmicrobianaspuedenmostrar:resistencia
(lacomposicióndelacomunidadmicrobianasemantieneigual),resiliencia
(la composición microbiana es alterada pero regresa a su composición
original), redundancia funcional (la composición de la comunidad
microbiana es alterada pero funciona como la comunidad original), o la
alteracióndelacomposicióndelacomunidadquetienecomoresultadoun
cambio en su funcionalidad (AllisonyMartiny, 2008).De la respuestade
estas comunidades a diferentes motores de cambio global y/o su
interacción dependerá, en gran medida, su capacidad para generar las

CAPÍTULO1
19
diferentes funcionesespecíficascon lasque losmicroorganismosproveen
alecosistema(Waggetal.,2014).
Sin embargo, los estudios sobre la respuesta microbiana ante
perturbaciones se han centrado mayoritariamente en los efectos de
alteracionesclimáticassobreladiversidaddelascomunidadesmicrobianas
(p.ej.sequía,rehidratación,frío,inundacionesetc.,verSchimeletal.,1999;
Fiereretal.,2003;Schimeletal.,2007;AllisonyMartiny,2008;Rincónet
al., 2008; Curiel Yuste et al., 2011; Zak et al., 2011; Evans yWallenstein,
2012; Göransson et al., 2013; Zumsteg et al., 2013; Fuchslueger et al.,
2014).Pocosestudios, sin embargo, sehan centradoen los efectos sobre
estas comunidades microbianas y la funcionalidad del suelo de otros
motores de cambio global, tales como la fragmentación del hábitat, de
amplia repercusión especialmente en las zonasMediterráneas, (Zheng et
al.,2005;Malmivaara‐Lämsäetal.,2008;Rantalainenetal.,2008;Lázaro‐
Nogaletal.,2012;Riuttaetal.,2012).Yaquelasprediccionesfuturaspara
la cuenca Mediterránea son escenarios de mayor sequía y paisajes más
fragmentados (IPCC 2007), resulta esencial entender los efectos de la
fragmentacióndelbosqueysu interacciónconel incrementodelasequía
sobrelosecosistemasMediterráneos.
1.3Efectosdelafragmentacióndelhábitatenlafuncionalidaddelsuelo
Resultadosprevios con sistemasexperimentales comomodelodeestudio
de la fragmentación han mostrado que las comunidades de organismos
descomponedores de materia orgánica pueden ser insensibles a la
fragmentación del hábitat (revisado por Rantalainen et al., 2008)),
encontrándose incluso un efecto positivo de la fragmentación sobre su
composición(Rantalainenetal.,2005).Porelcontrario,Malmivaara‐Lämsä
et al. (2008) encontraron que la cantidad de biomasa microbiana y la
actividad(respiraciónbasal)decomunidadesmicrobianasdeecosistemas

INTRODUCCIÓN
20
Boreales fragmentados, fueron negativamente afectadas por el efecto
borde, relacionados con una menor humedad del suelo. Asimismo en
paisajes fragmentados, la funcionalidad de las comunidadesmicrobianas,
particularmente la descomposición de la materia orgánica, parece estar
controlada por las alteraciones en las propiedades abióticas del suelo,
como la temperatura (Zheng et al., 2005), la calidad del sustrato y la
disponibilidaddenutrientes(Lázaro‐Nogaletal.,2012),y lahumedaddel
suelo(Riuttaetal.,2012).
Conestosestudiosquedaevidenciadalaimportanciadecuantificar
el efecto de la fragmentación del hábitat sobre la ecología de las
comunidades microbianas, responsables de la descomposición de la
materiaorgánicaylasemisionesdeCO2deorigenheterótrofo;entendersu
ecología en unmundo cambiante no sólo es crucial para poder elaborar
prediccionesmásprecisasenunescenariodecambioglobal,sinotambién
para reducir las pérdidas de carbono de los suelos, e incrementar la
capacidadde los sistemasedáficosparaalmacenarCquedeotramanera
seríaemitidoalaatmósferaenformadeCO2(SchlesingeryAndrews,2000;
RotenbergyYakir,2010).
Como se mencionó anteriormente, es importante considerar la
estrecharelacióndelasplantasconlaestructurayelfuncionamientodelas
comunidadesmicrobianas,asícomoevaluardeformaintegradaelsistema
planta‐suelo‐microorganismo en escenarios de perturbación ambiental.
Concretamente, es importante ahondar en el efecto conjunto de varios
motoresdecambioglobal(p.ej.fragmentacióndelhábitateincrementode
la sequía) eneste sistema,pues frecuentementeestosmotorespresentan
efectos no aditivos, lo cual podría atenuar o exacerbar la respuesta del
ecosistemaamotoresindividualesdecambioglobal(Matesanzetal.,2009;
Lázaro‐Nogaletal.,2012).
CAPÍTULO1
21
Estructurayobjetivosdelatesis
El objetivo de la presente tesis doctoral fue evaluar el efecto de la
fragmentacióndelbosquesobrelafuncionalidaddelsistemaplanta‐suelo‐
microorganismo. En la tesis se exploró la importancia relativa de la
respuesta de este sistema a dos de los motores de cambio global más
importantesenelMediterráneocontinental:lafragmentacióndelhábitaty
lasequía.Paraello,seanalizaronmúltiplesindicadoresdelafuncionalidad
delsistemaplanta‐suelo‐microorganismocomolarespiracióndelsuelo,la
actividadenzimáticayelperfilmetabólico,ladiversidadyestructuradelas
comunidadesmicrobianas,y laproductividad, fisiologíayaclimataciónde
plántulas de Quercus ilex (Fig. 1.3), utilizando una aproximación multi‐
escala.
Porunaparteseestudiólarespuestadelafuncionalidaddelsueloy
lascomunidadesmicrobianasa la fragmentacióndelhábitat (Capítulo2y
3).Paraello,serealizóunmuestreodecampoenencinaresfragmentados
de la región sur, en la submeseta mesomediterránea, en el cual se
determinó la respiración del suelo in situ y algunas características
estructurales de las encinas, además, se recolectaron muestras de suelo
paralaposteriordeterminacióndeparámetrosfisicoquímicos,actividades
enzimáticasybiomasamicrobiana (Capítulo2).Lasmuestrasdesuelode
este muestreo, así como los parámetros fisicoquímicos determinados, se
utilizaronposteriormentecomobaseparaanalizardelefectoespecíficode
la fragmentación del encinar sobre la estructura y funcionalidad de las
comunidades microbianas (bacterias y hongos), estudio en el que se
evaluaron la diversidad, el ensamblaje y el perfilmetabólico, así como el
posiblevínculoexistenteentrediversidadyfunciónenestascomunidades
(Capítulo3).
En los siguientes capítulos se exploró la respuesta del sistema
planta‐suelo‐microorganismo a la sequía, utilizando microcosmos con

ESTRUCTURAYOBJETIVOSDELATESIS
22
plántulas deQ. ilex y suelos de encinares fragmentados comomodelo de
estudio(Capítulos4y5).Enestosexperimentos,adicionalmenteseestudió
una segunda región climatológicamente contrastada con respecto a la
anterior: la región norte en la submeseta supremediterrránea. En un
primerexperimentoencondicionescontroladas,seexplorólarespuestaa
la sequía crónica gradual (p. ej. verano) del sistema planta‐suelo‐
microorganismo y a las primeras lluvias del otoño (rehidratación) del
sistema suelo‐microorganismo. Para ello, se examinó el intercambio neto
del ecosistema a lo largo de la simulación, además de actividades
enzimáticas,y ladiversidadyestructurade lascomunidadesmicrobianas
(bacterias y hongos), así como rasgos funcionales y fisiológicos de las
plántulas(Capítulo4).Finalmente,seevaluóelimpactodelaplasticidadde
las plántulas de encinas sobre la respuesta del sistema planta‐suelo‐
microorganismoasequía.Paraello,serealizóunsegundoexperimentoen
condicionescontroladas,conplántulasdediferentesprocedenciascrecidas
en presencia o no demicroorganismos nativos de suelos procedentes de
encinares fragmentados de las regiones anteriormente mencionadas,
sometidasaunasequíacrónicagradual.Enesteexperimento,seevaluóel
intercambionetodelecosistema,asícomorasgosfuncionalesyfisiológicos
delasplántulas,ysucapacidaddeasociaciónconhongosectomicorrícicos
(Capítulo5).
Los capítulos 2 al 5 de la tesis han sido escritos en inglés para su
publicación en revistas internacionales ypara facilitar la difusiónde este
trabajo. Al igual que la introducción general, la discusión y conclusiones
generalessepresentanencastellano.Acontinuaciónsedetallaneltítuloy
objetivosespecíficosdecadacapítulo.

CAPÍTULO1
23
Figura1.3Esquemaconceptualdelatesisdoctoralydelosaspectosabordadosencadacapítulo.
Capítulo 2. La fragmentación del bosque afecta indirectamente alsistema árbol‐suelo y a la funcionalidad microbiana en encinaresmediterráneos.
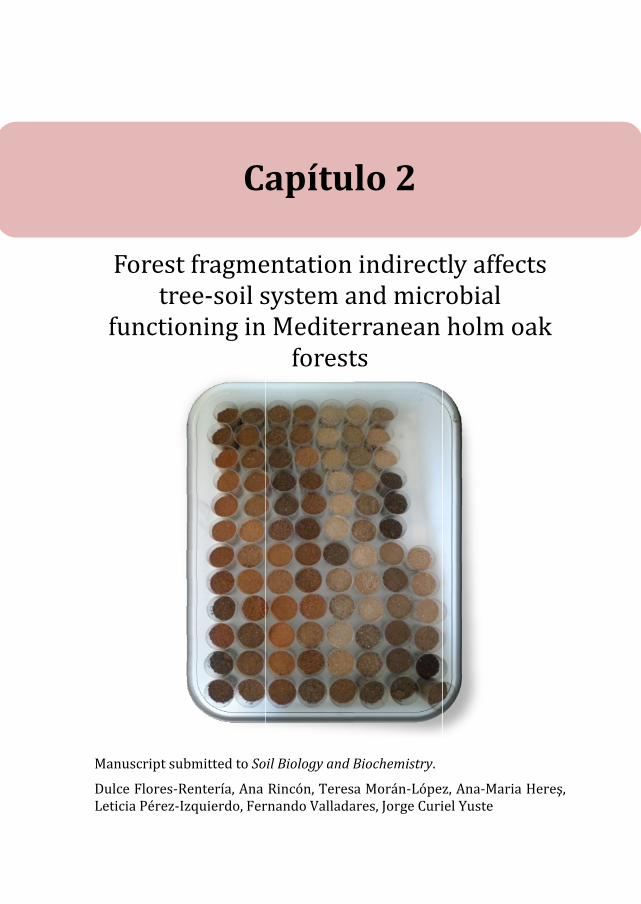
Forest fragmentation indirectly affects tree‐soil system and microbialfunctioninginMediterraneanholmoakforests.
DulceFlores‐Rentería,AnaRincón,TeresaMorán‐López,Ana‐MariaHereş,LeticiaPérez‐Izquierdo,FernandoValladares,JorgeCurielYuste
ManuscritoenviadoalarevistaSoilBiologyandBiochemistry.
Elobjetivodeestecapítulofueanalizarlarespuestadelafuncionalidadde
las comunidadesmicrobianas a lamatriz agrícola circundante, en la que
estánembebidos los fragmentosdeencinares,así comoa la coberturade
las encinas. Además de identificar el papel y la importancia relativa de
Cambio global
Fragmentación del hábitat
Cambio climático
Comunidades microbianas
Biomasa microbiana
Actividades enzimáticas
Perfil metabólico microbiano
Desarrollo de plántulas
Funcionamiento del suelo
Respiración del suelo
Fisiología
Aclimatación
Diversidad microbiana
Estructuramicrobiana
Capítulo 2
Productividad
Capítulo 3 Capítulo 4 Capítulo 5Capítulo 1

ESTRUCTURAYOBJETIVOSDELATESIS
24
factoresbióticosyabióticosenelfuncionamientomicrobianodelsueloen
una escala de paisaje. Para ello, se determinó la respiración del suelo de
encinares fragmentadosencampo,asícomosuactividadenzimáticaenel
laboratorio, además diversos factores bióticos y abióticos de losmismos
(materiaorgánica,humedad,temperatura,nutrientes,pH).
Capítulo 3. Lamatriz agrícola afectadirectamente a la estructura eindirectamente almetabolismode las comunidadesmicrobianasdelossuelosdeencinaresfragmentados.
Agricultural matrix directly affects the structure and indirectly themetabolismofmicrobialcommunitiesinfragmentedMediterraneanholmoakforestsoils
Dulce Flores‐Rentería, Ana Rincón, Fernando Valladares, Jorge CurielYuste.
Manuscritoenpreparación.
El objetivo de este capítulo fue analizar la respuesta de las comunidades
microbianasdelsueloalainfluenciadelamatrizagrícolacircundante,ala
par de identificar el papel e importancia relativa de factores bióticos y
abióticos en el ensamblaje y diversidadde las comunidadesmicrobianas.
Para ello se determinó el perfil estructural y metabólico de las
comunidades microbianas (bacterias y hongos) de suelos de encinares
fragmentados. Además, se analizaron los posibles vínculos entre la
estructurayelfuncionamientodelascomunidadesmicrobianas.
Capítulo4.Lafragmentacióndelhábitatpuedemodularlosefectosdelasequíasobreelsistemaplanta‐suelo‐microorganismoenencinaresMediterráneos(Quercusilex)fragmentados.
Habitat fragmentation can modulate drought effects on the plant‐soil‐microbialsysteminMediterraneanholmoak(Quercusilex)forests
DulceFlores‐Rentería,JorgeCurielYuste,AnaRincón,FrancisQ.Brearley,JuanCarlosGarcía‐Gil,FernandoValladares
Manuscrito publicado enMicrobial Ecology 1‐15. doi: 10.1007/s00248‐015‐0584‐9

CAPÍTULO1
25
El objetivo de este capítulo fue estudiar el impacto de la sequía y
rehidratación en la estructura y funcionamiento de las comunidades
microbianas del suelo, y evaluar la interacción potencial entre
fragmentaciónyclima,explorandolarespuestafisiológicaalasequíadelas
plántulas de encina. Para lo cual se llevó a cabo un experimento en
condiciones controladas usando suelo de las dos regiones estudiadas
(norteysur)ydetamañodefragmentocontrastado(grandeypequeño)y
plántulasdeQ.ilexdelaregiónsur.Estosmicrocosmosfueronsometidosa
unasequíacrónicagradualysuposteriorrehidratación.
Capítulo5.La influenciade la fragmentacióndelbosquey la regiónbioclimática sobre las característicasbio‐fisicoquímicasdel suelo sesobreponenalpotencialefectodelaprocedenciadelasplántulas,enlaresistenciaasequíadelsistemaplanta‐suelo‐microorganismo
Theinfluenceofforestfragmentationandbioclimaticregionoverthebio‐physicochemical soil characteristics overshadows potential seedlingprovenanceeffects in theresistanceof theplant‐soil‐microbialsystemtodrought.
Dulce Flores‐Rentería, Jorge Curiel Yuste, Fernando Valladares, AnaRincón.
Manuscritoenpreparación.
El objetivo general de este capítulo fue evaluar el impacto de la sequía
sobre el funcionamiento del sistema planta‐suelo‐microorganismo y
evaluarcómolaprocedenciadelasplántulasyelorigendelossuelos,cono
sinmicroorganismosnativospuedenafectarestefuncionamiento.Paraello
sellevóacabounexperimentoencondicionescontroladasusandosuelode
las dos regiones estudiadas, norte y sur, con diferente influencia de la
matriz agrícola circundante. Los suelos se utilizaron como inoculo
(presencia o no demicroorganismos nativos) para crecer plántulas deQ.
ilexdetresprocedenciasdelapenínsulaibérica.Estosmicrocosmosfueron
sometidosaunasequíacrónicagradual.

REGIONESDEESTUDIO
26
Regionesdeestudio
Paraesteestudioseseleccionólaencina(Quercusilexsubsp.ballota(Desf.)
Samp, de aquí en adelante Q. ilex), especie clave de los bosques
Mediterráneos. La encina es un árbol‐arbusto perenne ampliamente
distribuidoportodalaregiónmediterránea.Sedistribuyeenclimasdesde
clima frío semiárido hasta mediterráneo húmedo templado, y es
considerada tolerante a la sequía (Baquedano y Castillo, 2007). Es una
especie monoica, que florece en primavera, de polinización anemófila y
cuyos frutos (bellotas)sondispersadosenelotoñoporavesymamíferos
(Castroviejoetal.,1993).
Las regiones de estudio se escogieron entre las estudiadas
previamenteporSantosyTellería(1998);Díazetal.(1999)yDíazyAlonso
(2003), seleccionando áreas de encinares fragmentados en la submeseta
Norteyen lasubmesetaSur(Fig.1.4).Previamente,serealizóunestudio
delmaterial cartográfico de ambas áreas, seleccionándose fragmentos de
tamaños contrastados: fragmentos grandes con un área superior a 10
hectáreasyfragmentospequeñosembebidosenlamatrizagrícola.Enuna
segundafasesevisitarontodaslasáreaspreseleccionadas,yseprocedióa
la selección definitiva de los fragmentos de acuerdo a los siguientes
criterios:i)ubicacióndelasáreasenterrenosllanosoderelievesuave;ii)
la matriz circundante preferentemente de uso agrícola, dada la elevada
influenciadeesterasgodelpaisajesobre los factoresbióticosyabióticos;
iii)losfragmentospequeñosconalmenostresencinasyunmáximode0.5
hectáreas. Se seleccionaron tres fragmentos grandes y entre tres y cinco
fragmentospequeñosencadaunadelasregiones(Fig.1.5).Losfragmentos
grandes, se subdividieron en interior (>30 metros desde el borde del
fragmento) y borde (Fig. 1.6). En ambas regiones, el uso de la matriz
agrícola, está destinada al cultivo intensivo de cereales, legumbres y
algunosviñedos.

CAPÍTULO1
27
Figure 1.4 Localización de las áreas de estudio en la península Ibérica. Semuestran las localidades correspondientes a las regiones bioclimáticas Norte‐Lerma y Sur‐Quintanar (estrellas), y las localidades de procedencia de bellotas(cuadrados) referidas en el Capítulo 5 (Galaico‐Leonesa, La Mancha y SistemaIbérico).Laaltitudestárepresentadaenvariacióndegris.
La regiónNorte se localiza en las cercanías de Lerma, en la provincia de
Burgos, (41°58’‐42°02’N, 03°45’‐03°52’O; 930msnm). Los fragmentos de
encinar estudiados se localizan en un área de 1500 hectáreas, separados
poralmenos50myunmáximode11km(Fig.1.5a).Estaregiónpertenece
a la zona bioclimática supramediterránea (Rivas‐Martínez, 1981) y se
caracterizapor554mmdeprecipitaciónanualyunatemperaturamediade
11°C(Fig.1.7).Lacoberturaarbóreaestádominadaporencinas(Quercus
ilex), con quejigos aislados (Quercus faginea LAM) y sabinas (Juniperus
thuriferaL.),yunsotobosquecompuestoporarbustostípicosdelaszonas
supremediterráneas húmedas y frías (p. ej. Cistus laurifolius L., Genista
scorpius(L.)DC,ThymuszygisLoefl.exL.)(SantosyTellería,1998;Díazet
al., 1999). Los suelos dominantes están clasificados como cambisoles
(cálcicos)(WRB,2007),contexturafrancoarenosa:11%arena,42%limo
and47%arcilla.
Norte - Lerma
Sur - QuintanarLa Mancha
Sistema Ibérico
Galaico Leonesa

REGIONESDEESTUDIO
28
Figura 1.5 Mapa de las regiones bioclimáticas Norte (a) y Sur (b) en España,mostrando los fragmentos de encinar (morado). Modificado de SIGPAC(http://www.sigpac.jcyl.es/visor).ZonaUTM30.
Uso de suelo
Frondosas Coníferas Mixtos Matorral Prados y pastizales
Cultivos Cultivos con árboles
Olivar Viña Viña-Olivar
Curvas de nivel. Intercaladas. Depresión
Provincia. Municipio
Nación. Comunidad Autónoma
Curso de agua
Canales, acequias
Conducto subterráneo. Drenaje
Edif icio: aislado, agrícola o industrial
Pozo. Fuente. Manantial
Depósito de agua
Depuradora. Estanque o piscina
Simbolos convencionales
Fragmentos: Pequeños, grandes
500 505
0 1 2 km
4.3854.3
80
b)
430 435
4.650
4.645
0 1 2 km
4.655
a)

CAPÍTULO1
29
Figura 1.6 Encinares mediterráneos fragmentados en Quintanar de la Orden,España.a) Interiordeun fragmentogrande(>10ha);b)bordedeun fragmentogrande (> 10 ha); c) fragmentos pequeños (< 0.5 ha); d) producción de bellota(cosecha)del año2012 (Quercus ilex ssp. ballota). Las fotosa y c se tomaronenjunio de 2011, b y d en noviembre de 2012 (fotos: Mario Díaz, tomadas de(Valladaresetal.,2014).
La regiónSur se localizaen las cercaníasdeQuintanarde laOrden, en la
provincia de Toledo, (39°30’‐39°35’N, 02°47’‐02°59’O; 870 msnm). Los
fragmentos de encinar estudiados se localizan en un área de 1000
hectáreas,separadosporalmenos50myunmáximode8km(Fig.1.5b).
Esta región pertenece a la zona bioclimática mesomediterránea (Rivas‐
Martínez,1981)ysecaracterizapor434mmdeprecipitaciónanualyuna
temperaturamediade14°C(Fig.1.7).Lacoberturaarbóreaestádominada
porencinas(Quercusilex),conalgunascoscojas(QuercuscocciferaL.),yun
sotobosque compuesto por arbustos típicos de las xéricas
mesomediterráneas (p. ej. Asparagus acutifolius L., Cistus ladanifer L.,
Rhamnus alaternus L., Rhamnus lycioides Brot) (Santos y Tellería, 1998;
REGIONESDEESTUDIO
30
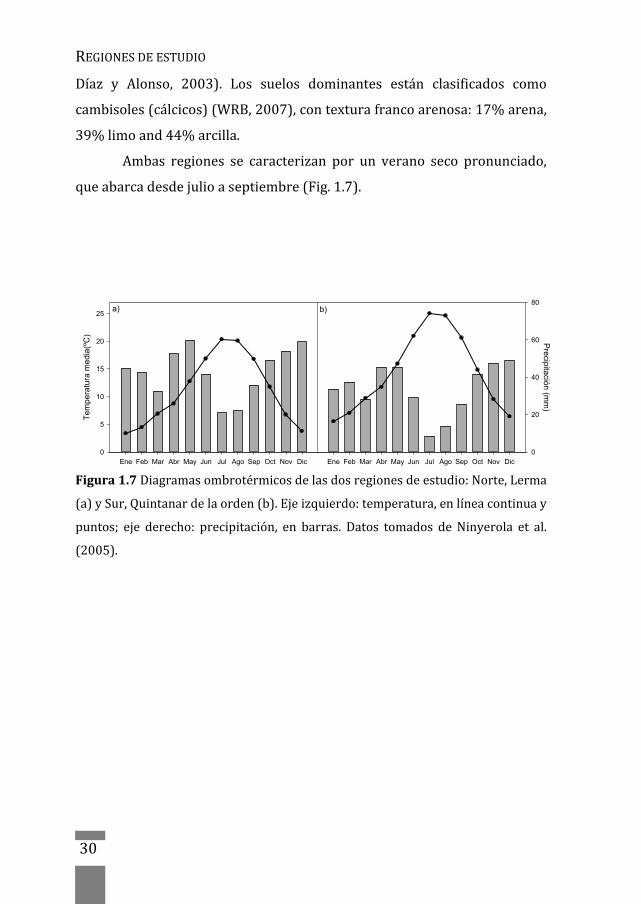
Díaz y Alonso, 2003). Los suelos dominantes están clasificados como
cambisoles(cálcicos)(WRB,2007),contexturafrancoarenosa:17%arena,
39%limoand44%arcilla.
Ambas regiones se caracterizan por un verano seco pronunciado,
queabarcadesdejulioaseptiembre(Fig.1.7).
Figura1.7Diagramasombrotérmicosdelasdosregionesdeestudio:Norte,Lerma
(a)ySur,Quintanardelaorden(b).Ejeizquierdo:temperatura,enlíneacontinuay
puntos; eje derecho: precipitación, en barras. Datos tomados de Ninyerola et al.
(2005).
a)
Ene Feb Mar Abr May Jun Jul Ago Sep Oct Nov Dic
Tem
pera
tura
med
ia(º
C)
0
5
10
15
20
25b)
Ene Feb Mar Abr May Jun Jul Ago Sep Oct Nov Dic
Precipitación (m
m)
0
20
40
60
80

CAPÍTULO1
31
Referencias
Aguilar, R., L. Ashworth, L. Galetto y M. A. Aizen (2006). Plant reproductivesusceptibility to habitat fragmentation: review and synthesis through ameta‐analysis.EcologyLetters,9(8):968‐980.
Alados, C. L., Y. Pueyo, O. Barrantes, J. Escós, L. Giner y A. B. Robles (2004).Variationsinlandscapepatternsandvegetationcoverbetween1957and1994 ina semiaridMediterraneanecosystem.LandscapeEcology,19(5):543‐559.
Allison, S. D. y J. B. Martiny (2008). Resistance, resilience, and redundancy inmicrobialcommunities.ProceedingsoftheNationalAcademyofSciences,USA,105(Supplement1):11512‐11519.
Andrén, H. (1994). Effects of habitat fragmentation on birds and mammals inlandscapeswithdifferentproportionsofsuitablehabitat:areview.Oikos,71(3):355‐.
Aponte,C.,L.V.García, I.M.Pérez‐Ramos,E.GutiérrezyT.Marañón(2011).Oaktrees and soil interactions inMediterranean forests: a positive feedbackmodel.JournalofVegetationScience,22(5):856‐867.
Baldrian, P. (2014). Distribution of extracellular enzymes in soils: spatialheterogeneity and determining factors at various scales. Soil ScienceSocietyofAmericaJournal,78(1):11‐18.
Baquedano, F. J. y F. J. Castillo (2007). Drought tolerance in the Mediterraneanspecies Quercus coccifera, Quercus ilex, Pinus halepensis, and Juniperusphoenicea.Photosynthetica,45(2):229‐238.
Bardgett,R.D.yD.A.Wardle(2010).Aboveground‐belowground linkages:bioticinteractions,ecosystemprocesses,andglobalchange.Oxford,UK,OxfordUniversityPress.
Bell, T., J. A. Newman, B. W. Silverman, S. L. Turner y A. K. Lilley (2005). Thecontribution of species richness and composition to bacterial services.Nature,436(7054):1157‐1160.
Blondel,J.(2010).TheMediterraneanregion:biologicaldiversitythroughtimeandspace.Oxford,UK,OxfordUniversityPress.
Bond‐Lamberty,B., C.WangyS.T.Gower (2004).A global relationshipbetweentheheterotrophicandautotrophiccomponentsofsoilrespiration?GlobalChangeBiology,10(10):1756‐1766.
Boutin, C. y B. t. Jobin (1998). Intensity of agricultural practices and effects onadjacenthabitats.EcologicalApplications,8(2):544‐557.
Burns,R.G., J. L.DeForest, J.Marxsen,R.L. Sinsabaugh,M.E. Stromberger,M.D.Wallenstein, M. N. Weintraub y A. Zoppini (2013). Soil enzymes in achanging environment: current knowledge and future directions. SoilBiologyandBiochemistry,58:216‐234.
Castroviejo,S.,C.Aedo,S.Cirujano,M.Laínz,P.Montserrat,R.Morales,C.MuñozGarmandia,C.Navarro, J.PaivayC.Soriano(1993).FloraIbericaplantasvasculares de la península ibérica e islas baleares. . Madrid, Spain, RealJardínBotánico,C.S.I.C.
REFERENCIAS
32
Cochran,R.L.,H.P.Collins,A.KennedyyD.F.Bezdicek(2007).Soilcarbonpoolsand fluxes after land conversion in a semiarid shrub‐steppe ecosystem.BiologyandFertilityofSoils,43(4):479‐489.
Cook,F. J.yV.A.Orchard(2008).Relationshipsbetweensoilrespirationandsoilmoisture.SoilBiologyandBiochemistry,40(5):1013‐1018.
Cotrufo, M. F., M. D. Wallenstein, C. M. Boot, K. Denef y E. Paul (2013). TheMicrobial Efficiency‐Matrix Stabilization (MEMS) framework integratesplantlitterdecompositionwithsoilorganicmatterstabilization:dolabileplantinputsformstablesoilorganicmatter?GlobalChangeBiology,19(4):988‐995.
Criquet,S.,S.Tagger,G.VogtyJ.LePetit(2002).Endoglucanaseandβ‐glycosidaseactivities in an evergreen oak litter: annual variation and regulatingfactors.SoilBiologyandBiochemistry,34(8):1111‐1120.
CurielYuste, J.,D.D.Baldocchi,A.Gershenson,A.Goldstein,L.MissonyS.Wong(2007). Microbial soil respiration and its dependency on carbon inputs,soiltemperatureandmoisture.GlobalChangeBiology,13(9):2018‐2035.
CurielYuste,J.,A.J.Fernandez‐Gonzalez,M.Fernandez‐Lopez,R.Ogaya,J.Peñuelasy F. Lloret (2014). Functional diversification within bacterial lineagespromotes wide functional overlapping between taxonomic groups in aMediterraneanforestsoil.FEMSMicrobiologyEcology,90(1):54‐67.
CurielYuste,J.,J.Peñuelas,M.Estiarte,J.Garcia‐Mas,S.Mattana,R.Ogaya,M.Pujoly J. Sardans (2011). Drought‐resistant fungi control soil organic matterdecomposition and its response to temperature. Global Change Biology,17(3):1475‐1486.
Christensen, B. T. (2001). Physical fractionation of soil and structural andfunctionalcomplexityinorganicmatterturnover.EuropeanJournalofSoilScience,52(3):345‐353.
Christensen, J.H.,A.Hewitson,A.Busuioc,A.Chen,X.Gao, I.Held,R. Jones,R.K.Kolli,W.T.Kwon,R.Laprise,V.MagañaRueda,L.Mearns,C.G.Menéndez,J. Räisänen, A. Rinke, A. Sarr y P. Whetton (2007). Regional ClimateProjections. . Climate Change 2007: The Physical Science Basis.ContributionofWorkingGroupItotheFourthAssessmentReportoftheIntergovernmental Panel on Climate Change S. Solomon, D. Qin, M.Manning et al. Cambridge, United Kingdom and New York, NY, USA.,CambridgeUniversityPress.
Díaz, M. y C. L. Alonso (2003). Wood mouse Apodemus sylvaticus winter foodsupply:density,condition,breeding,andparasites.Ecology,84(10):2680‐2691.
Díaz, M., T. Santos y J. L. Tellería (1999). Effects of forest fragmentation on thewinterbodyconditionandpopulationparametersofanhabitatgeneralist,the wood mouse Apodemus sylvaticus: a test of hypotheses. ActaOecologica,20(1):39‐49.
Didham, R. K., J. Ghazoul, N. E. Stork y A. J. Davis (1996). Insects in fragmentedforests:afunctionalapproach.TrendsinEcology&Evolution,11(6):255‐260.
Dixon,R.K.,A.M.Solomon,S.Brown,R.A.Houghton,M.C.TrexieryJ.Wisniewski(1994). Carbon Pools and Flux of Global Forest Ecosystems. Science,263(5144):185‐190.

CAPÍTULO1
33
Dooley, J. L. y M. A. Bowers (1998). Demographic responses to habitatfragmentation: experimental tests at the landscape and patch scale.Ecology,79(3):969‐980.
Evans, S. yM.Wallenstein (2012). Soilmicrobial community response to dryingand rewetting stress: does historical precipitation regime matter?Biogeochemistry,109(1‐3):101‐116.
Fahrig,L.(2003).Effectsofhabitatfragmentationonbiodiversity.AnnualReviewofEcology,EvolutionandSystematics,34(1):487‐515.
Fernández,C.,F.J.Acosta,G.Abellá,F.LópezyM.Díaz(2002).Complexedgeeffectfields as additive processes in patches of ecological systems. EcologicalModelling,149(3):273‐283.
Fierer,N.yR.B. Jackson(2006).Thediversityandbiogeographyofsoilbacterialcommunities. Proceedings of the National Academy of Sciences, USA,103(3):626‐631.
Fierer, N., J. P. Schimel y P. A. Holden (2003). Influence of Drying–RewettingFrequency on Soil Bacterial Community Structure. Microbial Ecology,45(1):63‐71.
Fischer, J. y D. B. Lindenmayer (2007). Landscape modification and habitatfragmentation:asynthesis.GlobalEcologyandBiogeography,16(3):265‐280.
Fuchslueger,L.,M.Bahn,K.Fritz,R.HasibederyA.Richter (2014).Experimentaldrought reduces the transfer of recently fixed plant carbon to soilmicrobesandalters thebacterial community composition inamountainmeadow.NewPhytologist,201(3):916‐927.
Gallardo, A. y J. Merino (1993). Leaf decomposition in two Mediterraneanecosystems of southwest Spain: influence of substrate quality. Ecology,74(1):152‐161.
Garcia,C.,T.Hernandez,A.RoldanyA.Martin(2002).Effectofplantcoverdeclineon chemical and microbiological parameters under Mediterraneanclimate.SoilBiologyandBiochemistry,34(5):635‐642.
Gómez‐Luna,B.E.,G.M.d.l.L.Ruiz‐Aguilar,G.Vázquez‐Marrufo,L.DendoovenyV.Olalde‐Portugal (2012). Enzyme activities and metabolic profiles of soilmicroorganismsatKILNsitesinQuercusspp.temperateforestsofcentralMexico.AppliedSoilEcology,52(0):48‐55.
Göransson,H.,D. L.Godbold,D. L. Jonesy J.Rousk (2013).Bacterial growthandrespirationresponsesuponrewettingdryforestsoils:impactofdrought‐legacy.SoilBiologyandBiochemistry,57(0):477‐486.
Griffiths, B. S., K. Ritz, R. D. Bardgett, R. Cook, S. Christensen, F. Ekelund, S. J.Sørensen, E. Bååth, J. Bloem, P. C. De Ruiter, J. Dolfing y B. Nicolardot(2000). Ecosystem response of pasture soil communities to fumigation‐induced microbial diversity reductions: an examination of thebiodiversity–ecosystemfunctionrelationship.Oikos,90(2):279‐294.
Grigulis,K., S. Lavorel,U.Krainer,N.Legay,C.Baxendale,M.Dumont,E.Kastl,C.Arnoldi,R.D.Bardgett,F.Poly,T.Pommier,M.Schloter,U.Tappeiner,M.BahnyJ.‐C.Clément(2013).Relativecontributionsofplanttraitsandsoilmicrobialpropertiestomountaingrasslandecosystemservices.JournalofEcology,101(1):47‐57.

REFERENCIAS
34
Grove, A. T. y O. Rackham (2003). The Nature of Mediterranean Europe: AnEcologicalHistory,YaleUniversityPress.
Hättenschwiler, S., A. V. Tiunov y S. Scheu (2005). Biodiversity and LitterDecomposition in Terrestrial Ecosystems. Annual Review of Ecology,Evolution,andSystematics,36:191‐218.
Houghton, R. A. (2005). Aboveground Forest Biomass and the Global CarbonBalance.GlobalChangeBiology,11(6):945‐958.
IPCC (2007). Climate Change 2007 ‐ Syntesis report, IPCC, IntergovernmentalPanelonClimateChangec/oWorldMeteorologicalOrganization(WMO).
Janssens,I.A.,H.Lankreijer,G.Matteucci,A.S.Kowalski,N.Buchmann,D.Epron,K.Pilegaard,W.Kutsch,B.Longdoz,T.Grünwald,L.Montagnani,S.Dore,C.Rebmann,E. J.Moors,A.Grelle,Ü.Rannik,K.Morgenstern, S.Oltchev,R.Clement, J.Guðmundsson, S.Minerbi,P.Berbigier,A. Ibrom, J.Moncrieff,M.Aubinet,C.Bernhofer,N.O.Jensen,T.Vesala,A.Granier,E.D.Schulze,A.Lindroth, A. J. Dolman, P. G. Jarvis, R. Ceulemans y R. Valentini (2001).Productivityovershadowstemperatureindeterminingsoilandecosystemrespiration across European forests. Global Change Biology, 7(3): 269‐278.
Janzen,D.H.(1986).Theeternalexternalthreat.ConservationBiology.Thescienceofscarcityanddiversity.M.E.Soulè.Sunderland,Sinauer:286‐303.
Langenheder,S.,M.T.Bulling,M.SolanyJ.I.Prosser(2010).Bacterialbiodiversity‐ecosystem functioning relations are modified by environmentalcomplexity.PLoSONE,5(5):e10834.
Lázaro‐Nogal, A., S. Matesanz, T. Gimeno, A. Escudero y F. Valladares (2012).Fragmentationmodulates the strong impact of habitat quality and plantcover on fertility andmicrobial activity of semiarid gypsum soils. PlantandSoil,358(1‐2):213‐223.
Levine,U.Y.,T.K.Teal,G.P.RobertsonyT.M.Schmidt(2011).Agriculture'simpacton microbial diversity and associated fluxes of carbon dioxide andmethane.ISMEJ,5(10):1683‐1691.
Lienert,J.(2004).Habitatfragmentationeffectsonfitnessofplantpopulations–areview.JournalforNatureConservation,12(1):53‐72.
Lindenmayer, D. B. y J. Fischer (2006). Habitat fragmentation and landscapechange:anecologicalandconservationsynthesis.Washington,USA,IslandPress.
Malmivaara‐Lämsä,M.,L.Hamberg,E.Haapamäki,J.Liski,D.J.Kotze,S.Lehvävirtay H. Fritze (2008). Edge effects and trampling in boreal urban forestfragments – impacts on the soil microbial community. Soil Biology andBiochemistry,40(7):1612‐1621.
Martin, J. G., P. V. Bolstad, S.‐R. Ryu y J. Chen (2009). Modeling soil respirationbased on carbon, nitrogen, and root mass across diverse Great Lakeforests.AgriculturalandForestMeteorology,149(10):1722‐1729.
Matesanz, S., A. Escudero y F. Valladares (2009). Impact of three global changedriversonaMediterraneanshrub.Ecology,90(9):2609‐2621.
Matías,L.,J.CastroyR.Zamora(2012).Effectofsimulatedclimatechangeonsoilrespiration in aMediterranean‐type ecosystem: rainfall andhabitat typearemoreimportantthantemperatureorthesoilcarbonpool.Ecosystems,15(2):299‐310.

CAPÍTULO1
35
Meir,P.,P.CoxyJ.Grace(2006).Theinfluenceofterrestrialecosystemsonclimate.TrendsinEcology&Evolution,21(5):254‐260.
Mendes,L.,S.Tsai,A.Navarrete,M.deHollander,J.vanVeenyE.Kuramae(2015).Soil‐Bornemicrobiome:linkingdiversitytofunction.MicrobialEcology:1‐11.
Millennium‐Ecosystem‐Assessment (2005). Ecosystems and Human Well‐being:Synthesis.Washington,DC,IslandPress.
Morán‐López,T.,M.Fernández,C.L.Alonso,D.Flores‐Rentería,F.ValladaresyM.Díaz(2015).Effectsofforestfragmentationontheoak–rodentmutualism.Oikos:n/a‐n/a.
Nannipieri, P., J. Ascher,M. T. Ceccherini, L. Landi, G. Pietramellara y G. Renella(2003). Microbial diversity and soil functions. European Journal of SoilScience,54(4):655‐670.
Ninyerola,M.,X.PonsyJ.M.Roure.(2005).AtlasclimáticodigitaldelaPenínsulaIbérica. Metodología y aplicaciones en bioclimatología y geobotánica.Retrieved 30/04/2014, 2014, fromhttp://www.opengis.uab.es/wms/iberia/index.htm.
O'Donnell, A., M. Seasman, A. Macrae, I. Waite y J. Davies (2001). Plants andfertilisers as drivers of change in microbial community structure andfunctioninsoils.PlantandSoil,232(1‐2):135‐145.
Pace, N. R. (1997). A Molecular View of Microbial Diversity and the Biosphere.Science,276(5313):734‐740.
Parker, M. y R. MacNally (2002). Habitat loss and the habitat fragmentationthreshold: an experimental evaluation of impacts on richness and totalabundances using grassland invertebrates. Biological Conservation,105(2):217‐229.
Raich, J. W. y W. H. Schlesinger (1992). The global carbon dioxide flux in soilrespirationanditsrelationshiptovegetationandclimate.TellusB,44(2):81‐99.
Rantalainen, M.‐L., H. Fritze, J. Haimi, T. Pennanen y H. Setälä (2005). Speciesrichness and food web structure of soil decomposer community asaffected by the size of habitat fragment and habitat corridors. GlobalChangeBiology,11(10):1614‐1627.
Rantalainen, M.‐L., J. Haimi, H. Fritze, T. Pennanen y H. Setälä (2008). Soildecomposer community as a model system in studying the effects ofhabitat fragmentation and habitat corridors. Soil Biology andBiochemistry,40(4):853‐863.
Reichstein,M.,A.Rey,A.Freibauer,J.D.Tenhunen,R.Valentini,J.Banza,P.Casals,Y. Cheng, J. M. Grünzweig, J. Irvine, R. Joffre, B. E. Law, D. Loustau, F.Miglietta,W.Oechel,J.M.Ourcival,J.S.Pereira,A.Peressotti,F.Ponti,Y.Qi,S.Rambal,M.Rayment,J.Romanya,F.Rossi,V.Tedeschi,G.Tirone,M.XuyD. Yakir (2003).Modeling temporal and large‐scale spatial variability ofsoil respiration from soil water availability, temperature and vegetationproductivityindices.GlobalBiogeochemicalCycles,17(4):15‐11.
Rincón, A., M. R. Felipe y M. Fernández‐Pascual (2007). Inoculation of Pinushalepensis Mill. with selected ectomycorrhizal fungi improves seedlingestablishment 2years after planting in a degraded gypsum soil.Mycorrhiza,18(1):23‐32.
REFERENCIAS
36
Rincón,A.,F.Valladares,T.E.GimenoyJ.J.Pueyo(2008).Waterstressresponsesof two Mediterranean tree species influenced by native soilmicroorganisms and inoculation with a plant growth promotingrhizobacterium.TreePhysiology,28(11):1693‐1701.
Rincón, A., B. P. Santamaría, L. Ocaña y M. Verdú (2014). Structure andphylogenetic diversity of post‐fire ectomycorrhizal communities ofmaritimepine.Mycorrhiza,24(2):131‐141.
Riutta, T., E. M. Slade, D. P. Bebber, M. E. Taylor, Y. Malhi, P. Riordan, D. W.Macdonald y M. D. Morecroft (2012). Experimental evidence for theinteracting effects of forest edge, moisture and soil macrofauna on leaflitterdecomposition.SoilBiologyandBiochemistry,49(0):124‐131.
Rivas‐Martínez, S. (1981). Les étages bioclimatiques de la végétation de laPéninsuleIbérique.AnalesdelJardínBotánicodeMadrid,37(2):251‐268.
Romaní,A.M.,H.Fischer,C.Mille‐LindblomyL.J.Tranvik(2006).Interactionsofbacteriaandfungiondecomposinglitter:differentialextracellularenzymeactivities.Ecology,87(10):2559‐2569.
Rotenberg,E.yD.Yakir(2010).ContributionofSemi‐AridForeststo theClimateSystem.Science,327(5964):451‐454.
Santos,T.yJ.L.Tellería(1998).Efectosdelafragmentacióndelosbosquessobrelos vertebrados de las mesetas ibéricas. Madrid, Spain, OrganismoAutónomo"ParquesNacionales".
Sardans, J. y J. Peñuelas (2005). Drought decreases soil enzyme activity in aMediterraneanQuercusilexL.forest.SoilBiologyandBiochemistry,37(3):455‐461.
Sardans,J.yJ.Peñuelas(2013).Plant‐soilinteractionsinMediterraneanforestandshrublands:impactsofclimaticchange.PlantandSoil,365(1‐2):1‐33.
Sardans,J.,J.PeñuelasyR.Ogaya(2008).ExperimentaldroughtreducedacidandalkalinephosphataseactivityandincreasedorganicextractablePinsoilina Quercus ilex Mediterranean forest. European Journal of Soil Biology,44(5–6):509‐520.
Saunders, D. A., R. J. Hobbs y C. R.Margules (1991). Biological consequences ofecosystemfragmentation:areview.ConservationBiology,5(1):18‐32.
Schimel, J. P., T. C. Balser yM. D.Wallenstein (2007).Microbial stress‐responsephysiology and its implications for ecosystem function. Ecology, 88(6):1386‐1394.
Schimel, J. P., C. Boot, P. Holden, D. Roux‐Michollet, S. Parker, S. Schaeffer y K.Treseder(2010).Enzymeactivityandadaptationindrysoil.ProceedingsoftheWorldCongressofSoilScience,19:17‐20.
Schimel, J. P., J. M. Gulledge, J. S. Clein‐Curley, J. E. Lindstrom y J. F. Braddock(1999).Moistureeffectsonmicrobialactivityandcommunitystructureindecomposing birch litter in the Alaskan taiga. Soil Biology andBiochemistry,31(6):831‐838.
Schlesinger,W.y J.Andrews(2000).Soil respirationandtheglobalcarboncycle.Biogeochemistry,48(1):7‐20.
Sierra,C.A.,S.E.Trumbore,E.A.Davidson,S.ViccayI.Janssens(2015).Sensitivityofdecompositionratesofsoilorganicmatterwithrespecttosimultaneouschanges in temperature and moisture. Journal of Advances in ModelingEarthSystems:n/a‐n/a.

CAPÍTULO1
37
Sinsabaugh, R. L., C. L. Lauber, M. N. Weintraub, B. Ahmed, S. D. Allison, C.Crenshaw,A.R.Contosta,D.Cusack,S.Frey,M.E.Gallo,T.B.Gartner,S.E.Hobbie, K. Holland, B. L. Keeler, J. S. Powers, M. Stursova, C. Takacs‐Vesbach,M.P.Waldrop,M.D.Wallenstein,D.R.ZakyL.H.Zeglin(2008).Stoichiometry of soil enzyme activity at global scale. Ecology Letters,11(11):1252‐1264.
Valladares, F., J. J. Camarero, F. Pulido y E. Gil‐Pelegrín (2004). El bosquemediterráneo, un sistema humanizado y dinámico. Ecologia del BosqueMediterráneo en un mundo cambiante. F. Valladares. Madrid, Spain,MinisteriodelMedioAmbiente:13‐25.
Valladares, F., D. Flores‐Rentería, A. Forner, T. Morán‐López y M. Díaz (2014).Influencia de la fragmentación y el clima en procesos clave para laregeneracióndelencinar.Ecosistemas,23(2):37‐47.
VanVeen,J.A.yP.J.Kuikman(1990).Soilstructuralaspectsofdecompositionoforganicmatterbymicro‐organisms.Biogeochemistry,11(3):213‐233.
Vicca,S.,S.Luyssaert,J.Peñuelas,M.Campioli,F.S.Chapin,P.Ciais,A.Heinemeyer,P. Högberg, W. L. Kutsch, B. E. Law, Y. Malhi, D. Papale, S. L. Piao, M.Reichstein, E. D. Schulze y I. A. Janssens (2012). Fertile forests producebiomassmoreefficiently.EcologyLetters,15(6):520‐526.
Wagg, C., S. F. Bender, F. Widmer y M. G. A. van der Heijden (2014). Soilbiodiversity and soil community composition determine ecosystemmultifunctionality.ProceedingsoftheNationalAcademyofSciences,USA:1‐5.
Wardle,D.A.,R.D.Bardgett,J.N.Klironomos,H.Setälä,W.H.vanderPuttenyD.H.Wall(2004).Ecological linkagesbetweenabovegroundandbelowgroundbiota.Science,304(5677):1629‐1633.
Wolff, J. O., E. M. Schauber y W. D. Edge (1997). Effects of Habitat Loss andFragmentation on the Behavior and Demography of Gray‐Tailed Voles.ConservationBiology,11(4):945‐956.
WRB,I.W.G.(2007).WorldReferenceBaseforSoilResources2006, firstupdate2007.FAO.W.S.R.Reports.Rome,Italy.103:116.
Zak,D.R.,K.S.Pregitzer,A.J.Burton,I.P.EdwardsyH.Kellner(2011).Microbialresponses to a changing environment: implications for the futurefunctioningofterrestrialecosystems.FungalEcology,4(6):386‐395.
Zheng,D., J.Chen, J.M.LeMoineyE.S.Euskirchen(2005). Influencesof land‐usechangeandedgesonsoil respiration inamanaged forest landscape,WI,USA.ForestEcologyandManagement,215(1–3):169‐182.
Zumsteg, A., E. Bååth, B. Stierli, J. Zeyer y B. Frey (2013). Bacterial and fungalcommunityresponsestoreciprocalsoiltransferalongatemperatureandsoilmoisturegradientinaglacierforefield.SoilBiologyandBiochemistry,61(0):121‐132.

Foresttr
functio
Manuscriptsu
DulceFlores‐LeticiaPérez‐
C
tfragmeree‐soilsoningin
ubmittedtoSo
‐Rentería,Ana‐Izquierdo,Fer
apítu
entationsystemaMediterforest
oilBiologyandB
Rincón,TeresrnandoVallada
lo2
indirectandmicrrraneants
Biochemistry.
aMorán‐Lópeares,JorgeCuri
tlyaffectrobialholmoa
z,Ana‐MariaHielYuste
ts
ak
Hereş,


CAPÍTULO2
41
Abstract
Landscapetransformationssuchas forest fragmentationaffect thecarbon
sinkcapacityofsoilsandtheirvulnerabilitytootherglobalchangethreats.
The adverse effects of habitat fragmentation on biodiversity are well
documented, butmuch less are known about their impact on ecosystem
processes. We studied key mechanisms and drivers of soil microbial
functioning in fragmented landscapes by analyzing soil respiration and
microbialenzymaticactivitiesinMediterraneanholmoakforestfragments
ofdifferentsizes.Forthat,weevaluatedtheimpactofforestfragmentation
onsoilmicrobialfunctioningbybuildingmodelsusingstructuralequation
models (SEM) includingbiotic (microbialbiomass),abiotic (soilmoisture,
temperature, organic matter (SOM), pH, nutrients) and tree structural
(basalarea)variables.Ourresultsindicatesthatthehigherfertilityofthose
fragmentedMediterranean forests strongly influencedby the agricultural
matrix enhances tree growth, which triggered a cascade of causal‐effect
relations that indirectly stimulated soil microbial activities and nutrient
cycling.The incrementof SOMassociatedwith treegrowth alsomodified
thepH,changedthemicroclimaticconditions(increasingsoilmoistureand
buffering temperature) and stimulated microbial growth resulting in a
significant increase in soil enzymatic activity and respiration under the
treesmost influenced by the agriculturalmatrix. Collectively, our results
revealedthattheincreasingtrendsinforestfragmentationhaveprofound
effects over the functioning of the plant‐soil‐microbial system,whit deep
impactsonthesoilcarbonandnutrientcycles.Forestfragmentationshould
therefore be considered in estimations of the carbon sink capacity under
globalchangescenarios.

FORESTFRAGMENTATIONINDIRECTLYAFFECTSTREE‐SOILSYSTEM
42
Introduction
Mediterranean forests have been intensively transformed by humans for
centuries.Amongotherhuman‐related activities that have contributed to
thistransformationtothestateweknowMediterraneanforeststoday,the
rapidand intense forest fragmentationmightbeconsideredasoneof the
most impactingones,andconsequently,a specialattentionhasbeenpaid
outto it(Aladosetal.,2004;Blondel,2010).Whilethenegativeeffectsof
forestfragmentationonbiodiversityhavebeenwidelyexplored(Saunders
etal.,1991;Fahrig,2003;FischerandLindenmayer,2007), littleresearch
hasbeenconductedonitseffectsonecosystemfunctioning(Turner,2005).
Fragmentation has important implications for forest conservation and
management strategies (Saunders et al., 1991), becoming an increasingly
important global change driver in theMediterranean basin (Millennium‐
Ecosystem‐Assessment, 2005). Forest fragmentation results in remnant
areasofnativevegetationtypicallysurroundedbyamatrixofagricultural
lands, in which solar radiation, wind, water, and temperature are
significantlyaltered(Saundersetal.,1991).Asaconsequence, the impact
of forest fragmentation on ecosystem functioning (e.g. processes such as
primaryproductivityandorganicmatterdecomposition)willdependfirst
on the environmental biotic and abiotic conditions of both the remnant
areasandthesurroundingmatrix,andsecondonthesizeof theresulting
fragments because the smaller the fragment, the greater the edge effect,
and therefore, higher the influence of the matrix in which it is imbibed
(Fernándezetal.,2002;FischerandLindenmayer,2007).
Forest fragmentation may alter the ecosystem’s functioning at
many levels, but the effects on soil processes and, in particular the ones
related to carbon cycling, are of special interest, given that soils are the
largest carbon pool in terrestrial ecosystems (Schlesinger and Andrews,
2000). This pool results from the balance between carbon inputs (i.e.

CAPÍTULO2
43
primary production, below ground allocation, litter fall) and outputs (i.e.
organic matter decomposition, soil CO2 efflux, among others) within the
system, being regulated, among other factors, by soil respiration (RS),
which is the largest ecosystem flux after gross primary productivity
(Janssens et al., 2001), and results from both heterotrophic (from the
aerobicactivityofmicroorganisms;RH)andautotrophicrespiration(roots
respiration plus associated symbiotic microorganisms; RA). Despite that
changes in RS, particularly in semi‐arid systems, can result in strong
modifications of the ecosystem source‐sink capacity, there are only few
studies that have evaluated the effect of forest fragmentation over this
important component of the terrestrial carbon cycle (Qi et al., 2002;
Baldocchi et al., 2006; Wang and Epstein, 2013). It is essential to
understand the effects of forest fragmentation on RH because it is an
importantcomponentofRS,asitaccountsforatleast50%ofthetotalsoil
respiration(Bond‐Lambertyetal.,2004).RHinvolvesmanyprocessessuch
as the break‐down of different soil organic matter (SOM) components
and/or themineralizationofdifferentessentialnutrientsby theactionof
specific extracellular enzymes, e.g. β‐glucosidase to consume labile
carbohydrates, or chitinase and phosphatase to mineralize nitrogen (N)
andphosphorous(P),respectively.Additionally,astheproximateagentsof
organicmatterdecomposition insoil (Sinsabaughetal.,2008),enzymatic
activity represents a key link in feedbacks between climate, ecosystems
andatmosphericCO2concentrations.
Soilmicrobialfunctioningissusceptibleofbeingaffectedbyforest
fragmentation,butwedonotknowtowhichextent.Forinstance,previous
studieshaveshownthatRSinfragmentedlandscapescanbemodulatedby
changes in soil temperature (Zheng et al., 2005) and water availability
(Flores‐Rentería et al., 2015), suggesting that the forest fragmentation
effectsmaystronglyinteractwiththewelldescribedeffectofclimateover
FORESTFRAGMENTATIONINDIRECTLYAFFECTSTREE‐SOILSYSTEM
44
RsandRH,especiallyinsemi‐aridecosystems(e.g.CurielYusteetal.(2007).
Ontheotherhand,ithasbeenobservedthatdifferentmicrobialenzymatic
activities at forest edges can be largely affected by differences in litter
quality and micro‐environmental conditions caused by fragmentation
(Lázaro‐Nogal et al., 2012). Slight changes within the decomposer
community across theedge‐influenceareas can lead todifferences in soil
functional properties (Malmivaara‐Lämsä et al., 2008; Riutta et al., 2012;
Flores‐Renteríaetal.,2015).Quantifyingtheeffectofforestfragmentation
over soil organic matter decomposition and CO2 emissions is, therefore,
crucial forreducingcarbonlosses fromsoilsandincreasingsequestration
ofatmosphericCO2insoil.
To evaluate the relative importance of key factors driving SOM
decomposition in fragmented landscapes, we analyzed soil microbial
functioning (i.e. enzymatic activity and Rs) in Mediterranean holm oak
forests patches of different size imbibed in an agricultural matrix and
differentially influencedby it.Weevaluatedwhether the impact of forest
fragmentationonsoilmicrobialfunctioningcouldbeexplainedthroughits
effectonmicrohabitatcharacteristics.
Our objectives were: (1) to analyze the response of the soil
microbial functioning to both the agricultural matrix in which forest
fragmentswereimbibed,andthecoverbytreecanopies;and(2)toidentify
the role and relative importance of biotic and abiotic factors in soil
microbial functioning at a landscape scale. Since holm oak forest
fragmentation has been described to favor soil nutrient’s content and
microbialbiomass(Flores‐Renteríaetal.,2015),andinviewofthelackof
studies on the effect of Mediterranean fragmented forest on soil
functioning,wehypothesizedthreepossiblenon‐mutuallyexclusivewayof
how forest fragmentation affects soil functioning (Fig. 2.1): 1) positively,
either directly and/or indirectly; 2) negatively, either directly and/or

CAPÍTULO2
45
indirectly or 3) neutral or negligible effects on soil functioning. Theway,
sign andmagnitude of the forest fragmentation effect on soil functioning
withthecurrentknowledgeisuncertain.
Figure 2.1 Hypothesized scenarios of forest fragmentation effects over soilfunction, where affects are presented by solid lines, and with the availableknowledge can be either positive (scenario 1) or negative (scenario 2); and aneutral or negligible scenario (3) the effects would not exist or would beinsignificant.
Forest fragmentation
holm oak tree size
soil abiotic factors (nutrients content,
pH, moisture)
soil biotic factors (organic matter,
microbial biomass)
soil functioning (enzymatic activity, Rs)

FORESTFRAGMENTATIONINDIRECTLYAFFECTSTREE‐SOILSYSTEM
46
Materialandmethods
Studyarea
The study areawas locatednearQuintanar de laOrden (39°30’‐39°35’N,
02°47’‐02°59’W; 870 a.s.l.), in Toledo, south‐eastern Spain (Fig. 1.4 in
Chapter 1). This area has aMesomediterranean climate characterized by
434 mm of mean annual precipitation and 14 °C of mean annual
temperature(Ninyerolaetal.,2005),withapronouncedsummerdrought,
usually lasting from July to September (Fig. 1.7 in Chapter 1). The
landscape, a former predominant holm oak Mediterranean forest, is
currentlydominatedbycerealandlegumecroplands,withscatteredgrape
crops that complete the mosaic. The original forests are now highly
fragmented in a variety of patch sizes, covering only the 28 % of their
originalarea(DíazandAlonso,2003).Thedominant tree is theholmoak
(Quercus ilex L. ssp.ballota (Desf.) Samp),while theunderstory ismainly
composedbyshrubsofKermesoak(QuercuscocciferaL.)and, toa lesser
extent,byspeciesofGenista,Asparagus,andRhamnus(forafulldescription
ofthestudyareasee:(SantosandTellería,1998;DíazandAlonso,2003).
Experimentaldesignandsampling
Atotalofthreelarge(>10ha)andfivesmall(<0.5ha;withatleastthree
trees)forestfragmentswithinanareaof1000ha,separatedofaminimum
of 50 m to a maximum of 8 km, were studied (Fig. 1.5b in Chapter 1).
Prevalent soils were Cambisols (calcics) (WRB, 2007), with sandy loam
texture(17‐39‐44%sand‐silt‐clay).
We defined the influence of the agricultural matrix on forest
fragments by the factor “matrix influence” with three levels: (1) low
influence,at the interiorof largefragments(at least30mfromthe forest
edge; coded as “forest interior”); (2)mid influence, at the edges of large
fragments (coded as “forest edge”); and (3) high influence, in small

CAPÍTULO2
47
fragments(codedas“smallfragments”;Fig.1.6inChapter1).Additionally,
the factor “tree cover” was evaluated at two levels: (1) under holm oak
canopy (halfway of the canopy, starting from the trunk; coded as “under
canopy”),and(2)outsidethecanopy(1.5moutsideanycanopyprojection;
codedas“openareas”).Foreachofthethreelargefragments,weselected
fiveholmoaktrees in the forest interiorand five treesat the forestedge,
whileforeachofthefivesmallfragmentsweselectedthreeholmoaktrees
(15 treespermatrix influence‐fragmentation level), resulting ina totalof
45 selected trees. For each of the selected trees, two coverage‐sampling
pointswere established: one under canopy and the other in open areas,
resultinginatotalof90soilsamples.
Fieldmeasurements
The field campaign was conducted in spring 2013, during the rainy and
growing season in Mediterranean ecosystems, when temperature and
moisture were not limiting factors neither for plant growth nor for soil
microbial functioning. Daily maximum temperature during the sampling
days was of 24 °C, with 15 °C in average, and no precipitation was
recorded.
Soil respiration (Rs)wasmeasured at each sampling pointwith a
portable dynamic closed chamber (SRC‐1, PP‐Systems, Massachusetts,
USA)connectedtoaninfraredgasanalyzer(EGM‐4,PP‐Systems).Thesoil
chamberwasadjustedwith90temporaryexternalPVCcollars(5cmdepth
x 10 cm diameter) inserted into the soil, which ensured a tight seal. To
minimizetheeffectsofcollar’splacing,theywereinsertedintothesoil24h
beforeRsmeasurementsonadepthof about3cm(Wanget al.,2005).Rs
measurements were carried out at maximum daily soil activity (13:30‐
16:30h)(Matíasetal.,2011),duringthreeconsecutivedays.Immediately
after Rs was measured, soil temperature and field soil moisture were
recorded at 10 cm depth by using a wireless multilogger thermometer

FORESTFRAGMENTATIONINDIRECTLYAFFECTSTREE‐SOILSYSTEM
48
(Omega, Connecticut, USA), and a time domain reflectometer (TDR 300,
Spectrumtechnologies,Illinois,USA),respectively.Then,soilcores(2cmin
diameter)weretakenfromadepthof0‐15cm.Soilsweresieved(<2mm)
andstoredat4°Cforlateranalyses.
Height,basalarea(basedonstems≥3cmofdiameter),andcanopy
projectionweremeasuredforeachofthe45selectedholmoakmulti‐stem
trees. A tree influence index was calculated for each sampling point,
accordingtothefollowingformula:
.Tree’s basal area was
selected to calculate this tree influence index, given its recognized direct
relationshipwithsoil functioning(SøeandBuchmann,2005;Katayamaet
al.,2009;Barbaetal.,2013).
Soilproperties
Soilmoisturewasdeterminedbyweightlostofsamplesoven‐driedat105
°C for 48 h. Total C and N contents were measured on air‐dried soil
samples, using a C:N elemental analyzer (Flash EA 1112 Series, Thermo
FisherScientific).TotalconcentrationsofP,K,Ca,Na,S,Mg,Fe,Mn,Cu,Mo,
and Zn were determined by digestion with HNO3 and H2O2 (4:1, v:v),
followed by inductively coupled plasma‐optical emission spectrometry
(ICAP‐6500 Duo/Iris Intrepid II XDL, Thermo Fisher Scientific,
Massachusetts, USA). Soil pH was determined on a 1:10 (w:v) aqueous
suspension.Soilorganicmatter(SOM)wasassessedbylossonignitionat
400°Cduring4hours.Microbialbiomasscarboncontentwasdetermined
bythechloroformfumigation‐extractionmethodmodifiedbyGregorichet
al.(1990).
Soilenzymaticactivity
We determined the polysaccharide‐specific hydrolytic enzymes β‐
glucosidase and chitinase, and the phosphorus‐mineralizing acid

CAPÍTULO2
49
phosphatase.Enzymatic assayswerebasedonmethylumbelliferone (MU)
(fluorogenic substrate) releaseupon cleavageby enzymes (Mathieu et al.
(2013): MU‐β‐d‐glucopyranoside (MU‐G) for β‐glucosidase (EC 3.2.1.3),
MU‐N‐acetyl‐β‐glucosaminide(MU‐Q) forchitinase(EC3.2.1.14),andMU‐
phosphatefreeacid(MU‐P)foracidphosphatase(EC3.1.3.2).Stocks5mM
enzyme solutions were prepared in methoxy‐ethanol, and enzyme
substratesweredilutedinsterileultra‐purewatertoafinalconcentration
of 800 μM forMU‐P and 500 μM forMU‐G andMU‐Q assays. Stocks and
calibrationsolutions,aswellasdilutedsubstrateswerekeptat−20 °C in
the dark. Fluorogenic assays were performed by mixing 200 μl of soil
supernatant(soilincubatedovernightwithTris‐acetatebuffer10mM,pH
4.5 in a horizontal shaker at 25 °C and 100 rpm), and 50 μl of the
correspondingsubstratewithafinalvolumeof250μlperwell,usingblack
96‐wellmicroplates.Controlswithsoilsupernatantheatedat100°Cfor10
min were also conducted separately for each sample. All reactions were
performedatroomtemperature,applyingastirringof500rpm,inthedark
andatdifferentincubationtimesdependingontheenzymatictest:15min
(MU‐P),40min(MU‐G),and60min(MU‐Q).Afterincubation,microplates
werespin(3000rpmfor3min),and100μlofthereactionmixwasadded
to 100 μl of stopping buffer (Tris 1 M, pH 10–11). Measurements were
carriedoutwithaVictor3microplate reader (Perkin‐ElmerLife Sciences,
Massachusetts, USA), at 355/460 nm excitation‐emission wavelengths.
Experimental calibrations of known MU concentrations were performed,
allowing estimating each enzymatic activity by extrapolating well
fluorescence signalson the respective calibration regression lines.Blanks
with buffer and fluorogenic substrates related to auto‐fluorescence, and
controls were subtracted from all measures. All enzymatic activities are
expressedinpmolmin−1mg−1ofdrysoil.

FORESTFRAGMENTATIONINDIRECTLYAFFECTSTREE‐SOILSYSTEM
50
Dataanalysis
All statistical analyseswereperformedbyusing SPSS® andSPSS®
AMOS20.0software’s(IBMCorporationSoftwareGroup,Somers,NY).
Prior to analyses, all variableswere tested for normality, and log
transformations were applied to meet variance homoscedasticity when
required. All data were first analyzed by two‐way Analysis of Variance
(ANOVA)consideringthefactors“matrixinfluence”(lowatforestinterior,
midatforestedgeandhighatsmallfragments),“treecover”(undercanopy
andopenareas),andtheirinteraction(datanotshown).Subsequently,and
duetothehigheffectoftreecoverfactor,fragmentationeffectswithineach
coveragelevel,aswellascoverageeffectswithineachfragmentationlevel
were separately evaluated by one‐way ANOVA. Significant differences
among treatments were determined by post‐hoc multiple comparisons
usingtheTukeyHSDtest(p<0.05).
Aprincipalcomponentanalysis(PCA)wasconductedtoreducethe
n‐dimensional of nutrient’s data into two linear axes explaining the
maximum amount of variance, and its axes latter used as new variables
(PC1 and PC2 nutrients). Linear correlations between all measured
variablesweretestedusingPearson’sr(p<0.05).
Structuralequationmodels(SEMs)wereusedtotestthedirectand
indirect influence of both biotic and abiotic factors on measured soil
microbialfunctioningvariables(β‐glucosidase,chitinase,phosphataseacid
andRs).Sincethesamplesizewasrelativelysmall(n=90),thenumberof
predictorsincludedinthemodelwasthoroughlylimited,asrecommended
by Shipley (2002). Our models considered a complete set of hypothesis
basedon literature,previousexploratoryanalyses (ANOVA, correlations),
and our own experience (Flores‐Rentería et al., 2015). Namely, we
hypothesized thatsoilmicrobial functioningwouldbedependentonboth
abiotic and biotic conditions, such as pH (Nannipieri et al., 2002;

CAPÍTULO2
51
Sinsabaughetal.,2008),SOM(SøeandBuchmann,2005;CurielYusteetal.,
2007; Sinsabaugh et al., 2008; Casals et al., 2009; Kivlin and Treseder,
2014),soilmoisture(Reichsteinetal.,2003;SardansandPeñuelas,2005;
Curiel Yuste et al., 2007; Williams and Rice, 2007; Kivlin and Treseder,
2014), C:N ratio (Martin et al., 2009; Kivlin and Treseder, 2014), and
microbial biomass (Gómez‐Luna et al., 2012), and that all these variables
wouldbeaffectedby the tree influence index (BelskyandCanham,1994;
Søe and Buchmann, 2005; Barba et al., 2013). At the same time, we
hypothesized that the microbial biomass would be affected by SOM, soil
moisture,andtheC:Nratio(Pugnaireetal.,2004;FiererandJackson,2006;
Williams and Rice, 2007; Sinsabaugh et al., 2008; Fierer et al., 2009). A
correlationbetweensoil temperatureandsoilmoisture,bothaffectingRs,
wasalsotakenintoaccount(CurielYusteetal.,2003;Matíasetal.,2012).
Additionally, we included in ourmodel causal relations and correlations
among abiotic variables, i.e. SOM influence on soil physical properties
related to soil moisture positively increasing the soil water‐holding
capacity(Abu‐Hamdeh,2001;Sinsabaughetal.,2008),andbufferinghigh
temperatures (Pugnaire et al., 2004). Several models were run and the
best‐fittedoneswerefinallyselectedaccordingtothecovarianceproximity
between observed and expected data (goodness‐of‐fit χ2). Standardized
path coefficients were estimated by using the maximum likelihood
algorithm (Shipley, 2002). The degree of fit between observed and
expectedcovariancestructureswasassessedbyrootmeansquareerrorof
approximation statistic (RMSEA) (Steiger, 1990). RMSEA values < 0.08
indicateagoodfit,between0.08to0.10provideamoderatefit,and>0.10
suggest a poor fit (Maccallum et al., 1996). Model fit to data was
additionally evaluated by the goodness‐of‐fit index (GFI) and the Bentler
andBonett’snormed‐fit index (NFI), bothwithvalues rangingbetween0
and1,andthose>0.9indicatinganacceptablefit(Iriondoetal.,2003).

FORESTFRAGMENTATIONINDIRECTLYAFFECTSTREE‐SOILSYSTEM
52
Results
Effectsoftheagriculturalmatrixontree‐soilcharacteristics
Structural characteristics of trees such as basal area, height and canopy
projectionwere significantly affected by the influence of the agricultural
matrix,withtreesbeingsignificantlythickerandtaller insmall fragments
andattheforestedgethanintheforestinterior(Fig.2.2;TableS2.1).
Figure2.2Treesize fromthreematrix influence level (low: forest interior;mid:forestedge;andhigh:smallfragment)ofholmoakforestsinSpain.Greyfilledbarsrepresenttreebasalareaandwhitebarstreeheight.Errorbarsarestandarderror.For each variable, different letters represent differences amongmatrix influencelevels(P<0.05,n=45),accordingtoTukey’spost‐hoccomparison(seeTableS2.1formoreinformation).
Soilmoisturewas significantly affected by the agriculturalmatrix
onlyinopenareas(F2,42=4.93;p=0.001),withthehighestvaluesrecorded
at forest edge (Table 2.1; Table S2.1). Soil temperature was also
significantly affected by the influence of the matrix, but contrary to soil
moisture,atforestedgeitshowedthelowestvalues,bothundercanopy(F2,
42=3.41;p=0.04)andinopenareas(F2,42=7.13;p<0.001).
Tre
e b
asal
are
a (c
m2 )
0
5
10
15
20
25
Tree heig
ht (m2)
0
5
10
15
20
25Basal area Height
a
b
a
a
a
b
Forestinterior
Forestedge
Smallfragments

CAPÍTULO2
53
Table2.1Characteristicsofsoilandtreesinfragm
entswiththreematrixinfluencelevels(low:forestinterior;m
id:forest
edge;andhigh:sm
allfragment)ofholmoakforestsinSpain.Capitallettersrepresentdifferencesam
ongtreecoverfora
givenmatrixinfluencelevel,oneway‐ANOVA(p<0.05,n=30),w
hilelowercaselettersrepresentdifferencesam
ongmatrix
influenceforagiventreecover(undercanopyoropenareas),oneway‐ANOVA(p<0.05,n=45).Dataaremeans±standard
error.
U
nd
er c
ano
py
O
pen
are
as
F
ore
st i
nte
rio
r F
ore
st e
dg
e S
mal
l fr
agm
en
ts
F
ore
st i
nte
rio
r F
ore
st e
dg
e S
mal
l fr
agm
en
ts
Mic
robi
al b
iom
ass
(mg
C k
g -1
) 11
70.
7 ±
4.9a
,A
157
6.3
± 5.
9a,A
243
8.0
±12
.7a,
A
63
5.4
± 3.
6a,B
810
.9 ±
4.3
a,B
769.
0 ±
4.8a,
B
Soi
l moi
stur
e (%
) 13
.4 ±
0.5
a,A
15
.5 ±
0.7
a,A
19.0
± 0
.9a
,A
7.
2 ±
0.3
b,B
10.3
± 0
.5a,
B
8.4
± 0.
4ab,B
Fie
ld s
oil
mo
istu
re (
%)
9.0
± 0.
5 a,
A
10.3
± 0
.6a,
A
11.4
± 0
.6a
,A
7.
6 ±
0.4
a,A
9.4
± 0.
5 a,
A
7.3
± 0.
4 a,
B
Soi
l tem
pera
ture
(ºC
) 18
.8 ±
0.3
a,B
17
.6 ±
0.3
b,B
18.1
± 0
.3ab
,B
26
.1 ±
0.4
a,A
22
.7 ±
0.5
b,A
26.3
± 0
.4 a,
A
pH
8.0
± 0.
1 a,
B
8.0
± 0.
1a,B
7.9
± 0
.1a,
B
8.
2 ±0
.1a,
A
8.2
± 0.
1a,A
8.2
± 0
.1a,
A
Soi
l org
ani
c m
atte
r (%
) 7.
7 ±
0.5a
,A
9.9
± 0.
5a,A
16.1
± 1
.0a
,A
3.
5 ±
0.3a,
B
4.4
± 0.
4a,B
4.7
± 0
.5a,
B
C:N
rat
io
10.4
± 0
.5a
,A
9.0
± 0.
3a,A
9.5
± 0
.4a,
A
9.
9 ±
0.5a,
A
9.3
± 0.
4a,A
9.7
± 0
.5a,
A
Tre
e in
fluen
ce in
de
x 31
8.1
± 3.
1b,A
603.
3 ±4
.2 a,
A
572.
6 ±
4.9a
,A
10
9.1
± 1.
8b,B
239
.2 ±
2.8
a,B
219.
0 ±
3.1a,
B

FORESTFRAGMENTATIONINDIRECTLYAFFECTSTREE‐SOILSYSTEM
54
AsdrawnbyplottingthetwofirstPCAcomponents(Fig.2.3),both
factors, agricultural matrix and tree cover, independently influenced soil
nutrientvariabilitywithhigheramountsofC,NandPandothercations,in
smallfragmentsandatforestedgethanintheforestinterior(PC1,Fig.2.3),
andaclearenrichmentofnutrients,especiallyofN,CandP,undercanopy
(PC2,Fig.2.3).
Figure 2.3 Principal Component Analysis (PCA) of soil nutrients (scores andeigenvectors)fromthreelevelsofmatrixinfluence(low:forestinterior;mid:forestedge; and high: small fragment) of holm oak forests in Spain. Tree cover isrepresented by different colors: grey = under canopy (UC); white = open areas(OA). Soil provenances are represented by different symbols: squares = forestinterior of large fragments (Fi); circles = forest edge of large fragments (Fe);triangles=smallfragments(Sf).Errorbarsrepresentstandarderror.
PC1 (44.42%)
-3 -2 -1 0 1 2 3 4
PC
2 (
25.
91%
)
-3
-2
-1
0
1
2
3
UC-FiUC-FeUC-SfOA-FiOA-FeOA-Sf
Organic C
Total C
Total NP
K
Ca
Mg
Cu
FeMn
Mo
Na
S
Zn
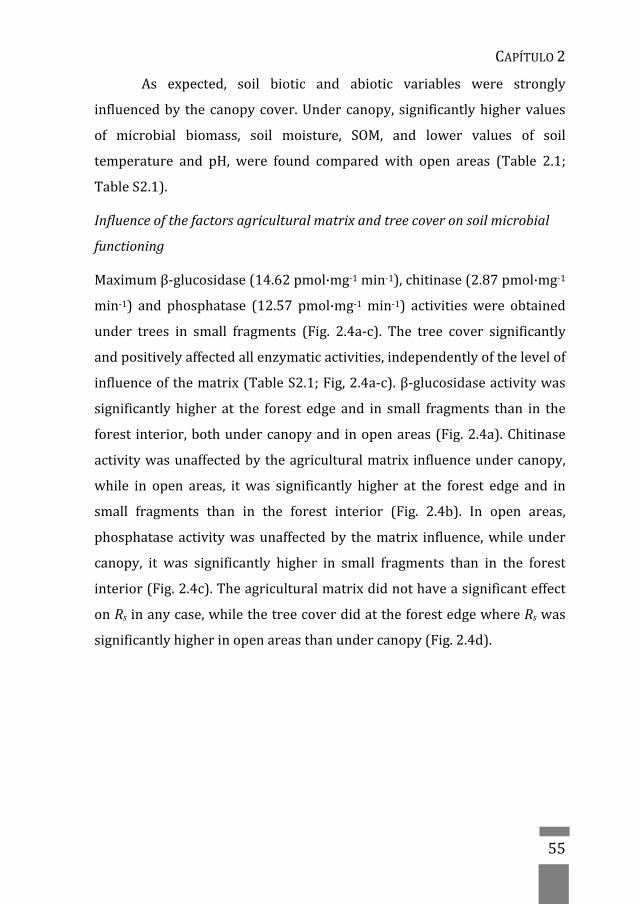
CAPÍTULO2
55
As expected, soil biotic and abiotic variables were strongly
influencedby thecanopycover.Undercanopy,significantlyhighervalues
of microbial biomass, soil moisture, SOM, and lower values of soil
temperature and pH, were found compared with open areas (Table 2.1;
TableS2.1).
Influenceofthefactorsagriculturalmatrixandtreecoveronsoilmicrobial
functioning
Maximumβ‐glucosidase(14.62pmol·mg‐1min‐1),chitinase(2.87pmol·mg‐1
min‐1) and phosphatase (12.57 pmol·mg‐1min‐1) activitieswere obtained
under trees in small fragments (Fig. 2.4a‐c). The tree cover significantly
andpositivelyaffectedallenzymaticactivities,independentlyofthelevelof
influenceofthematrix(TableS2.1;Fig,2.4a‐c).β‐glucosidaseactivitywas
significantly higher at the forest edge and in small fragments than in the
forest interior,bothundercanopyandinopenareas(Fig.2.4a).Chitinase
activitywasunaffectedbytheagriculturalmatrix influenceundercanopy,
while in open areas, it was significantly higher at the forest edge and in
small fragments than in the forest interior (Fig. 2.4b). In open areas,
phosphataseactivitywasunaffectedby thematrix influence,whileunder
canopy, it was significantly higher in small fragments than in the forest
interior(Fig.2.4c).Theagriculturalmatrixdidnothaveasignificanteffect
onRsinanycase,whilethetreecoverdidattheforestedgewhereRswas
significantlyhigherinopenareasthanundercanopy(Fig.2.4d).
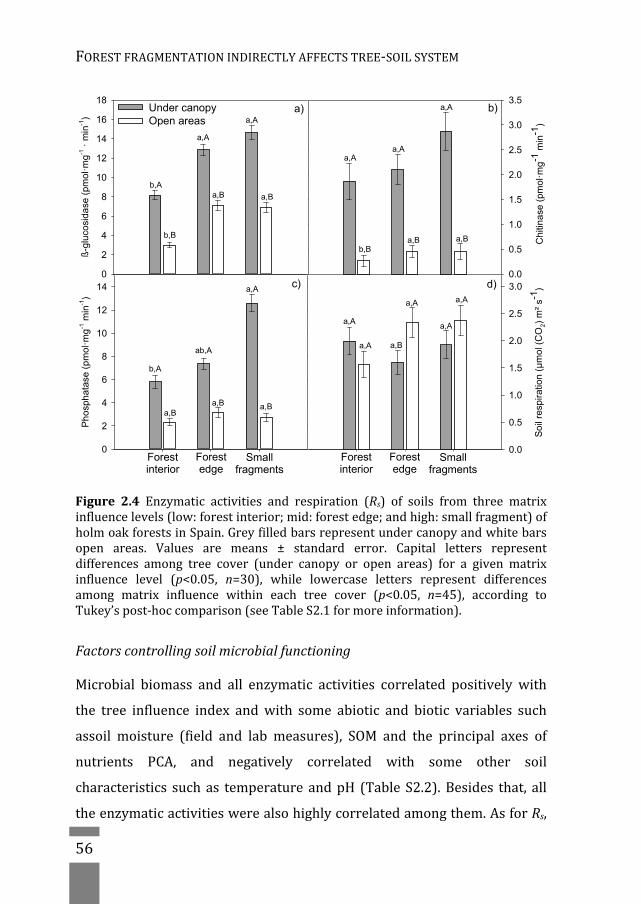
FORESTFRAGMENTATIONINDIRECTLYAFFECTSTREE‐SOILSYSTEM
56
Figure 2.4 Enzymatic activities and respiration (Rs) of soils from three matrixinfluencelevels(low:forestinterior;mid:forestedge;andhigh:smallfragment)ofholmoakforestsinSpain.Greyfilledbarsrepresentundercanopyandwhitebarsopen areas. Values are means ± standard error. Capital letters representdifferences among tree cover (under canopy or open areas) for a given matrixinfluence level (p<0.05, n=30), while lowercase letters represent differencesamong matrix influence within each tree cover (p<0.05, n=45), according toTukey’spost‐hoccomparison(seeTableS2.1formoreinformation).
Factorscontrollingsoilmicrobialfunctioning
Microbial biomass and all enzymatic activities correlated positively with
the tree influence index andwith some abiotic and biotic variables such
assoil moisture (field and lab measures), SOM and the principal axes of
nutrients PCA, and negatively correlated with some other soil
characteristics suchas temperature andpH (TableS2.2).Besides that, all
theenzymaticactivitieswerealsohighlycorrelatedamongthem.AsforRs,
ß-g
luco
sida
se (
pmol
·mg-1
· m
in-1
)
0
2
4
6
8
10
12
14
16
18
Ph
osph
atas
e (p
mo
l·mg-1
min
-1)
0
2
4
6
8
10
12
14
Ch
itina
se (
pmol
·mg-1
min
-1)
0.0
0.5
1.0
1.5
2.0
2.5
3.0
3.5a)
b,A
a,A
a,A
b,B
a,B a,B
c)a,A
ab,A
b,A
a,Ba,Ba,B
So
il re
spir
atio
n (
µm
ol (
CO
2) m
² s-1
)
0.0
0.5
1.0
1.5
2.0
2.5
3.0
Under canopyOpen areas
d)
b)
a,Aa,A
a,A
a,Ba,Bb,B
a,A
a,A
a,B
a,A
a,Aa,A
Forestinterior
Forestedge
Smallfragments
Forestinterior
Forestedge
Smallfragments

CAPÍTULO2
57
it was solely correlated with β‐glucosidase, the enzyme more directly
relatedtotheCcycle(TableS2.2).
Anoverviewoftheproposedgeneralfittedmodel(Figs.2.5and2.6)
showedthat,asexpected,andaccordingtopreviousANOVA’sresults, the
agricultural matrix exerted a strong positive influence over the tree
influenceindex(treebasaldiameterweightedbythedistance).Ingeneral,
trees significantly and directly influenced many different soil properties
suchasSOMamount,soilpHandmicrobialbiomass;however,treeshadno
direct influenceonothervariablessuchas soilmoistureorC:Nratio that
were rather indirectly affected via SOM (Figs. 2.5 and 2.6). SOM directly
affectedsoilmoistureandC:Nratio,butalsopHandmicrobialbiomass.In
addition, theamountofmicrobialbiomasswasdirectly influencedbysoil
moistureandC:Nratio,butnotbypH(Figs.2.5and2.6).
The structural‐equation model proposed for enzymatic activities
(Fig.2.5a),providedagoodfitforallenzymes(Fig.2.5),asindicatedbythe
non‐significant f value (χ2 = 7.72; p = 0.46) and by the goodness‐of‐fit
indices (RMSEA < 0.001; NFI and GFI > 0.98). Direct significant effects
differedamongenzymaticactivities(Fig.2.5;TableS2.3).Amongthethree
enzymesunderstudy,theagriculturalmatrixexertedastrong,positiveand
direct effect only over β‐glucosidase activity (Fig. 2.5b; Table S2.3). The
agriculturalmatrixhadindirecteffectsoverallenzymaticactivities,i.e.via
its positive effect over trees (tree influence index directly affecting β‐
glucosidase and chitinase activities, Fig. 2.5b and c), or over variables
affectedby trees (i.e.microbialbiomass, soilpH).Specifically, treeshada
stronganddirecteffectonpHaffectingallenzymaticactivities(Fig.2.5b,c
and d), and on microbial biomass, which in turn directly affected β‐
glucosidaseandphosphataseactivities(Fig.2.5bandd).

FORESTFRAGMENTATIONINDIRECTLYAFFECTSTREE‐SOILSYSTEM
58
Figure2.5Pathdiagramsrepresentinghypothesizedcausal relationshipsamongthe agriculturalmatrix influence, biotic and abiotic variables and soil enzymaticactivities.(a)Generalfittedmodel,andindividualmodelsfor(b)β‐glucosidase,(c)chitinase,and(d)phosphataseacidactivities.Arrowsdepictcausalrelationships:positive effects are indicatedby solid lines, andnegative effectsbydashed lines,withnumbersindicatingstandardizedestimatedregressionweights(SRW).Arrowwidthsareproportionaltosignificancevaluesaccordingtothelegend.Pathswithcoefficientsnon‐significant areomitted (seemore information inTable S2.2). Fitstatisticsofthemodel(NFI,GFIandRMSEA)andsamplesize(n)aregivenforallproposedmodels.
NFI= 0.98; GFI= 0.98; RMSEA<0.001; χ2= 7.72; p= 0.46; n=90
b)
Matrix influence
C:N
Microbial biomass
Glucosidase
SOM
Soil moisture
Tree influence
pH
0.244
0.468
0.257
0.754
0.876
0.486
0.186
0.251
0.161
0.19
0.2080.280
0.242
0.195
Glucosidase
R2= 0.74d)
Matrix influence
C:N
Microbial biomass
Enzymatic activty
SOM
Soil moisture
Tree influence
pH
0.244
0.468
0.257
0.754
0.876
0.486
0.195
0.186
0.251
0.161
0.229
0.306
0.194
Phosphatase
R2= 0.48
c)
Matrix influence
C:N
Microbial biomass
Enzymatic activty
SOM
Soil moisture
Tree influence
pH
0.244
0.468
0.257
0.754
0.876
0.486
0.186
0.251
0.161
0.166
0.255
0.369
0.195
p<0.0010.001<p<0.010.01<p<0.050.05<p<0.1 Chitinase
R2= 0.69
Enzymatic activity
Matrix influence
C:N
Microbial biomass
SOM
Soil moisture
Tree influence
pH
a)

CAPÍTULO2
59
Figure 2.6 (a) General Path Model, and (b) model fitted for soil respiration,representinghypothesizedcausalrelationshipsamongmatrixinfluence,bioticandabioticpredictorsandsoilrespiration.Arrowsdepictcausalrelationships:positiveand negative effects are indicated by solid and dashed lines respectively, withnumbers indicating standardized estimated regression weights (SRW). Arrowwidthsareproportionaltopvaluesaccordingtothelegend.Pathswithcoefficientsnon‐significantareomitted (seemore information inTableS2.2).Fit statisticsofthemodel (NFI,GFIandRMSEA)andsamplesize (n)aregiven for theproposedmodel.
Matrix influence
C:N
Microbialbiomass
Soil respiration
SOM
Field soil moisture
Tree influence
Soil temperature
pH
a)
Matrix influence
C:N
Microbial biomass
Soilrespiration
SOM
Field soil moisture
Tree influence
Soil temperature
pH
0.244
0.468
0.612
0.257
0.161
0.486
0.166
0.186
0.251
0.876
0.550
0.192
0.173
0.290.26
0.507
p<0.0010.001<p<0.010.01<p<0.050.05<p<0.1
NFI= 0.97; GFI= 0.97; RMSEA<0.001; χ2= 10.74; p= 0.55; n=90; R2= 0.181
b)
0.33

FORESTFRAGMENTATIONINDIRECTLYAFFECTSTREE‐SOILSYSTEM
60
Contrarilytothatweaprioriexpected,SOMquantitydidnotaffect
directlyanyenzymaticactivity(Fig.2.5b‐d),althoughsomeindirectpaths
were observed, i.e. through its effect on microbial biomass affecting β‐
glucosidase and phosphatase activity, through its effect on soil moisture
affecting chitinase activity (Fig. 2.5c), and through its effect on C:N ratio
affectingphosphataseactivity(Fig.2.5d).
Thestructural‐equationmodelproposedforRs(Fig.2.6a)provided
a lowbut significant goodness of fit of the data (Fig. 2.6b), denoted by a
lower coefficient of determinationwith respect to those obtained for the
threeenzymaticactivities,asignificantRMSEA(<0.001),highNFIandGFI
values (>0.97), and a non‐significant f value (χ2 = 10.74; p = 0.55).
Consistent and significantly positive effects of soil temperature, field soil
moistureandtreeinfluenceindexwereobservedonRs,withthestrongest
effectcausedbysoiltemperature(TableS2.3;Fig.2.6b).Contrarilytowhat
wefirstproposed(Fig.2.6a),RswasnotdirectlyaffectedbySOM,C:Nratio,
pH, microbial biomass, or agricultural matrix influence (Fig. 2.6b).
Nevertheless, indirect effects of the agricultural matrix over Rs were
observed through its positive effect on soil temperature, and on the tree
influence, which on its turn, positively affected soil moisture via SOM
(indirect effect), and negatively affected soil temperature (direct effect)
(Fig. 2.6b). As expected, soil temperature and moisture were negatively
correlated(Fig.2.6b).

CAPÍTULO2
61
Discusion
Effectofforestfragmentationonsoilfunctioning
The rangeofvaluesof the soil functionalvariablesmeasured (e.g.
enzymaticactivitiesandsoilrespiration)weresimilartothosereportedin
otherMediterraneanecosystems(Joffreetal.,2003;SardansandPeñuelas,
2005;WaldropandFirestone,2006;Barba et al., 2013;Gómez‐Reyet al.,
2013; Pérez‐Izquierdo et al., 2014). Overall, the surrounding agricultural
matrix favored the accumulation of N, C, P, S and Ca in soils from small
fragments and edges of large fragments, in agreement with previous
findings (Flores‐Rentería et al., 2015). This fertilization effect of the
agriculturalmatrixinthesmallfragmentsandedgesoflargefragmentswas
mainly associated to a significant increase of the size of the trees. The
effectsofagriculturalmatrixontreesizecouldhaveresultedfromthehigh
resource (nutrients, water and/or light) availability, leading to enhanced
net primary productivity and increased carbon sequestration through an
stimulationofthephotosyntheticcapacityoftrees(Reichsteinetal.,2014).
The higher nutrient availability could be explained by the enhanced
enzymaticactivityand/orbythepossiblerunoffoffertilizerfromadjacent
areas(BoutinandJobin,1998).Whilewecannotdiscardotherfactors(e.g.
management,lowertreecompetition)toexplainthehighersizeoftreesin
smallfragmentsandatforestedgescomparedwithforestinteriors,similar
patterns found in holm oak fragmented forest in the northern plateau of
theIberianPeninsula(i.e.height,basaldiameterandcanopycover;Santos
andTellería,1998)confirmthestrongrelationbetweenfragmentationand
treesize.
FORESTFRAGMENTATIONINDIRECTLYAFFECTSTREE‐SOILSYSTEM
62
Unlike tree growth,whichwas clearly and strongly influenced by
the agriculturalmatrix, onlyoneout of the three enzymes (β‐glucosidase
activity) was, at some extent, directly and positively influenced by the
agricultural matrix, independently of the tree cover. Based on the large
differences in nutrient availability observed in the principal components
analysis,thefertilizationeffectoftheagriculturalmatrixovertheactivityof
these enzymes was minor than expected, taking into account the strong
effectthatnutrientshaveoverthecapacityofmicrobestodecomposeSOM
(Malmivaara‐Lämsäetal.,2008;Gómez‐Lunaetal.,2009;Baldrian,2014).
Collectively,ourresultsshowedthat thepositiverelationof forest
fragmentationwithmicrobialenzymaticactivitieswasmainlymediatedby
the changes in micro‐environmental conditions observed under trees
influenced by the agricultural matrix. Structural Modeling Equations
further indicated that thenet effect of forest fragmentationonenzymatic
activities was dependent on a complex cascade of direct and indirect
interconnectedcausal‐effectsrelations.Forinstance,thehigheramountof
SOMunder the larger treesof small fragmentsand forestedges (i.e.with
high agricultural matrix influence) indirectly and positively influenced
microbial enzymatic activity by directly improvingwater availability and
increasingmicrobialbiomass.
Tree size and closenesswas also themain controller ofRs,which
integrates not only microbial (heterotrophic) but also plant (roots,
autotrophic) metabolic activity. Indeed, the most important factors
explainingthevariabilityofRswerethemicro‐environmental(temperature
andmoisture)conditions,whichwerealsostronglyanddirectlyinfluenced
bytrees.Additionally,theobserveddirectinfluenceofthetreeoverRs,that
has been previously reported in similar ecosystems (Matías et al., 2012;
Barbaetal.,2013),mightbepartiallyattributed,amongotherthings,tothe
strong influence of tree closeness over root respiration (Tang and

CAPÍTULO2
63
Baldocchi, 2005). Nonetheless, and despite the fact that the observed
controlswereverymuchinagreementwiththoseobservedforratesofkey
enzymes activities, the capacity of the designed models to explain the
spatial variation of Rs was very limited with respect to the predicted
variabilityobtainedforthoseenzymaticactivities(18%,versus48‐74%of
thevariability,respectively).ThisisprobablybecauseRsaccountsformany
biologicalcomponents(notonlymicrobesandroots,butalsomycorrhizas)
controlled by different variables (Heinemeyer et al., 2007), which can
greatly hinder the spatial interpretation of this flux (Søe and Buchmann,
2005;Barbaetal.,2013).
Trees strongly influenced by the agricultural matrix, therefore,
were also responsible for modifying their surrounding edaphic
environmentbyimprovingtheSOMaccretion,increasingtheavailabilityof
nutrients and the capacity of soils to retain water, further buffering soil
temperature, and hence decreasing water evaporation rates (Belsky and
Canham,1994;HastwellandMorris,2013).Tootherrecentstudieswhich
also found a strong influence of the canopy cover on the microbial
functioning,infragmentedhabitats(Lázaro‐Nogaletal.,2012;Riuttaetal.,
2012)ourstudyaddsamechanisticdimension,showinghowtheeffectof
forest fragmentation over soil activity results from a cascade of causal‐
effectrelationstriggeredbyitspositiveeffectovertreegrowth.Sinceit is
wellknownthattreessuppliestothesoilmicrobialcommunitieswiththe
necessary organic substrates (i.e. organicmatter, litter, root exudates) to
grow(SchlesingerandAndrews,2000;DakoraandPhillips,2002;Baldrian,
2014) studies should take into account the complexity of the plant‐soil
interactionsinordertounderstandpossibleeffectsofforestfragmentation
overtheecologyandfunctioningofsoilmicrobialcommunities.
FORESTFRAGMENTATIONINDIRECTLYAFFECTSTREE‐SOILSYSTEM
64
Interactionoffactorsdirectlyandindirectlycontrollingsoilfunctioning
Structuralequationmodelleavesusimportantcluesaboutthecause‐effect
relationshipsandcontrolsoverthefunctioningofmicrobialcommunityin
these fragmented environments. SEM shows that, as already discussed
above,treesexerted,directlyorindirectly,thestrongestcontrolovermost
ofthesoilabioticandbioticvariables(i.e.soilpH,SOM,microbialbiomass)
measured, indirectlyaffectingthemeasured indicatorsofsoil functioning.
However,treesalsoinfluenceddirectlythoseindicatorsofsoilfunctioning
most closely related to the cycling of carbohydrates. Indeed, Rs and β‐
glucosidase, were directly influenced by the closest tree, which could
reflect in both cases the positive effect of root exudates on themicrobial
capacitytodecomposeSOM(primingeffect;(Kuzyakovetal.,2000;Dakora
andPhillips,2002;Kuzyakov,2010).
The strong control of trees over pH appeared to have also
important implications for soil processes and specifically for microbial
activity, since it was the only environmental factor directly affecting all
three enzymatic activities. This observation reinforces the idea that
microbialactivitiesaregenerallyverysensitivetoevensmallvariationsin
soilpH(BååthandAnderson,2003;FiererandJackson,2006;Sinsabaugh
et al., 2008; Legay et al., 2014). Soil pH can modify the active site
conformation of enzymes, so that various enzyme isoforms can
differentially perform in terms of efficiency at different pHs
(Frankenberger and Johanson, 1982). The net effect of tree size and
closeness over pH was negative (acidification) which could be mainly
associatedwiththehigherSOMaccumulationandhencetheaccumulation
ofhumicacids,ortheacidifiereffectthathasbeenlargelyattributedtothe
rhizospheric environment (Dakora and Phillips, 2002). As a result, we
could expect thatwith an increasing influence of the agriculturalmatrix,

CAPÍTULO2
65
the pH differences between open areas and under tree canopywould be
increasinglyintensified.
Another important fact drawn from our models were the
mechanisms behind the influence of SOM amount over soil microbial
functioning. Although the amount of SOM has generally been strongly
correlatedwith rates ofmicrobial enzymatic activities (Sinsabaugh et al.,
2008;Burnsetal.,2013;Baldrian,2014),SEMs indicated that this strong
effect was mainly indirect, through increasing microbial biomass and
moistureavailability,anddecreasingC:NratioandsoilpH.
SEMsalsoshedlightonthecontrolsofthedifferentsoilmetabolic
pathwaysrepresentedbythethreedifferentenzymeschosenforthisstudy.
For instance, the observed negative effect of C:N (associated with more
SOMaccumulation)overphosphatasemayrespondtothealreadyobserved
inhibition of this enzymatic activity, associated with the acquisition of
mineral forms of phosphate, when available N in soil decreases as C
accumulates (Kivlin and Treseder, 2014). Moreover, microbial biomass,
whichwasindirectlycontrolledbytreesizeandproximity(treeinfluence
index)throughSOMproduction,showedthestrongestdirectandpositive
effectoverratesofβ‐glucosidaseandphosphataseactivities(Sinsabaughet
al.,2008;Nannipierietal.,2011)buthadnoeffectoverchitinase,whichis
usuallyassociatedwith fungalbiomass(Baldrian,2008;Sinsabaughetal.,
2008; Kivlin and Treseder, 2014), rather than with overall microbial
biomass(Šnajdretal.,2008).

FORESTFRAGMENTATIONINDIRECTLYAFFECTSTREE‐SOILSYSTEM
66
Conclusion
Our study emphasizes that forest fragmentation exerts important
alterationson tree‐soil‐microbial interactions and soil functioning. Forest
fragmentationpositivelyaffects treegrowthand forestproductivity(SOM
accumulation),inducingchangesinbothabiotic(microclimateandpH)and
biotic(stimulationofmicrobialgrowth)conditionsthatultimatelyimprove
the conditions for microbial enzymatic activity. The increment of SOM
associated with tree growth also modified the pH, changed the
microclimatic conditions (increasing soil moisture and buffering
temperature) and stimulated microbial growth resulting in a significant
increase in soil enzymatic activity and respiration under the trees most
influencedbytheagriculturalmatrix.Collectively,ourresultsshowedthat
theholmoak forest fragmentationwithasurroundingagriculturalmatrix
have profound effects over the functioning of the plant‐soil‐microbial
system,speciallyonitseffectsonthesoilcarbonandnutrientcycles.Forest
fragmentationshould,therefore,beconsideredinestimationsofthecarbon
sinkcapacityunderglobalchangescenarios.

CAPÍTULO2
67
References
Abu‐Hamdeh, N. H. (2001). Soil and water: measurement of the thermalconductivity of sandy loam and clay loam soils using single and dualprobes.JournalofAgriculturalEngineeringResearch,80(2):209‐216.
Alados, C. L., Y. Pueyo, O. Barrantes, J. Escós, L. Giner and A. B. Robles (2004).Variationsinlandscapepatternsandvegetationcoverbetween1957and1994 ina semiaridMediterraneanecosystem.LandscapeEcology,19(5):543‐559.
Bååth,E.andT.H.Anderson(2003).Comparisonofsoilfungal/bacterialratiosinapHgradientusingphysiologicalandPLFA‐based techniques.SoilBiologyandBiochemistry,35(7):955‐963.
Baldocchi, D., J. Tang and L. Xu (2006). How switches and lags in biophysicalregulators affect spatial‐temporal variationof soil respiration in an oak‐grasssavanna.JournalofGeophysicalResearch:Biogeosciences,111(G2):G02008.
Baldrian, P. (2008). Chapter 2 Enzymes of saprotrophic basidiomycetes. BritishMycological Society Symposia Series. J. C. F. Lynne Boddy andW. Pietervan,AcademicPress.Volume28:19‐41.
Baldrian, P. (2014). Distribution of extracellular enzymes in soils: spatialheterogeneity and determining factors at various scales. Soil ScienceSocietyofAmericaJournal,78(1):11‐18.
Barba, J., J.CurielYuste, J.Martínez‐VilaltaandF.Lloret(2013).Drought‐inducedtree species replacement is reflected in the spatial variability of soilrespiration in a mixed Mediterranean forest. Forest Ecology andManagement,306(0):79‐87.
Belsky, A. J. and C. D. Canham (1994). Forest gaps and isolated savanna trees.BioScience,44(2):77‐84.
Blondel,J.(2010).TheMediterraneanregion:biologicaldiversitythroughtimeandspace.Oxford,UK,OxfordUniversityPress.
Bond‐Lamberty,B.,C.WangandS.T.Gower(2004).Aglobalrelationshipbetweentheheterotrophicandautotrophiccomponentsofsoilrespiration?GlobalChangeBiology,10(10):1756‐1766.
Boutin,C.andB. t. Jobin(1998). Intensityofagriculturalpracticesandeffectsonadjacenthabitats.EcologicalApplications,8(2):544‐557.
Burns,R.G., J. L.DeForest, J.Marxsen,R.L. Sinsabaugh,M.E. Stromberger,M.D.Wallenstein, M. N. Weintraub and A. Zoppini (2013). Soil enzymes in achanging environment: current knowledge and future directions. SoilBiologyandBiochemistry,58:216‐234.
Casals,P.,C.Gimeno,A.Carrara,L.Lopez‐SangilandM.Sanz(2009).SoilCO2effluxand extractable organic carbon fractions under simulated precipitationevents in aMediterraneandehesa. SoilBiologyandBiochemistry, 41(9):1915‐1922.
CurielYuste,J.,D.D.Baldocchi,A.Gershenson,A.Goldstein,L.MissonandS.Wong(2007). Microbial soil respiration and its dependency on carbon inputs,soiltemperatureandmoisture.GlobalChangeBiology,13(9):2018‐2035.

FORESTFRAGMENTATIONINDIRECTLYAFFECTSTREE‐SOILSYSTEM
68
CurielYuste,J., I.A.Janssens,A.Carrara,L.MeiresonneandR.Ceulemans(2003).Interactiveeffectsoftemperatureandprecipitationonsoilrespirationinatemperatemaritimepineforest.TreePhysiology,23(18):1263‐1270.
Dakora, F. and D. Phillips (2002). Root exudates as mediators of mineralacquisitioninlow‐nutrientenvironments.PlantandSoil,245(1):35‐47.
Díaz,M. and C. L. Alonso (2003).WoodmouseApodemus sylvaticus winter foodsupply:density,condition,breeding,andparasites.Ecology,84(10):2680‐2691.
Fahrig,L.(2003).Effectsofhabitatfragmentationonbiodiversity.AnnualReviewofEcology,EvolutionandSystematics,34(1):487‐515.
Fernández, C., F. J. Acosta,G.Abellá, F. López andM.Díaz (2002). Complex edgeeffect fields as additive processes in patches of ecological systems.EcologicalModelling,149(3):273‐283.
Fierer,N.andR.B.Jackson(2006).Thediversityandbiogeographyofsoilbacterialcommunities. Proceedings of the National Academy of Sciences, USA,103(3):626‐631.
Fierer,N.,M. S. Strickland,D. Liptzin,M.A. Bradford andC. C. Cleveland (2009).Global patterns in belowground communities. Ecology Letters, 12(11):1238‐1249.
Fischer, J. and D. B. Lindenmayer (2007). Landscape modification and habitatfragmentation:asynthesis.GlobalEcologyandBiogeography,16:265‐280.
Flores‐Rentería, D., J. Curiel Yuste, A. Rincón, F. Brearley, J. García‐Gil and F.Valladares(2015).Habitatfragmentationcanmodulatedroughteffectsontheplant‐soil‐microbialsysteminMediterraneanholmoak(Quercus ilex)forests.MicrobialEcology:1‐15.
Frankenberger,W.T.andJ.B.Johanson(1982).EffectofpHonenzymestabilityinsoils.SoilBiologyandBiochemistry,14(5):433‐437.
Gómez‐Luna,B.E.,M.C.Rivera‐Mosqueda,L.Dendooven,G.Vázquez‐MarrufoandV.Olalde‐Portugal(2009).CharcoalproductionatkilnsitesaffectsCandNdynamics and associated soilmicroorganisms inQuercus spp. temperateforestsofcentralMexico.AppliedSoilEcology,41(1):50‐58.
Gómez‐Luna,B.E.,G.M.d.l.L.Ruiz‐Aguilar,G.Vázquez‐Marrufo,L.DendoovenandV.Olalde‐Portugal(2012).EnzymeactivitiesandmetabolicprofilesofsoilmicroorganismsatKILNsitesinQuercusspp.temperateforestsofcentralMexico.AppliedSoilEcology,52(0):48‐55.
Gómez‐Rey,M.,M.Madeira,S.Gonzalez‐PrietoandJ.Coutinho(2013).SoilCandNdynamics in a Mediterranean oak woodland with shrub encroachment.PlantandSoil,371(1‐2):339‐354.
Gregorich,E.G.,G.Wen,R.P.VoroneyandR.G.Kachanoski(1990).Calibrationofarapid direct chloroform extractionmethod for measuring soil microbialbiomassC.SoilBiologyandBiochemistry,22(7):1009‐1011.
Hastwell,G.T.andE.C.Morris(2013).Structuralfeaturesoffragmentedwoodlandcommunities affect leaf litter decomposition rates. Basic and AppliedEcology,14(4):298‐308.
Heinemeyer,A.,I.P.Hartley,S.P.Evans,J.A.CarreiraDeLaFuenteandP.Ineson(2007). Forest soil CO2 flux: uncovering the contribution andenvironmental responses of ectomycorrhizas. Global Change Biology,13(8):1786‐1797.

CAPÍTULO2
69
Iriondo,J.M.,M.a.J.AlbertandA.Escudero(2003).Structuralequationmodelling:an alternative for assessing causal relationships in threatened plantpopulations.BiologicalConservation,113(3):367‐377.
Janssens,I.A.,H.Lankreijer,G.Matteucci,A.S.Kowalski,N.Buchmann,D.Epron,K.Pilegaard,W.Kutsch,B.Longdoz,T.Grünwald,L.Montagnani,S.Dore,C.Rebmann,E. J.Moors,A.Grelle,Ü.Rannik,K.Morgenstern, S.Oltchev,R.Clement, J.Guðmundsson, S.Minerbi,P.Berbigier,A. Ibrom, J.Moncrieff,M.Aubinet,C.Bernhofer,N.O.Jensen,T.Vesala,A.Granier,E.D.Schulze,A.Lindroth,A. J.Dolman,P.G. Jarvis,R.CeulemansandR.Valentini(2001).Productivityovershadowstemperatureindeterminingsoilandecosystemrespiration across European forests. Global Change Biology, 7(3): 269‐278.
Joffre,R.,J.‐M.Ourcival,S.RambalandA.Rocheteau(2003).Thekey‐roleoftopsoilmoistureonCO2effluxfromaMediterraneanQuercusilexforest.AnnalsofForestScience,60(6):519‐526.
Katayama, A., T. Kume, H. Komatsu, M. Ohashi, M. Nakagawa, M. Yamashita, K.Otsuki,M.SuzukiandT.o.Kumagai (2009).Effectof forest structureonthe spatial variation in soil respiration in a Bornean tropical rainforest.AgriculturalandForestMeteorology,149(10):1666‐1673.
Kivlin, S. N. and K. K. Treseder (2014). Soil extracellular enzyme activitiescorrespondwithabioticfactorsmorethanfungalcommunitycomposition.Biogeochemistry,117(1):23‐37.
Kuzyakov,Y.(2010).Primingeffects:Interactionsbetweenlivinganddeadorganicmatter.SoilBiologyandBiochemistry,42(9):1363‐1371.
Kuzyakov, Y., J. K. Friedel and K. Stahr (2000). Review of mechanisms andquantification of priming effects. Soil Biology and Biochemistry, 32(11–12):1485‐1498.
Lázaro‐Nogal, A., S. Matesanz, T. Gimeno, A. Escudero and F. Valladares (2012).Fragmentationmodulates the strong impact of habitat quality and plantcover on fertility andmicrobial activity of semiarid gypsum soils. PlantandSoil,358(1‐2):213‐223.
Legay,N.,C.Baxendale,K.Grigulis,U.Krainer,E.Kastl,M.Schloter,R.D.Bardgett,C.Arnoldi,M.Bahn,M.Dumont,F.Poly,T.Pommier, J.C.ClémentandS.Lavorel (2014). Contributionof above‐ andbelow‐groundplant traits tothestructureandfunctionofgrasslandsoilmicrobialcommunities.AnnalsofBotany.
Maccallum,R. C.,M.W.Browne andH.M. Sugawara (1996). Power analysis anddetermination of sample size for covariance structure modeling.PsychologicalMethods,1(2):130‐149.
Malmivaara‐Lämsä,M.,L.Hamberg,E.Haapamäki,J.Liski,D.J.Kotze,S.Lehvävirtaand H. Fritze (2008). Edge effects and trampling in boreal urban forestfragments – impacts on the soil microbial community. Soil Biology andBiochemistry,40(7):1612‐1621.
Martin, J.G.,P.V.Bolstad,S.‐R.RyuandJ.Chen(2009).Modelingsoil respirationbased on carbon, nitrogen, and root mass across diverse Great Lakeforests.AgriculturalandForestMeteorology,149(10):1722‐1729.
Mathieu,Y.,E.Gelhaye,S.Dumarçay,P.Gérardin,L.HarvengtandM.Buée(2013).Selection and validation of enzymatic activities as functionalmarkers in

FORESTFRAGMENTATIONINDIRECTLYAFFECTSTREE‐SOILSYSTEM
70
wood biotechnology and fungal ecology. Journal of MicrobiologicalMethods,92(2):157‐163.
Matías,L.,J.CastroandR.Zamora(2011).Soil‐nutrientavailabilityunderaglobal‐change scenario in aMediterraneanmountain ecosystem.Global ChangeBiology,17(4):1646‐1657.
Matías, L., J. CastroandR.Zamora (2012).Effectof simulated climate changeonsoil respiration in a Mediterranean‐type ecosystem: rainfall and habitattype are more important than temperature or the soil carbon pool.Ecosystems,15(2):299‐310.
Millennium‐Ecosystem‐Assessment (2005). Ecosystems and Human Well‐being:Synthesis.Washington,DC,IslandPress.
Nannipieri, P., L. Giagnoni, L. Landi and G. Renella (2011). Role of phosphataseenzymes in soil. Phosphorus in Action. E. Bünemann, A. Oberson and E.Frossard,SpringerBerlinHeidelberg.26:215‐243.
Nannipieri, P., E. Kandeler and P. Ruggiero (2002). Enzyme activities andmicrobiological and biochemical processes in soil. Enzymes in theenvironment:activity,ecologyandapplications..R.G.BurnsandR.P.Dick.NewYork,CRCPress.86:1‐33.
Ninyerola, M., X. Pons and J. M. Roure. (2005). Atlas climático digital de laPenínsula Ibérica. Metodología y aplicaciones en bioclimatología ygeobotánica.Fromhttp://www.opengis.uab.es/wms/iberia/index.htm.
Pérez‐Izquierdo, L., M. Zabal‐Aguirre, S. C. González‐Martínez, M. Buée and A.Rincón(2014).ContrastedfunctioningoffungalcommunititesinforestsoftwoMediterraneanpinespecies.MedPine5Congress.Solsona,Spain.
Pugnaire,F.I.,C.ArmasandF.Valladares(2004).Soilasamediatorinplant‐plantinteractions in a semi‐arid community. Journal of Vegetation Science,15(1):85‐92.
Qi,Y.,M.Xuand J.Wu(2002).Temperaturesensitivityofsoil respirationand itseffects on ecosystem carbon budget: nonlinearity begets surprises.EcologicalModelling,153(1–2):131‐142.
Reichstein, M., M. Bahn, M. D. Mahecha, J. Kattge and D. D. Baldocchi (2014).Linkingplantandecosystemfunctionalbiogeography.ProceedingsoftheNationalAcademyofSciences.
Reichstein,M.,A.Rey,A.Freibauer,J.D.Tenhunen,R.Valentini,J.Banza,P.Casals,Y. Cheng, J. M. Grünzweig, J. Irvine, R. Joffre, B. E. Law, D. Loustau, F.Miglietta,W.Oechel,J.M.Ourcival,J.S.Pereira,A.Peressotti,F.Ponti,Y.Qi,S.Rambal,M.Rayment,J.Romanya,F.Rossi,V.Tedeschi,G.Tirone,M.XuandD.Yakir(2003).Modelingtemporalandlarge‐scalespatialvariabilityofsoilrespirationfromsoilwateravailability,temperatureandvegetationproductivityindices.GlobalBiogeochemicalCycles,17(4):15‐11.
Riutta, T., E. M. Slade, D. P. Bebber, M. E. Taylor, Y. Malhi, P. Riordan, D. W.Macdonald and M. D. Morecroft (2012). Experimental evidence for theinteracting effects of forest edge, moisture and soil macrofauna on leaflitterdecomposition.SoilBiologyandBiochemistry,49(0):124‐131.
Santos, T. and J. L. Tellería (1998). Efectos de la fragmentación de los bosquessobre los vertebradosde lasmesetas ibéricas.Madrid, Spain,OrganismoAutónomo"ParquesNacionales".

CAPÍTULO2
71
Sardans, J. and J. Peñuelas (2005). Drought decreases soil enzyme activity in aMediterraneanQuercusilexL.forest.SoilBiologyandBiochemistry,37(3):455‐461.
Saunders,D.A.,R.J.HobbsandC.R.Margules(1991).Biologicalconsequencesofecosystemfragmentation:areview.ConservationBiology,5(1):18‐32.
Schlesinger,W.andJ.Andrews(2000).Soilrespirationandtheglobalcarboncycle.Biogeochemistry,48(1):7‐20.
Shipley,B.(2002).Causeandcorrelationinbiology:auser'sguidetopathanalysis,structural equations and causal inference. Cambridge, UK, CambridgeUniversityPress.
Sinsabaugh, R. L., C. L. Lauber, M. N. Weintraub, B. Ahmed, S. D. Allison, C.Crenshaw,A.R.Contosta,D.Cusack,S.Frey,M.E.Gallo,T.B.Gartner,S.E.Hobbie, K. Holland, B. L. Keeler, J. S. Powers, M. Stursova, C. Takacs‐Vesbach, M. P. Waldrop, M. D. Wallenstein, D. R. Zak and L. H. Zeglin(2008). Stoichiometry of soil enzyme activity at global scale. EcologyLetters,11(11):1252‐1264.
Šnajdr,J.,V.Valášková,V.r.Merhautová,J.Herinková,T.CajthamlandP.Baldrian(2008). Spatial variability of enzyme activities andmicrobial biomass inthe upper layers of Quercus petraea forest soil. Soil Biology andBiochemistry,40(9):2068‐2075.
Søe, A. R. B. and N. Buchmann (2005). Spatial and temporal variations in soilrespiration in relation to stand structure and soil parameters in anunmanagedbeechforest.TreePhysiology,25(11):1427‐1436.
Steiger, J. H. (1990). Structural Model Evaluation and modification: an intervalestimationapproach.MultivariateBehavioralResearch,25(2):173‐180.
Tang,J.andD.D.Baldocchi(2005).Spatial–temporalvariationinsoilrespirationinan oak–grass savanna ecosystem in California and its partitioning intoautotrophicandheterotrophiccomponents.Biogeochemistry,73:183‐207.
Turner,M.G.(2005).LandscapeEcology:whatisthestateoftheScience?AnnualReviewofEcology,EvolutionandSystematics,36(1):319‐344.
Waldrop, M. P. and M. K. Firestone (2006). Seasonal dynamics of microbialcommunity composition and function in oak canopy andopen grasslandsoils.MicrobialEcology,52(3):470‐479.
Wang, J. andH. Epstein (2013). Estimating carbon source‐sink transition duringsecondarysuccessioninaVirginiavalley.PlantandSoil,362(1):135‐147.
Wang,W.J.,Y.G.Zu,H.M.Wang,T.Hirano,K.Takagi,K.SasaandT.Koike(2005).EffectofcollarinsertiononsoilrespirationinalarchforestmeasuredwithaLI‐6400soilCO2fluxsystem.JournalofForestResearch,10(1):57‐60.
Williams,M.A.andC.W.Rice(2007).Sevenyearsofenhancedwateravailabilityinfluencesthephysiological,structural,andfunctionalattributesofasoilmicrobialcommunity.AppliedSoilEcology,35(3):535‐545.
WRB,I.W.G.(2007).WorldReferenceBaseforSoilResources2006, firstupdate2007.FAO.W.S.R.Reports.Rome,Italy.103:116.
Zheng,D.,J.Chen,J.M.LeMoineandE.S.Euskirchen(2005).Influencesofland‐usechangeandedgesonsoil respiration inamanaged forest landscape,WI,USA.ForestEcologyandManagement,215(1–3):169‐182.

FORESTFRAGMENTATIONINDIRECTLYAFFECTSTREE‐SOILSYSTEM
72
Supplementarymaterial
TableS2.1Treecover(n=45)andmatrixinfluence(n=30)effectsinsoilbioticandabioticpropertiesandtreecharacteristics,ofHolmoakforestfragments inSpain(one‐way ANOVA). Significant effects (p < 0.05) are noted in bold. MI = Matrixinfluence.C=treecover.Rs=soilrespiration.SOM=soilorganicmatter.PC1andPC2=firstandsecondcomponentofPrincipalComponentAnalysis,respectively.
Under
canopyOpen areas
Forest interior
Forest edge
Small fragments
MI MI C C C β-glucosidase F 6.53 13.80 57.34 14.40 17.11 p <0.001 <0.001 <0.001 <0.001 <0.001
Chitinase F 1.99 4.53 8.37 12.25 39.00 p 0.15 0.02 0.01 <0.001 <0.001
Phosphatase F 5.79 0.42 56.85 36.70 64.97 p 0.01 0.66 <0.001 <0.001 <0.001
Rs F 0.84 2.89 1.70 4.81 1.34 p 0.44 0.07 0.20 0.04 0.26
Microbial biomass F 2.42 1.47 31.65 28.15 13.83 p 0.10 0.24 <0.001 <0.001 <0.001
Soil moisture F 1.27 4.93 35.62 4.57 19.52 p 0.29 0.01 <0.001 0.04 <0.001
Field soil moisture F 0.77 3.07 2.18 0.33 5.75 p 0.47 0.06 0.15 0.57 0.02
Soil temperature F 3.41 7.13 129.08 23.97 120.26 p 0.04 <0.001 <0.001 <0.001 <0.001
pH F 0.75 1.19 12.89 7.50 7.78 p 0.48 0.31 <0.001 0.01 0.01
SOM F 1.81 0.89 28.99 21.93 14.62 p 0.18 0.42 <0.001 <0.001 <0.001
C:N F 0.98 0.15 0.09 0.17 0.01 p 0.38 0.86 0.77 0.68 0.94
PC1 Nutrients F 22.54 25.62 0.61 0.22 0.26 p <0.001 <0.001 0.44 0.64 0.61
PC2 Nutrients F 2.02 0.82 14.94 8.49 14.69 p 0.15 0.45 <0.001 0.007 <0.001
Tree basal area F 8.79 - - - - p <0.001 - - - -
Tree height (m) F 10.09 - - - - p <0.001 - - - -
Tree canopy F 12.02 - - - - p <0.001 - - - -
Tree influence index F 5.08 5.80 29.01 23.77 12.58 p 0.01 0.01 <0.001 <0.001 <0.001

CAPÍTULO2
73
Rs
(1)
(2)
(3)
(4)
(5)
(6)
(7)
(8)
(9)
(10)
(11)
(12)
β-g
luco
sida
se (
pmol
min−
1m
g− 1)
(1)
0.23
*
Chi
tinas
e (p
mol
min−
1m
g− 1)
(2)
0.13
0.78
**
Pho
spha
tase
(pm
ol m
in−
1m
g− 1)
(3)
0.09
0.69
**0.
56**
Mic
robi
al b
iom
ass
(mg
C k
g -1
)(4
)0.
080.
76**
0.72
**0.
62**
Soi
l moi
stur
e (%
) (5
)0.
200.
66**
0.74
**0.
48**
0.70
**
Fie
ld s
oil m
oist
ure
(%)
(6)
0.19
0.42
**0.
45**
0.22
*0.
46**
0.83
**
Soi
l tem
pera
ture
(ºC
) (7
)0.
12-0
.51**
-0.6
4**
-0.3
7**-0
.53**
-0.6
1**
-0.4
0**
pH (8
)-0
.07
-0.6
2**
-0.5
7**-0
.59**
-0.6
3**-0
.55*
*-0
.36*
*0.
33**
SO
M (%
) (9
)0.
160.
75**
0.74
**0.
59**
0.78
**0.
79**
0.56
**-0
.57*
*-0
.76*
*
C:N
(10)
0.08
-0.0
5-0
.01
-0.1
5-0
.05
0.13
0.27
*-0
.10
-0.0
50.
21*
PC
1 N
utrie
nts
(11)
0.18
0.37
**0.
25*
0.18
0.21
*0.
10-0
.08
-0.0
6-0
.14
0.19
-0.1
7
PC
2 N
utrie
nts
(12)
0.17
0.69
**0.
64**
0.57
**0.
72**
0.79
**0.
62**
-0.4
9**-0
.72**
0.92
**0.
12-0
.006
Tre
e in
fluen
ce in
dex
(m/c
m2)
0.08
0.58
**0.
56**
0.25
*0.
49**
0.44
**0.
2-0
.67*
*-0
.16
0.47
**0.
020.
35**
0.34
**
TableS2.2Pearson’scorrelationsofsoilandtreecharacteristicsinfragmentswiththreematrixinfluencelevelsofHolmoak
forestsinSpain(n=90).Significanteffectsarenotedinbold(*p<0.05;**p<0.001).Rs=soilrespiration(µm
ol(CO
2)m²s‐1 ).
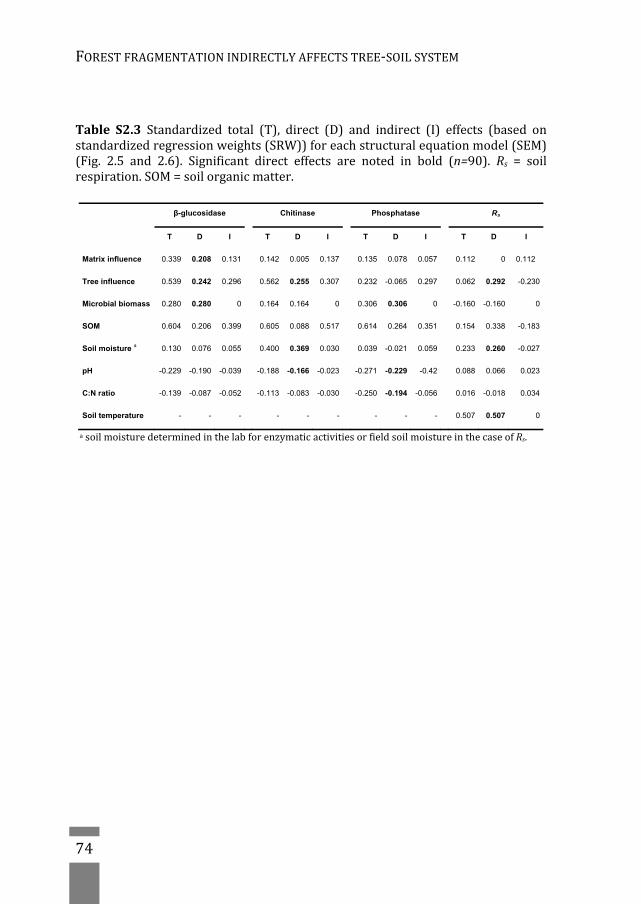
FORESTFRAGMENTATIONINDIRECTLYAFFECTSTREE‐SOILSYSTEM
74
Table S2.3 Standardized total (T), direct (D) and indirect (I) effects (based onstandardizedregressionweights(SRW))foreachstructuralequationmodel(SEM)(Fig. 2.5 and 2.6). Significant direct effects are noted in bold (n=90). Rs = soilrespiration.SOM=soilorganicmatter.
β-glucosidase Chitinase Phosphatase Rs
T D I T D I T D I T D I
Matrix influence 0.339 0.208 0.131 0.142 0.005 0.137 0.135 0.078 0.057 0.112 0 0.112
Tree influence 0.539 0.242 0.296 0.562 0.255 0.307 0.232 -0.065 0.297 0.062 0.292 -0.230
Microbial biomass 0.280 0.280 0 0.164 0.164 0 0.306 0.306 0 -0.160 -0.160 0
SOM 0.604 0.206 0.399 0.605 0.088 0.517 0.614 0.264 0.351 0.154 0.338 -0.183
Soil moisture a 0.130 0.076 0.055 0.400 0.369 0.030 0.039 -0.021 0.059 0.233 0.260 -0.027
pH -0.229 -0.190 -0.039 -0.188 -0.166 -0.023 -0.271 -0.229 -0.42 0.088 0.066 0.023
C:N ratio -0.139 -0.087 -0.052 -0.113 -0.083 -0.030 -0.250 -0.194 -0.056 0.016 -0.018 0.034
Soil temperature - - - - - - - - - 0.507 0.507 0
asoilmoisturedeterminedinthelabforenzymaticactivitiesorfieldsoilmoistureinthecaseofRs.

Capítulo3
AgriculturalmatrixdirectlyaffectsthestructureandindirectlythemetabolismofmicrobialcommunitiesinfragmentedMediterraneanholmoakforestsoils
Manuscriptinpreparation


CAPÍTULO3
77
Abstract
Given the increasing fragmentation of forest in theMediterranean basin,
understandingits impactsovertheecologyofsoilmicrobialcommunities,
responsibleformanyecosystemfunctions,andtheircapacitytometabolize
differentsubstratesfromsoilorganicmatter,isofupmostimportance.We
evaluatedhowtheinfluenceoftheagriculturalmatrix,asoneofthemain
consequencesofforestfragmentation,mayaffectboththecompositionand
the functioningof soilmicrobial communities inMediterraneanholmoak
forests.Wedeterminedstructuraland functionalalphaandbeta‐diversity
ofmicrobialcommunities,aswellasmicrobialassemblagesandmetabolic
profiles, by using a commonly used fingerprinting technique (Denaturing
GelGradientElectrophoresis)andacommunitylevelphysiologicalprofiles
technique (EcoPlate). The complex plant‐soil‐microbial connections, and
keydriversofsoilmicrobialstructureandmetabolismwereevaluatedby
using structural equation models (SEM) and multivariate ordination
(envfit) approaches. Our results indicated that forest fragmentation may
exert an important, but opposite in sign, effect over local (alpha) and
landscape (beta) structural and functional diversity of microbial
communities suggesting that mechanisms and processes involved in the
influence of fragmentation over the ecology of these communities were
strongly scale‐dependent. Both SEM andmultivariate analyses confirmed
thecomplexitybehindtheeffectofforestfragmentationovertheecologyof
microbial communities and the functioning of the plant‐soil‐microbial
system. The observed consistent relation between the structure and
functional diversity of microbial communities further showed the
importantrolethatthediversityandassemblageofmicrobialcommunities
might have over their functioning. Together, our results suggest that the
forest fragmentation can affect the microbial communities through the
complex interactions with the plant‐soil system; affecting the nutrient
cyclingandfunctioningifforestsoils.

DIRECTANDINDIRECTEFFECTSOFAGRICULTURALMATRIX
78
Introduction
In the Mediterranean basin, forest fragmentation, resource
overexploitation, and poor management are the main drivers of forest
degradation(FAO,2011).Littleresearchhasbeenconductedtounderstand
the effects of forest fragmentation on ecosystem functioning (Turner,
2005), despite the fact that it has important implications for forest
conservationandmanagementstrategies(Saundersetal.,1991),aswellas
for ecosystem functioning, particularly taking into account its strong
impact on the plant‐soil‐microbial system (Flores‐Rentería et al., 2015).
Withinthisframework,microbesarecriticalfordrivingecosystemnutrient
cycling,providingplantswith thenecessarynutrients togrow.Moreover,
bacteria and fungi are responsible for about 90% of all organic matter
decomposition (McGuire and Treseder, 2010; Ushio et al., 2013), and at
least 50% of all CO2 globally emitted from soils (Bond‐Lamberty et al.,
2004).However,veryfewstudieshavebeendesignedtounderstandhow
forest fragmentation may affect the functioning of these microbial
communities(Flores‐Renteríaetal.,2015).
Disturbanceisgenerallydetrimentaltosoilbiodiversity,especially
in agro‐ecosystems (Walker, 2012). However, depending on the
disturbance regime, changes in spatial environmental heterogeneity
associated with fragmentation have been linked to either increases or
decreases insoilbiodiversity (Rantalainenetal.,2005;Flores‐Renteríaet
al.,2015).Forexample,studiesonforestfragmentationeffectsonmicrobial
community structure have shownmodest changes (Malmivaara‐Lämsä et
al., 2008; Flores‐Rentería et al., 2015) or no changes (Rantalainen et al.,
2005) in species composition. On the contrary, forest fragmentation can
affect the functioning ofmicrobial communities, as previously showed in
Chapter2andotherstudies (Malmivaara‐Lämsäetal.,2008;Riuttaetal.,
2012; Flores‐Rentería et al., 2015). Furthermore, while it is often

CAPÍTULO3
79
hypothesized that diversity is important for the maintenance of soil
processes, and that reductions in the richness of soil microbial
communities will disrupt the functional capability of soils (Giller et al.,
1997;Wagg et al., 2014),we are just beginning to address this question,
andtheresultspresentedsofardrawcontradictoryconclusions(Griffiths
et al., 2000; O'Donnell et al., 2001; Bell et al., 2005; Langenheder et al.,
2010; Levine et al., 2011; Curiel Yuste et al., 2014; Tardy et al., 2014;
Mendes et al., 2015). More knowledge about microbial diversity and its
function is therefore required for current and future predictions of
ecosystemfunctioning inachangingworld;muchmoreempiricalwork is
needed to define the functional consequences, at the ecosystem scale, of
changesinmicrobialcompositionandtheirresponsestodisturbancesand
globalchange.
Diversity measurement is particularly challenging for microbial
communities (Hughes et al., 2001; Koleff et al., 2003; Magurran, 2004;
LozuponeandKnight,2008;Haegemanetal.,2013).Commonly,microbial
diversityhasbeencharacterizedasthediversitywithinagivencommunity
(alpha‐ diversity) generally using the total number of operational
taxonomic units (OTU’s richness), their relative abundances (Shannon
diversity), or indices that combine these two dimensions (evenness).
Studies have generally used microbial alpha‐diversity to explore the
relationshipsbetweenstructureandfunctioningofmicrobialcommunities
(e.g.CurielYusteetal.,2011),whereasbeta‐diversity,whichanalyses the
biological diversity among communities along environmental gradients
(Koleff et al., 2003; Lozupone and Knight, 2008; Maaß et al., 2014), has
been probably less studied for these communities. However, patterns of
microbialcommunitystructureanddiversityatthelandscapescaleandin
perturbation gradients may also add info on co‐occurrence ‐examining
which organisms sometimes or never occur together‐, that may help us

DIRECTANDINDIRECTEFFECTSOFAGRICULTURALMATRIX
80
understandingwhich conditionspreferordonotprefer (Fuhrman,2009;
Rincónetal.,2014).Severalecologicalprocessespotentiallycontributeto
changes in co‐occurrence patterns at the landscape scale, including
competition, habitat filtering, historical effects and neutral processes
(Horner‐Devineetal.,2007;Maaßetal.,2014).
In this study, we used a molecular fingerprinting technique,
Denaturing Gradient Gel Electrophoresis (DGGE), to characterize the
structureofmicrobial communities (bacteria and fungi) coupledwith the
community level physiological profiles, using BiologTM EcoPlates, as
indicatorofmicrobialfunctioning,inordertoevaluatetheinfluenceofthe
agricultural matrix, as one of the main consequences of forest
fragmentation,onsoilmicrobialecology(i.e.structureandfunctioning)in
fragmentedMediterraneanholmoakforests.Moreprecisely,weevaluated
if the impact of forest fragmentation on the capacity of soil microbial
communities tometabolize different substrates (metabolic profile) could
beexplainedthroughitseffectsonmicrobialstructure(assemblage,alpha
andbetadiversity)and/or changes inmicrohabitat characteristics.Based
onpreviousstudies,weherehypothesizedthattheagriculturalmatrixwill
exertstrongdirect(viachangesinnutrientavailability)andindirect(viaits
influence over tree growth) effects over the microbial community
structure, as well as over its capacity tometabolize different substrates.
Secondly, we hypothesized that the metabolic activity of soil microbial
communities will be largely influenced by the structure of these
communities.Specifically,ourobjectiveswere:(1)toanalyzetheresponse
ofstructuraland functionaldiversityofsoilmicrobialcommunities to the
agricultural matrix influence; (2) to understand which biotic and abiotic
factors associated with fragmentation (i.e. matrix influence) affect this
diversity;and(3)toanalyzecausalrelationsbetweenmicrobialcommunity
structureanditscapacitytometabolizedifferentsubstrates.

CAPÍTULO3
81
Materialandmethods
Studyarea
The study area is located near Quintanar de la Orden (39°30’‐39°35’N,
02°47’‐02°59’W; 870 a.s.l.), in Toledo, southeastern Spain (Fig. 1.4 in
Chapter 1). This area has aMesomediterranean climate characterized by
434 mm of mean annual precipitation and 14 °C of mean annual
temperature, respectively (Ninyerola et al., 2005), with a pronounced
summerdrought,usuallylastingfromJulytoSeptember(Fig.1.7inChapter
1).Thelandscape,aformerpredominantholmoakMediterraneanforest,is
currentlyhighlyfragmentedandsurroundedbyactivecroplandsofcereals
and legumes, with scattered grape crops that complete the mosaic. The
original forestsareinavarietyofpatchsizes,coveringonly28%oftheir
originalarea(DíazandAlonso,2003).Thedominant tree is theholmoak
(Quercus ilex L. ssp. ballota (Desf.) Samp; Fagaceae),with the understory
mainly composed by shrubs of Kermes oak (Quercus coccifera L.) and
scatteredGenista,Asparagus,andRhamnusspecies(forafulldescriptionof
thestudyareasee:(SantosandTellería,1998;DíazandAlonso,2003).
Experimentaldesignandsampling
Atotalofthreelarge(>10ha)andfivesmall(<0.5ha;withatleastthree
trees)forestfragmentswithinanareaof1000ha,separatedofaminimum
of 50m and amaximum of 8 km,were studied (Fig. 1.5b in Chapter 1).
Prevalent soils were Cambisols (calcic) (WRB, 2007), with sandy loam
texture(17‐39‐44%sand‐silt‐clay).
We defined the influence of the agricultural matrix on forest
fragments by the factor “matrix influence” with three levels: (1) low
influence,at the interiorof largefragments(at least30mfromthe forest
edge; coded as “forest interior”); (2)mid influence, at the edges of large
fragments (coded as “forest edge”); and (3) high influence, in small

DIRECTANDINDIRECTEFFECTSOFAGRICULTURALMATRIX
82
fragments(codedas“smallfragments”;Fig.1.6inChapter1).Additionally,
the factor “tree cover” was evaluated at two levels: (1) under holm oak
canopy (halfway of the canopy, starting from the trunk; coded as “under
canopy”),and(2)outsidethecanopy(1.5moutsideanycanopyprojection;
codedas“openareas”).Foreachofthethreelargefragments,weselected
fiveholmoaktrees in the forest interiorand five treesat the forestedge,
and three trees at five small fragments (15 trees per matrix influence‐
fragmentation level), resulting in a total of 45 selected trees. For each
selected tree, two coverage‐sampling pointswere established: one under
canopyandtheotherinopenareas,resultinginatotalof90soilsamples.
Height,basalareaandcanopyprojectionweremeasuredforeachof
the 45 holm oak multi‐stem trees. A tree influence index (Tii) was
calculated at each sampling point, according to the formula:
(Chapter 2). The basal areawas selected to calculate
this tree influence indexgiven its recognizeddirect relationshipwith soil
functioning (Barba et al., 2013; see Chapter 2). Soil moisture was
determinedbyweightlostofsamplesoven‐driedat105°Cfor48h.TotalC
and N contents were measured on air‐dried soil samples, using a C:N
elementalanalyzer(FlashEA1112Series,ThermoFisherScientific).Total
concentrations of P, K, Ca, Na, S, Mg, Fe, Mn, Cu, Mo, and Zn were
determined by digestion with HNO3 + H2O2 (4:1, v:v), followed by
inductively coupled plasma‐optical emission spectrometry (ICAP‐6500
Duo/Iris Intrepid II XDL, Thermo Fisher Scientific, Massachusetts, USA).
SoilpHwasdeterminedona1:10(w:v)aqueoussuspension.Soilorganic
matter(SOM)wasassessedbylossonignitionat400°C,during4hours.
Soilcommunitystructure
Thestructureofsoilbacterialandfungalcommunitieswasassessedbythe
DNA community fingerprinting technique of denaturing gradient gel

CAPÍTULO3
83
electrophoresis(DGGE).SoilDNAwasextractedwiththeMoBioPowersoil
DNA isolation kit (Solana Beach, USA), and yields assessed by
electrophoresis at 80 V on a 1.2 % agarose gel. The universal primers
338F/518R were used for amplification of the bacterial 16S rRNA gene
(Muyzeretal.,1993). In thecaseof fungi, the internal transcribedspacer
nrDNAregionITS‐1wasPCR‐amplifiedusingtheprimerpairITS1‐F/ITS2
(GardesandBruns,1993).AGCclampwasrespectivelyaddedtothe5’end
of forward bacterial (338F) and fungal (ITS1‐F) primers to stabilize the
melting behavior of theDNA fragments (Muyzer et al., 1993). PCRswere
carried out on a Mastercycler® gradient Thermocycler (Eppendorf,
Germany),with 50 μl final volume containing 10xNH4 reaction buffer, 2
and 1.5 mM MgCl2 (for fungi and bacteria, respectively), 0.2 mM total
dNTPs,2.5UTaq(Bioline,London,UK),1μMofeachprimer,0.5μlof10mg
ml‐1bovineserumalbumin(BSA)and50ngoftemplateDNA,determined
usingaNanoDrop1000(ThermoScientific,USA).PCRcyclingparameters
were:94°Cfor5min,followedby35cyclesof94°Cfor30s,55°Cfor30
or45s(fungiorbacteria,respectively),and72°Cfor30or45s(fungior
bacteria),withafinalextensionat72°Cfor5or10min(fungiorbacteria,
respectively).Negativecontrols(containingnoDNA)wereincludedineach
PCRrun.
DGGE was carried out on a DCode universal mutation detection system
(Bio‐Rad, Hemel Hempstead, UK), using 10% polyacrilamide gels, with
denaturanturea‐formamidegradientsof10‐50%forfungi(Andersonetal.,
2003) and 30‐60% for bacteria (Grossman et al., 2010), with the
concentrations of 7 M urea and 40 % formamide (v/v) for the 100 %
denaturant.Electrophoreseswererunat60°C75Vfor16h,loadingequal
volumesofamplifiedDNA.GelswerestainedwithSYBRGoldnucleicacid
stain(MolecularProbes,TheNetherlands).DGGEfingerprintprofileswere
digitized and analyzed using a Kodak DC290 zoom digital camera with
DIRECTANDINDIRECTEFFECTSOFAGRICULTURALMATRIX
84
KODAK1DImageAnalysissoftware(Kodak,NY,USA).Bandswereadjusted
withaGaussianmodelwithaprofilewidthof80%.Noisewaseliminated
byremovingbandsbelowa10%bandpeakintensitythreshold.Eachband
oftheDGGEprofilewashereafterreferredtoasanoperationaltaxonomic
unit(OTU).Gelbandswereanalyzedbyusinginternalreferencebands,and
known reference markers loaded in lanes at either side of the gel. The
numberandpixelintensityofbandsinaparticularsamplewereconsidered
comparative proxies of richness and relative abundance of fungal or
bacterialOTUs,respectively(Clearyetal.,2012).SimilaranalysisofDGGE
bandingpatternshavebeenpreviouslyusedinotherstudies(Andersonet
al., 2003; Gafan et al., 2005; Cleary et al., 2012; Suzuki et al., 2012; Vaz‐
Moreiraetal.,2013;Flores‐Renteríaetal.,2015).
Microbialmetabolicprofile
Community level physiological profiles (CLPP) of cultivable microbial
communities (bothbacteria and fungi, thosenot inhibitedby tetrazolium
dye)weredeterminedwithBiolog™EcoPlates(BIOLOGInc.,Hayward,CA).
Fromhere,wedefine“metabolicprofile”astheidentityandabundanceof
the substrates that microbial communities were able to metabolize,
measured either by qualitative (presence/absence) or quantitative
(abundance) approaches.We used the procedure adapted from (Garland
andMills, 1991). Briefly, 4 g (dryweight equivalent) of each soil sample
wasaddedto36mlofsterile0.8%salinesolution(NaCl).Themixturewas
then shaken on an orbital shaker for 20 min, and left to stand at room
temperature,for30min.Avolumeof250μlsupernatantwasdilutedinto
24.75mlof sterile salinesolution.Only in thecaseof fungalplates,25μl
streptomycin and 25 μl tetracycline (dilution 1:1000,w:v, in both cases)
were added to 24.7 ml of sterile saline solution to limit the bacterial
growth.Supernatantdilutionsweremixedfor30sandlefttostandfor10
min.A100μlaliquotofeachdilutedsolutionwasaddedtoeachof96wells

CAPÍTULO3
85
in a Biolog™ EcoPlates (arranged by triplicate for each substrate). Plates
were incubated at 28 °C in a humidity‐saturated environment. Color
formation in eachwellwasmonitored atmonochromatic light (590 nm)
absorbanceusingaVictor3microplatereader(Perkin‐ElmerLifeSciences,
Massachusetts,USA).Measurementswereperformedonceperdayduring
7 and 10 days for bacterial and fungal plates, respectively. A single time
point absorbancewas used to all posterior analyses at 96 and 168 h for
bacterialandfungalplates,respectively,whentheasymptotewasreached
(data not shown). Optical density (absorbance) value from each well,
corrected by subtracting the blank well (inoculated, but without a
substrate), was normalized by the color summation of the entire plate.
Subsequently,weaveraged the threevalues for each individual substrate
withinaplate.TheEcoPlatessystemhasbeenrecognizedasauseful tool
for comparingmicrobial communities (Classen et al., 2003; Gomez et al.,
2004;Weberetal.,2007;WeberandLegge,2009;Frącetal.,2012),sinceit
can detect functional changes in microbial communities as a result of
differing carbon availability in soil, its physiological basis has been
consideratetoprovideanecologicallyrelevantoverviewaslongasresults
are interpretedasaprofileofphenotypicpotentialandnot in termsof in
situactivity(Gomezetal.,2004).
Dataanalysis
A principal component analysis (PCA) was conducted to reduce the n‐
dimensional of soil nutrients data into two linear axes explaining the
maximumamountofvariance(Fig.2.3,inChapter2).
Structuralalpha‐diversityofbothbacterialandfungalcommunities
was estimated from the number and intensity of bands (OTUs): richness
(S), Shannon (H’) and evenness (EH) diversity indexeswere calculated as
follows:
DIRECTANDINDIRECTEFFECTSOFAGRICULTURALMATRIX
86
Shannon ′ ∑ ∙ ∙ andEvenness ′,where
ni isthebandintensity,N isthesumofall intensitiesofasampleandS is
thenumberofbandsofasample(richness).Similarly,thefunctionalalpha‐
diversity was evaluated as functional richness (SS, total number of C
substratescatalyzed),functionalShannon(SH’;usingtheopticaldensityas
abundance),and functionalevenness(SES, substrateactivitydividedby ln
substraterichness)(Classenetal.,2003;GrizzleandZak,2006).
Environmental variables and structural and functional alpha‐
diversity were analyzed by two‐way Analysis of Variance (ANOVA)
considering the factorsmatrix influence and coverage. Subsequently, and
duetothehigheffectoftreecoveragefactor,fragmentationeffectswithin
eachcoveragelevel,aswellascoverageeffectswithineachfragmentation
level were separately evaluated by one‐way ANOVA. Tukey's HSD were
usedasposthoctest(p<0.05).Linearcorrelationsbetweenallmeasured
variables were tested using Pearson’s r with p < 0.05 significance
threshold.
Microbial community assemblages and metabolic profiles (both
bacterial and fungal) were explored by Nonmetric multidimensional
scaling (NMDS) analysis, which provided graphical ordination of the
community grouping, using the functionsmetaMDS and isoMDS in vegan
andMASSRpackages,Oksanenetal.(2013).Forbacteriaandfungi,these
analyses were performed using both quantitative (abundance) and
qualitative (presence/absence) data: we used the data of relative DGGE
band intensity for microbial assemblage analyses, whereas for analyzing
microbialmetabolic profilesweused thenormalized optical density data
obtained in theEcoPlates.Thedissimilaritymatriceswerebuiltusing the
Bray‐Curtis distance measure. Regarding NMDS, a measure of stress <5
provides an indication of an excellent fit of themodel, hence suggesting
that the structure of the community is well represented in reduced

CAPÍTULO3
87
dimensions,ameasureofstressbetween20and30providesagoodfit,and
measuresofstressabove30providesapoorfit,andhenceandindicationo
a poor representation in reduced dimensions. The preferred solution,
basedontheloweststressandinstabilitywasthreedimensional,although
two dimension graphs were finally presented. To seek for differences
among microbial assemblage and metabolic profile we applied a non‐
parametric multivariate analysis of variance (NPMANOVA), performed
withBray‐Curtisdistancesasameasureofdissimilarityamongtreatments
(Anderson, 2001), considering the factorsmatrix influence, coverage and
their interaction.Significancewasobtained frompermutationsof theraw
data (F test based in 1000 sums of squares). The agricultural matrix
influenceeffectswithineachcoveragelevel,aswellasthecoverageeffects
within each matrix influence level, were separately evaluated by
subsequentNPMANOVAs.
Asameasureofbeta‐diversityweusedthemultivariatedispersion,
using thedistance to the centroid (Andersonet al., 2006) calculatingone
centroidforeachsoilprovenance(i.e.undercanopyoropenareasforeach:
forestinterior,forestedgeorsmallfragments),calculatedusingbetadisper
and permutest functions in the vegan R package (Oksanen et al., 2013).
Beta‐diversitywasdeterminedbyusingbothquantitative(abundance)and
qualitative (presence/absence) data, which may provide complementary
information on the structural and functional response of these
communities to disturbances (Lozupone and Knight, 2008; Maaß et al.,
2014). In both cases, we used the Bray‐Curtis dissimilarity matrix,
consideringthefactorsmatrixinfluenceandcoverage.Subsequentmultiple
comparisonofmeanswasperformedthroughTukey'sHSDtest(p<0.05).
Controllingfactors
To determine which environmental variables explained most of the
variation of the structure and function of themicrobial communities,we

DIRECTANDINDIRECTEFFECTSOFAGRICULTURALMATRIX
88
usedtwoapproachesincludingthevariables:treeinfluenceindex,SOM,pH,
soil moisture, C:N ratio, PC1 and PC2 of nutrients PCA’s. In the first
approach,theenvfitfunction(veganRpackage;Oksanenetal.(2013),was
used to plot the vectors of variables that were significantly correlated
(p<0.05) with the assemblage and metabolic profile of microbial
communities on theNMDS ordination. The second approach consisted of
structuralequationmodeling(SEM)totestnotonlythedirectinfluenceof
biotic and abiotic factors onmicrobial functioning, but also their indirect
effects,withanaprioristicmodel inwhichthecausalrelationshipsamong
measuredvariableswereexplicitly included(Shipley,2002; Iriondoetal.,
2003;Millaetal.,2009).SEMmodelswereindividuallyperformedforeach
soil bacterial and fungal functional indicator (functional alpha and beta‐
diversity, and metabolic profile), but only the best fitted ones were
presented (quantitative functional Shannon and metabolic profile). Both
communityassemblageandmetabolicprofilewereincludedinthemodels
as the distance to a unique centroid in the plotted NMDSs. Our models
consideredacompletesetofhypothesesshowedinFigure3.3aand3.3bfor
bacterial and fungal communities, respectively. These hypotheses were
basedon literature,previousexploratoryanalyses (ANOVA, correlations),
andourownpreviousexperience(Flores‐Renteríaetal.,2015;Chapter2).
First,wehypothesizedthatmicrobialfunctioningwilldependonmicrobial
community structure (Giller et al., 1997; McGuire and Treseder, 2010;
Ushioetal.,2013;Waggetal.,2014;Flores‐Renteríaetal.,2015),andboth
wouldbedependentonabioticandbioticconditions,suchaspH,(Hamman
etal.,2007;Fiereretal.,2009),SOM(CurielYusteetal.,2007;Franklinand
Mills, 2009), soilmoisture (Curiel Yuste et al., 2007; Saul‐Tcherkas et al.,
2012),nutrients(O'Donnelletal.,2001;FranklinandMills,2009;Laughlin
et al., 2014; Legay et al., 2014), and that all these variableswould be on
their turn, under the tree influence (Classen et al., 2003; Pugnaire et al.,

CAPÍTULO3
89
2004; Legay et al., 2014). Additionally, we included in our model causal
relationsamongabioticvariables,i.e.SOMinfluenceoversoilmoisture,pH
andC:N(Abu‐Hamdeh,2001;Boix‐Fayosetal.,2001;Pugnaireetal.,2004).
Standardized path coefficients were estimated by using the maximum
likelihoodalgorithm(Shipley,2002).
Todeterminethepossiblelinksbetweenmicrobialassemblageand
metabolicprofile(forbothbacterialandfungalcommunities)independent
MantelTestsofcorrelation(mantel functiononveganpackageinR)were
performedbetweentheBray–Curtisdissimilarity indicesofeachbacterial
and fungal DGGEmatrix and the corresponding Bray–Curtis dissimilarity
indices of the bacterial and fungal EcoPlates. The Mantel Test uses the
similarityoftwodissimilaritymatricesbypermutingeachoftheelements
inthedissimilaritymatrix999timestoderiveadistributionofcorrelation
values(FranklinandMills,2009).TheresultingR‐statisticissimilartothe
Pearson’s Product Moment Correlation Coefficient; with increasingly
similar dissimilarity matrices, the Mantel R‐statistic will approach 1.
Abundanceproxiesofmicrobialassemblageandmetabolicprofilematrixes
werenottransformed.
Prior to analyses, all variableswere tested for normality, and log
transformations were applied to meet variance homoscedasticity when
required, except abundance matrices of microbial assemblage and
metabolic profiles. SEMs were performed by using IBM®, SPSS® (IBM
Corporation Software Group, Somers, NY) and IBM®, SPSS® AMOS 20.0
software (IBM Corporation Software Group, Somers, NY), the rest of
analyseswere performed using R 3.1.0 (The R Foundation for Statistical
Computing,(2014).

DIRECTANDINDIRECTEFFECTSOFAGRICULTURALMATRIX
90
Results
Coverandforestfragmentationeffectonsoilmicrobialcommunities
Asexpected,soils intheholmoak forest fragmentsstudiedwerestrongly
influencedby thecanopycover.Undercanopy,significantlyhighervalues
ofnutrients, SOM, soilmoisture, and lowerCaandpHvalueswere found
comparedwithopenareas(Fig.2.3Chapter2;TableS3.1).
Structural alpha‐diversity of the fungal community was neither
affected by coverage nor agricultural matrix, only fungal community
evenness (ES) was sensitive to the influence of the agricultural matrix
(Table3.1);whereasbacterialcommunitystructurewasmainlyinfluenced
bytheagriculturalmatrix,withhighervaluesofbacterialrichness(S)and
Shannon(H’)atsmallfragmentsandlowervaluesatforestinterior(Table
3.1). On the contrary, the metabolism of both bacterial and fungal
communities was strongly influenced by the coverage, showing higher
functional alpha‐diversity under the influence of the tree canopy in all
measured parameters: functional richness (SS), Shannon (SH’), and
evenness(SES) (Table3.1).Additionally, theagriculturalmatrixpositively
influenced, although to a lesser extent, the functional alpha‐diversity of
both bacterial and fungal communities. Specifically, bacterial functional
Shannon (SH’), and richness (SS) were higher at forest edge and small
fragments,andthoseoffungiinsmallfragments(Table3.1).Aninteractive
effectbetweencoverageandmatrix influencewas found forbacterialSH’
and SES, whichwere higher in soils from small fragments and under the
tree canopy (Table 3.1). Substrate consumption in both bacterial (Table
S3.2) and fungal (Table S3.3) communitieswasmainly dependent on the
treecanopy,affecting24and19substrates, respectively.Theagricultural
matrixalsoaffectedtheconsumptionofsomesubstrates,moreevidentlyin
thecaseofbacteria(15)thanfungi(4;TablesS3.2andS3.3).
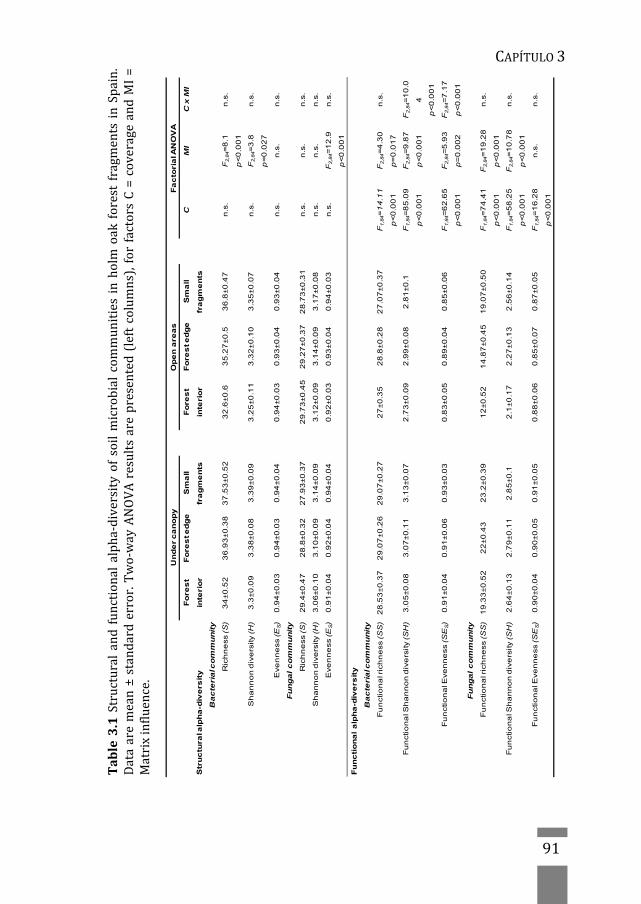
CAPÍTULO3
91
Un
de
r c
an
op
yO
pe
n a
rea
sF
ac
tori
al A
NO
VA
Str
uc
tura
l alp
ha
-div
ers
ity
Fo
res
t
inte
rio
r
Fo
res
t e
dg
eS
ma
ll
fra
gm
en
ts
Fo
res
t
inte
rio
r
Fo
res
t e
dg
eS
ma
ll
fra
gm
en
ts
CM
IC
x M
I
Ba
cte
ria
l co
mm
un
ity
Ric
hn
ess (S
)3
4±0
.52
36
.93±0
.38
37
.53±0
.52
32
.6±0
.63
5.2
7±0
.53
6.8±0
.47
n.s
.F
2,8
4=
8.1
p<
0.0
01
n.s
.
Sh
an
no
n d
ive
rsity (H
)3
.3±0
.09
3.3
8±0
.08
3.3
9±0
.09
3.2
5±0
.11
3.3
2±0
.10
3.3
5±0
.07
n.s
.F
2,8
4=
3.8
p=
0.0
27
n.s
.
Eve
nn
ess (E
S)
0.9
4±0
.03
0.9
4±0
.03
0.9
4±0
.04
0.9
4±0
.03
0.9
3±0
.04
0.9
3±0
.04
n.s
.n
.s.
n.s
.
Fu
ng
al
co
mm
un
ity
Ric
hn
ess (S
)2
9.4±0
.47
28
.8±0
.32
27
.93±0
.37
29
.73±0
.45
29
.27±0
.37
28
.73±0
.31
n.s
.n
.s.
n.s
.
Sh
an
no
n d
ive
rsity (H
)3
.06±0
.10
3.1
0±0
.09
3.1
4±0
.09
3.1
2±0
.09
3.1
4±0
.09
3.1
7±0
.08
n.s
.n
.s.
n.s
.
Eve
nn
ess (E
S)
0.9
1±0
.04
0.9
2±0
.04
0.9
4±0
.04
0.9
2±0
.03
0.9
3±0
.04
0.9
4±0
.03
n.s
.F
2,8
4=
12
.9
p<
0.0
01
n.s
.
Fu
nc
tio
na
l a
lph
a-d
ive
rsit
y
Ba
cte
ria
l co
mm
un
ity
Fu
nctio
na
l ric
hn
ess (S
S)
28
.53±0
.37
29
.07±0
.26
29
.07±0
.27
27±0
.35
28
.8±0
.28
27
.07±0
.37
F1,8
4=
14
.11
p<
0.0
01
F2,8
4=
4.3
0
p=
0.0
17
n.s
.
Fu
nctio
na
l Sh
an
no
n d
ive
rsity (S
H)
3.0
5±0
.08
3.0
7±0
.11
3.1
3±0
.07
2.7
3±0
.09
2.9
9±0
.08
2.8
1±0
.1F
1,8
4=
85
.09
p<
0.0
01
F2,8
4=
9.8
7
p<
0.0
01
F2,8
4=
10
.0
4
p<
0.0
01
Fu
nctio
na
l Eve
nn
ess (S
ES)
0.9
1±0
.04
0.9
1±0
.06
0.9
3±0
.03
0.8
3±0
.05
0.8
9±0
.04
0.8
5±0
.06
F1,8
4=
62
.65
p<
0.0
01
F2,8
4=
5.9
3
p=
0.0
02
F2,8
4=
7.1
7
p<
0.0
01
Fu
ng
al
co
mm
un
ity
Fu
nctio
na
l ric
hn
ess (S
S)
19
.33±0
.52
22±0
.43
23
.2±0
.39
12±0
.52
14
.87±0
.45
19
.07±0
.50
F1,8
4=
74
.41
p<
0.0
01
F2,8
4=
19
.28
p<
0.0
01
n.s
.
Fu
nctio
na
l Sh
an
no
n d
ive
rsity (S
H)
2.6
4±0
.13
2.7
9±0
.11
2.8
5±0
.12
.1±0
.17
2.2
7±0
.13
2.5
6±0
.14
F1,8
4=
58
.25
p<
0.0
01
F2,8
4=
10
.78
p<
0.0
01
n.s
.
Fu
nctio
na
l Eve
nn
ess (S
ES)
0.9
0±0
.04
0.9
0±0
.05
0.9
1±0
.05
0.8
8±0
.06
0.8
5±0
.07
0.8
7±0
.05
F1,8
4=
16
.28
p<
0.0
01
n.s
.n
.s.
Table3.1Structuralandfunctionalalpha‐diversityofsoilmicrobialcom
munitiesinholmoakforestfragmentsinSpain.
Dataaremean±standarderror.Two‐wayANOVAresultsarepresented(leftcolum
ns),forfactorsC=coverageandMI=
Matrixinfluence.

DIRECTANDINDIRECTEFFECTSOFAGRICULTURALMATRIX
92
Structural beta‐diversity of microbial communities based in both
quantitative (abundance; Fig. 3.1a‐b) and qualitative data
(presence/absence;Fig. 3.1c‐d)pointedout toanegative influenceof the
agricultural matrix in small fragments and edges, in comparison to the
forest interior, which generally showed higher beta‐diversity. When
qualitativedatawereanalyzed(Fig.3.1c‐d),onlythebacterialcommunity
was also influenced by coverage, with higher beta‐diversity observed in
open areas (Fig. 3.1d). In the case of quantitative data, the higher beta‐
diversity of the fungal communitywas observed in the forest interior in
comparison with forest edges and small fragments (Fig. 3.1b); whereas
qualitative data analysis revealed an interaction between coverage and
matrix influence, with the highest beta‐diversity of fungal communities
undercanopyandopenareasinforestinterior(Fig.3.1d).
On the contrary, when functional beta‐diversity was analyzed
(quantitativedataFig.3.2a‐b),bothbacterialandfungalcommunitieswere
significantly influenced by coverage and not by the matrix influence,
showinginbothcaseshighervaluesinopenareasthanundercanopy(Fig.
3.2a‐b).By contrast, for bothbacteria and fungi, functionalbeta‐diversity
(qualitative data Fig. 3.2c‐d) was affected by the interaction between
coverage and matrix influence with the highest beta‐diversity usually
observed for forest interiors, in both open areas and under canopy (Fig.
3.2c‐d).

CAPÍTULO3
93
Figure3.1 Structuralβ‐diversityof bacterial (a,c) and fungal (b,d) communities,determined by the distance to the centroid of multivariate dispersion usingquantitative(abundance)(a‐b)orqualitative(presence/absence)(c‐d)datasets,ofsoils collected at three agricultural matrix influence levels, under canopy or inopenareas, infragmentedholmoakforestsinSpain.Notethathigherdistancetocentroid (over‐dispersion) means higher β‐diversity. Different capital lettersrepresent differences among coverage treatments, while different lowercaseletters represent differences amongmatrix influence levels; TukeyHSDmultiplecomparison of the mean (p<0.05). The line within the box is the median valueindicating the interquartile range (25th to 75th percentiles), and the whiskersextendtothemostextremevaluewithinthe1.5interquartilerange.
Controlling factors of structure and metabolism of soil microbialcommunities
Bacterialandfungalcommunitiesweresignificantlycorrelatedwithsome
environmental variables (Table S3.4): e.g. PC1 of nutrients‐PCA was
stronglycorrelatedwithfunctionalalpha‐diversityinallcases(TableS3.4).
Bacterial and fungal metabolism was strongly correlated with all the
environmental variables measured, e.g. SOM and soil moisture were
positive correlated with functional alpha‐diversity of both bacterial and
fungalcommunities(TableS3.4).
Dis
tanc
e to
cen
troi
d
0.0
0.2
0.4
0.6
0.8
1.0
Under canopy Open areas
Forestinterior
Forestedge
Smallfragments
Forestinterior
Forestedge
Smallfragments
a)
a bba a
a
b)
aab b
bb
Dis
tanc
e to
cen
troi
d
0.0
0.2
0.4
0.6
c)
a
b bb
ba
A
B
d)
a a
a
ab
b
Under canopy Open areas
Forestinterior
Forestedge
Smallfragments
Forestinterior
Forestedge
Smallfragments
Bacteria Fungi

DIRECTANDINDIRECTEFFECTSOFAGRICULTURALMATRIX
94
Figure3.2Functionalβ‐diversityofbacterial (a,c)and fungal (b,d)communities,determined by the distance to the centroid of multivariate dispersion usingquantitative(abundance)(a‐b)orqualitative(presence/absence)(c‐d)dataset,ofsoils collected at three agricultural matrix influence levels, under canopy or inopenareas, infragmentedholmoakforestsinSpain.Notethathigherdistancetocentroid (over‐dispersion) means higher β‐diversity. Different capital lettersrepresent differences among coverage treatments, while different lowercaseletters represent differences amongmatrix influence levels; TukeyHSDmultiplecomparison of the mean (p<0.05). The line within the box is the median valueindicating the interquartile range (25th to 75th percentiles), and the whiskersextendtothemostextremevaluewithinthe1.5interquartilerange.
The assemblage of bacterial and fungal communities, based on
quantitativedata,wasstronglyinfluencedbytreecoverageandagricultural
matrix (Fig. S3.1), although the NPMANOVA indicated that the matrix
influence exerted the strongest effect, in both cases (Table S3.5). The
respective assemblage of OTUs within bacterial and fungal communities
(NMDS)showedagood fit (stressvalueofbacteria=19.98,Fig.S3.1a,and
fungi=20.76, Fig. S3.1b). Similar results were obtained when qualitative
(presence/absence)matriceswere analyzed,with no substantial changes
concerning the factors controlling the grouping of OTUs with respect to
b)
A
B
Dis
tan
ce t
o ce
ntro
id
0.0
0.2
0.4
0.6
0.8
1.0 a)
A
B
Dis
tanc
e to
cen
troi
d
0.0
0.2
0.4
0.6
Under canopy Open areas
Forestinterior
Forestedge
Smallfragments
Forestinterior
Forestedge
Smallfragments
c)
aabbc c c bc
d)
Under canopy Open areas
Forestinterior
Forestedge
Smallfragments
Forestinterior
Forestedge
Smallfragments
a
ab
bc
c
c c
Bacteria Fungi

CAPÍTULO3
95
results obtained with quantitative (abundance) matrices (Fig. S3.1c‐d;
TableS3.5).Accordingtotheenvfitpermutationtest,soilphysicochemical
propertieswerehighlycorrelatedsuggestingthemascontributingfactors
influencing the grouping of bacteria and fungi (Fig. S3.1). Specifically, all
nutrients, exceptorganic carbonandMo in the caseof fungi, affected the
assemblage of bothbacterial and fungal communities (Fig. S3.1a‐b; Table
S3.6). Tree influence index (Tii), soil organicmatter (SOM), soilmoisture
andpHalsoinfluencedthegroupingofbacteria(Fig.S3.1a‐b;TableS3.6).
Regarding the metabolic profile of both bacteria and fungi
(quantitativedata;Fig.S3.2a‐b) theNMDSsanalysisshowedverygood fit
(stress values of 10.04 and 16.74, respectively), and both microbial
communities were affected by the tree influence (i.e. coverage in Table
S3.5). Additionally, themetabolic profile of bacterial community in open
areaswas significantly influencedby theagriculturalmatrix (Table S3.5).
Contrary to the assemblage of the bacterial community, its metabolic
profilewasonly affectedby total andorganicC,N,P, SOM, soilmoisture,
tree influence and pH (Fig. S3.2a; Table S3.7), being, in consequence
strongly segregated by the influence of the tree canopy. By contrast, the
fungal metabolic profile was not significantly influenced by any variable
(Fig. S3.2b; Table S3.7). Unlike results obtained from quantitative data
analyses of metabolic profile, qualitative analyses (i.e. just testing the
capability of substrate utilization, not its relative use) showed that the
bacterial and fungal metabolic profiles were clustered with almost no
influence of the environmental variables (Fig. S3.2c‐d, Table S3.5). Most
variables had not longer influence in the ordination of qualitative
(presence/absence) bacterial metabolic profile, being influenced only by
tree influence, soil moisture, SOM, organic and total C, N, P (Fig. S3.2c);
whereas fungalmetabolic profile by tree influence and total carbon (Fig.
S3.2d).

DIRECTANDINDIRECTEFFECTSOFAGRICULTURALMATRIX
96
The structural‐equationmodels (SEM) proposed for bacterial and
fungal communities (Fig. 3a‐b) and based on the correlations observed
above, provided a good general fit, as indicated by the non‐significant f
value and by the goodness‐of‐fit indices (RMSEA, NFI and GFI). Squared
multiple correlations for SEMs showed that the variance of the bacterial
functional Shannon (SH’) was highly explained (R2= 0.60) in comparison
withthecommunityassemblagevariance(R2=0.42;TableS3.8).Whenthe
effect of the bacterial community structure (i.e. the effect of ShannonH’
overfunctionalShannonSH’;orassemblageovermetabolicprofile)overits
functioningwasremoved(datanotshow),theexplainedvariancedropped
almost8% in the caseofShannon (SH’)model (R2=0.55;Fig3.3c), anda
12% in the caseof themetabolicprofilemodel (R2=0.37;Fig3.3e;Table
S3.8).Bothbacterial functionalShannon (SH’) andmetabolicprofilewere
affected by soil moisture and bacterial structure (Shannon H’ and
assemblage, respectively).Agriculturalmatrix indirectlyaffectedbacterial
Shannon(H’)andassemblage,mainlythroughitseffectoverthesizeofthe
trees (tree influence),whichon theotherhand, exerteda strongpositive
effect overpHandSOMquantity (Fig. 3c,e).Additionally, the agricultural
matrixinfluencedthebacterialcommunityassemblageandthequantityof
nutrients(i.e.PC1;Fig.3.3c),which inturninfluencedbacterialstructural
Shannon(H’) (Fig.3.3e).SoilpHaffectedbothbacterialShannon(H’)and
community assemblage, but with opposite influence, negatively to the
Shannon (H’; Fig. 3.3c) andpositively to the community assemblage (Fig.
3.3e).

CAPÍTULO3
97
Figure3.3Structuralequationmodels:general(a‐b),andfittedtobacterial(c)andfungal (d)Shannondiversity (H’) (c‐d, respectively),andbacterial (e)and fungal(f) community assemblage (e‐f, respectively), representing hypothesized causalrelationshipsamongmatrixinfluence,bioticandabioticpredictors.Arrowsdepictcasual relationships: positive effects are indicated by solid lines, and negativeeffects by dashed lines, with standardized estimated regression weights (SRW)indicated.SRWofeachmicrobialdiversityindicatorareshowedinTable3.2,andsquared multiple correlations for the structural equation models in Table S3.8.Arrowwidthsareproportionaltopvalues.Pathswithcoefficientsnon‐significantdifferentfrom0(p>0.1)arepresentedongray.
a)
c)
b)
d)
e)
p<0.001 0.001<p<0.01 0.01<p<0.05 0.05<p<0.1
f)
Bacterial community structure
Bacterial metabolism
SOM
Moisture
PC1 nutrients pH
Matrix influence
Tree influence
Fungal communitystructure
Fungal metabolism
SOMPC1
nutrients Moisture
Matrix influence
Tree influence
pH
Bacterial structural
Shannon (H’)
Bacterial functional
Shannon (SH’)
SOM
Moisture
PC1 nutrients pH
Matrix influence
Tree influence
0.24
0.25
0.75
0.47
0.88
0.590.20
0.47
0.21
0.15
0.42
NFI= 0.96; GFI= 0.96; RMSEA= 0.07; χ2= 14.83; p= 0.14; df=10; n=90
Bacterial community assemblage
Bacterial metabolic
profile
SOM
Moisture
PC1 nutrients pH
Matrix influence
Tree influence
0.24
0.25
0.75
0.47
0.88
0.590.20
0.580.21
0.16
0.38
NFI= 0.97; GFI= 0.97; RMSEA<0.001; χ2= 10.245; p= 0.51; df=11; n=90
Fungal structural
Shannon (H’)
Fungal functional
Shannon (SH’)
SOM
pH
PC1 nutrients Moisture
Matrix influence
Tree influence
0.240.25
0.75
0.47
0.88
0.590.20
0.35
0.45
0.20
0.20
0.41
0.23
NFI= 0.98; GFI= 0.98; RMSEA<0.001; χ2= 8.60; p= 0.48; df=9; n=90
Fungal community assemblage
Fungal metabolic
profile
SOM
pH
PC1 nutrients Moisture
Matrix influence
Tree influence
0.240.25
0.75
0.47
0.88
0.590.20
0.43
0.47
0.27
0.25
NFI= 0.97; GFI= 0.98; RMSEA=0.024; χ2= 9.44; p= 0.40; df=9; n=90

DIRECTANDINDIRECTEFFECTSOFAGRICULTURALMATRIX
98
The agricultural matrix exerted both a direct and indirect (through its
effect on nutrients) influence over fungal Shannon (H’) and community
assemblage, aswell as over tree influence (Fig. 3.3d,f). Fungal functional
Shannon (SH’) and community assemblage were drove by SOM, tree
influenceandsoilpH,showingoppositepatternstothoseobservedineach
thefunctionalShannon(SH’)orcommunityassemblagemodels(Fig.3.3d,f;
Table3.2).
Table3.2Microbial communitymetabolism and direct (D), indirect (I) andtotal(T)effectsoftestedvariables,basedonstandardizedregressionweights(SRW),foreachstructuralequationmodel.Significantdirecteffectsarenotedin bold. Tii= Tree influence index; PC1= Principal component 1 of thenutrientsPCA.
Bacterial functional alpha-diversity Fungal functional alpha-diversity
D I T D I T
Matrix influence -0.02 0.16 0.13 Matrix influence 0.09 0.23 0.32
Tii 0.13 0.34 0.47 Tii 0.23 0.21 0.45
SOM 0.23 0.36 0.60 SOM 0.41 0.09 0.50
Soil moisture 0.42 0.00 0.42 Soil moisture -0.12 0.00 -0.11
pH -0.02 -0.03 -0.05 pH -0.20 0.00 -0.20
PC1 nutrients 0.00 0.10 0.10 PC1 nutrients 0.20 0.00 0.20
Bacterial alpha-diversity 0.21 0.00 0.21 Fungal alpha-diversity 0.01 0.00 0.01
Bacterial metabolic profile Fungal metabolic profile
D I T D I T
Matrix influence 0.00 0.00 0.00 Matrix influence -0.08 -0.12 -0.20
Tii -0.15 -0.25 -0.40 Tii -0.25 -0.22 -0.47
SOM -0.13 -0.36 -0.49 SOM -0.43 -0.15 -0.57
Soil moisture -0.38 0.00 -0.38 Soil moisture 0.10 0.02 0.12
pH 0.05 0.03 0.08 pH 0.27 0.00 0.27
PC1 nutrients 0.00 -0.04 -0.04 PC1 nutrients -0.08 -0.01 -0.10
Bacterial assemblage 0.21 0.00 0.21 Fungal assemblage -0.10 0.00 -0.10

CAPÍTULO3
99
Relationsbetweenassemblageandfunctioninsoilmicrobialcommunities
Relationshipsamongindicatorsofstructuralandfunctionalalpha‐diversity
(richness, diversity and evenness) showed significant but weak
correlations; i.e. bacterial richness (S) and bacterial functional richness
(SS’)showedaR2=0.26(TableS3.4),whereas fungalcommunitystructure
and function (richness,diversityandevenness)wereuncorrelated (Table
S3.4).
Inthecaseofthebacterialcommunity,SEMsrevealedadirecteffect
of structure (Shannon and assemblage) over functioning (functional
Shannonandmetabolicprofile;Fig.3.3c,e;Table3.2).Inthecaseoffungal
communities, SEMs revealed that neither fungal Shannon (H’) nor
community assemblage exerted a significant effect on fungal functioning,
neither on Shannon SH’ nor onmetabolic profile (Fig. 3.3d, f; Table 3.2).
Indeed, Mantel test showed that the dissimilarity matrices of fungal
community assemblage and metabolic profile were not significantly
correlated (R=0.04; p=0.26); while, dissimilarity matrices of bacterial
assemblageandmetabolicprofileexhibitasignificantcorrelation(R=0.12;
p=0.006).

DIRECTANDINDIRECTEFFECTSOFAGRICULTURALMATRIX
100
Discusion
Treecoverageandforestfragmentationeffectonsoilmicrobialcommunity
Our results indicate that the assemblage and diversity of microbial
communities, aswell as their capacity tometabolize different substrates,
exhibiteddissimilarsusceptibilitytotheagriculturalmatrixinfluence(used
asproxyof forest fragmentation), inmanycasesstronglymediatedby its
influenceovertreegrowthandplant‐soilinteractions(i.e.increasingplant
productivityand,inturn,theamountofsoilorganicmatter).Thisdifferent
response to the agriculturalmatrix and the tree influence of the studied
microbial community structure (DGGE) and functional (EcoPlates)
indicatorssuggestsapartialdecouplingbetweenthefactorscontrollingthe
composition/assemblage of species and the functioning of microbial
communities. Indeed, bacterial richness (S) and Shannon (H’) were
positively affected by the agricultural matrix influence, whereas the
functional alpha‐diversity of bacterial and fungal communities was
positively influencedbybothfactors(matrix influenceandcoverage),and
particularlybythetree(canopycover).Thepresenceofthetree,therefore,
exertedastrongpositive influenceover therelativeamountofconsumed
substrates, corroborating the findings of studies that have previously
showed a higher microbial functional diversity (Classen et al., 2003), as
well as enzymatic activity (Chapter 2), under canopy in comparisonwith
openareas.Thegenerallyhigherbacterialalpha‐diversity(i.e.richnessand
Shannon) in areas more influenced by the agricultural matrix (i.e. small
forestfragments),canbealsoexplainedbytheformationofnewavailable
nichesafterdisturbance(CurielYusteetal.,2012).Thepartialdecoupling
of the factors controlling the structure and functioning of microbial
communities might be an indicative of the strong differences in the
compositionof theactivemicrobial community fromthe totalcommunity

CAPÍTULO3
101
at localscales(O'Donnelletal.,2001; JonesandLennon,2010). Indeed, it
mightbethattheunfavorableenvironmentalconditionsoftheopenareas
can be associated with dormancy of most bacterial and fungal lineages
present in the community, as it hasbeenpreviouslyobserved (Jones and
Lennon, 2010). However, we cannot discard a bias due to the used
techniques, since DGGE explores the most abundant, still representative
OTUs of the microbial community (Vaz‐Moreira et al., 2013), whereas
EcoPlatesrepresentthecultivableones(Classenetal.,2003).
This general tendency of positive influence of both tree coverage
and agriculturalmatrix over local diversity of themicrobial communities
(i.e. structural richness and Shannon and all functional indicators)
contrasted,moreover,withtheresultsobtainedwhenanalyzingtheirbeta‐
diversity, as a measure of the spatial structural and functional
heterogeneity of these communities at the landscape scale. Indeed, areas
highlyinfluencedbytheagriculturalmatrix(i.e.smallfragmentsandforest
edges), or by the tree, showed more spatially homogeneous (less beta‐
diverse) microbial communities suggesting a clear scale‐dependent
responseofmicrobialcommunitiestoenvironmentalperturbations.Hence,
forest fragmentation with high agricultural matrix and tree influences
would enhance bacterial alpha‐diversity, both structural (S and H’) and
functional (SS, SH and SEs), while decreasing both the structural and
functionalspatialheterogeneity(lessbeta‐diversity)ofthesecommunities.
This landscape convergence of microbial communities under the tree
canopies and at highly influenced areas by the agriculturalmatrix (small
fragments and forest edges) could be attributable to the environmental
filtering of these communities by more uniform soil properties in these
areas, i.e. abiotic homogenization, in comparison with open areas and
forest interiors, since a beta‐diversity decrease indicates community
similarity increase over space, i.e. biotic homogenization (Olden et al.,

DIRECTANDINDIRECTEFFECTSOFAGRICULTURALMATRIX
102
2004).Theseresultswouldfinallyindicatethatdespitethefactthatforest
fragmentation might be associated with species enrichment at the local
scale, itmight cause a general species and functional impoverishment of
soils at the landscape scale, with likely negative consequences for the
capacityofthesesoilstorespondtoenginesofclimatechange(CurielYuste
etal.,2011;Flores‐Renteríaetal.,2015).
Controllingfactorsofsoilmicrobialcommunities
Ourresultsshowed,ingeneral,thestrongeffectoftheagriculturalmatrix
over the proxies for microbial community structure (i.e. alpha‐diversity
and assemblage), that could be mainly attributable to the soil nutrient
enrichment associated with fragmentation. Variability in soil nutrient
contentswasmainly explainedby thematrix influence (44%)evenmore
thanbythetreecover(26%).Indeed,asithasbeenpreviouslyreported,a
big portion of the variability in microbial structure was explained by
nutrient availability (Wardle, 1998; O'Donnell et al., 2001; Fierer and
Jackson,2006;FranklinandMills,2009;Bowenetal.,2011;Ramirezetal.,
2012; Tardy et al., 2014).While almost all nutrients influenced bacterial
and fungal assemblages, only macronutrients (C, N, P) influenced their
metabolism.Ontheotherhand,theuseofbothquantitativeandqualitative
analysesallowedustounveilthestronginfluenceofthecanopycoverover
the microbial metabolic profile (influencing the amount of substrate
metabolized, but not the capability for substrate utilization), highlighting
the importance of using both approaches to explore, for example,
functional redundancy and complementarity within these microbial
communities(LozuponeandKnight,2008;Mikietal.,2010).Accordingto
our results, microbial communities with different structure (i.e. under
canopy vs. open areas) exhibited the same capability for substrate
utilization,giventhatthetreecanopycoveronlyinfluencedtheamountof
substrate metabolized, suggesting a functional redundancy of these

CAPÍTULO3
103
microbialcommunities(i.e.theabilityofonemicrobialtaxontocarryouta
processasanother;AllisonandMartiny,2008).
SEMs allowed us to disentangle the complexity of the direct and
indirect effects of the agriculturalmatrix over themicrobial ecology and
potential roles of these communities within the plant‐soil‐microbial
system. The magnitude of the agricultural matrix effect, and hence the
effectofforestfragmentation,overbothfunctionalShannonandmetabolic
profile, is the result of a complex cascade of causal‐effect relations
involving changes in plant performance and modifications of nutrient
quantity (and probably quality and/or availability). Similarly to the
findings inChapter2, the agriculturalmatrix influences the tree size and
modified the micro‐environmental conditions (nutrients, SOM, pH and
moisture), which in turn, strongly influenced the relative amount of
consumed substrates and the ability of microbial communities to
metabolize different substrates. In a causal‐effect cascade, trees exert a
strongdirecteffectoverpH,nutrientsandSOM,which,inturninfluencing
variables directly related to microbial functioning. In particular, and
accordingtoSEMsandChapter2results,thequantityofSOM,whichinour
studywasstronglyinfluencedbythetreeandisusuallystronglycorrelated
with highermicrobialmetabolism (Gomez et al., 2004; Frąc et al., 2012),
appeared to be indirectly related with bacterial metabolism through
increasingmoistureavailability,amongothervariables.
Ontheotherhand, thedirecteffectofagriculturalmatrixoverthe
soilmicrobialcommunitiesdrawnbySEMs(i.e.fungalstructuralShannon
andboth bacterial and fungal assemblages) suggests that there areother
factors,besidessoilnutrients,notmeasured in this study, influencing the
species compositionof soilmicrobial communities.Onepossibility is that
the agricultural matrix is influencing the quality of soil substrates (e.g.
configuration of humic molecules, presence of secondary metabolites)

DIRECTANDINDIRECTEFFECTSOFAGRICULTURALMATRIX
104
inducing changes in the microbial community (Asensio et al., 2012), as
suggested in our study by the influence of the agriculturalmatrix on the
microbialpreferencefortheconsumptionofdeterminatesubstrates.
SEMsalsoshowedthatinthiscascadeofcausal‐effectrelationsthe
paths controlling the capacity of bacterial and fungal communities to
metabolize different substrates markedly differed. For instance, the
capacity of fungi to metabolize different substrates was strongly and
directlyinfluencedbythetree,withnoapparentinfluenceofthestructure
ofthefungalcommunity.Theseresultspointouttothestronglinkoffungi
with trees, as organisms that have co‐evolved with plants in the
colonization of terrestrial ecosystems (Boer et al., 2005) and have
developed the enzymaticmachinery able to degrade the complex vegetal
molecules (Kohler et al., 2015). However, it is important to consider
limitation issues when using EcoPlates, particularly in the case of fungi,
althoughitisstillalargelyacceptedandusefultooltoexplorethepotential
activityofmicrobialcommunities(Gomezetal.,2004).
Regarding bacterial community ecology, SEMs and Mantel test
clearlyshowedhowbacterial functioningwasrelated to theircommunity
structure (alpha‐diversity and community assemblage). The relationship
between microbial structure and their metabolism is leastways highly
complex (O'Donnell et al., 2001;Mendes et al., 2015), hence it has so far
presented conflicting results (Griffiths et al., 2000;O'Donnell et al., 2001;
Belletal.,2005;Langenhederetal.,2010;Levineetal.,2011;CurielYuste
et al., 2014; Tardy et al., 2014; Mendes et al., 2015). However, the
relationshipbetweenbacterialstructureandtheirmetabolismfoundhere
and in others studies (Bell et al., 2005; Tardy et al., 2014), suggest that
environmental alterations, such as those derived from forest
fragmentation,which produces changes on themicrobial structure could
leadtodecreasesontheiroverallfunctioning.

CAPÍTULO3
105
Conclusions
Our study reinforces our knowledge about the important alterations that
forest fragmentation exerts on tree‐soil‐microbial interactions, as
presentedinChapter2.Forestfragmentationpositivelyaffectssoilfertility
andtreegrowthandproductivity(SOMaccumulation),inducingchangesin
both abiotic (moisture and pH) and biotic (higher microbial alpha‐
diversity) factors that ultimately improve the conditions for microbial
metabolism at local scale. However, forest fragmentation and tree cover
tend to homogenize the microbial community structure and their
metabolism (lower microbial beta‐diversity) at landscape scale with
potentialnegativeconsequencesonthecapacityofthesesoilstorespondto
the climate change. Collectively, our results suggest that forest
fragmentation has a deep effect on microbial diversity and function
throughdirectandindirectways,affectingthefunctioningoftheplant‐soil‐
microbialsystemandthecyclingofnutrients.
DIRECTANDINDIRECTEFFECTSOFAGRICULTURALMATRIX
106
References
Abu‐Hamdeh, N. H. (2001). Soil and water: measurement of the thermalconductivity of sandy loam and clay loam soils using single and dualprobes.JournalofAgriculturalEngineeringResearch,80(2):209‐216.
Allison, S. D. and J. B.Martiny (2008). Resistance, resilience, and redundancy inmicrobialcommunities.ProceedingsoftheNationalAcademyofSciences,USA,105(Supplement1):11512‐11519.
Anderson,I.C.,C.D.CampbellandJ.I.Prosser(2003).Diversityoffungiinorganicsoils under a moorland – Scots pine (Pinus sylvestris L.) gradient.EnvironmentalMicrobiology,5(11):1121‐1132.
Anderson,M.J.(2001).Anewmethodfornon‐parametricmultivariateanalysisofvariance.AustralEcology,26(1):32‐46.
Anderson,M.J.,K.E.EllingsenandB.H.McArdle(2006).Multivariatedispersionasameasureofbetadiversity.EcologyLetters,9(6):683‐693.
Asensio, D., J. Yuste, S.Mattana, À. Ribas, J. Llusià and J. Peñuelas (2012). LitterVOCs induce changes in soil microbial biomass C and N and largelyincreasesoilCOefflux.Plant&Soil,360(1/2):163‐174.
Barba, J., J.CurielYuste, J.Martínez‐VilaltaandF.Lloret(2013).Drought‐inducedtree species replacement is reflected in the spatial variability of soilrespiration in a mixed Mediterranean forest. Forest Ecology andManagement,306(0):79‐87.
Bell, T., J. A. Newman, B.W. Silverman, S. L. Turner andA. K. Lilley (2005). Thecontribution of species richness and composition to bacterial services.Nature,436(7054):1157‐1160.
Boer,W.d.,L.B.Folman,R.C.SummerbellandL.Boddy(2005).Livinginafungalworld: impact of fungi on soil bacterial niche development. FEMSMicrobiologyReviews,29(4):795‐811.
Boix‐Fayos, C., A. Calvo‐Cases, A. C. Imeson and M. D. Soriano‐Soto (2001).Influence of soil properties on the aggregation of some Mediterraneansoils and the use of aggregate size and stability as land degradationindicators.CATENA,44(1):47‐67.
Bond‐Lamberty,B.,C.WangandS.T.Gower(2004).Aglobalrelationshipbetweentheheterotrophicandautotrophiccomponentsofsoilrespiration?GlobalChangeBiology,10(10):1756‐1766.
Bowen,J.L.,B.B.Ward,H.G.Morrison,J.E.Hobbie,I.Valiela,L.A.DeeganandM.L.Sogin (2011). Microbial community composition in sediments resistsperturbationbynutrientenrichment.TheISMEJournal,5(9):1540‐1548.
Classen, A. T., S. I. Boyle, K. E. Haskins, S. T. Overby and S. C. Hart (2003).Community‐level physiological profiles of bacteria and fungi: plate typeand incubation temperature influences on contrasting soils. FEMSMicrobiologyEcology,44(3):319‐328.
Cleary, D. F. R., K. Smalla, L. C. S. Mendonça‐Hagler and N. C. M. Gomes (2012).Assessmentofvariationinbacterialcompositionamongmicrohabitatsinamangrove environment using DGGE fingerprints and barcodedpyrosequencing.PLoSONE,7(1):e29380.

CAPÍTULO3
107
CurielYuste,J.,D.D.Baldocchi,A.Gershenson,A.Goldstein,L.MissonandS.Wong(2007). Microbial soil respiration and its dependency on carbon inputs,soiltemperatureandmoisture.GlobalChangeBiology,13(9):2018‐2035.
CurielYuste,J.,J.Barba,A.J.Fernandez‐Gonzalez,M.Fernandez‐Lopez,S.Mattana,J.Martinez‐Vilalta,P.NolisandF.Lloret(2012).Changes insoilbacterialcommunity triggered by drought‐induced gap succession precededchanges insoilCstocksandquality.EcologyandEvolution,2(12):3016‐3031.
CurielYuste,J.,A.J.Fernandez‐Gonzalez,M.Fernandez‐Lopez,R.Ogaya,J.Peñuelasand F. Lloret (2014). Functional diversificationwithin bacterial lineagespromotes wide functional overlapping between taxonomic groups in aMediterraneanforestsoil.FEMSMicrobiologyEcology,90(1):54‐67.
CurielYuste,J.,J.Peñuelas,M.Estiarte,J.Garcia‐Mas,S.Mattana,R.Ogaya,M.PujolandJ.Sardans(2011).Drought‐resistantfungicontrolsoilorganicmatterdecomposition and its response to temperature. Global Change Biology,17(3):1475‐1486.
Díaz,M. and C. L. Alonso (2003).WoodmouseApodemus sylvaticus winter foodsupply:density,condition,breeding,andparasites.Ecology,84(10):2680‐2691.
FAO(2011).Thestateofworldfisheriesandaquaculture2009.Rome,FAO.Fierer,N.andR.B.Jackson(2006).Thediversityandbiogeographyofsoilbacterial
communities. Proceedings of the National Academy of Sciences, USA,103(3):626‐631.
Fierer,N.,M. S. Strickland,D. Liptzin,M.A. Bradford andC. C. Cleveland (2009).Global patterns in belowground communities. Ecology Letters, 12(11):1238‐1249.
Flores‐Rentería, D., J. Curiel Yuste, A. Rincón, F. Brearley, J. García‐Gil and F.Valladares(2015).Habitatfragmentationcanmodulatedroughteffectsontheplant‐soil‐microbialsysteminMediterraneanholmoak(Quercus ilex)forests.MicrobialEcology:1‐15.
Frąc, M., K. Oszust and J. Lipiec (2012). Community Level Physiological Profiles(CLPP),Characterizationandmicrobialactivityofsoilamendedwithdairysewagesludge.Sensors,12(3):3253‐3268.
Franklin, R. B. and A. L. Mills (2009). Importance of spatially structuredenvironmental heterogeneity in controlling microbial communitycompositionatsmallspatialscalesinanagriculturalfield.SoilBiologyandBiochemistry,41(9):1833‐1840.
Fuhrman, J. A. (2009). Microbial community structure and its functionalimplications.Nature,459(7244):193‐199.
Gafan,G.P.,V.S.Lucas,G.J.Roberts,A.Petrie,M.WilsonandD.A.Spratt(2005).Statistical analyses of complex denaturing gradient gel electrophoresisprofiles.JournalofClinicalMicrobiology,43(8):3971‐3978.
Gardes, M. and T. D. Bruns (1993). ITS primers with enhanced specificity forbasidiomycetes ‐ application to the identification of mycorrhizae andrusts.MolecularEcology,2(2):113‐118.
Garland, J. L. and A. L. Mills (1991). Classification and characterization ofheterotrophic microbial communities on the basis of patterns of

DIRECTANDINDIRECTEFFECTSOFAGRICULTURALMATRIX
108
community‐level sole‐carbon‐source utilization. Applied andEnvironmentalMicrobiology,57(8):2351‐2359.
Giller,K.E.,M.H.Beare,P.Lavelle,A.M.N.IzacandM.J.Swift(1997).Agriculturalintensification,soilbiodiversityandagroecosystemfunction.AppliedSoilEcology,6(1):3‐16.
Gomez,E., J.GarlandandM.Conti (2004).Reproducibility in theresponseof soilbacterial community‐level physiological profiles from a land useintensificationgradient.AppliedSoilEcology,26(1):21‐30.
Griffiths, B. S., K. Ritz, R. D. Bardgett, R. Cook, S. Christensen, F. Ekelund, S. J.Sørensen, E. Bååth, J. Bloem,P. C.DeRuiter, J.Dolfing andB.Nicolardot(2000). Ecosystem response of pasture soil communities to fumigation‐induced microbial diversity reductions: an examination of thebiodiversity–ecosystemfunctionrelationship.Oikos,90(2):279‐294.
Grizzle, H. W. and J. C. Zak (2006). A microtiter plate procedure for evaluatingfungalfunctionaldiversityonnitrogensubstrates.Mycologia,98(2):353‐363.
Grossman,J.,B.O’Neill,S.Tsai,B.Liang,E.Neves,J.LehmannandJ.Thies(2010).Amazoniananthrosols support similarmicrobial communities thatdifferdistinctly from those extant in adjacent, unmodified soils of the samemineralogy.MicrobialEcology,60(1):192‐205.
Haegeman, B., J. Hamelin, J. Moriarty, P. Neal, J. Dushoff and J. S. Weitz (2013).Robustestimationofmicrobialdiversityintheoryandinpractice.ISMEJ,7(6):1092‐1101.
Hamman, S.T., I. C. Burke andM. E. Stromberger (2007).Relationships betweenmicrobial community structure and soil environmental conditions in arecentlyburnedsystem.SoilBiologyandBiochemistry,39(7):1703‐1711.
Horner‐Devine,M.C.,J.M.Silver,M.A.Leibold,B.J.M.Bohannan,R.K.Colwell,J.A.Fuhrman,J.L.Green,C.R.Kuske,J.B.H.Martiny,G.Muyzer,L.Øvreås,A.‐L.ReysenbachandV.H.Smith(2007).Acomparisonoftaxonco‐occurrencepatternsformacro‐andmicroorganisms.Ecology,88(6):1345‐1353.
Hughes,J.B., J. J.Hellmann,T.H.RickettsandB.J.M.Bohannan(2001).Countingtheuncountable: statisticalapproaches toestimatingmicrobialdiversity.AppliedandEnvironmentalMicrobiology,67(10):4399‐4406.
Iriondo,J.M.,M.a.J.AlbertandA.Escudero(2003).Structuralequationmodelling:an alternative for assessing causal relationships in threatened plantpopulations.BiologicalConservation,113(3):367‐377.
Jones,S.E.andJ.T.Lennon(2010).Dormancycontributestothemaintenanceofmicrobial diversity. Proceedings of the National Academy of Sciences,107(13):5881‐5886.
Katayama, A., T. Kume, H. Komatsu, M. Ohashi, M. Nakagawa, M. Yamashita, K.Otsuki,M.SuzukiandT.o.Kumagai (2009).Effectof forest structureonthe spatial variation in soil respiration in a Bornean tropical rainforest.AgriculturalandForestMeteorology,149(10):1666‐1673.
Kohler,A.,A.Kuo,L.G.Nagy,E.Morin,K.W.Barry,F.Buscot,B.Canback,C.Choi,N.Cichocki,A.Clum,J.Colpaert,A.Copeland,M.D.Costa,J.Dore,D.Floudas,G. Gay, M. Girlanda, B. Henrissat, S. Herrmann, J. Hess, N. Hogberg, T.Johansson, H.‐R. Khouja, K. LaButti, U. Lahrmann, A. Levasseur, E. A.Lindquist, A. Lipzen, R. Marmeisse, E. Martino, C. Murat, C. Y. Ngan, U.

CAPÍTULO3
109
Nehls, J. M. Plett, A. Pringle, R. A. Ohm, S. Perotto, M. Peter, R. Riley, F.Rineau, J. Ruytinx, A. Salamov, F. Shah, H. Sun, M. Tarkka, A. Tritt, C.Veneault‐Fourrey, A. Zuccaro, C. Mycorrhizal Genomics Initiative, A.Tunlid, I. V. Grigoriev, D. S. Hibbett and F. Martin (2015). Convergentlosses of decay mechanisms and rapid turnover of symbiosis genes inmycorrhizalmutualists.NatGenet,47(4):410‐415.
Koleff, P., K. J. Gaston and J. J. Lennon (2003). Measuring beta diversity forpresence–absencedata.JournalofAnimalEcology,72(3):367‐382.
Langenheder, S., M. T. Bulling, M. Solan and J. I. Prosser (2010). Bacterialbiodiversity‐ecosystem functioning relations are modified byenvironmentalcomplexity.PLoSONE,5(5):e10834.
Laughlin, D. C., C. Joshi, S. J. Richardson, D. A. Peltzer, N.W. H.Mason andD. A.Wardle(2014).Quantifyingmultimodaltraitdistributionsimprovestrait‐basedpredictionsofspeciesabundancesandfunctionaldiversity.JournalofVegetationScience:n/a‐n/a.
Legay,N.,C.Baxendale,K.Grigulis,U.Krainer,E.Kastl,M.Schloter,R.D.Bardgett,C.Arnoldi,M.Bahn,M.Dumont,F.Poly,T.Pommier, J.C.ClémentandS.Lavorel (2014). Contributionof above‐ andbelow‐groundplant traits tothestructureandfunctionofgrasslandsoilmicrobialcommunities.AnnalsofBotany.
Levine, U. Y., T. K. Teal, G. P. Robertson and T.M. Schmidt (2011). Agriculture'simpactonmicrobialdiversityandassociatedfluxesofcarbondioxideandmethane.ISMEJ,5(10):1683‐1691.
Lozupone,C.A.andR.Knight(2008).Speciesdivergenceandthemeasurementofmicrobialdiversity.FEMSMicrobiologyReviews,32(4):557‐578.
Maaß, S., M. Migliorini, M. C. Rillig and T. Caruso (2014). Disturbance, neutraltheory, and patterns of beta diversity in soil communities. Ecology andEvolution,4(24):4766‐4774.
Magurran, A. E. (2004). Measuring Biological Diversity. Oxford, UK, BlackwellPublishing.
Malmivaara‐Lämsä,M.,L.Hamberg,E.Haapamäki,J.Liski,D.J.Kotze,S.Lehvävirtaand H. Fritze (2008). Edge effects and trampling in boreal urban forestfragments – impacts on the soil microbial community. Soil Biology andBiochemistry,40(7):1612‐1621.
McGuire, K. L. and K. K. Treseder (2010). Microbial communities and theirrelevance for ecosystem models: decomposition as a case study. SoilBiologyandBiochemistry,42(4):529‐535.
Mendes, L., S. Tsai, A. Navarrete, M. de Hollander, J. van Veen and E. Kuramae(2015). Soil‐Borne microbiome: linking diversity to function. MicrobialEcology:1‐11.
Miki,T.,M.Ushio,S.FukuiandM.Kondoh(2010).Functionaldiversityofmicrobialdecomposers facilitates plant coexistence in a plant–microbe–soilfeedbackmodel.Proceedingsof theNationalAcademyof Sciencesof theUnitedStatesofAmerica,107(32):14251‐14256.
Milla, R., A. Escudero and J. M. Iriondo (2009). Inherited variability in multipletraits determines fitness in populations of an annual legume fromcontrastinglatitudinalorigins.AnnalsofBotany,103(8):1279‐1289.

DIRECTANDINDIRECTEFFECTSOFAGRICULTURALMATRIX
110
Muyzer, G., E. C. de Waal and A. G. Uitterlinden (1993). Profiling of complexmicrobialpopulationsbydenaturinggradientgelelectrophoresisanalysisof polymerase chain reaction‐amplified genes coding for 16S rRNA.AppliedandEnvironmentalMicrobiology,59(3):695‐700.
Ninyerola, M., X. Pons and J. M. Roure. (2005). Atlas climático digital de laPenínsula Ibérica. Metodología y aplicaciones en bioclimatología ygeobotánica. Retrieved 30/04/2014, 2014, fromhttp://www.opengis.uab.es/wms/iberia/index.htm.
O'Donnell, A., M. Seasman, A. Macrae, I. Waite and J. Davies (2001). Plants andfertilisers as drivers of change in microbial community structure andfunctioninsoils.PlantandSoil,232(1‐2):135‐145.
Oksanen, J.,F.G.Blanchet,R.Kindt,P.Legendre,P.R.Minchin,R.B.O'Hara,G.L.Simpson, P. Solymos, M. H. H. Stevens and H. Wagner (2013). vegan:CommunityEcologyPackage.
Olden, J.D.,N.LeRoyPoff,M.R.Douglas,M.E.DouglasandK.D.Fausch (2004).Ecological and evolutionary consequences of biotic homogenization.TrendsinEcology&Evolution,19(1):18‐24.
Pugnaire,F.I.,C.ArmasandF.Valladares(2004).Soilasamediatorinplant‐plantinteractions in a semi‐arid community. Journal of Vegetation Science,15(1):85‐92.
R‐Core‐Team(2014).R:A languageandenvironment forstatistical computing.RFoundationforStatisticalComputing.Vienna,Austria.
Ramirez, K. S., J. M. Craine and N. Fierer (2012). Consistent effects of nitrogenamendmentsonsoilmicrobialcommunitiesandprocessesacrossbiomes.GlobalChangeBiology,18(6):1918‐1927.
Rantalainen,M.‐L., H. Fritze, J. Haimi, T. Pennanen andH. Setälä (2005). Speciesrichness and food web structure of soil decomposer community asaffected by the size of habitat fragment and habitat corridors. GlobalChangeBiology,11(10):1614‐1627.
Rincón, A., B. P. Santamaría, L. Ocaña and M. Verdú (2014). Structure and
phylogenetic diversity of post‐fire ectomycorrhizal communities ofmaritimepine.Mycorrhiza,24(2):131‐141.
Riutta, T., E. M. Slade, D. P. Bebber, M. E. Taylor, Y. Malhi, P. Riordan, D. W.Macdonald and M. D. Morecroft (2012). Experimental evidence for theinteracting effects of forest edge, moisture and soil macrofauna on leaflitterdecomposition.SoilBiologyandBiochemistry,49(0):124‐131.
Santos, T. and J. L. Tellería (1998). Efectos de la fragmentación de los bosquessobre los vertebradosde lasmesetas ibéricas.Madrid, Spain,OrganismoAutónomo"ParquesNacionales".
Saul‐Tcherkas,V.,A.UncandY.Steinberger(2012).Soilmicrobialdiversityinthevicinityofdesertshrubs.Microbialecology.
Saunders,D.A.,R.J.HobbsandC.R.Margules(1991).Biologicalconsequencesofecosystemfragmentation:areview.ConservationBiology,5(1):18‐32.
Shipley,B.(2002).Causeandcorrelationinbiology:auser'sguidetopathanalysis,structural equations and causal inference. Cambridge, UK, CambridgeUniversityPress.
CAPÍTULO3
111
Suzuki, C., M. Takenaka, N. Oka, K. Nagaoka and T. Karasawa (2012). A DGGEanalysis shows that crop rotation systems influence the bacterial andfungalcommunities insoils.SoilScienceandPlantNutrition,58(3):288‐296.
Tardy,V.,O.Mathieu,J.Lévêque,S.Terrat,A.Chabbi,P.Lemanceau,L.RanjardandP.‐A. Maron (2014). Stability of soil microbial structure and activitydepends on microbial diversity. Environmental Microbiology Reports,6(2):173‐183.
Turner,M.G.(2005).LandscapeEcology:whatisthestateoftheScience?AnnualReviewofEcology,EvolutionandSystematics,36(1):319‐344.
Ushio,M.,T.MikiandT.C.Balser(2013).Acoexistingfungal‐bacterialcommunitystabilizes soil decomposition activity in a microcosm experiment. PLoSONE,8(11):e80320.
Vaz‐Moreira, I., C. Egas,O. C.Nunes andC.M.Manaia (2013). Bacterial diversityfromthesourcetothetap:acomparativestudybasedon16SrRNAgene‐DGGEandculture‐dependentmethods.FEMSMicrobiologyEcology,83(2):361‐374.
Wagg, C., S. F. Bender, F. Widmer and M. G. A. van der Heijden (2014). Soilbiodiversity and soil community composition determine ecosystemmultifunctionality.ProceedingsoftheNationalAcademyofSciences,USA:1‐5.
Walker,L.R.(2012).Thebiologyofdisturbanceecology.NewYork.,OxfordUniv.Press.
Wardle,D.A.(1998).Controlsoftemporalvariabilityofthesoilmicrobialbiomass:A global‐scale synthesis. Soil Biology and Biochemistry, 30(13): 1627‐1637.
Weber,K.P., J.A.Grove,M.Gehder,W.A.AndersonandR.L.Legge(2007).Datatransformations in the analysis of community‐level substrate utilizationdata from microplates. Journal of Microbiological Methods, 69(3): 461‐469.
Weber,K.P.andR.L.Legge(2009).One‐dimensionalmetricfortrackingbacterialcommunity divergence using sole carbon source utilization patterns.JournalofMicrobiologicalMethods,79(1):55‐61.
WRB,I.W.G.(2007).WorldReferenceBaseforSoilResources2006, firstupdate2007.FAO.W.S.R.Reports.Rome,Italy.103:116.

DIRECTANDINDIRECTEFFECTSOFAGRICULTURALMATRIX
112
Supplementarymaterial
Un
de
r c
an
op
yO
pe
n a
rea
s
Fo
res
t
inte
rio
r
Fo
res
t
ed
ge
Sm
all
fra
gm
en
tsA
NO
VA
Fo
res
t
inte
rio
r
Fo
res
t
ed
ge
Sm
all
fra
gm
en
tsA
NO
VA
Tre
e
infl
ue
nce
ind
ex
(Tii)
31
8.1
±3
.16
03
.3 ±
4.2
57
2.6
±4
.9F
2,42
=5
.08
p=
0.0
11
09
.1 ±
1.8
23
9.2
±2
.82
19
.0 ±
3.1
F2,
42=
5.8
0
p=
0.0
1
So
il o
rga
nic
ma
tter (
%)
7.7
±0
.59
.9 ±
0.5
16
.1 ±
1.0
F2,
42=
1.8
1
p=
0.1
83
.5 ±
0.3
4.4
±0
.44
.7 ±
0.5
F2,
42=
0.8
9
p=
0.4
2S
oil
mo
istu
re
(%)
13
.4 ±
0.5
15
.5 ±
0.7
19
.0 ±
0.9
F2,
42=
1.2
7
p=
0.2
9
7.2
±0
.31
0.3
±0
.58
.4 ±
0.4
F2,
42=
4.9
3
p=
0.0
1
pH
8.0
±0
.18
.0 ±
0.1
7.9
±0
.1F
2,42
=0
.75
p=
0.4
8
8.2
±0
.18
.2 ±
0.1
8.2
±0
.1F
2,42
=1
.19
p=
0.3
1C
:N1
0.4
±0
.59
.0 ±
0.3
9.5
±0
.4F
2,42
=0
.98
p=
0.3
89
.9 ±
0.5
9.3
±0
.49
.7 ±
0.5
F2,
42=
0.1
5
p=
0.8
6
TableS3.1Characteristicsofsoilscollectedinholmoakfragm
entedforestsinSpain,includedinthe
structuralequationmodels.Dataaremean±standarderror.Thefactor“canopycover”stronglyaffected
allvariableswithsignificanthighestvaluesundercanopyexceptinthecaseofpH.One‐wayANOVAtesting
the“matrixinfluence”factorwithineach“canopycover”levelisalsopresented(extractedfrom
Chapter2).

CAPÍTULO3
113
Table S3.2 Response of bacterial consumption of individual substrates to treecanopy coverage (C), agricultural matrix influence (MI), and its interaction (C xMI),insoilfromholmoakforestfragmentsinSpain.Significanteffectsarenotedinbold.Theeffectoffactorsissummarizedontheleftofthetable.
Factorial ANOVA
C MI C x MI
F P F P F P
2-Hydroxy benzoic acid 2.34 0.130 0.44 0.648 0.40 0.675
Gamma-hydroxybutyric acid 1.27 0.264 0.91 0.408 2.24 0.112
Alpha-ketobutyric acid 2.62 0.109 1.14 0.325 0.87 0.422
D-malic acid 0.80 0.374 0.09 0.915 1.23 0.296
L-phenylalanine 2.26 0.137 0.14 0.869 0.38 0.683
Alpha-cyclodextrin 11.65 <0.001 2.79 0.067 2.25 0.112 Glycogen 11.83 <0.001 1.21 0.305 0.58 0.561 Alpha-D-lactose 6.28 0.014 2.10 0.129 2.12 0.127 D-xylose 10.06 0.002 2.80 0.066 2.06 0.134
D-mannitol 10.98 <0.001 1.79 0.173 0.77 0.466
D-galactonic acid-gamma-lactone 13.53 <0.001 1.14 0.325 0.05 0.955
Itaconic acid 74.92 <0.001 1.62 0.204 1.62 0.205
L-threonine 6.31 0.014 0.82 0.444 0.56 0.574
Phenylethylamine 61.21 <0.001 0.56 0.571 0.51 0.601
Tween 40 33.54 <0.001 3.66 0.030 1.89 0.158
Tween 80 59.11 <0.001 6.15 0.003 0.76 0.471
D-cellobiose 29.95 <0.001 4.76 0.011 0.30 0.744
Beta-methyl-D-glucoside 32.39 <0.001 5.91 0.004 0.47 0.629
i-erythritol 27.73 <0.001 7.55 <0.001 1.63 0.201
N-acetyl-D-glucosamine 25.07 <0.001 4.60 0.013 0.18 0.837
D-glucosaminic acid 22.45 <0.001 3.27 0.043 0.10 0.906
Glucose-1-phosphate 23.35 <0.001 6.11 0.003 0.16 0.849
D,L-alpha-glycerol phosphate 7.92 0.006 5.72 0.005 0.27 0.765
D-galacturonic acid 44.92 <0.001 6.33 0.003 2.64 0.077
4-Hydroxy benzoic acid 46.01 <0.001 3.96 0.023 1.51 0.227
L-arginine 46.72 <0.001 3.80 0.026 1.19 0.310
L-asparagine 45.91 <0.001 6.63 0.002 0.24 0.785
L-serine 58.23 <0.001 6.18 0.003 0.24 0.786
Putrescine 40.46 <0.001 4.92 0.010 0.11 0.896
Pyruvic acid methyl ester 8.57 0.004 5.13 0.008 3.32 0.041
Glycyl-L-glutamic acid 36.73 <0.001 10.21 <0.001 6.36 0.003
Mat
rix
infl
uen
ce
Co
vera
ge
C x MI

DIRECTANDINDIRECTEFFECTSOFAGRICULTURALMATRIX
114
Table S3.3 Response of fungal consumption of individual substrates to treecanopy coverage (C), agricultural matrix influence (MI), and its interaction (C xMI),insoilfromholmoakforestfragmentsinSpain.Significanteffectsarenotedinbold.Theeffectoffactorsissummarizedontheleftofthetable.
Factorial ANOVA
C MI C x MI
F P F P F P
Pyruvic acid methyl ester 2.78 0.099 0.84 0.436 0.29 0.751
Alpha-cyclodextrin 1.8 0.184 1.14 0.325 0.11 0.896
D-glucosaminic acid 0.3 0.585 1.71 0.188 1.11 0.335
D,L-alpha-glycerol phosphate 0.16 0.691 1.02 0.365 1.08 0.345
D-galactonic acid-gamma-lactone 1.45 0.232 0.33 0.720 0.54 0.585
4-Hydroxy benzoic acid 2.08 0.153 0.34 0.713 0.06 0.942
Itaconic acid 0.29 0.591 2.32 0.104 0.52 0.599
Alpha-ketobutyric acid 3.02 0.086 0.72 0.492 1.43 0.245
L-phenylalanine 1.54 0.217 0.22 0.802 1.24 0.295
Phenylethylamine 0.57 0.453 2.40 0.097 0.68 0.509
Tween 40 24.8 <0.001 0.56 0.575 0.78 0.461
Tween 80 25.4 <0.001 0.78 0.460 0.47 0.628
Glycogen 26.7 <0.001 1.72 0.186 0.56 0.573
D-cellobiose 39.7 <0.001 2.92 0.059 0.55 0.576
Beta-methyl-D-glucoside 98.1 <0.001 1.37 0.259 1.12 0.331
D-xylose 44.8 <0.001 1.18 0.311 2.66 0.076
D-mannitol 19.8 <0.001 0.54 0.584 0.73 0.485
N-acetyl-D-glucosamine 35.1 <0.001 1.18 0.312 0.22 0.807
Glucose-1-phosphate 5.14 0.03 2.14 0.124 0.80 0.454
D-galacturonic acid 27.4 <0.001 1.07 0.349 1.14 0.326
2-Hydroxy benzoic acid 17.9 <0.001 1.79 0.173 0.52 0.597
D-malic acid 9.82 <0.001 0.72 0.491 0.12 0.890
L-arginine 14.8 <0.001 1.00 0.374 0.15 0.864
L-asparagine 19.3 <0.001 0.36 0.701 0.26 0.771
L-serine 36.1 <0.001 0.15 0.859 0.79 0.457
Putrescine 4.08 0.047 0.05 0.954 0.18 0.834
Alpha-D-lactose 13.4 <0.001 3.40 0.038 1.95 0.149
i-erythritol 73.2 <0.001 4.33 0.016 0.68 0.507
Glycyl-L-glutamic acid 21.7 <0.001 4.14 0.019 1.50 0.228
L-threonine 3.45 0.067 3.21 0.045 0.00 0.997
Gamma-hydroxybutyric acid 11.1 <0.001 4.53 0.013 3.17 0.047
Mat
rix
infl
uenc
e
C x MI
Cov
erag
e

CAPÍTULO3
115
B
act
eria
l ric
hne
ss (
S)
(2)
(3)
(4)
(5)
(6)
(7)
(8)
(9)
(10)
(1
1)
(12
) (1
3)
(14
) (1
5)
(16
) (1
7)
(18
)
(2)
Bac
teri
al s
truc
tura
l Sha
nnon
(H
) 0
.84
(3)
Bac
teri
al s
truc
tura
l eve
nn
ess
(ES)
0.0
2 0.
55
(4)
Fun
ga
l str
uctu
ral r
ich
ness
(S
) 0
.001
0.
01
0.0
01
(5)
Fun
ga
l str
uctu
ral S
han
non
(H
) 0
.13
0.0
7 -0
.08
0.7
2
(6)
Fun
ga
l str
uctu
ral e
venn
ess
(E
S)
0.1
8 0.
09
-0.1
2 0
.20
0.8
2
(7)
Bac
teri
al fu
nctio
nal
ric
hne
ss (
SS
) 0
.20
0.1
5 -0
.04
-0.0
3 0
.01
0.0
4
(8)
Bac
teri
al fu
nctio
nal
Sh
anno
n (S
H)
0.2
3 0.
26
0.1
4 -0
.12
-0.0
1 0
.09
0.5
2
(9)
Bac
teri
al fu
nctio
nal
eve
nnes
s (S
ES)
0.1
9 0.
24
0.1
7 -0
.11
-0.0
1 0
.08
0.2
5 0
.95
(10
) F
ung
al f
unct
ion
al r
ich
nes
s (S
S)
0.4
9 0.
40
-0.0
3 -0
.03
0.0
5 0
.09
0.3
4 0
.57
0.5
2
(11
) F
ung
al f
unct
ion
al S
han
non
(S
H)
0.4
8 0.
41
0.0
1 -0
.02
0.0
1 0
.03
0.2
9 0
.56
0.5
3 0
.95
(12
) F
ung
al f
unct
ion
al e
ven
ness
(S
ES)
0.1
8 0.
21
0.1
3 -0
.04
-0.1
4 -0
.16
-0.0
1 0
.25
0.2
7 0
.26
0.5
(13
) T
ree
influ
ence
ind
ex (
Tii)
0
.30
0.2
5 0
.00
-0.1
9 -0
.05
0.0
9 0
.45
0.4
8 0
.39
0.4
7 0
.49
0.3
4
(14
) S
oil
org
anic
ma
tte
r (%
) 0
.22
0.0
6 -0
.19
0.0
0 0
.02
0.0
4 0
.46
0.6
2 0
.55
0.5
4 0
.57
0.4
1 0
.43
(15
) S
oil
mo
istu
re (
%)
0.0
7 -0
.03
-0.1
2 -0
.07
0.0
7 0
.16
0.4
2 0
.66
0.6
0.4
1 0
.43
0.3
3 0
.43
0.8
3
(16
) S
oil
pH
-0
.26
-0.2
0 0
.01
-0.1
3 -0
.05
0.0
3 -0
.28
-0.5
-0
.46
-0
.47
-0
.5
-0.3
7 -0
.16
-0.7
4 -0
.56
(17
) C
:N r
atio
-0
.09
-0.1
6 -0
.16
0.2
1 0
.18
0.0
9 -0
.02
-0.0
3 -0
.03
-0.0
8 -0
.08
0.0
1 0
.02
0.2
5 0
.15
-0.0
6
(18
) P
C1
of n
utr
ien
ts P
CA
0
.54
0.4
4 -0
.01
-0.3
4 -0
.07
0.1
8 0
.25
0.1
9 0
.11
0.4
5 0
.42
0.1
3 0
.37
0.2
3 0
.07
-0.1
0 -0
.18
PC
2 o
f n
utri
ents
PC
A
0.1
1 0.
01
-0.1
2 0
.13
0.0
8 0
.01
0.4
3 0
.64
0.5
8 0
.49
0.5
1 0
.34
0.3
2 0
.90
0.7
6 -0
.71
0.1
0 -0
.07
TableS3.4Pearson’scorrelationsofstructuralandfunctionalcom
ponentsofbacterialandfungalcommunitiesand
characteristicsofsoilcollectedinopenareasorundercanopyoffragmentedholmoakforestsinSpain.Significanteffectsare
notedinbold.

DIRECTANDINDIRECTEFFECTSOFAGRICULTURALMATRIX
116
FigureS3.1Assemblageofbacterial(a,c)andfungal(b,d)communities,plottedbyNon‐metricmultidimensionalscaling(NMDS)usingquantitative(abundance)(a‐b)or qualitative (presence/absence) (c‐d) datasets, of soils collected at threeagriculturalmatrixinfluencelevels,undercanopyorinopenareas,infragmentedholmoak forests inSpain.Vector lengthanddirectionrespectivelyrepresent therelative magnitude of explained variation and that of a positive increase. Seeprobability values in Table S3.6. Only significant vectors are showed, p < 0.05.Coverage is represented by different colors: gray = under canopy (UC);white =openareas(OA).Soilprovenancesarerepresentedbydifferentsymbols:squares=forestinterioroflargefragments(Fi);circles=forestedgeoflargefragments(Fe);triangles=smallfragments(Sf).
-1.0 -0.5 0.0 0.5 1.0
NM
DS
2
-0.5
0.0
0.5
1.0UC-FiUC-FeUC-SfOA-FiOA-FeOA-Sf
a)
Mo
istu
re
Tree
influ
ence
pH
PC1 nutrients
PC
2 nu
trie
nts
Fe
ZnMnK
Cu
NaMo
MgTotal C
S
CaOrg
anic
C, SOM
PTot
al N
-1.0 -0.5 0.0 0.5 1.0
-1.0
-0.5
0.0
0.5
1.0
PC1 nutrients
Tree
influ
ence
b)
S
Ca
Total C
PTotal
N
Mg
Moi
stur
e
Cu
NaMn
KFe
Zn
NMDS 1
-1.0 -0.5 0.0 0.5 1.0
NM
DS
2
-0.5
0.0
0.5
1.0 c)
Tree
influ
ence
pH
PC1 nutrients
PC
2 nu
trie
nts
Fe
ZnMn
K
Cu
Na Mo
MgTotal C
S
Ca
Org
anic
C, SOM
PTot
al N
NMDS 1
-1.0 -0.5 0.0 0.5 1.0
-1.0
-0.5
0.0
0.5
1.0
PC1 nutrients
Tree
influ
ence
d)
S
Ca
PTotal N
, Organic C, S
OMMg
Mois
ture
CuNa
Mn
KFe
Zn
Total C
PC2 nu
trien
ts
Bacteria Fungi

CAPÍTULO3
117
Figure S3.2 Metabolic profile of bacterial (a,c) and fungal (b,d) communities,plotted by Non‐metric multidimensional scaling (NMDS) using quantitative(abundance) (a‐b) or qualitative (presence/absence) (c‐d) datasets, of soilscollected at three agricultural matrix influence levels, under canopy or in openareas, in fragmented holm oak forests in Spain. Vector length and direction,respectively,representtherelativemagnitudeofexplainedvariationandthatofapositiveincrease.SeeprobabilityvaluesinTableS3.7.Onlysignificantvectorsareshowed,p<0.05.Coverageisrepresentedbydifferentcolors:gray=undercanopy(UC); white = open areas (OA). Soil provenances are represented by differentsymbols:squares=forest interiorof largefragments(Fi);circles=forestedgeoflargefragments(Fe);triangles=smallfragments(Sf).
-1.0 -0.5 0.0 0.5 1.0
NM
DS
2
-0.6
-0.4
-0.2
0.0
0.2
0.4
0.6
Moisture
PC2 nutrients
SOM
Tree influence
pH
a)
Total CTotal NOrganic C
P
-1 0 1 2-1.5
-1.0
-0.5
0.0
0.5
1.0
1.5 b)
NMDS 1
-1.0 -0.5 0.0 0.5 1.0
NM
DS
2
-0.6
-0.4
-0.2
0.0
0.2
0.4
0.6
Moisture
SOM
Tree influence
c)
Total C
Total NP
PC2 nutrientsOrganic C
NMDS 1
-1 0 1 2-1.5
-1.0
-0.5
0.0
0.5
1.0
1.5
Tree influence
d)
Total C
Bacteria Fungi

DIRECTANDINDIRECTEFFECTSOFAGRICULTURALMATRIX
118
Qu
an
tita
tiv
e d
ata
se
tQ
ua
lita
tiv
e d
ata
se
t
Tw
o-w
ay
On
e-w
ay
Tw
o-w
ay
On
e-w
ay
Un
de
r
ca
no
py
Op
en
are
as
Fo
res
t
inte
rio
r
Fo
res
t
ed
ge
Sm
all
Un
de
r
ca
no
py
Op
en
are
as
Fo
res
t
inte
rio
r
Fo
res
t
ed
ge
Sm
all
CM
IC
x M
IM
IM
IC
CC
CM
IC
x M
IM
IM
IC
CC
n=
90
n=
90
n=
90
n=
45
n=
45
n=
30
n=
30
n=
30
n=
90
n=
90
n=
90
n=
45
n=
45
n=
30
n=
30
n=
30
Ba
cte
ria
l a
sse
mb
lage
F4
.62
14
.21
5.1
18
.36
11
6.3
74
.25
4.3
81
1.0
51
30
.49
15
.03
20
.64
24
.77
17
.68
9.5
31
3.4
9
P<
0.0
01
<0
.00
1<
0.0
01
<0
.00
1<
0.0
01
<0
.00
1<
0.0
01
<0
.00
1<
0.0
01
<0
.00
1<
0.0
01
<0
.00
1<
0.0
01
<0
.00
1<
0.0
01
<0
.00
1
R2
0.0
40
.22
0.0
80
.29
0.3
40
.19
0.1
30
.14
0.0
60
.33
0.1
60
.50
0.5
40
.39
0.2
50
.33
Fu
ng
al
ass
em
bla
geF
6.0
29
.31
3.8
25
.69
7.5
23
.87
3.5
26
.59
14
.93
29
.24
9.8
11
4.2
92
5.6
91
0.1
27
.73
15
.98
P<
0.0
01
<0
.00
1<
0.0
01
<0
.00
1<
0.0
01
<0
.00
1<
0.0
01
<0
.00
1<
0.0
01
<0
.00
1<
0.0
01
<0
.00
1<
0.0
01
<0
.00
1<
0.0
01
<0
.00
1
R2
0.0
50
.16
0.0
70
.21
0.2
60
.12
0.1
10
.19
0.0
80
.33
0.1
10
.41
0.5
50
.27
0.2
20
.36
Ba
cte
ria
l m
eta
bo
lic
pro
file
F1
5.8
92
.66
2.2
01
.77
2.7
97
.42
1.8
71
0.7
11
.49
1.9
51
.95
0.8
42
.35
3.0
1-0
.74
51
.41
P<
0.0
01
0.0
06
0.0
33
0.0
68
<0
.00
1<
0.0
01
0.1
01
<0
.00
10
.24
0.1
00
.08
0.5
70
.02
80
.02
0.9
90
.24
5
R2
0.1
50
.05
0.0
40
.08
0.1
20
.21
0.0
60
.28
0.0
20
.04
0.0
40
.04
0.1
00
.10
-0.0
30
.05
Fu
ng
al
me
tab
olic
p
rofi
le
F5
.64
1.1
60
.69
91
.02
20
.90
42
.30
92
.74
41
.88
45
.69
1.4
20
.97
1.2
71
.18
2.8
41
.79
3.0
P<
0.0
01
0.2
93
0.8
62
0.4
36
0.6
16
0.0
02
0.0
03
0.0
19
<0
.00
10
.18
50
.48
90
.25
30
.29
0.0
05
0.1
15
<0
.00
1
R2
0.0
60
.03
0.0
01
0.0
50
.04
0.0
80
.09
0.0
60
.06
0.0
30
.02
0.0
60
.05
0.0
90
.06
0.1
0
TableS3.5Non‐param
etricmultivariateanalysisofvarianceusingbothquantitative(abundance)andqualitative
(presence/absence)datasets,ofsoilm
icrobialcom
munityassemblageandmetabolicprofileofholmoakforestfragmentsin
Spain.Significanteffectsarenotedinbold.MI=Matrixinfluence(forestinterior,forestedge,smallfragm
ents);C=coverage
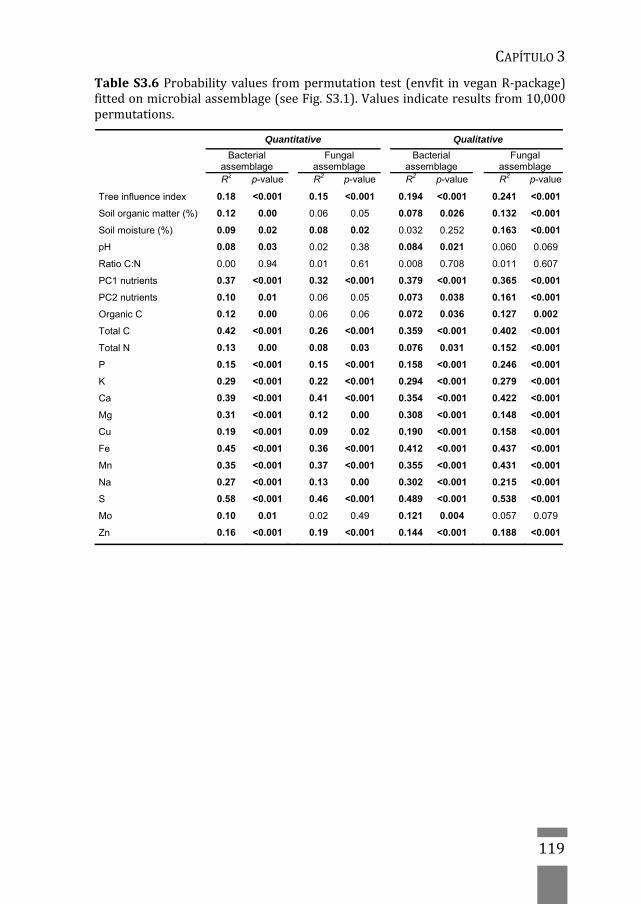
CAPÍTULO3
119
TableS3.6Probabilityvalues frompermutationtest (envfit inveganR‐package)fittedonmicrobialassemblage(seeFig.S3.1).Valuesindicateresultsfrom10,000permutations.
Quantitative Qualitative
Bacterial
assemblage Fungal
assemblage Bacterial
assemblage Fungal
assemblage
R2 p-value R2 p-value R2 p-value R2 p-value
Tree influence index 0.18 <0.001 0.15 <0.001 0.194 <0.001 0.241 <0.001
Soil organic matter (%) 0.12 0.00 0.06 0.05 0.078 0.026 0.132 <0.001
Soil moisture (%) 0.09 0.02 0.08 0.02 0.032 0.252 0.163 <0.001
pH 0.08 0.03 0.02 0.38 0.084 0.021 0.060 0.069
Ratio C:N 0.00 0.94 0.01 0.61 0.008 0.708 0.011 0.607
PC1 nutrients 0.37 <0.001 0.32 <0.001 0.379 <0.001 0.365 <0.001
PC2 nutrients 0.10 0.01 0.06 0.05 0.073 0.038 0.161 <0.001
Organic C 0.12 0.00 0.06 0.06 0.072 0.036 0.127 0.002
Total C 0.42 <0.001 0.26 <0.001 0.359 <0.001 0.402 <0.001
Total N 0.13 0.00 0.08 0.03 0.076 0.031 0.152 <0.001
P 0.15 <0.001 0.15 <0.001 0.158 <0.001 0.246 <0.001
K 0.29 <0.001 0.22 <0.001 0.294 <0.001 0.279 <0.001
Ca 0.39 <0.001 0.41 <0.001 0.354 <0.001 0.422 <0.001
Mg 0.31 <0.001 0.12 0.00 0.308 <0.001 0.148 <0.001
Cu 0.19 <0.001 0.09 0.02 0.190 <0.001 0.158 <0.001
Fe 0.45 <0.001 0.36 <0.001 0.412 <0.001 0.437 <0.001
Mn 0.35 <0.001 0.37 <0.001 0.355 <0.001 0.431 <0.001
Na 0.27 <0.001 0.13 0.00 0.302 <0.001 0.215 <0.001
S 0.58 <0.001 0.46 <0.001 0.489 <0.001 0.538 <0.001
Mo 0.10 0.01 0.02 0.49 0.121 0.004 0.057 0.079
Zn 0.16 <0.001 0.19 <0.001 0.144 <0.001 0.188 <0.001

DIRECTANDINDIRECTEFFECTSOFAGRICULTURALMATRIX
120
TableS3.7Probabilityvalues frompermutationtest (envfit inveganR‐package)fitted on metabolic profile (see Fig. S3.2). Values indicate results from 10,000permutations.
Quantitative Qualitative
Bacterial
metabolic profile Fungal
metabolic profile Bacterial
metabolic profile Fungal
metabolic profile
R2 p-value R2 p-value R2 p-value R2 p-value
Tree influence index 0.20 <0.001 0.03 0.22 0.129 0.002 0.073 0.036
Soil organic matter (%) 0.29 <0.001 0.02 0.41 0.104 0.015 0.044 0.143
Soil moisture (%) 0.33 <0.001 0.01 0.56 0.099 0.014 0.022 0.390
pH 0.19 <0.001 0.01 0.75 0.063 0.059 0.026 0.333
Ratio C:N 0.01 0.80 0.00 0.94 0.008 0.707 0.047 0.122
PC1 nutrients 0.03 0.23 0.06 0.08 0.060 0.073 0.054 0.089
PC2 nutrients 0.28 <0.001 0.02 0.49 0.082 0.025 0.053 0.100
Organic C 0.27 <0.001 0.02 0.43 0.096 0.019 0.040 0.175
Total C 0.28 <0.001 0.04 0.15 0.112 0.006 0.072 0.040
Total N 0.28 <0.001 0.02 0.45 0.098 0.017 0.042 0.158
P 0.16 <0.001 0.03 0.26 0.083 0.026 0.042 0.152
K 0.00 0.89 0.06 0.06 0.010 0.644 0.038 0.184
Ca 0.01 0.77 0.02 0.37 0.000 0.979 0.018 0.460
Mg 0.02 0.46 0.00 0.94 0.005 0.804 0.004 0.842
Cu 0.03 0.25 0.01 0.82 0.007 0.745 0.027 0.299
Fe 0.02 0.45 0.04 0.15 0.016 0.514 0.031 0.257
Mn 0.00 0.92 0.05 0.10 0.002 0.933 0.029 0.278
Na 0.00 0.94 0.02 0.45 0.011 0.634 0.014 0.553
S 0.03 0.28 0.04 0.17 0.021 0.414 0.041 0.159
Mo 0.00 0.83 0.01 0.64 0.008 0.716 0.006 0.774
Zn 0.02 0.45 0.02 0.53 0.023 0.354 0.017 0.462
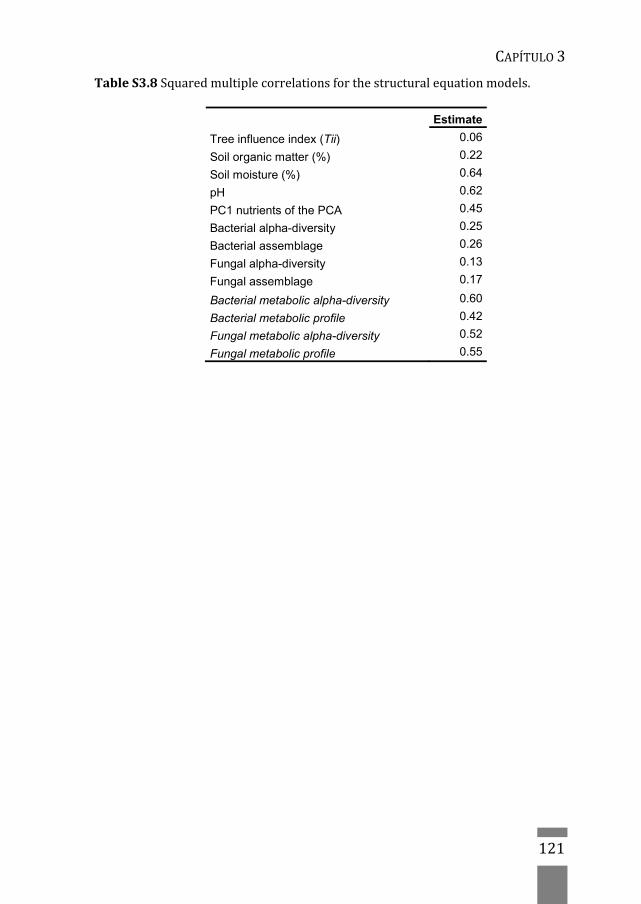
CAPÍTULO3
121
TableS3.8Squaredmultiplecorrelationsforthestructuralequationmodels.
Estimate
Tree influence index (Tii) 0.06
Soil organic matter (%) 0.22
Soil moisture (%) 0.64
pH 0.62
PC1 nutrients of the PCA 0.45
Bacterial alpha-diversity 0.25
Bacterial assemblage 0.26
Fungal alpha-diversity 0.13
Fungal assemblage 0.17
Bacterial metabolic alpha-diversity 0.60
Bacterial metabolic profile 0.42
Fungal metabolic alpha-diversity 0.52
Fungal metabolic profile 0.55

Capítulo4
Habitatfragmentationcanmodulatedroughteffectsontheplant‐soil‐
microbialsysteminMediterraneanholmoak(Quercusilex)forests
Published in: Flores‐Rentería, D., J. Curiel Yuste, A. Rincón, F. Brearley, J.García‐Gil and F. Valladares (2015). Habitat Fragmentation canModulateDroughtEffectsonthePlant‐soil‐microbialSysteminMediterraneanHolmOak(Quercus ilex)Forests.MicrobialEcology:1‐15.doi:10.1007/s00248‐015‐0584‐9


CAPÍTULO4
125
Abstract
Ecologicaltransformationsderivedfromhabitatfragmentationhaveledto
increased threats to above‐ground biodiversity. However, the impacts of
forestfragmentationonsoilsandtheirmicrobialcommunitiesarenotwell
understood.Weexaminedtheeffectsofcontrastingfragmentsizesonthe
structure and functioning of soil microbial communities from holm oak
forestpatchesintwobio‐climaticallydifferentregionsofSpain.Weuseda
microcosm approach to simulate the annual summer drought cycle and
first autumn rainfall (rewetting), evaluating the functional response of a
plant‐soil‐microbialsystem.Forestfragmentsizehadasignificanteffecton
physicochemicalcharacteristicsandmicrobialfunctioningofsoils,although
the diversity and structure of microbial communities were not affected.
Theresponseofourplant‐soil‐microbialsystemstodroughtwasstrongly
modulatedbythebioclimaticconditionsandthefragmentsizefromwhere
thesoilswereobtained.Decreasingfragmentsizemodulatedtheeffectsof
drought by improving local environmental conditions with higher water
andnutrientavailability.Howeverthismodulationwasstrongerforplant‐
soil‐microbialsystemsbuiltwithsoilsfromthenorthernregion(colderand
wetter) than for thosebuiltwith soils from the southern region (warmer
and drier) suggesting that the responsiveness of the soil‐plant‐microbial
system to habitat fragmentation was strongly dependent on both the
physicochemicalcharacteristicsofsoilsandthehistoricaladaptationofsoil
microbial communities to specific bioclimatic conditions. This interaction
challenges our understanding of future global change scenarios in
Mediterranean ecosystems involving drier conditions and increased
frequencyofforestfragmentation.

HABITAT FRAGMENTATION CAN MODULATE DROUGHT EFFECTS
126
Introduction
The impacts of global change disturbances are directly responsible for
increased rates of biodiversity loss,which are altering the functioning of
ecosystemsandaffectingimportantecosystemservices(IPCC,2007).Inthe
Mediterraneanbasin, forest fragmentation, resourceoverexploitation and
poor management are the main drivers of forest degradation, and their
impactsareexpectedtobeaggravatedbyclimatechange(Valladaresetal.,
2014). Habitat fragmentation negatively affects population size and/or
diversityoforganisms in largehabitats (reviewedbyDidhametal.1996,
Fischer and Lindenmayer 2007), although it is still not clear if it has a
consistent effect on biodiversity loss (Fahrig, 2003), since neutral (e.g.
microorganisms;Rantalainenetal.2008)orevenpositiveeffects (Dooley
and Bowers, 1998; Díaz et al., 1999) have also been reported. It is well
knownthatconsequencesofhabitatfragmentationarestronglydependent
uponthesizeoftheremainingarea(Fernándezetal.,2002;Lindenmayer
and Fischer, 2006), because of the complex processes related to edge
effects (Fernández et al., 2002), and resource constraints in smaller
fragments (Zanette et al., 2000). Most Mediterranean ecosystems have
historically suffered major transitions involving fragmentation due to
agricultural practices that transform the landscape dominated by forest
andshrublandsintoisolatedpatches(Valladaresetal.,2004),inaprocess
that is expected to become more frequent over the next century
(Millennium‐Ecosystem‐Assessment, 2005). Evidence of fragmentation
effects in Mediterranean ecosystems has been reported for a range of
differentorganismssuchasbirds,butterflies,plantsandmicroorganisms,
andincludesthedisruptionofbioticinteractionssuchaspollination,seed
dispersalandherbivory(SantosandTellería,1998;Díazetal.,1999;Díaz
andAlonso,2003;Lázaro‐Nogaletal.,2012;Valladaresetal.,2014).
The global climate is expected to change rapidly and deeply over
thenextcentury(IPCC,2007).Particularly intheMediterraneanbasin,an
increaseintemperatureof1.8°Cispredictedforthenext40years,coupled

CAPÍTULO4
127
withareductioninrainfallfrequencyof5‐10%withmoreintensedroughts
(IPCC, 2007). The functioning of Mediterranean ecosystems is largely
governedbythesoilwaterregime(Rambaletal.,2003;Barbaetal.,2013)
and reductions in soil water are very likely to cause a concomitant
reductionincarbonandwaterfluxes(OrchardandCook,1983;Reichstein
et al., 2002; Barba et al., 2013). The increased intensity of droughts in
recent decades has led to the reduction of tree productivity in the
MediterraneanBasin(OgayaandPeñuelas,2004;Barbaetal.,2013),andto
forest decline in some areas (Hereş et al., 2012). These global changes
directlyaffectplantcommunities,butalsosimultaneouslyandinteractively
affect the associated belowground microorganisms (Castro et al., 2010).
The changes in precipitation patterns can also affect soil nutrients and
carbon cycling by impacting upon the activity of microbial communities
(Barnard et al., 2013), although a considerable debate about how water
stress affects soil microbial communities and their overall activity still
exists(Williams,2007;Castroetal.,2010;Tresederetal.,2012).Relative
shifts in soil microbial communities depends on their different inherent
resistancestodrought(Schimeletal.,2007),withsoilbacterialcommunity
generally considered more sensitive than the fungal community
(Drenovskyetal.,2004;Williams,2007;Castroetal.,2010;CurielYusteet
al.,2011;Barnardetal.,2013).
Soils and theirmicroorganisms are essential for the performance
and regulation of global biogeochemical cycles (Wardle et al., 2004; de
Vries et al., 2012; Bahn et al., 2013); their activity is controlled by both
biotic and abiotic factors such as quantity and quality of litter inputs,
temperature, and moisture (Drenovsky et al., 2004; Castro et al., 2010;
Curiel Yuste et al., 2011; Evans et al., 2013; Göransson et al., 2013;
Fuchsluegeretal.,2014).Changesinsoilcommunitiesandthelossofsoil
biodiversity threaten the multifunctionality and sustainability of
ecosystems, with negative impact on plant diversity and nutrient cycling
and retention (Wagg et al., 2014), whereas a more diverse microbial

HABITAT FRAGMENTATION CAN MODULATE DROUGHT EFFECTS
128
community could be associated with higher resistance to disturbance
(Allison and Martiny, 2008). In parallel, microbial processes have been
related to variations in ecosystem properties, such as tree productivity
(Wardleetal.,2004;AllisonandMartiny,2008;Grigulisetal.,2013).
Most studies of habitat fragmentation have focused on above‐
ground organisms, while only a few have addressed effects of
fragmentationonsoilphysicochemicalcharacteristics,functioning(Lázaro‐
Nogal et al., 2012), or microbial structure (Rantalainen et al., 2008). In
Mediterranean gypsic soils, Lázaro‐Nogal et al. (2012) found that the
synergistic interactionbetweenhabitat fragmentationandhabitat quality
was negatively correlated with soil nutrients and enzymatic activity.
Results of simulated fragmentation from Rantalainen et al. (2008)
suggested that habitat fragmentation did not have a direct effect on soil
microorganisms. However, the effects of habitat fragmentation on the
plant‐soil‐microorganism system remain largely unknown and especially
theirinteractionwithdrought.
Our general objective was to study the impact of drought and
rewetting on the structure and functioning of microbial communities in
soils from twoclimaticallydifferent regionsand from forest fragmentsof
contrasting sizes in a microcosm experiment. To assess potential
interactions between fragmentation and climate, we explored the
physiological responses to drought of oak seedlings grown in soils from
contrasting fragment sizes. First, we hypothesized that physicochemical
characteristics of soils and theirmicrobial biomasswoulddiffer in forest
fragmentsofcontrastingsizes.Second,wehypothesizedthatthefunctional
response of the plant‐soil‐microbial system to climatic simulations
(drought and rewetting) would be determined by the particular initial
microbialcommunitiesandbiogeochemicalpropertiesassociatedwiththe
sizeofthefragment.

CAPÍTULO4
129
Materialandmethods
Soilprovenance
We selected three large (> 10 ha) and three small (< 0.5 ha) holm‐oak
(Quercus ilex L. ssp. ballota (Desf.) Samp; Fagaceae) forest fragments,
resulting fromtheconversiontoanagricultural landscape, located in two
climaticallydifferentregionsofcentralSpain(12forestfragmentsintotal).
Inthenorthernregion(Lerma;41°58’‐42°02’N,03°45’‐03°52’W;930masl)
the studied fragments were in an area of 1500 ha, they showed similar
characteristics inspatialstructureandvegetation,andwereseparatedby
atleast50mtoamaximumof11km(Fig.1.5ainChapter1).Thisregionis
characterized by 554 mm mean annual precipitation and 11 °C mean
annual temperature(Ninyerolaetal.,2005).Thedominant treespecies is
also holm oak,with isolated Lusitanian oakQuercus faginea and Spanish
juniper JuniperusthuriferaL.andunderstoryshrubstypicalofwetterand
cooler supramediterranean localities (e.g. Cistus laurifolius L., Genista
scorpius (L.)DC,Thymus zygisLoefl. ex L.; see Santos andTellería, 1998;
Díazetal.,1999,forfurtherdetails).Inthesouthernregion(Quintanarde
la Orden; 39°30’‐39°35’N, 02°47’‐02°59’W; 870 m asl), the studied
fragmentswereinanareaof1000ha,theyshowedsimilarcharacteristics
inspatialstructureandvegetation,andwereseparatedbyatleast50mto
amaximumof8km(Fig.1.5binChapter1).Thisregionischaracterizedby
434mmmean annual precipitation and 14 °Cmean annual temperature
(Ninyerolaetal.,2005).ThedominanttreeistheholmoakQ.ilexwiththe
understory composed of shrubby kermes oak Quercus coccifera L. and
shrubspeciestypicalofxericmesomediterraneanlocalities(e.g.Asparagus
acutifolius L., Cistus ladanifer L.,Rhamnus alaternus L.,Rhamnus lycioides
Brot.; see Santos and Tellería, 1998; Díaz and Alonso, 2003 for further
details). Both sites are characterized by a pronounced summer drought
period,usually lasting fromJulytoSeptember(Fig.1.7 inChapter1).The

HABITAT FRAGMENTATION CAN MODULATE DROUGHT EFFECTS
130
climaticcharacteristicsof the twostudyregionsarerepresentativeof the
mesomediterranean and supramediterranean bioclimatic zones of the
IberianPeninsula,respectively(Rivas‐Martínez,1981).Thedominantsoils
areclassifiedasCambisols(calcics)(WRB,2007),sandyloamtexture,with
17%sand,39%siltand44%clayforthesouthernregionand,11%sand,
42%siltand47%clayforthenorthernregion.Inbothregions,theoriginal
forest is now highly fragmented due to land conversion for intensive
cultivationofcerealcrops,legumes,andsomegrapes(SantosandTellería,
1998;DíazandAlonso,2003).Remnantsofforestswereleftbetweencrops
andnoware imbibed in theagriculturalmatrix,yetclearlydifferentiated.
Trees within large fragments were homogeneously distributed with low
tree density, while the small fragments consist of at least four trees and
withahightreedensity(authors’personalobservations).
Soilsampling
We selected four trees with basal area of ~500‐600 cm2 within each
fragmentandregionwithsixfragmentsineachregion,making48treesin
total.Foursoilsamplesweretakeninfourorientationsunderthecanopyof
eachtreetoadepthof0‐15cm,andcombinedtoasinglesamplepertree.
Soilswere collected at the endof thedry season.Once in the laboratory,
soilsweresieved(<2mm),andair‐driedfortwoweeks.AcornsofQ. ilex
werecollectedfromthesouthernregion.
Soil physicochemical characteristics and microbial biomass were
measured inall replicatesofeach fragmentsize. Since the levelof spatial
heterogeneity of soils at very small spatial scales would have blurred
functional differences among fragments of contrasting size, and due to
practical limitations of the experiment, conditions were standardised by
combiningsoilsintocompositesamplesofsmallandlargefragmenttypes
from each bioclimatic region; thus we finally obtained a total of four

CAPÍTULO4
131
treatments: two factors (region and fragment size) with two levels each
(region:northernandsouthern;fragmentsize:largeandsmall).
Soilabioticcharacteristicsandmicrobialbiomass
Physicochemical soil characteristics and microbial biomass were
determined on air‐dried soils, for all 48 soil samples. Water holding
capacityof soilswasdeterminedbysoaking the samples inwater for2h
andthendrainingfor24hinahumidenvironment.Soilaggregatestability
wasdeterminedon2mmaggregatesbyawater‐droptest(ImesonandVis,
1984)usingatleast20aggregatesperreplicate.SoilpHwasdeterminedin
awaterslurry(1:5w/vinH2O);soilorganicmatter(SOM)wasassessedby
loss on ignition at 400 °C for 4 hours. OrganicNwas determined by the
Kjeldahlmethod (Bremner, 1960).Availablephosphoruswasdetermined
bytheBurriel‐Hernandoextractionmethod(BurrielandHernando,1950),
andK+,Ca2+,Na+andMg2+wereextractedwithammoniumacetate(1M,pH
7) and subsequently determined by inductively coupled plasma
spectrometry (Optima 4300DV, Perkin‐Elmer, Waltham, USA). Microbial
biomass carbonwasdeterminedby the chloroform fumigation‐extraction
methodmodifiedbyGregorichetal.(1990).
Experimentaldesign
Two‐litrepotswerefilledwithamixtureof5:1soil:perlite(v:v).Randomly
selectedholmoakacorns fromthesouthernregionweresoaked inwater
for24hbeforeplanting.Potswererandomlyarrangedin thegreenhouse
(25 °C and 40 % air humidity), and regularly watered to field capacity
basedonweightloss(between35‐45%soilwatercontent).Otherseedlings
that eventually germinated were carefully removed from the pots. We
established three experimental periods during the dry‐rewetting
simulation:1)pre‐droughtwithseedlingsgrowinginwell‐wateredpotsfor
80 days; 2) drought for 55 dayswith nowater supply (the droughtwas
HABITAT FRAGMENTATION CAN MODULATE DROUGHT EFFECTS
132
terminatedwhenseedlingsstartedtodie);and3)twodaysafterrewetting,
aboveground biomass was harvested and pots were watered to field
capacity.Wethenmeasuredthewaterpotentialoftheharvestedseedlings.
Intermediatenon‐intrusivemeasureswerecarriedoutasindicatedbelow.
Seedlinggrowthandphysiologicalvariables
Seedling height and diameter were recorded every fifteen days (seven
seedlings for southern large and northern small fragments, and eight
seedlings for southern small and northern large fragments; 30 in total).
Physiologicalvariableswererecordedat thesametime interval: stomatal
conductance (gs) was measured with a leaf porometer SC‐I (Decagon,
Pullman,USA),duringtheperiodofmaximalconductance(10:00‐12:00h).
PredawnandmiddaymaximumphotochemicalefficiencyofphotosystemII
(Fv/Fm)weremeasuredwithaportablepulse‐modulatedfluorometerFMS2
(Hansatech,Norfolk,UK),forwhichtheleaveswerepreviouslyheldinthe
leafclipholderfor30min.FinalSpecificLeafArea(SLA)wasdetermined
asleafarea(determinedwithanopticalscanner)pergramdrymass.Final
predawnstemwaterpotentials(ΨPD)weredeterminedwithaScholander
pressurechamber(Scholanderetal.,1965).
Soilmicrobialcommunityactivityandfingerprintingprofiles
Three pots per treatment were selected for collection of soil samples at
pre‐drought, drought and after rewetting (12 soil samples per condition;
36intotal),whichwerestoredat4°Cforamaximumoftwoweeksor‐20
°Cforsubsequentenzymaticandmolecularanalyses,respectively.Theacid
phosphataseactivity(phosphoricmonoesterhydrolases,EC3.1.3.2)assay
wasbasedonthedetectionofp‐nitrophenol(PNP)releasedafter0.5gof
soilwasincubatedin0.1MmaleatebufferatpH6.5(37°C,90min)withp‐
nitrophenyl phosphate disodium as substrate (Tabatabai, 1994). The
urease activity (amidohydrolase, EC 3.5.1.5) assay was based on the

CAPÍTULO4
133
detectionofNH4+releasedafter0.5gofsoilwasincubatedin1Mphosphate
bufferatpH7(30°C,90min)with1Mureaasasubstrate(Nannipierietal.,
1980).
Communitystructureofsoil fungalandbacterialcommunitieswas
assessed by the DNA community fingerprinting technique of denaturing
gradient gel electrophoresis (DGGE). Soil DNA was extracted with the
MoBio Powersoil DNA isolation kit (Solana Beach, USA), and yields
assessedbyelectrophoresisat80Vona1.2%agarosegel.For fungi, the
internal transcribed spacer nrDNA region ITS‐1was PCR‐amplified using
the primer pair ITS1‐F/ITS2 (Gardes and Bruns, 1993). The universal
primers338F/518Rwereusedforamplificationofthebacterial16SrRNA
gene(Muyzeretal.,1993).AGCclampwasaddedtothe5’endofforward
fungal (ITS1‐F) and bacterial (338F) primers to stabilize the melting
behaviourof theDNAfragments(Muyzeretal.,1993).PCRswerecarried
out on a PTC‐200Thermocycler (MJResearch,Massachusetts,USA),with
50μlofreactionmixturecontaining10xNH4reactionbuffer,2and1.5mM
MgCl2(forfungiandbacteria,respectively),0.2mMtotaldNTPs,2.5UTaq
(Bioline, London, UK), 1 μM of each primer, 0.5 μl of 10 mgml‐1 bovine
serum albumin (BSA) and 50 ng of template DNA, determined using a
Nanodrop2000c(ThermoFisherScientific,Wilmington,USA).PCRcycling
parameterswere:94°Cfor5min,followedby35cyclesof94°Cfor30s,
55°Cfor30or45s,and72°Cfor30or45s,withafinalextensionat72°C
for 5 or 10 min (for fungi and bacteria, respectively). Negative controls
(with ultrapurewater instead ofDNA)were included in eachPCR.DGGE
wascarriedoutonaDCodeuniversalmutationdetectionsystem(Bio‐Rad,
HemelHempstead,UK); using10%polyacrilamide gels,withdenaturant
urea‐formamidegradientsof10‐50%forfungi(Andersonetal.,2003)and
40‐55%forbacteria(Grossmanetal.,2010),withtheconcentrationsof7
M urea and 40 % formamide (v/v) for the 100 % denaturant.
HABITAT FRAGMENTATION CAN MODULATE DROUGHT EFFECTS
134
Electrophoreseswere run at 60 °C 75V for16h and14h, for fungi and
bacteria respectively, loading equal volumes of amplifiedDNA.Gelswere
stainedwithSYBRGoldnucleic acid stain (MolecularProbes, Leiden,The
Netherlands) and digitized using an InGenius3 Imaging System and
Genesnap6.08 (Syngene,Cambridge,UK).DGGE fingerprintprofileswere
analyzedwith aKODAK1D ImageAnalysis software (EastmanKodakCo.
2000; Rochester, NY, USA). Bands were adjusted with a Gaussianmodel
with a profile width of 80%. Noise was eliminated by removing bands
below a 10% band peak intensity threshold. Species delimitation can be
contended, especially taking into account the inherent limitations of the
differentanalyticalmethods, suchas in thecaseofDGGEwhereaunique
banddoesnotnecessarilyrepresentauniquespeciesandonespeciescan
be represented by multiple bands on the gel (Cleary et al., 2012; Vaz‐
Moreira et al., 2013). Consequently, each band of the DGGE profile is
hereafterreferredtoasanoperationaltaxonomicunit(OTU)ratherthana
species.Althoughthisisasimplificationoftherealtaxonomicdiversityof
soil microbes, it allowed us to comparatively investigate differences and
changesinthemicrobialcommunitystructurewithrespecttothestudied
factors.Gelbandswereanalyzedbyusinginternalreferencebands(bands
presentinalllanes),andknownreferencemarkersloadedinlanesateither
side of the gel. The number and pixel intensity of bands in a particular
samplewereconsideredcomparativeproxiesofrichnessandproportional
abundance of fungal or bacterial OTUs, respectively (Cleary et al., 2012).
Similar analysis of DGGE banding patterns have been previously used in
other studies (Andersonet al., 2003;Farnleitner et al., 2004;Gafanet al.,
2005;Clearyetal.,2012;Suzukietal.,2012;Vaz‐Moreiraetal.,2013).
Plant‐soilsystemCO2exchange
Netecosystemexchange(NEE),definedasthenetbalancebetweenGross
Primary Productivity (GPP) and Ecosystem Respiration (Reco), was

CAPÍTULO4
135
measured for each individual plant‐soil microcosm using a non‐steady‐
statedynamic(closeddynamic)approach.Forthatpurpose,arectangular
plexiglaschamberwithabaseof0.01m2andavolumeof0.0024m3witha
smallfantomixtheairinternallywasbuilttofitoverthemicrocosms(Fig.
S4.1).ThechangeinCO2concentrationswasmeasuredwithaCO2infrared
gas analyzer (EGM‐4, PP‐systems, MA, USA). The chamber was covered
with aluminium foil to determine ecosystem respiration (Reco) including
both autotrophic (plants) and heterotrophic (microorganisms)
components.Respirationratesweremeasuredinboththetransparentand
the aluminium chamber for 52 s before the simulated drought and then
every 15 days. During the drought simulation, diurnal CO2 exchange
measurementsweretakeninallmicrocosmsfourtimesperday(7:00‐9:00
h, 11:00‐13:00 h; 14:00‐16:00 h; 18:00‐20:00 h). Soil respiration was
determined 3, 24 and 48 h after rewetting, only at 14:00‐16:00 h,which
wastheperiodwherethemaximumactivitywaspreviouslyobserved.
NEE (transparent chamber) and Reco (opaque chamber) were
determinedbycalculatingtheCO2increaseintheclosedloop(seeFig.S4.1)
in the respective measurements according to the formula (Street et al.,
2007):ρ∗ ∗
,whereIcisthenetCO2increase(μmolm‐2s−1),isair
density(molm‐3),Vthechambervolume(m3),dC/dtrepresentstheslope
ofCO2 concentration increase in the chamberover time (μmolmol−1 s−1),
andA isthechambersurfacearea(m2).Grossprimaryproductivity(GPP)
was calculated by subtracting Reco from NEE. The maximum difference
between atmospheric (Ca) and internal CO2 (Ci) was used to correct for
chamberleaksusingalinearequation(Pérez‐Priegoetal.,2010).
Dataanalysis
The effects of fragment size (largeor small), region (northor south) and
condition(pre‐drought,droughtorrewetting)andtheirinteractionswere

HABITAT FRAGMENTATION CAN MODULATE DROUGHT EFFECTS
136
analyzedbythree‐wayAnalysisofVariance(ANOVA),withpotasarandom
effect.Theeffectoffragmentsizeandregiononsoilabioticcharacteristics,
microbial biomass and final seedling measurements (height, diameter,
biomass,root/shootratio,SLA,waterpotential)wereanalyzedbytwo‐way
ANOVAs. Repeated‐measures ANOVAswere used to test the effect of the
samefactorsduringthedroughtincontinuouslymeasuredvariables(plant
physiology and soil moisture). The analysis of survival percentages was
carriedoutwithaPetoandPetotestusingX2(PykeandThompson,1986).
The diversity of both bacterial and fungal communities was
estimated from the number and intensity of bands (OTUs). Richness (S),
Shannon (H’) and evenness (EH) diversity indexes were calculated as
follows:Shannon ′ ∑ ∙ ∙ ;Evenness ′
whereniisthebandintensity,Nisthesumofallintensitiesofasampleand
S is the number of bands of a sample (richness). Principal component
analysis (PCA) was conducted to reduce the n‐dimensional DGGE data
obtainedforeachsampleintolinearaxesexplainingthemaximumamount
of variance, using the relative intensity of the bands obtained from the
DGGE.WeusedthefirsttwoprincipalcomponentsofthePCAtodefinethe
structure of bacterial and fungal communities (Suzuki et al., 2012).With
thescoresoftheprincipalcomponentsofthePCAweexploredtheeffectof
soilmoistureoverthestructureofsoilmicrobialcommunitiesusingthree‐
way ANOVAs with the same factors as above, except the condition (soil
moisture)whichwastestedbypairs(pre‐droughtvsdroughtanddrought
vsrewetting).Inallcases,potwasusedasarandomeffectandTukey’stest
was used for post‐hoc multiple comparisons to determine significant
differences.
Weperformed two correlation analyses: 1)Pearson’s correlations
(calculatedto investigatetheunivariaterelationsbetweenvariables);and
2) stepwisemultiple regressions to studywhichmeasuredvariables best

CAPÍTULO4
137
explained themicrobial diversity and variations in community structure.
Toperformstepwisemultipleregressionsfirstwereducedthenumberof
explanatoryvariablestofour,eliminatingredundantvariables(correlation
among explanatory variables; see Table S4.1), and by choosing those
variables that generated the highest Pearson’s coefficients. A sequential
Bonferronicorrectionwasused toaccount formultiplecomparisons(Hill
andLewicki,2005).Simplelinearregressionswereruntoanalyzemoisture
sensitivityofcarbonfluxes.Allvariablesweretestedfornormality,andlog
transformationswereappliedwhenrequired(GPP,Recoandsoilmoisture),
priortoanalyses.STATISTICA8.0(StatSoft,Inc.2007;TulsaOK,USA)was
usedforperformingallanalyses.

HABITAT FRAGMENTATION CAN MODULATE DROUGHT EFFECTS
138
Results
Soilcharacteristics
Ingeneral,thephysicochemicalcharacteristicsofsoilswerehighly
affected by fragment size and less by bioclimatic region (i.e. northern or
southern).Soilsfromsmallerfragmentsshowedhigherwaterholdingand
cation exchange capacities, as well as higher Mg2+, Ca2+ and Na+
concentrations compared with soils from larger fragments (Table 4.1).
ConcentrationofSOM,nitrogenandphosphoruswerehigherinsoilsfrom
small than from large fragments, and also higher in the northern region
comparedtothesouthernone;whereasK+washigherinsmall fragments
and in the southern region (Table 4.1). Soils from the northern region
presented a significantly less alkaline pH and more stable aggregates in
comparisonwiththosefromthesouthernregion.Asignificant interaction
between fragment size and region on soil microbial biomass was also
detected (Table 4.1), showing thatmicrobial biomasswas highest in soil
from large fragments from the northern region. SOM was strongly
correlatedwithcationexchangecapacity,organicnitrogenandCa2+(Table
S4.1),aswellaswithwaterholdingcapacity(R2=0.89p<0.001).
During thedroughtsimulation, soils fromsmall fragmentsofboth
regions showedhigher soilmoisture (F10, 260= 3.7;p<0.001), compared to
soils from large fragments, particularly those from the northern region
(Fig.S4.2andTableS4.2).
Soilmicrobialdiversity
Significant interactions among condition, region and fragment size was
observedinbothfungalrichnessanddiversity(TableS4.3),mainlydriven
by large fragments from the southern region with the highest values of
bothvariablesatpre‐droughtandafterrewetting(Fig.4.1aandb).

CAPÍTULO4
139
Table4.1.Physicochemicalcharacteristicsofsoilsfromtwoclimaticallydifferentregions and two fragment sizes of holm oak forest in Spain. Data = mean (SE)(n=12). The effect of factors is summarized on the left of the table. SOM = soilorganic matter; CEC=cation exchange capacity. Significant differences (P<0.05)betweenmaineffectsareindicatedwithcapital letters(amongregion)andlowercaseletters(amongfragmentsize).
Similarly,significant interactionsbetweencondition, regionand fragment
size were observed for bacterial richness and between condition and
region forbacterialdiversity (Table S4.3).Both interactions showedvery
similarpatterns: a significantdecreaseofbacterial richnessanddiversity
during drought, and a partial recovery after rewetting (Fig. 4.1d and e),
beenmoreevidentinsoilsfromthenorthernregion.
Northern region Southern region
Large
fragment
Small
fragment
Large
fragment
Small
fragment
Fragment
effect
Water holding capacity (%) 40.1A,b
(2.4)
49.8A,a
(2.2)
38.9A,b
(0.9)
45.2A,a
(1.6)
CEC (cmolcKg-1) 26.5A,b
(4.3)
39.5A,a
(3.2)
27.6A,b
(1.5)
35.7A,a
(2.3)
Mg2+ (cmolcKg-1) 1.4A,b
(0.1)
2.5A,a
(0.2)
1.6A,b
(0.1)
3.1A,a
(0.5)
Ca2+ (cmolcKg-1) 24.2A,b
(4.1)
35.6A,a
(2.9)
24.5A,b
(1.4)
30.5A,a
(1.8)
Na+ (cmolcKg-1) 0.04A,b
(0.004)
0.07A,a
(0.01)
0.05A,b
(0.003)
0.07A,a
(0.01)
SOM (%) 12.1A,b
(1.9)
19.8A,a
(2.4)
10.3B,b
(0.7)
14.1B,a
(1.8)
N organic (%) 0.4A,b
(0.1)
0.8A,a
(0.1)
0.3B,b
(0.02)
0.5B,a
(0.1)
Region
effect
P2O5 (mg Kg-1) 13.8A,b
(1.0)
34.4A,a
(4.2)
2.5B,b
(0.4)
16.5B,a
(1.7)
K+ (cmolcKg-1) 0.9B,b
(0.14)
1.7B,a
(0.1)
1.5A,b
(0.1)
2.0A,a
(0.1)
pH 7.1B,a
(0.3)
7.3B,a
(0.1)
7.9A,a
(0.04)
7.9A,a
(0.03)
Aggregate stability (%) 56.9A,a
(3.1)
57.1A,a
(4.0)
47.8B,a
(3.7)
49.1B,a
(2.9)
Microbial biomass
(mg C kg -1)
1013.4a
(6 6.9)
625.1b
(96.7)
621.6b
(29.6)
725.4ab
(41.3)
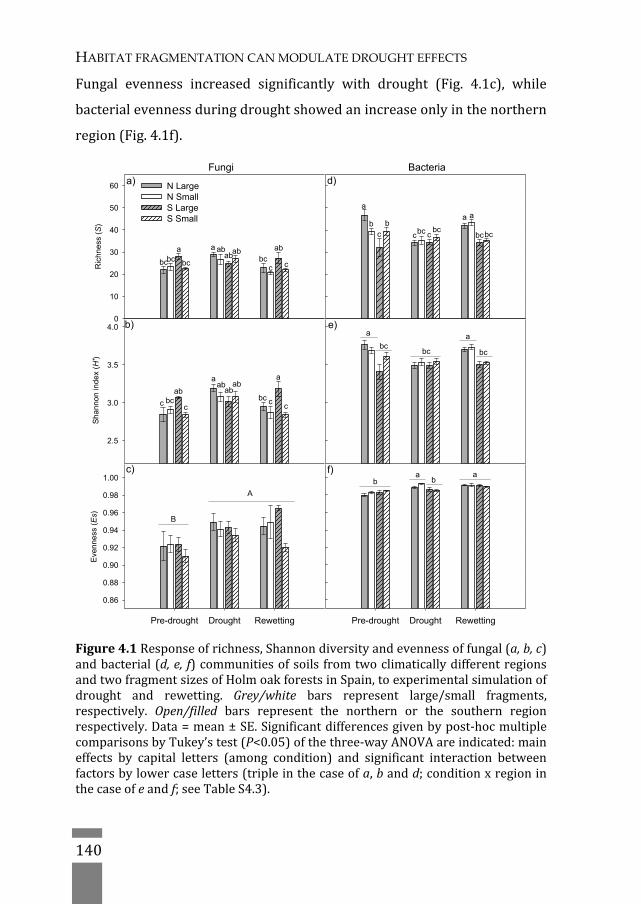
HABITAT FRAGMENTATION CAN MODULATE DROUGHT EFFECTS
140
Fungal evenness increased significantly with drought (Fig. 4.1c), while
bacterialevennessduringdroughtshowedanincreaseonlyinthenorthern
region(Fig.4.1f).
Figure4.1Responseofrichness,Shannondiversityandevennessoffungal(a,b,c)andbacterial(d,e, f)communitiesofsoils fromtwoclimaticallydifferentregionsandtwofragmentsizesofHolmoakforestsinSpain,toexperimentalsimulationofdrought and rewetting. Grey/white bars represent large/small fragments,respectively. Open/filled bars represent the northern or the southern regionrespectively.Data=mean±SE.Significantdifferencesgivenbypost‐hocmultiplecomparisonsbyTukey’stest(P<0.05)ofthethree‐wayANOVAareindicated:maineffects by capital letters (among condition) and significant interaction betweenfactorsbylowercaseletters(tripleinthecaseofa,bandd;conditionxregioninthecaseofeandf;seeTableS4.3).
Sha
nno
n in
dex
(H')
2.5
3.0
3.5
4.0
Ric
hnes
s ( S
)
0
10
20
30
40
50
60
Pre-drought Drought Rewetting
Eve
nnes
s ( E
s)
0.86
0.88
0.90
0.92
0.94
0.96
0.98
1.00
N LargeN SmallS LargeS Small
c)
Pre-drought Drought Rewetting
f)
a
c c
Fungia)
Bacteriad)
b
a aab
abab
bc bc cc c c
ab
bcaba
abab
bcbcbc
e)b)
ab
aaa
b bc bcbcc
bccbc
abc
bcbc
a
ab
a
B
A

CAPÍTULO4
141
ThefirsttwoPCAcomponentsexplained20.5%ofthetotalvarianceinthe
fungal community composition (Fig. 4.2a). The pre‐drought fungal
community was strongly influenced by region, but not by fragment size
(Table4.2).Ahighvariabilitywasobservedinthefungalcommunityfrom
the northern region (Fig. 4.2a). Under drought, an interaction between
drought and region was observed (Table 4.2, Fig. 4.2a). Once soils were
rewetted, the fungal community structure was significantly affected by
region and fragment size (Table 4.2, Fig. 4.2a). In the case of bacterial
communitycomposition,thefirsttwoPCAcomponentsexplained33.2%of
thetotalvariance(Fig.4.2b).Neitherregionnorfragmentsizeaffectedthe
structure of the pre‐drought bacterial community (Table 4.2, Fig. 4.2b).
Bothdroughtandrewettingledtoasignificantseparationofthestructure
ofbacterialcommunitiesfromdifferentregions,accordingtotheprincipal
component 1 of the PCA (Table 4.2, Fig. 4.2b). Fragment size and its
interactionwith drought and rewetting hadno significant effect over the
structureofmicrobialcommunities.
Enzymaticactivity
Significant interaction between all factors (condition x region x fragment
size) was observed for urease activity, with higher activity in soils from
small fragments of the southern region at pre‐drought (Fig. 4.3a), but
higheractivity insoil fromsmall fragmentsof thenorthernregionduring
simulateddrought and rewetting. Forphosphataseactivity, fragment size
showedasignificantmaineffect(F1,1=9.53;p=0.005)withhigheractivity
in soils from small fragments (Table S4.3). Additionally, a significant
interactionbetweenconditionandregionwasobserved,whereactivity in
soils from the northern region decreased significantlywith drought (Fig.
4.3b); whereas activity in soils from the southern region remained very
similarduringtheexperiment.

HABITAT FRAGMENTATION CAN MODULATE DROUGHT EFFECTS
142
Figure4.2Principalcomponentanalyses(PCA)forsoilfungal(a)andbacterial(b)communities of soils from two climatically different regions and two fragmentsizes of holm oak forests in Spain, and exposed to experimental drought andrewetting simulations. Soil treatments are represented by different symbols:circles = large fragments from the northern region; inverted triangles = smallfragmentsfromthenorthernregion;squares=largefragmentsfromthesouthernregion; diamonds = small fragments from the southern region. Simulatedexperimentalconditionsarerepresentedbydifferentcolours:white=pre‐drought(Pre‐Dro);grey=drought(Dro);black=rewetting(Rew).Errorbars=SE.
PC 1 (17.4%)
-8 -6 -4 -2 0 2 4 6
PC
2 (
15.8
%)
-8
-6
-4
-2
0
2
4
6
8PC 1 (11.4%)
-10 -8 -6 -4 -2 0 2 4 6
PC
2 (
9.2
%)
-8
-6
-4
-2
0
2
4a)
b)
N Large-DroN Small-DroS Large-DroS Small-Dro
N Large-RewN Small-RewS Large-RewS Small-Rew
N Large-Pre-DroN Small-Pre-DroS Large-Pre-DroS Small-Pre-Dro

CAPÍTULO4
143
Table4.2.Responseoffungalandbacterialcom
munitycomposition(firsttwocomponentsofPCAanalyses)to
thefactorsregion,fragmentsizeanddroughtatdifferentexperimentalphases:pre‐drought,droughtand
rewettingsimulations,insoilsfrom
twoclimaticallydifferentregionsandtwofragmentsizesofholmoakforest
inSpain.DatawereanalysedbythreewayANOVA(n=6),andsignificanteffectsarenotedinbold(*<0.05;**<
0.01;***<0.001).PC1=firstcom
ponentandPC2=secondcom
ponentofPrincipalCom
ponentAnalysis(PCA).
F
un
ga
l (2
0.5
%)
B
acte
ria
l (3
3.2
%)
P
C1
(1
1.4
%)
P
C2 (
9.2
%)
P
C1 (
17.4
%)
P
C2 (
15.8
%)
P
F
P
F
P
F
P
F
Dro
ug
ht
(D)
<0
.001
***
63
.22
0.5
15
0.4
4
<
0.0
01
***
539
.49
<0
.001
***
81.8
52
Re
gio
n (
R)
0.1
55
2
.23
0.0
70
3.7
7
0.4
21
0
.68
5
0.2
96
1
.17
3
Fra
gm
en
t siz
e (
F)
0.2
80
1
.25
0.0
30
* 5.6
7
0.3
11
1
.09
7
0.8
07
0
.06
2
D x
R
0.0
01
**
16
.09
0.2
03
1.7
6
0.0
25
* 6
.17
8
0.1
88
1
.90
2
D x
F
0.1
56
2
.21
0.2
50
1.4
2
0.9
11
0
.01
3
0.3
69
0
.85
5
R x
F
0.1
61
2
.16
0.4
33
0.6
5
0.2
37
1
.52
1
<
0.0
01
***
37.1
34
D x
R x
F
0.0
98
3
.09
0.1
47
2.3
2
0.0
17
* 7
.21
4
0.0
04
**
11.1
55
Re
wett
ing
(R
w)
<0
.001
***
90
.87
<0.0
01
***
17.0
5
<
0.0
01
***
85.5
9
<
0.0
01
***
62
9.0
44
Re
gio
n (
R)
0.0
07
**
9.7
3
0.6
86
0.1
7
<
0.0
01
***
29.0
8
0.0
53
4
.40
5
Fra
gm
en
t siz
e (
F)
0.0
34
* 5
.39
<0.0
01
***
23.2
0
0.2
95
1
.17
5
0.4
49
0
.60
2
Rw
x R
0.0
29
* 5
.78
0.0
54
4.3
2
0.3
98
0
.75
8
0.0
02
**
13.2
69
Rw
x F
0
.15
0
2.2
9
0.1
29
2.5
5
0.6
25
0
.24
9
0.7
29
0
.12
3
R x
F
0.7
50
0
.10
0.0
24
* 6.2
4
0.0
24
* 6
.28
7
0.0
05
**
10.8
33
Rw
x R
x F
0
.76
1
0.0
9
0.5
89
0.3
0
0.0
12
* 8
.06
8
0.0
19
* 6
.88
5

HABITAT FRAGMENTATION CAN MODULATE DROUGHT EFFECTS
144
Figure4.3Enzymaticactivities:urease(a)andphosphatase(b)ofsoilsfromtwoclimaticallydifferentregionsandtwofragmentsizesofholmoakforestsinSpain,andexposedtoexperimentaldroughtandrewettingsimulations.Grey/whitebarsrepresent large/small fragments respectively. Open/filled bars represent thenorthern or the southern region, respectively. Data = means ± SE. Significantdifferencesgivenbypost‐hocmultiplecomparisonsbyTukey’stest(P<0.05)ofthethree‐way ANOVA are indicated: main effect of fragment size in phosphataseactivity (not represented), and significant interaction between factors by lowercase letters (triple in the case of urease; condition x region in the case ofphosphatase;seeTableS4.3).
Netecosystemexchangeinplant‐soil‐microbialsystem
In the plant‐soil‐microbial system, themain component of net ecosystem
exchange(NEE)wasecosystemrespiration(Reco),withalowercontribution
of gross primary productivity (GPP; Fig. 4.4). Drought caused an overall
significant decrease in both Reco and GPP (Fig. 4.4a and b, respectively;
Table S4.4). A consistent significant interaction between region and
fragmentsizewasdetected,showingthatthesoilsfromsmallfragmentsof
the northern region had higher Reco, during the drought simulation (Fig.
4.4a; Table S4.4). A significant interaction between time, region and
fragmentsizewasobservedinthepulseofCO2afterrewetting(TableS4.5),
showinghigherRecoinsoilsfromthenorthernregionespeciallyat3and48
hrs(Fig.4.4c).
Pre-drought Drought Rewetting
mol
PN
P g
-1 h
-1
0
50
100
150
200
250
Pre-drought Drought Rewetting
mol
NH
4+ g
-1 h
-1
0.0
0.2
0.4
0.6
0.8
1.0
1.2N Large N Small S Large S Small
ab
cdd d
bccd
abab
bc ababc
bc
a) b)
cd
b
c
bc
a
d
b
d

CAPÍTULO4
145
Figure 4.4 CO2 fluxes of the plant‐soil‐microbial system of soils from twoclimaticallydifferentregionsandtwofragmentsizesofHolmoakforestsinSpain.Ecosystem respiration (a) and Gross primary productivity (b) both in droughtsimulation,andecosystemrespirationinrewettingsimulation(c),where0meansimmediately before rewetting. Grey/white bars represent large/small fragmentsrespectively. Open/filled bars represent the northern or the southern region,respectively.Data=means±SE.Significantdifferencesgivenbypost‐hocmultiplecomparisonsbyTukey’stest(P<0.05)ofthethree‐wayANOVAareindicated:maineffects by capital letters (among condition) and significant triple interactionbetweenfactorsbylowercaseletters(conditionxregionxfragmentsize,seeTableS4.4andS4.5).
Days of droughtPre-drought 18 36 55
mol
CO
2 m
-2 s
ec-1
-4
-3
-2
-1
0Days of drought
Pre-drought 18 36 55
mol
CO
2 m
-2 s
ec-1
0
2
4
6
8
10
12
14
Hours since rewetting0 3 24 48
mol
CO
2 m
-2 s
ec-1
0
2
4
6
8
10
N Large N Small S Large S Small
c)
a)
a a a
bb b
b
b bb
b
ba
bb
b
aa
b)
bbbc bc
bc
cd d dcd
e
ff
f
cd
A
B
AB
C

HABITAT FRAGMENTATION CAN MODULATE DROUGHT EFFECTS
146
Plantgrowthandphysiology
Growthandphysiologicalactivityofseedlingswerenotaffectedbyregion
orfragmentsize(Table4.3,TableS4.2),despitethedifferencesinmoisture
and nutrient status observed between soils (Table 4.1). However, the
physiological activity of seedlings was significantly affected by drought
(TableS4.2).Seedlingsgrowninsoilsfromthesouthernregionshowedthe
lowest SLA (Table 4.3). Seedling survival varied significantly depending
upon treatments, from nomortality in soils of small fragments from the
northern region, to almost 50% seedling mortality in soils of large
fragments from the southern region (Table 4.3). We did not find any
consistent relationships between seedling growth (height, diameter,
biomass, SLA), physiology (GPP, photochemical efficiency, stomatal
conductance, water potential), and soil microbial communities (bacterial
and fungal diversity and structure), soil biogeochemical properties
(nutrients,soilmoisture,stability),orsoil functioning(enzymaticactivity,
Reco;TableS4.6).
Influenceofsoilmoistureontheplant‐soil‐microbialsystem
Linear regression analyses showed that Reco was highly sensitive to soil
moisture(R2=0.499,p<0.001)(Fig.4.5a),whereasGPPwasnot(Fig.4.5b).
Asexpected,correlationsshowedthatsoilfunctioning(Recoandenzymatic
activities) were strongly related to soil moisture (Table 4.4). Fungal
community structure (i.e. PC1 of fungal PCA; Fig. 4.2a) was negatively
correlatedwithRecoandphosphataseactivity(Table4.4).Fungaldiversity
wasnegativelycorrelatedwithRecoandbothenzymeactivities(Table4.4).
Bacterial community structure (i.e. PC1 of bacterial PCA; Fig. 4.2b) was
positively correlated with Reco and urease activity (Table 4.4). Bacterial
richness and diversity were also correlated with Reco and phosphatase
activity(Table4.4).

CAPÍTULO4
147
Table4.3.Seedlinggrowthandphysiologyduringdroughtsimulationinsoilsfromtwo climatically different regions and two fragment sizes of holm oak forest inSpain.Data=mean (SE) (n=7 for southern large andnorthern small fragments,andn=8forsouthernsmallandnorthernlargefragments).Significantdifferences(P<0.05)areindicatedwithcapitalletters(amongregionforagivenfragmentsize)andlowercaseletters(amongfragmentsizeforagivenregion).
Resultsofthestepwisemultipleregressionsshowedastrongrelationship
between soil moisture and the diversity and structure of microbial
communities (Table 4.5). However, an opposite relationship with soil
moisture was detected for the two microbial communities, with soil
moisture negatively correlated with fungal structure and diversity and
positively correlated with bacteria structure (Table 4.5). Furthermore,
fungal community evenness was significantly affected by pH, aggregate
stability and SOM, whereas fungal diversity was also affected by SOM
(Table4.5).
Northern region Southern region
Large fragment Small fragment Large fragment Small fragment
Germination (days) 64.1 (8.2)A,a 45.0 (3.8)A,a 60.6 (6.4)A,a 53.6 (5.9)A,a
Height (cm) 6.64 (0.9)A,a 8.6 (1.2)A,a 8.6 (1.9)A,a 6.1 (0.9)A,a
Diameter (mm) 2.12 (0.2)A,a 2.44 (0.3)A,a 2.3 (0.3)A,a 2.3 (0.4)A,a
Biomass (g) 1.3 (0.3)A,a 1.7 (0.3)A,a 1.4 (0.3)A,a 1.2 (0.4)A,a
Root/shoot ratio 1.2 (0.1)A,a 0.9 (0.1)A,a 1.0 (0.2)A,a 1.0 (0.1)A,a
SLA (cm2 g-1) 81.2 (3.4) B,a 71.7 (2.3)B,a 84.7 (3.8)A,a 86.2 (3.5)A,a
Fv/Fm predawn 0.66 (0.09)A,a 0.59 (0.10)A,a 0.63 (0.16)A,a 0.78 (0.04)A,a
Fv/Fm midday 0.60 (0.05)A,a 0.51 (0.07)A,a 0.61 (0.03)A,a 0.67 (0.03)A,a
Stomatal conductance
(mmol s-1 m-2) 68.3 (15.2)A,a 74.7 (17.8)A,a
52 (11.2)A,a 59.8 (13.7)A,a
Water potential (MPa) -1.5 (0.4)A,a -1.7 (0.2)A,a -1.3 (0.4)A,a -2.2 (1.7)A,a
Survival (%) 87.5 ab 100.0a 57.1b 87.5ab

HABITAT FRAGMENTATION CAN MODULATE DROUGHT EFFECTS
148
Figure 4.5 Relationships between Ecosystem Respiration (a), Gross PrimaryProductivity(b)andsoilmoisturefromtwoclimaticallydifferentregionsandtwofragmentsizesofholmoakforestsinSpainexposedtoexperimentaldroughtandrewettingsimulations.Soiltreatmentsarerepresentedbydifferentsymbols:greycircles = large fragments from the northern region; white inverted triangles =smallfragmentsfromthenorthernregion;greysquares=largefragmentsfromthesouthernregion;whitediamonds=small fragmentsfromthesouthernregion.R2andPvaluesofsimplelinearregressionsarepresented.
Soil moisture (%)
10 20 30 40 50
GP
P (m
ol C
O2
m-2
sec
-1)
-8
-6
-4
-2
0
Rec
o (m
ol C
O2
m-2
sec
-1)
0
2
4
6
8
10
12a)
b)N LargeR2=0.032, p>0.05
N SmallR2=0.022, p>0.05
S LargeR2= 0.011, p>0.05
S SmallR2= 0.105, p>0.05
N LargeR2=0.41, p<0.0001
N SmallR2=0.31, p=0.002
S LargeR2= 0.36, p=0.002
S SmallR2=0.40, p<0.0001

CAPÍTULO4
149
Table 4.4. Correlations between soil functioning and soil moisture, fungal andbacterial diversity in soils from two climatically different regions and twofragment sizes of holm oak forest in Spain. Data were analysed by Pearson’scorrelation (n=36) and significant effects are noted in bold (*<0.05; **< 0.01;***<0.001).Reco= ecosystem respiration; PC1= first component and PC2= secondcomponentofPrincipalComponentAnalysis(PCA).For the fullcorrelationTableseeTableS4.7.
Table4.5. Relationships between fungal and bacterial community structure andexplanatoryphysicochemicalsoilvariablesinsoilsfromtwoclimaticallydifferentregionsandtwofragmentsizesofholmoakforestinSpain.Datawereanalysedbystepwisemultipleregression(t‐test)andsignificanteffectsusingcorrectedP‐value(sequentialBonferronimethod)arenoted inbold(n=36);n.s.notsignificant.β=standardizedcoefficient.SOM=soilorganicmatter.
Reco Phosphatase Urease
Soil moisture 0.68*** 0.45** 0.58***
Fungal richness -0.38* -0.33 -0.34
Fungal Shannon index -0.37* -0.38* -0.43*
PC1 Fungal -0.58*** -0.49** -0.30
Bacterial richness 0.41* 0.42* 0.29
Bacterial Shannon index 0.41* 0.40* 0.25
PC1 Bacterial 0.45** 0.34 0.51**
PC2 Bacterial 0.38* -0.10 0.06
Fungi Bacteria
PC1
(R2= 0.55)
Richness
(R2= 0.23)
Shannon
(R2= 0.41)
Evenness
(R2= 0.39)
PC1
(R2= 0.84)
Richness
(R2= 0.37)
Shannon
(R2= 0.34)
Evenness
(R2= 0.30)
Soil moisture
β -0.79 -0.35 -0.52 -0.51 0.98 0.33 0.23 -0.52
Pearson correlation -0.74 -0.35 -0.53 -0.52 0.91 0.36 0.25 -0.50
P * n.s. * * * n.s. n.s. *
pH
β 4.78 -8.62 -13.36 -15.05 -1.95 9.30 9.82 -5.62
Pearson correlation 0.17 -0.22 -0.38 -0.41 -0.11 0.26 0.27 -0.15
P n.s. n.s. n.s. * n.s. n.s. n.s. n.s.
Aggregates (%)
β 5.35 -9.88 -15.21 -16.95 -2.26 11.11 11.68 -6.37
Pearson correlation 0.16 -0.23 -0.38 -0.41 -0.11 0.28 0.28 -0.15
P n.s. n.s. n.s. * n.s. n.s. n.s. n.s.
SOM (%)
β -1.14 2.40 3.80 4.39 0.15 -2.89 -2.93 2.04
Pearson correlation -0.14 0.21 0.37 0.41 0.03 -0.28 -0.28 0.19
P n.s. n.s. * * n.s. n.s. n.s. n.s.
HABITAT FRAGMENTATION CAN MODULATE DROUGHT EFFECTS
150
Discusion
Effects of the fragment size and the bioclimatic region over the plant‐soil‐
microbialsystem
In our study the physicochemical characteristics of soils were
highly affected by fragment size and less by the bioclimatic region (i.e.
northernvs. southernregion).Soils fromsmall fragmentsofbothregions
showed higher concentrations of essential ions, partially confirming our
initialhypothesisthatphysicochemicalcharacteristicsofsoilswoulddiffer
in forest fragments of contrasting sizes. In a fragmented forest, the
influence of the agricultural matrix tends to increase as the fragments
become smaller due to an amplified relative importance of edge effects
(Fernández et al., 2002). This influence over the physicochemical
characteristicofsmallfragmentsandoftheedgeoflargefragmentstendto
behigherwhenthematrixisagricultural(BoutinandJobin,1998).Among
other factors (lower tree competition and higher light availability), this
increasedfertilitymediatedbythematrixcouldalsoexplainthepresence
of larger andmore productive trees growing in the smaller fragments at
both sites (authors personal observations), which result in higher soil
organicmatter(SOM)content.Soilwaterholdingcapacitywasalsohigher
in soils from small fragments, probably due to their higher SOM content,
whichtypicallyincreasesthecapacityofasoiltoretainwater(Boix‐Fayos
etal.,2001;Franzluebbers,2002).This increase inresourcesundersmall
fragmentswasalsoreflectedinanincreaseinthefunctionalityoftheplant‐
soil‐microbialsystem;bothRecoandphosphataseactivitieswerehigher in
soilsfromsmallfragmentssizesinbothregions.
Unlikefunctionalindicators,ourresultsindicatethatthemicrobial
communitiesweremore sensitive to theparticularbioclimatic conditions
of the two regions studied than to the size of the fragment. Under a low
influenceofthematrix(largefragments),soilsfromthecolderandwetter

CAPÍTULO4
151
region(northern)hadhighermicrobialbiomassandamorebacterial‐rich
community,whilesoilsfromthewarmeranddriersouthernregionhadthe
lowest values of microbial biomass but the most diverse fungal
communities. However, fragment size did not significantly affect the
diversityandstructureof themicrobial communities, suggestinga strong
resistance (Allison and Martiny, 2008) of these communities to the
potential changes in soil physicochemical properties associated with
fragmentsize.
Effectsofclimaticsimulationsoverthefunctioningoftheplant‐soil‐microbial
systemanditsinteractionswithfragmentsizeandbioclimaticorigin
Droughtnegativelyaffected theplant‐soil‐microbialsystemdue to
thestrongeffectofsoilmoistureoverdifferentfunctionalindicatorsofthe
plant‐soil‐microbial system, such as autotrophic and heterotrophic
respiration as well as plant productivity (Orchard and Cook, 1983;
Reichsteinetal.,2002;Barbaetal.,2013).Decreasesinmetabolicactivity
relatedtodroughthavebeenfoundinotherstudiesforbothsoil(Reyand
Jarvis, 2006; Curiel Yuste et al., 2007), and enzymatic activities (Sardans
andPeñuelas,2005;Zornozaetal.,2006;Huesoetal.,2011).Asynchrony
in the reduction of Reco and enzymatic activity was expected when the
microcosms were water‐limited since both processes involve microbial
aerobicactivity, largelydependuponadequatewaterconditions(Orchard
andCook,1983;Reichsteinet al., 2002;Rambal et al., 2003; Sardansand
Peñuelas,2005;Zornozaetal.,2006;CurielYusteetal.,2007;Schimeletal.,
2010;Huesoetal.,2011;Barbaetal.,2013).Onthecontrary,theobserved
lower effect of drought over GPP (only significant by the end of the
drought)evidencedahigherresistancetodroughtoftheseseedlingswith
respect tomicrobes. This higher resistance to drought could be due to a
higher capacity of plants to explore the water resources of soil than
microorganisms, which are more static and dependant on water micro‐

HABITAT FRAGMENTATION CAN MODULATE DROUGHT EFFECTS
152
conditions (Rambal et al., 2003; Ogaya and Peñuelas, 2004; Castro et al.,
2010;CurielYusteetal.,2011;deVriesetal.,2012).
Regardingmicrobial communities, the forced climatic simulations
(drought and rewetting) were associated with strong and opposed
fluctuations in the diversity of both bacteria and fungi. The observed
increase in fungal richness and diversity together with the decrease in
bacterial diversity during the drought reinforces the idea that fungi
overcomewater limitations better than bacteria (Drenovsky et al., 2004;
Schimel et al., 2007; Curiel Yuste et al., 2011; Barnard et al., 2013;
Göranssonetal.,2013;Grigulisetal.,2013).Thiscanbeexplainedbecause
bacteria are organisms evolved in aqueous environment, and are more
diverse under optimal water conditions, whereas fungi are organisms
evolved in terrestrial environments, tending to be more diverse under
waterlimitations(CurielYusteetal.,2011;Göranssonetal.,2013;Grigulis
et al., 2013). This was in agreement with the fact that soil rewetting
producedanoppositeeffectwithrespect to thatobserved fordroughton
the microbial communities, decreasing fungal diversity and increasing
bacterialdiversity,respectively.
Collectively, our results suggest that the bioclimatic origin of the
soil microbial communities strongly determined both the modulation by
fragmentation of the effect of drought and the capacity of the microbial
community to respond to the simulated climatic fluctuations. Our results
only partially support our second hypothesis i.e. that the functional
response of the plant‐soil‐microbial system to climatic simulations
(drought and rewetting) would be determined by the particular initial
microbialcommunitiesandbiogeochemicalsoilpropertiesassociatedwith
fragment size. Only in the small fragments of the northern and wetter
region did the initial biological and physicochemical soil properties (e.g.
higher bacterial richness and SOM content) appear to have a strong
CAPÍTULO4
153
positive effect over the functioning of the plant‐soil‐microbial system
duringdrought(increasingReco,GPP,ureaseactivityunderdryconditionin
smallwithrespect to large fragments),whereas fragmentsizehad lessof
an effect (significant only for GPP) in the southern and drier region. The
sensitivity of the microbial communities (diversity and evenness) to the
climaticsimulationswasalsostronglydependentontheinitialbioclimatic
originofthesoils.Indeed,thestrongersensitivityofbacterialdiversityand
evenness from the northern (colder and wetter) with respect to the
southern (warmer and drier) region indicates a different degree of
historical adaptation to dry conditions from these two communities. It is
therefore likely that the harsher historical climatic conditions in the
southern region may have acted as a strong habitat filter by selecting
drought tolerant microbial species, more resistant to the simulated dry
conditions of the experiment (Curiel Yuste et al., 2014; Evans and
Wallenstein, 2014). In turn, the fast and significant increase in bacterial
richnessanddiversitytogetherwiththestrongpulseinCO2afterrewetting
again suggest that soil microbial communities grown in soils from the
northernregion,richerinorganicmatter,weremoreresilienttochangesin
water availability. Therefore, whereas reducing the size of the fragment
increases the fertilityandwateravailability forbothmicrobesandplants
(henceamelioratingtheeffectofdroughtoverthefunctioningoftheplant‐
soil‐microbialsystem), the lackofsensitivity to this increase inresources
of the plant‐soil‐microbial systems with soils from the southern region
could only indicate a lack of responsiveness of the soil microbial
communities from this drier site, which were unable to recover the
function.

HABITAT FRAGMENTATION CAN MODULATE DROUGHT EFFECTS
154
Conclusions
A schematic overview of the main findings from this study is shown in
Figure4.6,ilustratingacontinuumofdriertowetterconditionsofsoiland
the interplay between the two climatically different regions and the
fragmentsizes.Weobservedherethat,underoptimalconditions(nowater
limitations)andinsoilsfromthewetterregion,thehighestmetabolicrates
(Reco and enzyme activities) were generally associated with microbial
communities dominated by rich bacterial communities, whereas under
drought and in the southern and drier region, the relatively lower
metabolicrateswereassociatedwithmicrobialcommunitiesdominatedby
rich fungal communities. Under drought stress, fragmentationmodulates
the functional response of both plants and microbes, especially in the
relativelyrichersoilsfromthenorthernregion,whereasfragmentsizedid
notsubstantiallymodulatethefunctionalresponseofthemicrocosmswith
soilsfromthesouthernanddrierregion.
Figure4.6Schematicoverviewofsimultaneousvariationsinfungalandbacterialrichness, soil moisture, ecosystem functioning and their modulation thoughfragmentsize,assuggestedbytheresultsofthepresentstudy.
Bacterial richness
Fungal richness
Large fragmentSouthern region
Small fragmentSouthern region
Large fragmentNorthern region
Small fragmentNorthern region
Soil moisture HighLow
Ecosystem function HighLow
CAPÍTULO4
155
Our results, therefore, suggest that the drier conditions expected in the
future for the already water limited Mediterranean basin will favour
fungal‐dominatedsoilmicrobialcommunities, leadingtoadecelerationof
processes associated with the plant‐soil‐microbial system. Moreover, the
interaction found here between drought and fragment size suggests that
depending on the local bioclimatic conditions and soil physicochemical
characteristics,habitatfragmentationcouldamelioratetosomeextentthe
negativeeffectofincreasingdroughtsbyincreasingthefertilityandwater
holdingcapacityofsoils.

HABITAT FRAGMENTATION CAN MODULATE DROUGHT EFFECTS
156
References
Allison, S. D. and J. B.Martiny (2008). Resistance, resilience, and redundancy inmicrobial communities. Proceedings of the National Academy of Sciences,USA,105(Supplement1):11512‐11519.
Anderson,I.C.,C.D.CampbellandJ.I.Prosser(2003).Diversityoffungiinorganicsoils under a moorland – Scots pine (Pinus sylvestris L.) gradient.EnvironmentalMicrobiology,5(11):1121‐1132.
Bahn, M., F. A. Lattanzi, R. Hasibeder, B. Wild, M. Koranda, V. Danese, N.Brüggemann,M. Schmitt, R. Siegwolf and A. Richter (2013). Responses ofbelowgroundcarbonallocationdynamicstoextendedshadinginmountaingrassland.NewPhytologist,198(1):116‐126.
Barba, J., J.CurielYuste, J.Martínez‐VilaltaandF.Lloret(2013).Drought‐inducedtree species replacement is reflected in the spatial variability of soilrespiration in a mixed Mediterranean forest. Forest Ecology andManagement,306(0):79‐87.
Barnard,R.L.,C.A.OsborneandM.K.Firestone(2013).Responsesofsoilbacterialand fungal communities to extreme desiccation and rewetting. The ISMEJournal:MultidisciplinaryJournalofMicrobialEcology,7(11):2229‐2241.
Boix‐Fayos, C., A. Calvo‐Cases, A. C. Imeson and M. D. Soriano‐Soto (2001).InfluenceofsoilpropertiesontheaggregationofsomeMediterraneansoilsand the use of aggregate size and stability as landdegradation indicators.CATENA,44(1):47‐67.
Boutin,C.andB. t. Jobin(1998). Intensityofagriculturalpracticesandeffectsonadjacenthabitats.EcologicalApplications,8(2):544‐557.
Bremner, J.M. (1960).Determinationofnitrogen in soil by theKjeldahlmethod.JournalofAgriculturalScience,55(01):11‐33.
Burriel, F. and V. Hernando (1950). Extraction of the total phosphorus fromSpanishsoils.Transactions4thInt.Cong.SoilSci.2:133‐134.
Castro,H.F.,A.T. Classen,E. E.Austin,R. J.NorbyandC.W. Schadt (2010). Soilmicrobial community responses to multiple experimental climate changedrivers.AppliedandEnvironmentalMicrobiology,76(4):999‐1007.
Cleary, D. F. R., K. Smalla, L. C. S. Mendonça‐Hagler and N. C. M. Gomes (2012).Assessmentofvariationinbacterialcompositionamongmicrohabitats inamangrove environment using DGGE fingerprints and barcodedpyrosequencing.PLoSONE,7(1):e29380.
CurielYuste,J.,D.D.Baldocchi,A.Gershenson,A.Goldstein,L.MissonandS.Wong(2007).Microbialsoilrespirationanditsdependencyoncarboninputs,soiltemperatureandmoisture.GlobalChangeBiology,13(9):2018‐2035.
Curiel Yuste, J., A. J. Fernandez‐Gonzalez, M. Fernandez‐Lopez, R. Ogaya, J.Penuelas, J.SardansandF.Lloret(2014).Strongfunctionalstabilityofsoilmicrobial communities under semiarid Mediterranean conditions andsubjected to long‐term shifts in baseline precipitation. Soil Biology andBiochemistry,69(0):223‐233.
CurielYuste,J.,J.Peñuelas,M.Estiarte,J.Garcia‐Mas,S.Mattana,R.Ogaya,M.Pujoland J. Sardans (2011). Drought‐resistant fungi control soil organicmatterdecomposition and its response to temperature. Global Change Biology,17(3):1475‐1486.

CAPÍTULO4
157
deVries,F.T.,M.E.Liiri,L.Bjornlund,M.A.Bowker,S.Christensen,H.SetalaandR.D.Bardgett(2012).Landusealterstheresistanceandresilienceofsoilfoodwebstodrought.NatureClimateChange,2(4):276‐280.
Díaz,M. and C. L. Alonso (2003).WoodmouseApodemus sylvaticus winter foodsupply: density, condition,breeding, andparasites. Ecology, 84(10): 2680‐2691.
Díaz,M.,T.SantosandJ.L.Tellería(1999).Effectsof forestfragmentationonthewinterbodyconditionandpopulationparametersofanhabitatgeneralist,thewoodmouseApodemussylvaticus:atestofhypotheses.ActaOecologica,20(1):39‐49.
Didham,R.K., J.Ghazoul,N.E.StorkandA.J.Davis(1996).Insectsinfragmentedforests: a functional approach.Trends inEcology&Evolution, 11(6): 255‐260.
Dooley, J. L. and M. A. Bowers (1998). Demographic responses to habitatfragmentation:experimentaltestsatthelandscapeandpatchscale.Ecology,79(3):969‐980.
Drenovsky,R.E.,D.Vo,K.J.GrahamandK.M.Scow(2004).Soilwatercontentandorganic carbon availability are major determinants of soil microbialcommunitycomposition.MicrobialEcology,48(3):424‐430.
Evans, S. E. and M. D. Wallenstein (2014). Climate change alters ecologicalstrategiesofsoilbacteria.EcologyLetters,17(2):155‐164.
Evans,S.E.,M.D.WallensteinandI.C.Burke(2013).Isbacterialmoisturenicheagood predictor of shifts in community composition under long‐termdrought?Ecology,95(1):110‐122.
Fahrig,L.(2003).Effectsofhabitatfragmentationonbiodiversity.AnnualReviewofEcology,EvolutionandSystematics,34(1):487‐515.
Farnleitner,A.H.,F.Zibuschka,M.M.Burtscher,G.Lindner,G.ReischerandR.L.Mach (2004). Eubacterial 16S‐rDNA amplicon profiling: a rapid techniquefor comparison and differentiation of heterotrophic plate countcommunities from drinking water. International Journal of FoodMicrobiology,92(3):333‐345.
Fernández, C., F. J. Acosta,G.Abellá, F. López andM.Díaz (2002). Complex edgeeffect fields as additive processes in patches of ecological systems.EcologicalModelling,149(3):273‐283.
Fischer, J. and D. B. Lindenmayer (2007). Landscape modification and habitatfragmentation: a synthesis. Global Ecology and Biogeography, 16(3): 265‐280.
Franzluebbers,A.J.(2002).Waterinfiltrationandsoilstructurerelatedtoorganicmatter and its stratification with depth. Soil and Tillage Research, 66(2):197‐205.
Fuchslueger,L.,M.Bahn,K.Fritz,R.HasibederandA.Richter(2014).Experimentaldroughtreducesthetransferofrecentlyfixedplantcarbontosoilmicrobesand alters the bacterial community composition in a mountain meadow.NewPhytologist,201(3):916‐927.
Gafan,G.P.,V.S.Lucas,G.J.Roberts,A.Petrie,M.WilsonandD.A.Spratt(2005).Statistical analyses of complex denaturing gradient gel electrophoresisprofiles.JournalofClinicalMicrobiology,43(8):3971‐3978.

HABITAT FRAGMENTATION CAN MODULATE DROUGHT EFFECTS
158
Gardes, M. and T. D. Bruns (1993). ITS primers with enhanced specificity forbasidiomycetes‐applicationtotheidentificationofmycorrhizaeandrusts.MolecularEcology,2(2):113‐118.
Göransson,H.,D.L.Godbold,D.L.JonesandJ.Rousk(2013).Bacterialgrowthandrespiration responses upon rewetting dry forest soils: impact of drought‐legacy.SoilBiologyandBiochemistry,57(0):477‐486.
Gregorich,E.G.,G.Wen,R.P.VoroneyandR.G.Kachanoski(1990).Calibrationofarapid direct chloroform extraction method for measuring soil microbialbiomassC.SoilBiologyandBiochemistry,22(7):1009‐1011.
Grigulis,K., S. Lavorel,U.Krainer,N.Legay,C.Baxendale,M.Dumont,E.Kastl,C.Arnoldi, R. D. Bardgett, F. Poly, T. Pommier,M. Schloter, U. Tappeiner,M.BahnandJ.‐C.Clément(2013).Relativecontributionsofplanttraitsandsoilmicrobial properties tomountain grassland ecosystem services. Journal ofEcology,101(1):47‐57.
Grossman,J.,B.O’Neill,S.Tsai,B.Liang,E.Neves,J.LehmannandJ.Thies(2010).Amazonian anthrosols support similar microbial communities that differdistinctly from those extant in adjacent, unmodified soils of the samemineralogy.MicrobialEcology,60(1):192‐205.
Hereş,A.‐M.,J.Martínez‐VilaltaandB.ClaramuntLópez(2012).Growthpatternsinrelationtodrought‐inducedmortalityattwoScotspine(PinussylvestrisL.)sitesinNEIberianPeninsula.Trees‐StructureandFunction,26(2):621‐630.
Hill,T.andP.Lewicki(2005).Statistics:MethodsandApplicationsStatSoft,Inc.Hueso,S.,T.HernándezandC.García(2011).Resistanceandresilienceofthesoil
microbial biomass to severe drought in semiarid soils: the importance oforganicamendments.AppliedSoilEcology,50(0):27‐36.
Imeson,A.C. andM.Vis (1984).Assessing soil aggregate stabilitybywater‐dropimpactandultrasonicdispersion.Geoderma,34(3–4):185‐200.
IPCC (2007). Climate Change 2007 ‐ Syntesis report, IPCC, IntergovernmentalPanelonClimateChangec/oWorldMeteorologicalOrganization(WMO).
Lázaro‐Nogal, A., S. Matesanz, T. Gimeno, A. Escudero and F. Valladares (2012).Fragmentation modulates the strong impact of habitat quality and plantcoveronfertilityandmicrobialactivityofsemiaridgypsumsoils.PlantandSoil,358(1‐2):213‐223.
Lindenmayer, D. B. and J. Fischer (2006). Habitat fragmentation and landscapechange: anecological andconservation synthesis.Washington,USA, IslandPress.
Millennium‐Ecosystem‐Assessment (2005). Ecosystems and Human Well‐being:Synthesis.Washington,DC,IslandPress.
Muyzer, G., E. C. de Waal and A. G. Uitterlinden (1993). Profiling of complexmicrobialpopulationsbydenaturinggradientgelelectrophoresisanalysisofpolymerase chain reaction‐amplified genes coding for 16S rRNA. AppliedandEnvironmentalMicrobiology,59(3):695‐700.
Nannipieri, P., B. Ceccanti, S. Cervelli and E. Matarese (1980). Extraction ofphosphatase,urease,proteases,organiccarbon,andnitrogenfromsoil.SoilScienceSocietyofAmericaJournal,44(5):1011‐1016.
Ninyerola, M., X. Pons and J. M. Roure. (2005). Atlas climático digital de laPenínsula Ibérica. Metodología y aplicaciones en bioclimatología ygeobotánica.Fromhttp://www.opengis.uab.es/wms/iberia/index.htm.

CAPÍTULO4
159
Ogaya, R. and J. Peñuelas (2004). Phenological patterns ofQuercus ilex,Phillyrealatifolia, and Arbutus unedo growing under field experimental drought.Ecoscience11:263‐270.
Orchard,V.A.andF.J.Cook(1983).Relationshipbetweensoilrespirationandsoilmoisture.SoilBiologyandBiochemistry,15(4):447‐453.
Pérez‐Priego,O.,L.Testi,F.OrgazandF.J.Villalobos(2010).Alargeclosedcanopychamber for measuring CO2 and water vapour exchange of whole trees.EnvironmentalandExperimentalBotany,68(2):131‐138.
Pyke,D.A.andJ.N.Thompson(1986).Statisticalanalysisofsurvivalandremovalrateexperiments.Ecology,67(1):240‐245.
Rambal,S., J.‐M.Ourcival,R. Joffre,F.Mouillot,Y.Nouvellon,M.ReichsteinandA.Rocheteau(2003).DroughtcontrolsoverconductanceandassimilationofaMediterranean evergreen ecosystem: scaling from leaf to canopy. GlobalChangeBiology,9(12):1813‐1824.
Rantalainen, M.‐L., J. Haimi, H. Fritze, T. Pennanen and H. Setälä (2008). Soildecomposercommunityasamodelsysteminstudyingtheeffectsofhabitatfragmentationandhabitat corridors.SoilBiologyandBiochemistry,40(4):853‐863.
Reichstein,M.,J.D.Tenhunen,O.Roupsard,J.‐m.Ourcival,S.Rambal,F.Miglietta,A.Peressotti,M.Pecchiari,G.TironeandR.Valentini (2002). SeveredroughteffectsonecosystemCO2andH2OfluxesatthreeMediterraneanevergreensites: revision of current hypotheses? Global Change Biology, 8(10): 999‐1017.
Rey, A. and P. Jarvis (2006). Modelling the effect of temperature on carbonmineralizationratesacrossanetworkofEuropeanforestsites(FORCAST).GlobalChangeBiology,12(10):1894‐1908.
Rivas‐Martínez, S. (1981). Les étages bioclimatiques de la végétation de laPéninsuleIbérique.AnalesdelJardínBotánicodeMadrid,37(2):251‐268.
Santos, T. and J. L. Tellería (1998). Efectos de la fragmentación de los bosquessobre los vertebrados de las mesetas ibéricas. Madrid, Spain, OrganismoAutónomo"ParquesNacionales".
Sardans, J. and J. Peñuelas (2005). Drought decreases soil enzyme activity in aMediterraneanQuercus ilexL. forest. SoilBiologyandBiochemistry,37(3):455‐461.
Schimel,J.P.,T.C.BalserandM.D.Wallenstein(2007).Microbialstress‐responsephysiology and its implications for ecosystem function. Ecology, 88(6):1386‐1394.
Schimel, J. P., C.Boot,P.Holden,D.Roux‐Michollet, S.Parker, S. Schaeffer andK.Treseder(2010).Enzymeactivityandadaptationindrysoil.ProceedingsoftheWorldCongressofSoilScience,19:17‐20.
Scholander,P.F.,E.D.Bradstreet,E.A.HemmingsenandH.T.Hammel(1965).Sappressureinvascularplants:negativehydrostaticpressurecanbemeasuredinplants.Science,148(3668):339‐346.
Street, L. E.,G.R. Shaver,M.A.WilliamsandM.T.VanWijk (2007).What is therelationship between changes in canopy leaf area and changes inphotosyntheticCO2fluxinarcticecosystems?JournalofEcology,95(1):139‐150.

HABITAT FRAGMENTATION CAN MODULATE DROUGHT EFFECTS
160
Suzuki, C., M. Takenaka, N. Oka, K. Nagaoka and T. Karasawa (2012). A DGGEanalysisshowsthatcroprotationsystemsinfluencethebacterialandfungalcommunitiesinsoils.SoilScienceandPlantNutrition,58(3):288‐296.
Tabatabai, M. A. (1994). Soil Enzymes. Methods of Soil Analysis: Part 2—MicrobiologicalandBiochemicalProperties.R.W.Weaver,J.S.AngleandP.S.Bottomley.Madison,USA,SoilScienceSocietyofAmerica.sssabookseries:775‐833.
Treseder,K.,T.Balser,M.Bradford,E.Brodie,E.Dubinsky,V.Eviner,K.Hofmockel,J.Lennon,U.Levine,B.MacGregor, J.Pett‐RidgeandM.P.Waldrop(2012).Integrating microbial ecology into ecosystem models: challenges andpriorities.Biogeochemistry,109(1‐3):7‐18.
Valladares,F.,R.Benavides,S.G.Rabasa,J.G.Pausas,S.Paula,W.D.SimonsonandM. Díaz (2014). Global Change andMediterranean forest: current impactsandpotentialresponses.ForestsandGlobalChange.D.A.Coomes,D.F.R.P.BurslemandW.D.Simonson.Cambridge,UK,CambridgeUniversityPress:47‐76.
Valladares, F., J. J. Camarero, F. Pulido and E. Gil‐Pelegrín (2004). El bosquemediterráneo, un sistema humanizado y dinámico. Ecologia del BosqueMediterráneo en un mundo cambiante. F. Valladares. Madrid, Spain,MinisteriodelMedioAmbiente:13‐25.
Vaz‐Moreira, I., C. Egas,O. C.Nunes andC.M.Manaia (2013). Bacterial diversityfromthesource to the tap:acomparativestudybasedon16SrRNAgene‐DGGEandculture‐dependentmethods.FEMSMicrobiologyEcology,83(2):361‐374.
Wagg, C., S. F. Bender, F. Widmer and M. G. A. van der Heijden (2014). Soilbiodiversity and soil community composition determine ecosystemmultifunctionality.ProceedingsoftheNationalAcademyofSciences,USA:1‐5.
Wardle,D.A.,R.D.Bardgett,J.N.Klironomos,H.Setälä,W.H.vanderPuttenandD.H.Wall(2004).Ecologicallinkagesbetweenabovegroundandbelowgroundbiota.Science,304(5677):1629‐1633.
Williams, M. A. (2007). Response of microbial communities to water stress inirrigated and drought‐prone tallgrass prairie soils. Soil Biology andBiochemistry,39(11):2750‐2757.
WRB,I.W.G.(2007).WorldReferenceBaseforSoilResources2006, firstupdate2007.FAO.W.S.R.Reports.Rome,Italy.103:116.
Zanette,L.,P.DoyleandS.M.Tremont(2000).Foodshortageinsmallfragments:evidencefromanarea‐sensitivepasserine.Ecology,81(6):1654‐1666.
Zornoza, R., C. Guerrero, J. Mataix‐Solera, V. Arcenegui, F. García‐Orenes and J.Mataix‐Beneyto (2006). Assessing air‐drying and rewetting pre‐treatmenteffectonsomesoilenzymeactivitiesunderMediterraneanconditions.SoilBiologyandBiochemistry,38(8):2125‐2134.

CAPÍTULO4
161
Supplementarymaterial
FigureS4.1Schemaof the chamberused formeasuringCO2 fluxesof theplant‐soil‐systeminMediterraneanholmoakforestsfragments,showingtheconnectionswiththeEGM‐4ofPP‐systems®.Theframeofthebottomandtopofthechamberweremade of acrylic, and connectedwith aluminium rods.Walls weremade of“NRS90 clear” polyester film of 75 μm thickness (Llumar®, Martinsville, USA).Arrowsindicatetheairflowinsidethechamber.

HABITAT FRAGMENTATION CAN MODULATE DROUGHT EFFECTS
162
Figure S4.2 Water content in the plant‐soil‐system during the experimentaldroughtfromtwoclimaticallydifferentregionsandtwofragmentsizesofholmoakforestinSpain.Differentsymbolsrepresentdistinctsoiltreatment:circles=largefragments from northern region; inverted triangle = small fragments fromnorthern region; squares = large fragments from southern region; diamonds =smallfragmentsfromsouthernregion.Errorbars=SE(n=7forsouthernlargeandnorthernsmallfragments,and8forsouthernsmallandnorthernlargefragments).

CAPÍTULO4
163
TableS4.1Correlationbetweenphysicochemicalcharacteristicsofsoils(totalvalues)(n=48)from
twoclimaticallydifferent
regionsandtwofragmentsizesofholmoakforestinSpain.Significantcorrelationareinbold(*<0.05;**<0.01;***<0.001).
CEC=cationexchangecapacity;SOM=Soilorganicmatter.†Variableslatterincludedinstepwisemultipleregressions(see
Table5).
CEC
Mg2+
Ca
2+
Na+
SOM
N
orga
nic
P 2O 5
K+
pH
Aggr
egat
e sta
bility
M
icrob
ial b
iomas
s (m
g C
kg-1
)
Wat
er h
olding
capa
city (
%)
0.91
***
0.65
***
0.90
***
0.66
***
0.89
***
0.85
***
0.67
***
0.42
** 0.
21
0.20
-0
.23
CEC
(cm
ol cKg
-1)
0.69
***
0.99
***
0.66
***
0.90
***
0.83
***
0.54
***
0.51
***
0.42
** 0.
11
-0.2
3
Mg2+
(cm
ol cKg
-1)
0.61
***
0.48
***
0.64
***
0.63
***
0.49
***
0.65
***
0.17
-0
.15
-0.2
6
Ca2+
(cm
ol cKg
-1)
0.
64***
0.
90***
0.
83***
0.
53***
0.
43**
0.41
** 0.
14
-0.2
1
Na+ (c
mol c
Kg-1
)
0.
64***
0.
51***
0.
59***
0.
42**
0.13
0.
17
-0.4
0*
SOM
(%) †
0.
94***
0.
69***
0.
29*
0.06
0.
08
-0.1
4
N or
ganic
(%)
0.74
***
0.20
-0
.05
0.00
1 -0
.05
P 2O 5
(mg
Kg-1
) 0.
13
-0.3
3* 0.
08
-0.1
9
K+ (cm
ol cKg
-1)
0.53
***
-0.1
0 -0
.35*
pH †
0.
12
-0.2
8
Aggr
egat
e sta
bility
(%) †
0.
13

HABITAT FRAGMENTATION CAN MODULATE DROUGHT EFFECTS
164
TableS4.2Soilmoistureandseedlingresponseduringdroughtsimulationtothefactorsregionandfragmentsizeinsoilsfromtwoclimaticallydifferentregionsandtwo fragment sizesof holmoak forest in Spain.Datawere analysedby repeatedmeasures analysis of variance (n= 7 for southern large and northern smallfragments, and n= 8 for southern small and northern large fragments) andsignificanteffectsarenotedinbold(*<0.05;**<0.01;***<0.001).
Region(R) Fragment
size (F)
R x S Drought (D) D x R D x F DxRxF
Soil moisture F 24.21 45.71 3.7 291.95 8.11 3.73 0.94
P <0.001*** <0.001*** 0.065 <0.001*** <0.001*** <0.001*** 0.49
Fv/Fm predawn F 0.553 0.556 1.586 12.880 0.394 0.581 1.663
P 0.464 0.463 0.219 <0.001*** 0.758 0.629 0.182
Fv/Fm midday F 0.794 0.366 1.737 23.342 0.386 1.825 1.877
P 0.381 0.550 0.199 <0.001*** 0.763 0.149 0.140
Stomatal
conductance
(mmol s-1 m-2)
F 2.36 0.909 1.362 22.356 0.607 1.384 0.125
P 0.128 0.349 0.254 <0.001*** 0.613 0.254 0.945

CAPÍTULO4
165
TableS4.3Soilmicrobialcom
munitiesandenzymaticactivitiesresponsestocondition(C=droughtsimulationandrewetting),region
(northernandsouthern)andfragmentsize(largeandsm
all)insoilsfromtwoclimaticallydifferentregionsandtwofragmentsizesof
holmoakforestinSpain.Significanteffectsofthethree‐wayANOVA(n=9)arenotedinbold(*<0.05;**<0.01;***<0.001).
Fu
ng
al
Ric
hn
ess
F
un
gal
S
han
no
n
F
un
gal
ev
enn
ess
B
acte
rial
R
ich
nes
s
Bac
teri
al
Sh
ann
on
Bac
teri
al
even
nes
s
Ph
osp
hat
ase
U
reas
e
Co
nd
itio
n
(C)
P
0.00
7**
0.
002**
0.00
3**
0.
026*
0.
058
<
0.00
1***
<
0.00
1***
<
0.00
1***
F
6.12
8.34
7.24
4.24
3.21
43.5
8
16.1
9
18.3
1
Reg
ion
(R
) P
0.
198
0.
398
0.
348
0.
001**
0.00
1**
0.
034*
<
0.00
1***
0.
005**
F
1.
75
0.
74
0.
91
14
.74
14
.8
5.
04
90
.57
9.
43
Fra
gm
ent
size
(F
)
P
0.03
7*
0.00
7**
0.
063
0.
471
0.
245
0.
132
0.
005**
0.03
0* F
4.
86
8.
83
3.
81
0.
54
1.
42
2.
44
9.
53
5.
32
C x
R
P
0.05
7
0.08
7
0.98
9
0.01
6*
0.04
9*
0.00
1**
<
0.00
1***
0.
013**
F
3.
23
2.
7
0.01
4.94
3.41
9.94
13.5
4
5.26
C x
F
P
0.22
8
0.14
1
0.55
9
0.86
7
0.94
1
0.15
1
0.23
1
0.60
1 F
1.
58
2.
13
0.
6
0.14
0.06
2.05
1.56
0.52
R x
F
P
0.35
4
0.09
1
0.07
5
0.05
0.06
0.07
5
0.31
8
0.50
4 F
0.
89
3.
11
3.
47
4.
26
3.
89
3.
46
1.
04
0.
46
C x
R x
F
P
0.04
3*
0.02
6*
0.22
7
0.04
2*
0.05
3
0.48
5
0.34
7
0.00
4**
F
3.58
4.27
1.58
3.63
3.32
0.75
1.11
7.12
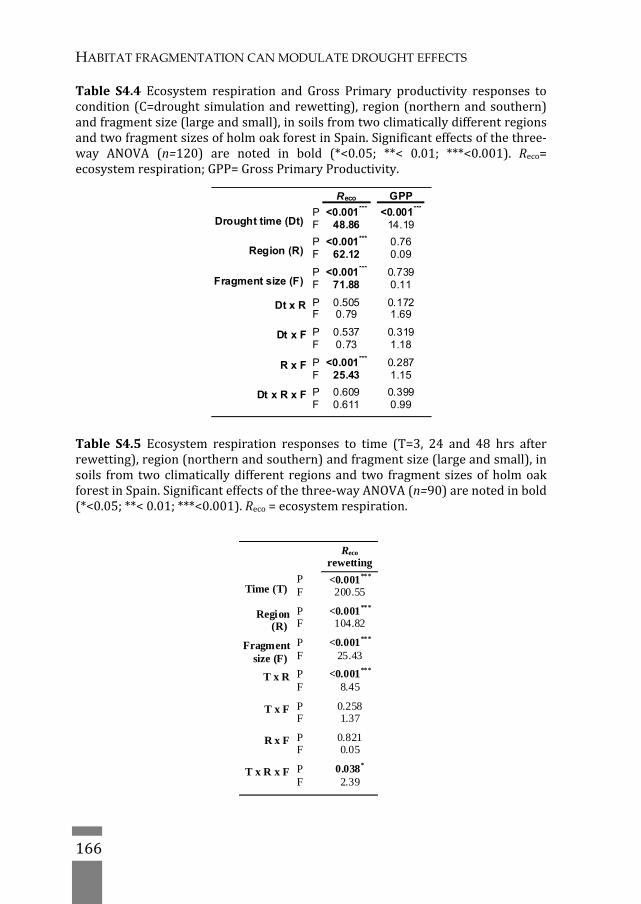
HABITAT FRAGMENTATION CAN MODULATE DROUGHT EFFECTS
166
Reco rewetting
Time (T) P <0.001***
F 200.55
Region (R)
P <0.001***
F 104.82
Fragment size (F)
P <0.001*** F 25.43
T x R
P <0.001*** F 8.45
T x F
P 0.258F 1.37
R x F
P 0.821 F 0.05
T x R x F
P 0.038* F 2.39
Reco GPP
Drought time (Dt) P <0.001*** <0.001***
F 48.86 14.19
Region (R) P <0.001*** 0.76 F 62.12 0.09
Fragment size (F) P <0.001*** 0.739 F 71.88 0.11
Dt x R
P 0.505 0.172F 0.79 1.69
Dt x F
P 0.537 0.319 F 0.73 1.18
R x F
P <0.001*** 0.287 F 25.43 1.15
Dt x R x F
P 0.609 0.399 F 0.611 0.99
Table S4.4 Ecosystem respiration and Gross Primary productivity responses tocondition(C=drought simulationandrewetting), region (northernandsouthern)andfragmentsize(largeandsmall),insoilsfromtwoclimaticallydifferentregionsandtwofragmentsizesofholmoakforestinSpain.Significanteffectsofthethree‐way ANOVA (n=120) are noted in bold (*<0.05; **< 0.01; ***<0.001). Reco=ecosystemrespiration;GPP=GrossPrimaryProductivity.
Table S4.5 Ecosystem respiration responses to time (T=3, 24 and 48 hrs afterrewetting),region(northernandsouthern)andfragmentsize(largeandsmall),insoils from two climaticallydifferent regionsand two fragment sizesof holmoakforestinSpain.Significanteffectsofthethree‐wayANOVA(n=90)arenotedinbold(*<0.05;**<0.01;***<0.001).Reco=ecosystemrespiration.
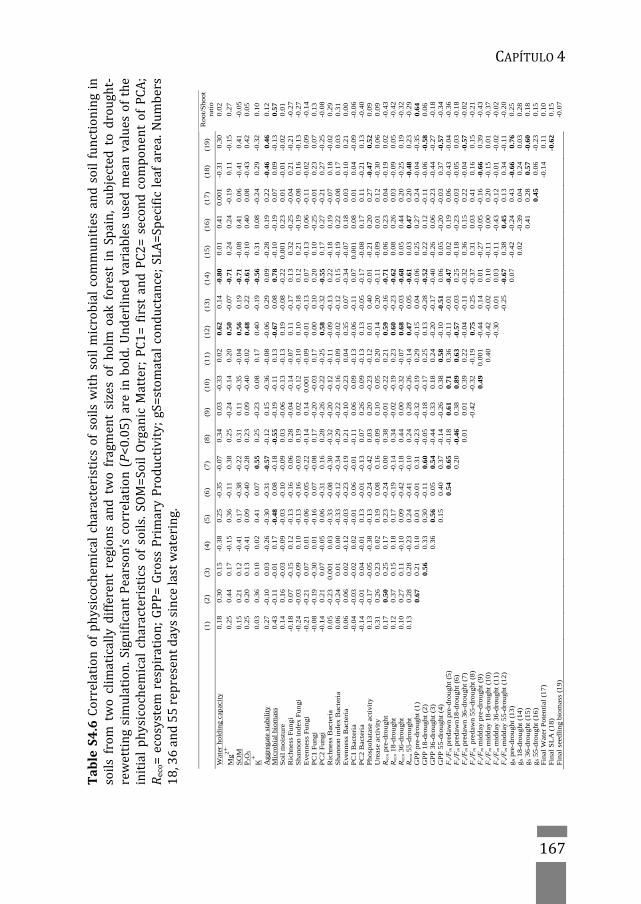
CAPÍTULO4
167
TableS4.6Correlationofphysicochemicalcharacteristicsofsoilswithsoilmicrobialcom
munitiesandsoilfunctioningin
soilsfromtwoclimaticallydifferentregionsandtwofragmentsizesofholmoakforestinSpain,subjectedtodrought‐
rewettingsimulation.SignificantPearson’scorrelation(P<0.05)areinbold.Underlinedvariablesusedmeanvaluesofthe
initialphysicochemicalcharacteristicsofsoils.SOM=SoilOrganicMatter;PC1=firstandPC2=secondcom
ponentofPCA;
Reco=ecosystem
respiration;GPP=GrossPrimaryProductivity;gS=stom
atalconductance;SLA=Specificleafarea.Num
bers
18,36and55representdayssincelastwatering.
(1
) (2
) (3
) (4
) (5
) (6
) (7
) (8
) (9
) (1
0)
(11
) (1
2)
(13
) (1
4)
(15
) (1
6)
(17
) (1
8)
(19
) R
oot/
Sh
oot
rati
o W
ater
hold
ing c
apac
ity
0.1
8
0.3
0
0.1
5
-0.3
8 0
.25
-0.3
5 -0
.07
0.3
4
0.0
3
-0.3
3
0.0
2
0.6
2
0.1
4 -0
.80
0.0
1
0.4
1
0.0
01
-0.3
1
0.3
0
0.0
2
Mg
2+
0
.25
0.4
4
0.1
7
-0.1
5 0
.36
-0.1
1 0
.38
0.2
5
-0.2
4
-0.1
4
0.2
0
0.5
0
-0.0
7 -0
.71
0.2
4
0.2
4
-0.1
9
0.1
1
-0.1
5
0.2
7
SO
M
0.1
5
0.2
1
0.1
2
-0.4
1 0
.17
-0.3
8 -0
.22
0.3
1
0.1
1
-0.3
5
-0.0
4
0.5
6
0.1
9 -0
.71
-0.0
8
0.4
1
0.0
6
-0.4
1
0.4
1
-0.0
5
P2O
5
0.2
5
0.2
0
0.1
3
-0.4
1 0
.09
-0.4
0 -0
.28
0.2
3
0.0
9
-0.4
0
-0.0
2
0.4
8
0.2
2 -0
.61
-0.1
0
0.4
0
0.0
8
-0.4
3
0.4
2
0.0
5
K+
0
.03
0.3
6
0.1
0
0.0
2 0
.41
0.0
7 0
.55
0.2
5
-0.2
3
0.0
8
0.1
7
0.4
0
-0.1
9 -0
.56
0.3
1
0.0
8
-0.2
4
0.2
9
-0.3
2
0.1
0
Ag
gre
gat
e st
abil
ity
0.2
7
-0.1
0
0.0
3
-0.2
6 -0
.30
-0.3
1 -0
.57
-0.1
2
0.1
5
-0.3
6
-0.0
8
-0.0
6
0.2
9 0
.09
-0.2
8
0.1
9
0.2
2
-0.4
6
0.4
6
0.1
2
Mic
rob
ial
biom
ass
0.4
3
-0.1
1
-0.0
1
0.1
7 -0
.48
0.0
8 -0
.18
-0.5
5
-0.1
9
-0.1
1
0.1
3
-0.6
7
0.0
8 0
.78
-0.1
0
-0.1
9
0.0
7
0.0
9
-0.1
3
0.5
7
Soi
l m
ois
ture
0
.14
0.1
6
-0.0
3
-0.0
9 -0
.03
-0.1
0 -0
.09
0.0
3
-0.0
6
-0.1
3
-0.1
3
0.1
9
-0.0
8 -0
.22
0.0
01
0.2
3
0.0
1
-0.0
1
-0.0
2
0.0
1
Ric
hnes
s F
un
gi
-0.1
8
0.0
7
-0.1
5
0.1
2 -0
.13
-0.1
6 0
.06
0.2
8
-0.0
4
-0.1
4
-0.0
7
0.1
1
-0.1
7 0
.13
0.3
2
-0.2
5
-0.0
4
0.2
1
-0.2
1
-0.2
7
Sh
ann
on i
nd
ex F
un
gi
-0.2
4
-0.0
3
-0.0
9
0.1
0 -0
.13
-0.1
6 -0
.03
0.1
9
0.0
2
-0.1
2
-0.1
0
0.1
0
-0.1
8 0
.12
0.2
1
-0.1
9
-0.0
8
0.1
6
-0.1
3
-0.2
7
Even
nes
s F
un
gi
-0.2
1
-0.2
1
0.0
7
0.0
1 -0
.06
-0.0
5 -0
.22
-0.1
4
0.1
4
0.0
01
-0.0
9
-0.0
1
-0.1
3 0
.07
-0.1
3
0.0
6
-0.1
1
-0.0
2
0.0
9
-0.1
4
PC
1 F
un
gi
-0.0
8
-0.1
9
-0.3
0
0.0
1 -0
.16
0.0
7 -0
.08
0.1
7
-0.2
0
-0.0
3
0.1
7
0.0
0
0.1
0 0
.20
0.1
0
-0.2
5
-0.0
1
0.2
3
0.0
7
0.1
3
PC
2 F
un
gi
-0.1
4
0.2
1
0.0
7
-0.0
5 0
.06
-0.3
1 0
.16
0.2
8
-0.2
6
-0.2
2
-0.2
5
0.5
8
-0.3
2 -0
.55
0.1
7
0.2
7
-0.2
1
0.2
7
-0.2
5
-0.0
8
Ric
hnes
s B
acte
ria
0.0
5
-0.2
3
0.0
01
0.0
3 -0
.33
-0.0
8 -0
.30
-0.3
2
-0.2
0
-0.1
2
-0.1
1
-0.0
9
-0.1
3 0
.22
-0.1
8
0.1
9
-0.0
7
0.1
8
-0.0
2
0.2
9
Sh
ann
on i
nd
ex B
acte
ria
0.0
6
-0.2
4
0.0
1
0.0
0 -0
.33
-0.1
2 -0
.34
-0.2
9
-0.2
2
-0.1
6
-0.0
9
-0.0
2
-0.1
2 0
.15
-0.1
9
0.2
2
-0.0
8
0.1
7
0.0
3
0.3
1
Even
nes
s B
acte
ria
0.0
6
0.0
6
0.0
2
-0.1
2 -0
.03
-0.2
3 -0
.19
0.2
1
-0.1
0
-0.2
3
0.0
4
0.3
5
0.0
7 -0
.34
-0.0
7
0.1
8
0.0
3
-0.1
0
0.2
1
0.0
0
PC
1 B
acte
ria
-0.0
4
-0.0
3
-0.0
2
0.0
2 -0
.01
0.0
6 -0
.01
-0.1
1
0.0
6
0.0
9
-0.1
3
-0.0
6
-0.1
1 0
.07
0.0
01
0.0
8
0.0
1
0.0
4
-0.0
9
-0.0
6
PC
2 B
acte
ria
-0.1
4
-0.0
1
0.0
4
-0.0
1 0
.13
-0.0
1 -0
.13
0.0
7
0.2
6
0.0
9
-0.1
3
0.1
3
-0.0
5 -0
.17
-0.0
8
0.1
7
0.1
1
-0.2
1
0.1
3
-0.4
0
Ph
osp
ohat
ase
acti
vit
y 0
.13
-0.1
7
-0.0
5
-0.3
8 -0
.13
-0.2
4 -0
.42
0.0
3
0.2
0
-0.2
3
-0.1
2
0.0
1
0.4
0 -0
.01
-0.2
1
0.2
0
0.2
7
-0.4
7
0.5
2
0.0
9
Ure
ase
acti
vit
y
0.3
1
0.2
6
0.2
3
0.0
2 0
.19
0.0
8 0
.16
-0.0
9
0.1
0
0.0
5
0.2
0
-0.1
4
0.2
0 -0
.11
-0.0
9
0.0
1
0.1
2
-0.3
0
0.0
6
0.0
9
Rec
o p
re-d
rou
ght
0.1
7
0.5
0
0.2
5
0.1
7 0
.23
-0.2
4 0
.00
0.3
8
-0.0
1
-0.2
2
0.2
1
0.5
9
-0.1
6 -0
.71
0.0
6
0.2
3
0.0
4
-0.1
9
0.0
2
-0.4
3
Rec
o 1
8-d
rou
ght
0.1
2
0.3
7
0.1
5
0.1
8 0
.17
-0.1
9 -0
.14
0.3
4
-0.0
2
-0.1
9
0.2
3
0.6
0
-0.2
3 -0
.62
0.0
8
0.2
6
0.0
3
-0.0
9
0.0
5
-0.4
2
Rec
o 3
6-d
rou
ght
0.1
0
0.2
7
0.1
1
-0.1
0 0
.09
-0.4
2 -0
.18
0.4
4
0.0
0
-0.3
2
-0.0
7
0.6
8
-0.0
3 -0
.68
0.0
5
0.4
4
0.2
0
-0.2
5
0.1
9
-0.3
2
Rec
o 5
5-d
rou
ght
0.1
3
0.2
8
0.2
8
-0.2
3 0
.24
-0.4
1 -0
.10
0.2
4
0.2
8
-0.2
6
-0.1
4
0.4
7
0.0
5 -0
.61
0.0
3
0.4
7
0.2
0
-0.4
8
0.2
3
-0.2
9
GP
P p
re-d
rou
gh
t (1
) 0
.67
0.2
1
0.1
0 0
.01
-0.0
1 0
.31
-0.2
3
-0.3
2
-0.1
9
0.2
9
-0.1
5
0.0
4 -0
.06
0.2
5
0.2
7
0.2
4
-0.0
4
-0.3
5
0.6
4
GP
P 1
8-d
rou
ght
(2)
0.5
6
0.3
3 0
.30
-0.1
1 0
.60
-0.0
5
-0.1
8
-0.1
7
0.2
5
0.1
3
-0.2
8 -0
.52
0.2
2
0.1
2
-0.1
1
-0.0
6
-0.5
8
0.0
6
GP
P 3
6-d
rou
ght
(3)
0.3
6 0
.56
0.0
5 0
.54
-0.4
4
0.3
3
0.1
8
0.2
4
-0.2
0
-0.1
7 -0
.40
-0.2
6
0.0
6
-0.2
3
-0.4
4
-0.2
7
-0.1
8
GP
P 5
5-d
rou
ght
(4)
0.1
5 0
.40
0.3
7
-0.1
4
-0.2
6
0.3
8
0.5
8
-0.1
0
-0.5
1 0
.06
0.0
5
-0.2
0
-0.0
3
0.3
7
-0.5
7
-0.3
4
Fv/
Fm p
redaw
n p
re-d
rou
ght
(5
) 0
.54
0.6
5
-0.1
8
0.6
1
0.7
1
0.3
6
-0.1
1
-0.0
1 -0
.47
0.0
2
0.1
9
0.0
6
-0.4
3
-0.0
4
-0.3
6
Fv/
Fm p
redaw
n18
-dro
ught
(6)
0.2
0
-0.4
6
0.3
8
0.8
9
0.6
3
-0.5
7
-0.0
3 0
.25
-0.1
8
-0.2
3
-0.0
3
-0.0
5
0.0
3
-0.1
8
Fv/
Fm p
redaw
n 3
6-d
rou
ght
(7)
0.0
1
0.0
1
0.3
9
0.2
2
-0.0
4
-0.1
1 -0
.32
0.3
6
0.1
5
0.2
2
-0.0
4
-0.5
7
-0.0
2
Fv/
Fm p
red
awn
55
-dro
ught
(8
) -0
.42
-0.3
2
-0.1
9
0.7
5
0.2
5 -0
.37
0.3
1
0.0
3
0.4
1
0.1
6
0.1
5
-0.2
1
Fv/
Fm m
idd
ay p
re-d
rou
ght
(9)
0.4
9
0.0
01
-0.4
4
0.1
4 0
.01
-0.2
7
-0.0
5
-0.1
6
-0.6
6
0.3
9
-0.4
3
Fv/
Fm m
idd
ay 1
8-d
rou
ght
(10
) 0
.40
-0.4
2
-0.0
2 0
.10
-0.1
1
0.0
0
0.2
0
-0.1
5
0.0
1
-0.3
7
Fv/
Fm m
idd
ay 3
6-d
rou
ght
(11
) -0
.30
0.0
1 0
.03
-0.1
1
-0.4
3
-0.1
2
-0.0
1
-0.0
2
-0.0
2
Fv/
Fm m
idd
ay 5
5-d
rou
ght
(12
) -0
.25
-0.6
7 0
.38
0.4
5
0.1
3
0.3
4
-0.1
1
-0.2
0
gS p
re-d
rou
gh
t (1
3)
0.0
7 -0
.42
-0.2
4
0.4
3
-0.6
6
0.7
6
0.2
5
gS 1
8-d
rou
ght
(14
) 0
.02
-0.3
9
0.0
4
0.2
4
0.0
3
0.2
8
gS 3
6-d
rou
ght
(15
) 0
.41
0.2
8
0.5
7
-0.6
0
0.1
8
gS 5
5-d
rou
ght
(16
) 0
.45
0.0
6
-0.2
3
0.1
5
Fin
al W
ater
Pote
nti
al (
17
) -0
.14
0.1
1
0.1
0
Fin
al S
LA
(1
8)
-0.6
2
0.1
5
Fin
al s
eed
lin
g b
iom
ass
(19
)
-0.0
7

HABITAT FRAGMENTATION CAN MODULATE DROUGHT EFFECTS
168
T
ableS4.7Correlationbetweeninitialphysicochemicalcharacteristicsofsoilswithsoilmicrobialcom
munitiesandsoil
functioning,insoilsfromtwoclimaticallydifferentregionsandtwofragmentsizesofholmoakfragm
entsforestinSpain,
subjectedtodrought‐rew
ettingsimulations(n=36).SignificantPearson’scorrelation(p<0.05)areinbold(*<0.05;**<0.01;
***<0.001).Underlinedvariablesusedmeanvaluesoftheinitialphysicochemicalcharacteristicsofsoils.CEC=cation
exchangecapacity,SOM=SoilOrganicMatter.PC1=firstandPC2=secondcom
ponentofPCA;R
eco=ecosystem
respiration.†
Variableslatterincludedinstepw
isemultipleregressions(seeTable5)
(1
) (2
) (3
) (4
) (5
) (6
) (7
) (8
) (9
) (1
0)
(11)
(1
2)
(13)
U
reas
e
Wat
er h
oldi
ng c
apac
ity
0.30
-0
.31
-0.3
2 -0
.15
-0.0
3 0.
37*
0.18
0.
25
0.23
-0
.14
-0.0
1 0.
48**
0.
43*
0.29
CE
C
0.28
-0
.27
-0.3
0 -0
.18
0.00
1 0.
44**
0.
08
0.15
0.
22
-0.1
3 0.
01
0.43
* 0.
28
0.23
Mg2+
0.
16
-0.2
3 -0
.33
-0.3
4 0.
10
0.50
**
-0.0
3 0.
03
0.07
-0
.09
-0.0
1 0.
15
-0.0
7 0.
06
Ca2+
0.
3 -0
.28
-0.2
9 -0
.14
-0.0
2 0.
40*
0.12
0.
19
0.24
-0
.13
0.01
0.
48**
0.
37*
0.27
Na+
0.
26
-0.2
7 -0
.32
-0.2
3 0.
02
0.47
**
0.06
0.
12
0.19
-0
.12
0.01
0.
37*
0.21
0.
19
SO
M †
0.
32
-0.3
0 -0
.29
-0.0
7 -0
.06
0.28
0.
24
0.30
0.
25
-0.1
3 -0
.02
0.53
**
0.55
**
0.33
N o
rgan
ic
0.32
-0
.30
-0.2
8 -0
.05
-0.0
8 0.
22
0.29
0.
35*
0.25
-0
.13
-0.0
3 0.
54**
0.
61**
* 0.
35*
P2O
5
0.32
-0
.33
-0.3
2 -0
.08
-0.0
7 0.
23
0.32
0.
37*
0.23
-0
.14
-0.0
5 0.
52**
0.
61**
* 0.
35*
K+
0.01
-0
.03
-0.1
3 -0
.29
0.14
0.
46**
-0
.29
-0.2
6 -0
.02
-0.0
2 0.
05
-0.0
9 -0
.46**
-0
.14
pH †
-0
.15
0.19
0.
13
-0.1
3 0.
13
0.27
-0
.48**
-0
.48**
-0
.08
0.05
0.
11
-0.2
9 -0
.70**
* -0
.29
Agg
rega
te s
tabi
lity
†
0.21
-0
.25
-0.1
9 0.
08
-0.1
3 -0
.16
0.48
* 0.
5*
0.13
-0
.08
-0.1
0 0.
39*
0.75
***
0.34
Mic
robi
al b
iom
ass
-0.0
9 -0
.10
-0.1
2 -0
.05
0.00
1 -0
.34
0.38
* 0.
34
-0.2
0 0.
02
-0.1
6 -0
.19
0.21
0.
02
Soi
l m
oist
ure
(1) †
-0.3
7* -0
.48**
-0
.41*
-0.7
0***
0.21
0.
4* 0.
33
-0.3
6* 0.
78**
* 0.
04
0.68
***
0.45
**
0.58
***
Ric
hnes
s F
ungi
(2)
0.
91**
* 0.
16
0.32
0.
05
-0.5
**
-0.4
9**
0.02
-0
.23
-0.3
3 -0
.38*
-0.3
3 -0
.34
Sha
nno
n in
dex
Fun
gi (
3)
0.55
**
0.35
* 0.
05
-0.4
4* -0
.42*
0.20
-0
.38*
-0.1
7 -0
.37*
-0.3
8* -0
.43*
Eve
nnes
s F
ungi
(4)
0.
18
-0.0
1 -0
.03
0.02
0.
46**
-0
.47**
0.
25
-0.1
0 -0
.24
-0.3
3
PC
1 F
ungi
(5)
0.
00
-0.3
3 -0
.26
0.47
* -0
.72**
* -0
.16
-0.5
8***
-0.4
9**
-0.3
0
PC
2 F
ungi
(6)
-0
.09
-0.0
8 0.
12
-0.1
1 -0
.26
0.00
1 -0
.26
-0.1
9
Ric
hnes
s B
acte
ria
(7)
0.98
***
-0.2
0 0.
29
0.03
0.
41*
0.42
* 0.
29
Sha
nno
n in
dex
Bac
teri
a (8
) -0
.06
0.17
0.
09
0.41
* 0.
40*
0.25
Eve
nnes
s B
acte
ria
(9)
-0.7
0***
0.45
**
-0.0
4 -0
.27
-0.2
0
PC
1 B
acte
ria
(10)
-0
.02
0.45
**
0.34
0.
51**
PC
2 B
acte
ria
(11)
0.
38*
-0.1
0 0.
06
Rec
o (1
2)
0.
50**
0.
50**
Pho
spha
tase
(13
)
0.37
*

Theinb
phyovershaeffect
Manuscriptin
C
nfluenceobioclimatysicochemadowspotsinthermicrobi
npreparation
apítu
offorestfticregionmicalsoilotentialsresistancealsystem
lo5
fragmentoverthelcharacteeedlingpeofthepmtodroug
tationandebio‐eristicsprovenanplant‐soil‐ght
d
ce‐


CAPÍTULO5
171
Abstract
Besidesthestrongdependenceonthewaterregimenthatcharacterizesthe
functioning of Mediterranean ecosystems, forest fragmentation might be
considered one of the most important human‐related threats for these
ecosystems. Predictions,moreover, suggest that the impacts of those two
enginesof global change, climate (drought) and forest fragmentationwill
beprogressivelyaggravatedintheMediterraneanBasin.Inthisregard,itis
expectable that these environmental perturbations will have less severe
consequences for organisms historically grown under more extreme
climatic conditions (drought) and/or historically more exposed to
fragmentation. Here, we studied the interactive effect of climate and
fragmentation (influence of the surrounding agricultural matrix) to
evaluate how and in which strength both seedling provenances and soil
origincouldaffectthefunctionalresponseoftheplant‐soilsystem.Weused
amicrocosm approachwith holm oaks from three different provenances
grown in soils from two different origins (bio‐climatic regions) collected
fromstandsunderthreedifferentscenariosoffragmentationinfluence:no
influence (inside large fragments), mild influence (edges of large
fragments)andstrong influence (small fragments).Weused indicatorsof
whole system functioning (ecosystem respiration), of plant physiological
performance (gross primary productivity, stomatal conductance,
photochemical efficiency), plant biomass allocation patterns (height,
diameter, biomass, root:shoot ratio, specific leaf area), and degree and
diversity of mycorrhization (percentage of ectomycorrhizal fungal,
morphotypes number). The response of the plant‐soil system to drought
wasstronglydependentontheeffectoflocalbioclimaticconditionsandthe
influenceoftheagriculturalmatrixoversoil:microcosmwerefunctionally
moreresistanttodroughtifsoilswerecollectedfromsmallfragmentsand
forest edges and from a region historicallymore adapted to drought (i.e.

OVERSHADOWEFFECTOFTHEFORESTFRAGMENTATION
172
southern and drier region). On the contrary, seedling provenance barely
conditionedtheresponseofthemicrocosmstodrought.Ourresultsfurther
showed that the higher percentage of ectomycorrhizal fungi found in
microcosms with soils from the northern, wetter and colder region,
negatively affected the response of the plant‐soil system to drought,
suggestingthatmicrobialdiversitymightnotalwayshaveapositiveeffect
over the functioning and resistance of ecosystems to environmental
perturbations. Together, our results suggest that the bio‐geochemical
properties of soils, resulting from the historical conditions atwhich they
havebeendeveloped,andnotthehistoricaladaptationofplanttoclimate,
determinedtheresponseoftheplant‐soilsystemtodrought.

CAPÍTULO5
173
Introduction
ThefunctioningofMediterraneanecosystemsishabituallyconstrainedby
water availability, given that both plant productivity (Larcher, 2000;
Sanchez‐Gomez et al., 2006) and soil activity (Lavorel et al., 1998;
Reichsteinetal.,2002;Rambaletal.,2003;Almagroetal.,2009;Barbaet
al.,2013)arestronglysubjected to seasonalandspatialvariationsof this
resource. In this regard, the expected further reduction in soil water
availability,dueto forecastedtemperature increaseandrainfallreduction
for this region (IPCC, 2007) is likely to be associated with strong and
irreversible modifications of carbon and water cycles (Reichstein et al.,
2002;CookandOrchard,2008;Barbaetal.,2013).Actually,theincreased
intensity of drought in recent decades has led to a decrease in tree
productivity (Ogaya andPeñuelas, 2004; Barba et al., 2013), and even to
forest decline (Hereş et al., 2012) in some areas of the Mediterranean
Basin, which has been already related to changes in soil microbial
communities(CurielYusteetal.,2012)andCO2fluxes(Barbaetal.,2013).
Climate change is not the only threat affecting the ecology and
functioningofecosystemsintheMediterraneanBasin.Otherperturbations,
such as habitat fragmentation, can be considered among the most
impactinghuman‐relatedactivities thathavecontributed to thehistorical
transformationofthisareaoftheworld(Aladosetal.,2004;Valladareset
al.,2004;Blondel,2010),althoughitseffectsontheecosystemfunctioning
have been less studied than climate related ones (i.e. drought). Besides,
moststudiesonhowforestfragmentationaffectstheecologyofterrestrial
ecosystems havemainly focused on above‐ground organisms, and only a
few have paid attention to its effects over the soil system (Zheng et al.,
2005;Malmivaara‐Lämsäetal.,2008;Riuttaetal.,2012)anditsinteractive
effectwithdrought,avery important factor inMediterraneanecosystems
(Lázaro‐Nogal et al., 2012; Flores‐Rentería et al., 2015). These previous

OVERSHADOWEFFECTOFTHEFORESTFRAGMENTATION
174
studies have shown that decreasing the size of the forest fragment, as a
proxy of fragmentation extent, can modulate the effects of drought by
improving local environmental conditions, increasing the availability of
waterandnutrients forbothplants andmicroorganisms (Flores‐Rentería
etal.,2015).Theincreasedsoilfertilityandhigheravailabilityofwaterof
fragmented forests has been further associated with higher rates of soil
microbialactivity(Chapters2and3),whichhighlights the importantrole
that fragmentationmay have onmicrobial communities and their role in
theecosystemfunctioning(Chapters3and4).
Historical precipitation regimes can influence the response to
droughtofplants(andevenofparticularprovenancesinthecaseofQ.ilex;
e.g. (Gratani, 1995;Gratani et al., 2003; Pesoli et al., 2003;Gimeno et al.,
2009; Andivia et al., 2012), and microbial communities (Evans and
Wallenstein,2012;CurielYusteetal.,2014;EvansandWallenstein,2014),
although the simultaneous effect of drought over the response of plants,
microbesandthestronginteractionsbetweenplantandmicrobeshasbeen
poorlyexplored(Richardetal.,2009;Gehringetal.,2014;Flores‐Rentería
et al., 2015).Moreover, there is a lack of studies designed to understand
how the interaction of those two important engines of global change,
drought and fragmentation, may affect the ecology of Mediterranean
ecosystems.Theinteractionofdifferentdriversfrequentlygeneratesnon‐
additive effects that, in turn, can either attenuate or exacerbate the
ecosystemresponses to individualdrivers (Matesanzetal.,2009;Lázaro‐
Nogaletal.,2012;Flores‐Renteríaetal.,2015).
The general objective of this study was to advance our
understandingontheinteractiveeffectofdroughtandforestfragmentation
over theplant‐soil system, and to evaluatehow theprovenanceofplants
and soils, as a proxy for historical adaptation to different environmental
conditions, could affect its functioning. For this, we used a microcosm
CAPÍTULO5
175
approachwithdifferentQ.ilexprovenancesgrowninsoilsfromfragments
with different influence of the agricultural matrix, collected in holm‐oak
forest locatedintwoclimaticallydistinctregionsoftheIberianPeninsula.
AsthereareevidencesofdifferentialfunctionalresponseofdifferentQ.ilex
populationstodrought(Gratanietal.,2003;Andiviaetal.,2012),first,we
hypothesized that seedling provenance will determine their response to
drought,i.e.thosefromdriersiteswouldhavehigherresistancetodrought.
Second, we postulated that the native microbial community of soils
associated with seedlings will buffer the effect of drought stress on the
plant‐soil system, i.e. soilswithoriginalmicrobialpropaguleswouldhave
higher resistance to drought. Third, we hypothesized that the functional
response of the plant‐soil system to drought will be determined by the
specificbiogeochemicalcharacteristicsofsoilsderivedfromthebioclimatic
region and the agricultural matrix influence, i.e. soils with a higher
influence of the agricultural matrix, more fertile and with higher water
holdingcapacity(Flores‐Renteríaetal.,2015),andhistoricallyadaptedto
drought (e.g. from the drier region), would resist better the simulated
drought.

OVERSHADOWEFFECTOFTHEFORESTFRAGMENTATION
176
Materialandmethods
Soilorigin
Weselectedthreelarge(>10ha)andfivesmall(<0.5ha)forestfragments,
resultingfromtheconversionofacontinuousholm‐oak(QuercusilexL.ssp.
ballota (Desf.) Samp) forest into a patchy agricultural landscape, in two
climatically different bioclimatic regions of Spain (Fig. 1.4 in Chapter 1).
Thelargefragmentsweresubdividedintoforestinterior(>30mfromthe
edge) and forest edge. In the northern region (Lerma; 41°58’‐42°02’N,
03°45’‐03°52’W;930masl),thestudiedfragmentswerewithinanareaof
1500 ha, showed similar spatial structure and vegetation characteristics,
andwereseparatedofat least50mtoamaximumof11km(Fig.1.5a in
Chapter 1). This region is characterized by 554 mm mean annual
precipitationand11°Cmeanannualtemperature(Ninyerolaetal.,2005).
Thedominanttreespeciesistheholmoak,withisolatedLusitanianoakQ.
faginea Lam. and Spanish juniper Juniperus thurifera L. and understory
shrubs typical of wetter and cooler supramediterranean localities (e.g.
Cistus laurifoliusL.,Genistascorpius (L.)DC,ThymuszygisLoefl. exL.; see
(Santos and Tellería, 1998; Díaz et al., 1999) for further details). In the
southernregion(QuintanardelaOrden;39°30’‐39°35’N,02°47’‐02°59’W;
870masl),thestudiedfragmentswerewithinanareaof1000ha,showed
similarspatialstructureandvegetationcharacteristics,andwereseparated
ofatleast50mtoamaximumof8km(Fig.1.5binChapter1).Thisregion
is characterized by 434 mmmean annual precipitation and 14 °C mean
annualtemperature(Ninyerolaetal.,2005).Thedominanttreeistheholm
oakQ. ilexwiththeunderstorycomposedofshrubbyKermesoakQuercus
cocciferaL.andshrubspeciestypicalofxericmesomediterraneanlocalities
(e.g. Asparagus acutifolius L., Cistus ladanifer L., Rhamnus alaternus L.,
Rhamnus lycioides Brot.; see (Santos andTellería, 1998;Díaz andAlonso,

CAPÍTULO5
177
2003) for further details). Both sites are characterized by a pronounced
summerdroughtperiod,usuallylastingfromJulytoSeptember(Fig.1.7in
Chapter 1), and their climatic characteristics are representative of the
mesomediterranean and supramediterranean bioclimatic zones of the
IberianPeninsula,respectively(Rivas‐Martínez,1981).Thedominantsoils
are classified as Cambisols (calcics) (WRB, 2007), of sandy loam texture,
with17%sand,39%silt and44%clay for the southern regionand,11%
sand,42%siltand47%clay for thenorthernregion. Inbothregions, the
original forest is now highly fragmented due to the land conversion for
intensivecultivationofcerealcrops,legumes,andsomegrapes(Santosand
Tellería, 1998; Díaz et al., 1999; Díaz and Alonso, 2003). Remnants of
forestshavebeenleftbetweencropsandtheyarenowimbibedwithinthe
activeagriculturalmatrix,yetclearlydifferentiated.Mainphysicochemical
characteristics of soils at each level of agricultural matrix influence are
presentedinTableS5.1.
Soilsamplingandpreparation
Soilswerecollectedwithineachfragmentandregionattheendofthedry
seasonfromadepthof0‐15cm,sieved(<2mm)insitu,anddriedatroom
temperature.Ineachrespectivecase,halfofsoilwasautoclavedat120°C
for 1h, to eliminate native resistant soil microbial propagules. We
considered three factors and a total of 12 soil treatments: 1) the factor
agriculturalmatrix influenceconsistedof three levels: forest interior (Fi),
forestedge(Fe)andsmallfragment(Sf),2)theregionoftwo:northern(N)
andsouthern(S),and3)thefactornativesoilmicrobialcommunity(coded
as “native or no native microbial community”) of two: presence (non‐
autoclaved soil) and absence (autoclaved soil) of native microbial
community.Bothsoilswerefinallyexpectedtoharbormicroorganisms,but
our interest was put on the origin of thismicrobial community (see Fig.
S5.1).

OVERSHADOWEFFECTOFTHEFORESTFRAGMENTATION
178
Seedlingprovenance
Randomly selected holm oak acorns from three different bioclimatic
regions(Fig.1.4inChapter1):Galaico‐Leonesa(41°56’N,06°15’W;730m
asl; coded as “Gal”), LaMancha (39°51’N, 02°58’W; 760m asl; coded as
“Lam”),andSistemaIberico(39°88’N,01°38’W;1042masl;codedas“Sib”)
wereplantedin300cccellsfilledwithpeat(45cellspertray),inanopen‐
air nursery at the Centro Nacional de Mejora Forestal “El Serranillo”
(Guadalajara,centralSpain,40°39’N,3°19’W),forseventeenmonths.These
seedlingprovenanceswereselectedbecausetheywereclosetotheregions
where the studied soils were collected and because their provenance
region presented a precipitation and temperature gradient. The Galaico‐
Leonesa zone (supramediterranean) is characterized by 756 mm mean
annual precipitation and 10 °C mean annual temperature, and has
predominantly cambisols humic soils; the Sistema Iberico zone (also
supramediterranean) is characterized by 608 mm mean annual
precipitation and 12 °C mean annual temperature, with cambisols calcic
soils;LaMancha(mesomediterranean) ischaracterizedby446mmmean
annualprecipitationand14 °Cmeanannual temperature,with cambisols
calcic soils (Rivas‐Martínez, 1981; Jiménez et al., 1996; Ninyerola et al.,
2005). A total of 120 seedlings of each provenance were grown in the
respectivesoiloriginandtreatment (i.e. full factorial),with tenreplicates
per treatment, and kept growing in a greenhouse under controlled
conditions for a year (see details below; design in Table S5.2). Seedling
survival,heightanddiameterwererecordedeverytwomonthsduringthis
acclimatization period, after which, the initial number of replicates was
reducedbymortalityto3‐10dependingonthetreatment(TableS5.2).

CAPÍTULO5
179
Experimentaldesign
The experimental design encompassed treatments seedlings and soil
microbial communities historically adapted to the wettest and coldest
(Galaico‐Leonesa and northern region, respectively), or to the driest and
warmer conditions (La Mancha and southern region). A total of 360
seedlingsweretransferredtoindividual1600ccmicrocosms(intrayswith
six), and each one was filled with a mixture of 1:1 (v:v) soil:substrate
(2:1:1, v:v:v, peat:sand:vermiculite; autoclaved), each tray containing the
three seedling provenances and one of the 12 soil treatments:
northern/southern region, forest interior/edge/small fragment and
presence/absence of native microbial community. Trays were randomly
arranged in the greenhouse (25 °C and 40 % air humidity), regularly
moved toavoidmicro‐siteeffects, andwatered to fieldcapacitybasedon
weight loss (between 30‐35% soil water content, SWC). Just after
transplanting, 3 g of slow‐released fertilizer were applied (NUTRICOTE,
Projar,Madrid, Spain) to eachmicrocosm.One year after the experiment
set up, we applied a drought simulation defined by three experimental
periods: 1) pre‐drought with seedlings in well‐watered pots (28‐32%
SWC); 2) mild‐drought after 20 days at ~12‐18% SWC; and 3) severe‐
droughtafter40daysat~4‐6%SWC.Foreachmicrocosm,wedetermined,
within three consecutive days (randomizing the treatments within each
dayandalongtheday),thevariables:CO2exchange,stomatalconductance,
and soil temperature, as well as photochemical efficiency that was
determined at pre‐drought and severe‐drought. Additionally, seedling
waterpotentialandgrowthvariables(height,diameterandbiomass)were
measuredaftersevere‐drought,togetherwithmycorrhizalpercentagesand
the number of fungal morphotypes per seedling. Soil water content was
determinedbasedonweightlosspertray,everythreedays.

OVERSHADOWEFFECTOFTHEFORESTFRAGMENTATION
180
CO2exchangeintheplant‐soilsystem
Each individual plant‐soil microcosm was measured for net ecosystem
exchange (NEE), defined as the net balance between Gross Primary
Productivity (GPP) and Ecosystem Respiration (Reco), by using a non‐
steady‐state dynamic (closed dynamic) approach. For that purpose, a
rectangularplexiglaschamberwithabaseof0.01m2andavolumeof0.004
m3 with a small fan to mix the air internally was built to fit over the
microcosms (see Figure S4.1 in Chapter 4). The change of CO2
concentrationswasmeasuredwithaCO2infraredgasanalyzer(EGM‐4,PP‐
systems,MA,USA).Thechamberwascoveredwithopaquealuminumfoil
to determine ecosystem respiration (Reco) including both autotrophic
(plantsandmycorrizas)andheterotrophic(microorganisms)components.
Respirationratesweremeasured ineach the transparentand theopaque
chamber, for 52 s. Diurnal CO2 exchange measurements were taken
randomly in all microcosms (11:00‐17:00). NEE (transparent chamber)
and Reco (opaque chamber) were determined by calculating the CO2
increase in the closed loop in the respectivemeasurements according to
the formula (Street et al., 2007):ρ∗ ∗
, where Ic is the net CO2
increase (μmolm‐2 s−1), is airdensity (molm‐3),V the chamber volume
(m3), dC/dt represents the slope of CO2 concentration increase in the
chamber over time (μmol mol−1 s−1), and A is the chamber surface area
(m2).Grossprimaryproductivity(GPP)wascalculatedbysubtractingReco
fromNEE.Themaximumdifferencebetweenatmospheric(Ca)andinternal
CO2 (Ci) was used to correct for chamber leaks using a linear equation
(Pérez‐Priegoetal.,2010).Carbonfluxes(RecoandGPP)wereadditionally
corrected for seedling size using total and foliar biomass, respectively.
Additionally, soil temperature was recorded immediately after CO2

CAPÍTULO5
181
exchange measurement at 10 cm depth in each microcosm by using a
wirelessmultiloggerthermometer(Omega,Connecticut,USA).
Seedlinggrowthandphysiologicalvariables
Stomatal conductance (gs) was measured with a leaf porometer SC‐I
(Decagon, Pullman, USA), during the period of maximal conductance
(10:00‐12:00h).Predawnandmiddaymaximumphotochemicalefficiency
ofphotosystemII(Fv/Fm)weremeasuredwithaportablepulse‐modulated
fluorometerFMS2(Hansatech,Norfolk,UK),withleavespreviouslyheldin
the leaf clipholder for30min. Seedlingbiomass (shoot, foliar, and root),
heightanddiameter,aswellasSpecificLeafArea(SLA)determinedasleaf
area (obtained by measuring scanned leaves) per gram dry mass, were
recordedattheendoftheassay.
Mycorrhizalassessmentandmorphologicalidentification
Foreachseedling,theentirerootwasseparatedfromshootanddividedin
oldroot(withintheinitialpeatrootball)andnewroot(newlydevelopedin
themicrocosm),washedfreeofsubstrateandcutinto2‐cmsegments.The
ectomycorrhizal (EM) percentage of each seeding was assessed on new
roots by counting all single root tips under the stereo‐microscope, that
were classified as mycorrhizal or non‐mycorrhizal according to the
presence or absence of fungal mantle and mycelium and to the lack or
presence of root hairs, respectively. Ectomycorrhizal percentages were
obtained by dividing the number of mycorrhizal root tips by the total
numberofroottips.EMroottipswereclassifiedbymorphotypesbasedon
thecharacteristicsoftheirmantleandextra‐matricalmycelium(branching,
surfacecolor,texture,emanatinghyphaeandrhizomorphs;Agerer,1997).
Relativefrequency(expressedaspercentage)ofeachEMmorphotypewas
calculated as its absolute frequency (number of seedlings in which a
morphotypeoccurreddividedbythetotalnumberofseedlings)dividedby

OVERSHADOWEFFECTOFTHEFORESTFRAGMENTATION
182
the sum of the absolute frequencies of all morphotypes (Rincón et al.,
2007). The relative abundance of an EM morphotype (expressed as
percentage) was estimated by dividing the number of tips of this
morphotype by the total number of tips of themorphotypes found in all
seedlings (Rincón et al., 2007). Relative frequency and abundance
measured respectively the presence and quantity of a givenmorphotype
relative to all morphotypes, in the roots of seedlings of a given sub‐
populationoftheexperiment.
Dataanalysis
AllstatisticalanalyseswereperformedwiththeStatisticav.10.0Software
Package(StatSoft,Inc.2007;TulsaOK,USA).Priortoanalyses,allvariables
were tested for normality, and log transformationswere applied tomeet
variance homoscedasticitywhen required;mycorrhizal percentageswere
arc‐sintransformed.
Theeffectofthefactors:“regionofsoils”(soilsfromthenorthernor
southern regions), “matrix influence over soils” (soilswith low influence
from forest interior, soils withmid‐influence collected from forest edges
and soils with high influence collected from small fragments), “soil
microbial communities” (nativeorno‐native soilmicrobial communities),
“seedling provenance” (provenance from Gal, Sib or Lam), and their
interactionsweretestedonfinalseedlingmeasurements(height,diameter,
biomass, foliar biomass, root/shoot ratio, SLA, mycorrhizal percentages,
number of morphotypes), by Analysis of Variance (ANOVA). Repeated‐
measures ANOVAs were used to test the effects of all factor and their
interactionsalongthedroughtperiod,oncontinuouslymeasuredvariables
(Reco, GPP, gS, SWC,Fv/Fm). Subsequent repeated‐measures ANOVAswere
appliedtoexploretheresponsewithineachseedlingprovenanceornative
microbial community to the factors region and matrix influence. Finally,
repeated‐measuresANOVAswereperformedwithoutfactorsthatwerenot
CAPÍTULO5
183
significant within the overall factorial analysis (i.e. native microbial
community and seedlingprovenance).T‐testswereperformed to analyze
thedifferencesamongrelativefrequencyofEMmorphotypes.Survivalwas
analyzed by a Peto and Peto test using X2 (Pyke and Thompson, 1986).
CorrelationsamongallvariablesweredeterminedbyPearson’scorrelation
analysis. Simple linear regressions were run to analyze soil moisture
sensitivityofcarbonfluxesandstomatalconductance.

OVERSHADOWEFFECTOFTHEFORESTFRAGMENTATION
184
Results
Impactofdroughtovertheplant‐soilsystem
As expected, drought negatively affected the functioning of the plant‐soil
system (i.e. Reco, GPP, gS, predawn andmidday Fv/Fm, and SWC; Fig. 5.1;
Table 5.1). The response to drought of the whole system was strongly
dependent on the regionoforiginof soils, thedegreeofmatrix influence
over soils, and their interaction (the last except in the case of Fv/Fm).
Contrarily, neither the seedling provenance nor the soil microbial
community (i.e. native or not), or their interactionwith any other factor,
affected the systemalong thedrought simulation (Table5.1).Only in the
caseofSWC,thesoilmicrobialcommunitieshadaninteractiveeffectwith
droughtandregion,revealedasan initial (pre‐drought)negativeeffectof
native microbial communities in the southern region over this variable.
RegardingthesignificantinteractiveeffectofregionandmatrixoverSWC,
at pre‐drought, the highest SWC values were observed in soils from the
northernregioninforestinteriorandedgesthatlatter,atmildandsevere‐
drought,showedthelowestvalues(Fig.S5.2).
Since neither seedling provenance nor soil microbial community
(native or not) had significant effects on the functional response of the
plant‐soilsystemtodrought,wesubsequentlyperformedtheanalysisonly
considering the factors “region of soil origin” and "soil with different
influenceoftheagriculturalmatrix”(TableS5.3).

CAPÍTULO5
185
Table5.1Impactofdroughtoverthewholeplant‐soilsysteminholmoakforestsoilsfrom
twoclimaticallydifferentregions
ofSpain(R),collectedinfragmentswithdifferentagriculturalmatrixinfluence(MI),withnativeorno‐nativemicrobial
communities(MC),andholdingdifferentseedlingprovenances(Se).DatawereanalysedbyrepeatedmeasuresANOVAwith
allstudiedfactorsandtheirinteractions.Significanteffectsarenotedinbold.Reco=Ecosystem
respiration;GPP=gross
primaryproductivity;g
S=stomatalconductance;F
v/F m=photochemicalefficiency(measuredatpre‐andfinal‐drought);SWC=
Soilwatercontent.
Re
co
GP
Pg
SF
v/F
mP
red
aw
nF
v/F
mM
idd
ay
SW
C
Fp
Fp
Fp
Fp
Fp
Fp
Re
gio
n(R
)1
0.4
0<
0.0
01
1.2
70
.26
23
.43
0.0
66
11
.18
<0
.00
16
.95
0.0
09
34
.78
<0
.00
1
Ma
trix
influ
en
ce(M
I)8
.74
<0
.00
11
.79
0.1
70
3.9
50
.02
11
2.4
4<
0.0
01
11
.67
<0
.00
11
7.7
1<
0.0
01
Mic
rob
ialc
om
mu
niti
es
(MC
)0
.61
0.4
37
3.2
00
.07
51
.83
0.1
77
1.7
50
.18
72
.22
0.1
37
3.0
10
.08
4S
ee
dlin
g(S
e)
0.0
50
.95
21
.14
0.3
22
0.1
60
.85
11
.29
0.2
76
0.8
40
.43
20
.16
0.8
52
Rx
MI
2.8
50
.06
00
.03
0.9
69
0.3
90
.67
82
.10
0.1
25
1.6
40
.19
77
.07
<0
.00
1
Rx
MC
0.4
10
.52
20
.19
0.6
59
0.0
30
.86
20
.75
0.3
87
0.5
50
.45
82
.93
0.0
88
MI
xM
C1
.10
0.3
33
0.1
00
.90
61
.20
0.3
02
2.4
10
.09
32
.51
0.0
84
0.3
90
.68
0R
xS
e0
.19
0.8
27
1.1
50
.31
82
.02
0.1
35
2.3
40
.09
92
.36
0.0
97
1.6
90
.18
8M
Ix
Se
0.1
50
.96
30
.19
0.9
42
0.6
30
.63
80
.12
0.9
77
0.1
10
.97
80
.85
0.4
96
MC
xS
e0
.08
0.9
20
1.1
70
.31
41
.84
0.1
61
2.7
10
.06
93
.53
0.0
51
0.8
40
.43
1R
xM
Ix
MC
0.8
70
.41
92
.61
0.0
76
2.2
00
.11
31
.13
0.3
27
1.4
30
.24
21
.47
0.2
32
Rx
MI
xS
e0
.12
0.9
77
0.4
10
.80
20
.39
0.8
15
1.5
10
.20
21
.28
0.2
81
1.0
30
.39
2R
xM
Cx
Se
0.4
40
.64
61
.08
0.3
40
0.1
80
.83
11
.96
0.1
43
1.2
80
.28
10
.96
0.3
84
MI
xM
Cx
Se
0.6
20
.64
61
.18
0.3
19
0.5
70
.68
70
.52
0.7
23
0.4
50
.77
30
.65
0.6
31
Rx
MI
xM
Cx
Se
0.8
60
.49
10
.20
0.9
39
1.2
60
.28
61
.78
0.1
34
2.0
10
.09
50
.22
0.9
29
Dro
ug
ht(
D)
86
1.4
0<
0.0
01
37
2.2
1<
0.0
01
69
7.3
3<
0.0
01
75
8.6
2<
0.0
01
87
9.5
8<
0.0
01
10
49
1.3
1<
0.0
01
Dx
R5
.11
0.0
06
9.4
6<
0.0
01
21
.03
<0
.00
12
3.0
8<
0.0
01
21
.38
<0
.00
18
5.4
5<
0.0
01
Dx
MI
3.4
10
.00
95
.79
<0
.00
18
.06
<0
.00
19
.68
<0
.00
19
.44
<0
.00
12
7.5
6<
0.0
01
Dx
MC
1.1
60
.31
51
.29
0.2
76
0.3
20
.72
90
.32
0.5
73
0.0
50
.82
74
.77
0.0
09
Dx
Se
0.3
70
.83
10
.54
0.7
07
1.2
60
.28
30
.89
0.4
14
0.5
10
.60
00
.05
0.9
94
Dx
Rx
MI
2.4
20
.04
84
.92
<0
.00
12
.43
0.0
47
1.8
90
.15
31
.88
0.1
56
9.5
6<
0.0
01
Dx
Rx
MC
1.0
30
.35
90
.36
0.6
99
0.6
70
.51
40
.28
0.5
97
0.3
40
.56
14
.31
0.0
14
Dx
MI
xM
C1
.07
0.3
73
0.5
50
.69
91
.56
0.1
85
1.3
50
.26
21
.11
0.3
32
0.2
70
.89
8D
xR
xS
e0
.31
0.8
72
0.7
40
.56
20
.14
0.9
65
1.8
50
.16
00
.65
0.5
21
0.8
90
.47
1D
xM
Ix
Se
0.8
20
.58
70
.86
0.5
47
1.4
30
.18
40
.38
0.8
26
0.3
70
.83
20
.63
0.7
49
Dx
MC
xS
e1
.92
0.1
06
1.0
80
.36
40
.21
0.9
35
2.4
30
.09
12
.29
0.1
03
1.6
80
.15
3
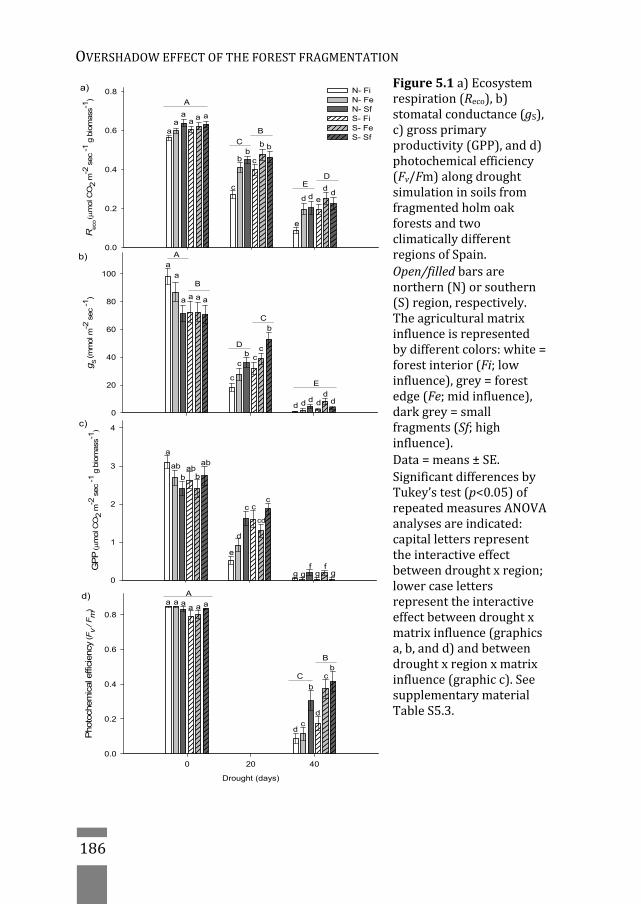
OVERSHADOWEFFECTOFTHEFORESTFRAGMENTATION
186
Figure5.1a)Ecosystemrespiration(Reco),b)stomatalconductance(gS),c)grossprimaryproductivity(GPP),andd)photochemicalefficiency(Fv/Fm)alongdroughtsimulationinsoilsfromfragmentedholmoakforestsandtwoclimaticallydifferentregionsofSpain.Open/filledbarsarenorthern(N)orsouthern(S)region,respectively.Theagriculturalmatrixinfluenceisrepresentedbydifferentcolors:white=forestinterior(Fi;lowinfluence),grey=forestedge(Fe;midinfluence),darkgrey=smallfragments(Sf;highinfluence).Data=means±SE.SignificantdifferencesbyTukey’stest(p<0.05)ofrepeatedmeasuresANOVAanalysesareindicated:capitallettersrepresenttheinteractiveeffectbetweendroughtxregion;lowercaselettersrepresenttheinteractiveeffectbetweendroughtxmatrixinfluence(graphicsa,b,andd)andbetweendroughtxregionxmatrixinfluence(graphicc).SeesupplementarymaterialTableS5.3.
GP
P
mol C
O2
m-2
sec
-1 g
bio
mas
s-1
0
1
2
3
4
Reco
m
ol C
O2
m-2
sec
-1 g
bio
mas
s-1)
0.0
0.2
0.4
0.6
0.8 N- Fi N- Fe N- Sf S- Fi S- Fe S- Sf
g S (m
mol m
-2 s
ec -1
)
0
20
40
60
80
100
a)
b)
c)
E
B
A
C
D
a
b
aaa
a
a
b cc
c
c
d d dd
d d
a
bbabab ab
ccc
cd
d
e
f fg g g g
a
aa
a aa
c
c
bb
b
b
dd
e
dd e
DE
A
B
C
Drought (days)
0 20 40
Pho
toch
emic
al e
ffici
ency
(Fv
/ Fm
)
0.0
0.2
0.4
0.6
0.8
A
B
C
aa a a aa
b
b
c
cd
d
d)

CAPÍTULO5
187
Theimpactofbothfactors,soilregionandmatrixinfluence,overtheplant‐
soilsystemalongdroughtwasrevealedbyecosystemrespiration(Reco;Fig.
5.1a),stomatalconductance(gS;Fig.5.1b),andgrossprimaryproductivity
(GPP;Fig.5.1c),whichshowedaclearcommonpattern:atpre‐droughtno
(Reco and gS) or few (GPP) variation among treatments; at mild‐drought
higheractivityinsoilsfromthesouthernregion(Reco,gs),andespeciallyin
thosefromsmallfragmentsandforestedgesinbothregions;andatsevere‐
droughthigheractivityinsoilsfromthesouthernregion(Reco)andinsmall
fragments(RecoandGPP)andforestedges(Reco)incomparisonwithforest
interiors (Fig. 5.1). These results were reinforced by those observed at
severe‐droughtonthephotochemicalefficiencyofplantsinthesystemthat
washigherinsoilsfromthesouthernregion,especiallyinsmallfragments
andforestedges(Fig.5.1d;TableS5.3).
Physiologicalvariables(Reco,GPP,gS,Fv/Fm)oftheplant‐soilsystem
werepositivelycorrelatedamongthemallalongthedroughtperiod(Table
5.2). Significant correlationswere also found amongoverall seedling size
variables (i.e. height, diameter, SLA, biomass, root:shoot; Table 5.2);
microcosm systems holding bigger seedlings (i.e. height, diameter and
biomass) with lower root:shoot ratios, exhibited lower activity in plant
(GPP,gS,Fv/Fm)andsoil(Reco)components,especiallyatmild‐andsevere‐
drought (Table 5.2). These bigger seedlings also presented a positive
relation with EM percentages and hence, EM was negatively correlated
withtheplant‐soilsystemactivity(Reco,GPP,gS,Fv/Fm;Table5.2).
Regression analyses grouped by main factors (region, matrix
influence, soil microbial community and seedling provenance), indicated
thatvariablesindicativeofthesystemactivitye.g.Reco,GPP,gS,werehighly
sensitive to SWC, showing global R2 values of 0.6, 0.53 and 0.55,
respectively, and independentlyof thegrouping factor (i.e. region,matrix
influence,soilmicroorganism,seedlingprovenance;TableS5.4).

OVERSHADOWEFFECTOFTHEFORESTFRAGMENTATION
188
Table5.2Correlationsbetweenindicativevariablesoftheplant‐soilsystem
performancealongdrought,andstructural
traitsofseedlingsgrowninsoilsfrom
twoclimaticallydifferentregionsofholmoakfragmentedforestinSpain.Significant
Pearson’scorrelation(p<0.05)arehighlightedinbold.Reco=ecosystem
respiration;GPP=GrossPrimaryProductivity;
g S=stomatalconductance;Pre/MidF
v/F m=predawnandmiddayphotochemicalefficiency,respectively;SWC=soilwater
content;SLA=Specificleafarea;EM=Ectomycorrhizal.0=pre‐drought;20=mild‐drought;40=severe‐drought.
(1)
(2)
(3)
(4)
(5)
(6)
(7)
(8)
(9)
(10)
(11)
(12)
(13)
(14)
(15)
(16)
(17)
(18)
(19)
(20)
(21)
(22)
No.
EM
Rec
o-0
0.29
-0.1
7-0
.05
-0.0
7-0
.21
0.68
0.36
0.22
0.29
0.53
0.28
0.19
0.45
0.44
0.41
-0.4
5-0
.20
0.26
-0.7
1-0
.50
0.47
-0.3
3-0
.22
(1) G
PP
-00.
520.
240.
290.
24-0
.50
0.18
-0.1
9-0
.34
-0.3
60.
17-0
.26
-0.4
7-0
.47
-0.4
90.
330.
16-0
.16
0.29
0.44
-0.1
70.
06-0
.14
(2) g
S-0
0.30
0.37
0.20
-0.2
9-0
.01
0.08
-0.2
8-0
.31
-0.0
5-0
.14
-0.3
2-0
.33
-0.4
20.
320.
20-0
.10
0.26
0.39
-0.1
9-0
.02
0.11
(3) P
re F
v/Fm
-00.
920.
18-0
.07
0.12
0.20
-0.0
4-0
.15
0.04
0.02
0.03
0.03
-0.2
40.
090.
060.
040.
150.
15-0
.05
0.06
0.07
(4) M
id F
v/Fm
-00.
19-0
.14
0.09
0.20
-0.0
8-0
.22
0.03
0.01
-0.0
2-0
.03
-0.3
10.
150.
080.
030.
200.
23-0
.07
0.05
0.11
(5) S
WC
-0
-0.3
4-0
.31
-0.3
9-0
.18
-0.1
9-0
.04
-0.1
1-0
.22
-0.2
3-0
.52
0.06
0.09
-0.0
60.
100.
15-0
.03
0.02
0.05
(6) R
eco-2
00.
650.
410.
520.
590.
300.
410.
680.
650.
61-0
.51
-0.2
10.
25-0
.69
-0.6
20.
41-0
.28
-0.2
1
(7) G
PP
-20
0.65
0.35
0.23
-0.2
00.
330.
520.
510.
30-0
.27
-0.0
80.
10-0
.45
-0.3
90.
08-0
.20
0.14
(8) g
S-2
00.
190.
120.
120.
290.
420.
420.
26-0
.23
-0.1
10.
02-0
.27
-0.3
10.
01-0
.14
-0.1
1
(9) S
WC
-20
0.39
0.22
0.44
0.57
0.57
0.69
-0.1
8-0
.23
0.08
-0.3
3-0
.36
0.22
-0.0
7-0
.21
(10)
Rec
o-40
0.29
0.22
0.41
0.39
0.51
-0.4
1-0
.23
0.21
-0.5
4-0
.45
0.48
-0.2
0-0
.14
(11)
GP
P -4
00.
350.
340.
340.
18-0
.23
-0.1
20.
17-0
.25
-0.2
00.
420.
01-0
.03
(12)
gS
-40
0.67
0.68
0.39
-0.2
4-0
.15
0.09
-0.3
3-0
.37
0.15
-0.0
4-0
.14
(13)
Pre
Fv/F
m-4
00.
970.
57-0
.43
-0.2
10.
23-0
.58
-0.5
60.
31-0
.19
-0.1
8
(14)
Mid
Fv/F
m-4
00.
59-0
.42
-0.2
00.
21-0
.56
-0.5
50.
28-0
.15
-0.1
7
(15)
SW
C -4
0-0
.31
-0.1
80.
13-0
.40
-0.4
60.
26-0
.14
-0.2
5
(16)
Hei
ght
0.22
-0.2
50.
580.
61-0
.44
0.27
0.07
(17)
Dia
met
er-0
.17
0.24
0.43
-0.4
40.
060.
09
(18)
SLA
-0.2
6-0
.15
0.30
-0.0
3-0
.07
(19)
Fol
iar
biom
ass
0.76
-0.4
30.
330.
31
(20)
Bio
mas
s-0
.27
0.25
0.24
(21)
Roo
t:sho
ot-0
.15
-0.0
9
(22)
EM
perc
enta
ge0.
15

CAPÍTULO5
189
Responseofmicrobialcommunitiestodrought
Separated analyses for soils with native and no‐native microbial
communities,revealedthattheinteractiveeffectoftheinfluencingfactors
soil region andmatrix influence along drought differed according to the
microbialcommunities(Table5.3).Theinfluenceoftheagriculturalmatrix
affected the response of the system on Reco (both native and no‐ native
microbial communities), GPP (native microbial communities), gS (both
native and no‐native microbial communities) and Fv/Fm (no‐native
microbial communities; Table 5.3), with higher values in soils from the
southern region and in small fragments and forest edges. The region of
origin of soils affected the response to drought of both systems with or
without native microbial communities, measured as GPP, gS and Fv/Fm
(Table 5.3). Only in the case ofReco the influence of soils regionwas just
evident inmicrocosmswithnativemicrobialcommunities (Table5.3), i.e.
higher values ofReco in soils from the southern region;whereas systems
withno‐nativemicrobialcommunitieshadnotsignificant influenceof the
soilregion.

OVERSHADOWEFFECTOFTHEFORESTFRAGMENTATION
190
Table5.3Im
pactofdroughtsimulationontheplant‐soilsystem,separatelyanalysedforeachnativeorno‐nativemicrobial
communitiesbyrepeatedmeasuresANOVA.Soilswerecollectedinholmoakforestsfrom
twoclimaticallydifferentregions
ofSpain(R),infragm
entswithdifferentagriculturalm
atrixinfluence(MI).Significanteffectsarenotedinbold.Reco=
Ecosystemrespiration;GPP=grossprimaryproductivity;g S=stom
atalconductance;F v/F
m=photochemicalefficiency
(measuredatpre‐andfinal‐drought);SWC=Soilw
atercontent.
Re
co
GP
Pg
SF
v/F
m
Pre
da
wn
Fv/F
m
Mid
da
yS
WC
Fp
Fp
Fp
Fp
Fp
Fp
Nat
ive
mic
rob
ial
com
mu
nit
ies
Reg
ion(
R)
11.5
4<
0.00
10.
110.
738
1.46
0.23
02.
290.
133
1.25
0.26
69.
200.
003
Mat
rix in
fluen
ce (
MI)
5.54
0.00
50.
560.
571
4.83
0.01
05.
800.
004
6.07
0.00
310
.68
<0.
001
R x
MI
2.52
0.08
52.
360.
099
2.06
0.13
23.
260.
042
2.92
0.05
89.
43<
0.00
1
Dro
ught
(D
)54
6.00
<0.
001
263.
55
<0.
001
435.
59<
0.00
145
6.61
<0.
001
510.
37<
0.00
159
57.9
9<
0.00
1
D x
R5.
750.
004
5.40
0.00
59.
16<
0.00
18.
190.
005
8.17
0.00
558
.27
<0.
001
D x
MI
2.97
0.02
07.
70<
0.00
15.
90<
0.00
12.
450.
091
2.46
0.08
916
.20
<0.
001
D x
R x
MI
1.39
0.24
06.
94<
0.00
12.
160.
074
1.55
0.21
71.
230.
297
8.32
<0.
001
No
-nat
ive
mic
rob
ial
com
mu
nit
ies
Reg
ion(
R)
2.67
0.10
51.
360.
246
2.33
0.13
07.
060.
009
4.90
0.02
923
.45
<0.
001
Mat
rix in
fluen
ce (
MI)
5.48
0.00
51.
850.
163
0.48
0.62
38.
53<
0.00
18.
45<
0.00
112
.83
<0.
001
R x
MI
1.95
0.14
81.
150.
322
1.03
0.36
20.
070.
934
0.13
0.87
50.
930.
396
Dro
ught
(D
)41
0.11
<0.
001
160.
38
<0.
001
338.
32<
0.00
135
9.36
<0.
001
452.
85<
0.00
157
80.6
0<
0.00
1
D x
R1.
560.
212
4.96
0.00
89.
92<
0.00
112
.90
<0.
001
13.3
8<
0.00
136
.54
<0.
001
D x
MI
2.53
0.04
11.
700.
152
5.79
<0.
001
8.39
<0.
001
9.24
<0.
001
17.2
7<
0.00
1
D x
R x
MI
1.18
0.32
21.
730.
146
1.26
0.28
50.
620.
539
0.86
0.42
64.
240.
003

CAPÍTULO5
191
Theectomycorrhizalpercentageofseedlingswasunaffectedbyeitherthe
region or the matrix influence, but it was tightly dependent on seedling
provenance and soilmicrobial communities (Fig. 5.2; Table S5.5). Higher
mycorrhizalpercentageswerefoundinGalthaninSibseedlings,andwhen
theygrewinsoilswithnativemicrobialcommunitiescomparedwiththose
without nativemicroorganisms (Fig. 5.2b; Table S5.5). A total of ten EM
fungal morphotypes were described according to their morphological
characteristics (Figs. 5.2c and2d, S5.3; Table S5.6). Themeannumber of
fungalmorphotypesperseedlingwasaffectedby the interactionbetween
regionandmatrix influence(Figure5.2c;TableS5.5),withgeneralhigher
valuesfoundinsoilsfromthenorthernregioncomparedwiththesouthern
one, and particularly in forest interiors in the northern region compared
with forest edges and small fragments (Fig. 5.2c). Contrarily, the mean
number of fungalmorphotypeswas unaffected either by the presence of
nativemicrobialcommunitiesorbytheprovenanceofseedlings(Fig.5.2d;
TableS5.5).
When analyzed per treatment, the frequency/abundance
morphotype profiles showed a dominant morphotype M01 across all
treatments, followed by fungi M02 and M05 (Fig. 5.3; Fig. S5.3). Also,
morphotypes M03, 06 and 09 are present only in soils with native
microbialcommunities.Whencomparingbetweenregions(Fig.5.3a,c),the
morphotype profiles revealed that soils from the northern region were
more diverse than those from the southern one, with 7 and 4 fungal
morphotypesinaverage,respectively(t‐value=5.19;Fig.5.3a,c).Similarly,
thesoilswithnativemicrobialcommunitiesweremorediversethanthose
with no‐native microbial communities, with 7.3 and 4.6 morphotypes in
average,respectively(t‐value=2.83;Fig.5.3b,d).
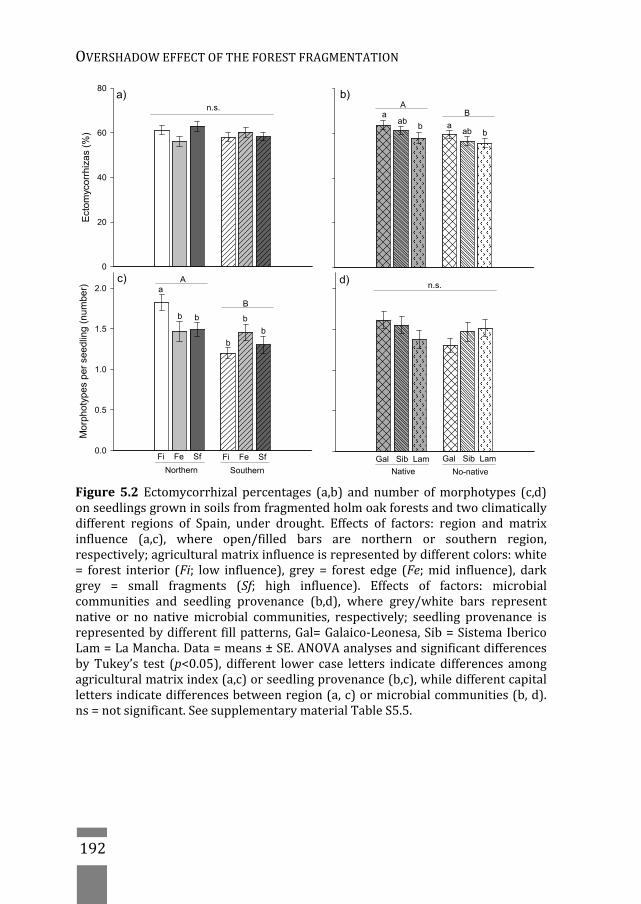
OVERSHADOWEFFECTOFTHEFORESTFRAGMENTATION
192
Figure5.2Ectomycorrhizal percentages (a,b) and number ofmorphotypes (c,d)onseedlingsgrowninsoilsfromfragmentedholmoakforestsandtwoclimaticallydifferent regions of Spain, under drought. Effects of factors: region and matrixinfluence (a,c), where open/filled bars are northern or southern region,respectively;agriculturalmatrixinfluenceisrepresentedbydifferentcolors:white= forest interior (Fi; low influence), grey = forest edge (Fe;mid influence), darkgrey = small fragments (Sf; high influence). Effects of factors: microbialcommunities and seedling provenance (b,d), where grey/white bars representnative or no nativemicrobial communities, respectively; seedling provenance isrepresentedbydifferent fillpatterns,Gal=Galaico‐Leonesa,Sib=SistemaIbericoLam=LaMancha.Data=means±SE.ANOVAanalysesandsignificantdifferencesby Tukey’s test (p<0.05), different lower case letters indicate differences amongagriculturalmatrixindex(a,c)orseedlingprovenance(b,c),whiledifferentcapitallettersindicatedifferencesbetweenregion(a,c)ormicrobialcommunities(b,d).ns=notsignificant.SeesupplementarymaterialTableS5.5.
Mor
phot
ypes
per
see
dlin
g (
num
ber)
0.0
0.5
1.0
1.5
2.0
b
a
b
Fi Fe Sf
Northern
Fi Fe Sf
Southern Native
Gal Sib Lam
No-native
Gal Sib Lam
n.s.
b bb
B
A
Ect
omyc
orrh
iza
s (%
)
0
20
40
60
80
n.s.
ba
aabab b
BA
a) b)
c) d)
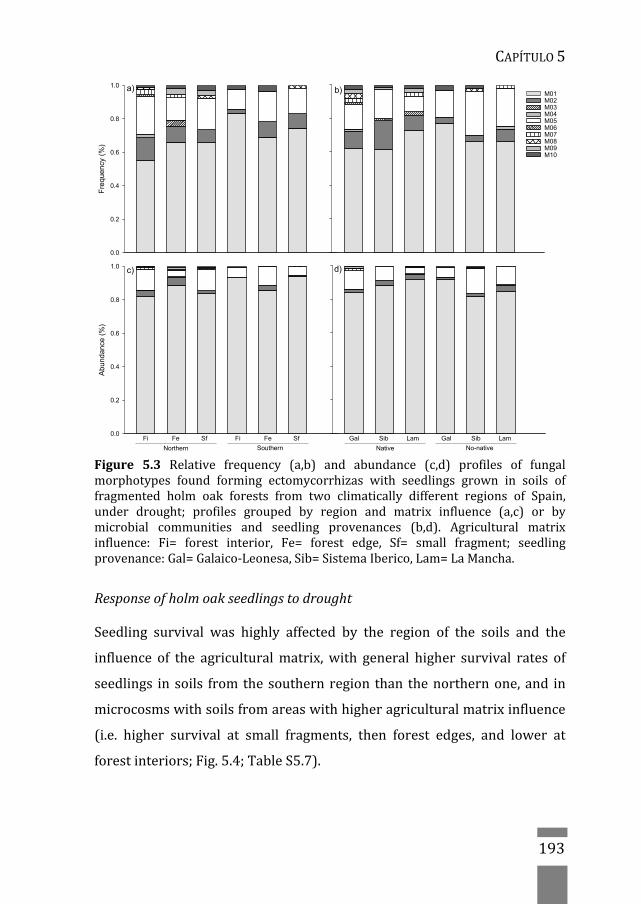
CAPÍTULO5
193
Figure 5.3 Relative frequency (a,b) and abundance (c,d) profiles of fungalmorphotypes found forming ectomycorrhizas with seedlings grown in soils offragmented holm oak forests from two climatically different regions of Spain,under drought; profiles grouped by region and matrix influence (a,c) or bymicrobial communities and seedling provenances (b,d). Agricultural matrixinfluence: Fi= forest interior, Fe= forest edge, Sf= small fragment; seedlingprovenance:Gal=Galaico‐Leonesa,Sib=SistemaIberico,Lam=LaMancha.
Responseofholmoakseedlingstodrought
Seedling survival was highly affected by the region of the soils and the
influence of the agriculturalmatrix,with general higher survival rates of
seedlings in soils fromthesouthernregion than thenorthernone,and in
microcosmswithsoilsfromareaswithhigheragriculturalmatrixinfluence
(i.e. higher survival at small fragments, then forest edges, and lower at
forestinteriors;Fig.5.4;TableS5.7).
Fre
que
ncy
(%)
0.0
0.2
0.4
0.6
0.8
1.0
Ab
und
ance
(%
)
0.0
0.2
0.4
0.6
0.8
1.0
a)
c)
M01 M02 M03 M04 M05 M06 M07 M08 M09 M10
Fi Fe Sf Fi Fe Sf
Northern Southern
Gal Sib Lam
Native No-native
Gal Sib Lam
b)
d)

OVERSHADOWEFFECTOFTHEFORESTFRAGMENTATION
194
Figure 5.4 Survival, along drought simulation, of seedlings grown in soils offragmented holm oak forests from two climatically different regions of Spain.Inverted triangles and squares are northern (N) and southern (S) region,respectively.Theagriculturalmatrix influence is representedbydifferent colors:white= forest interior (Fi; low influence),grey= forestedge(Fe;mid influence),dark grey = small fragments (Sf; high influence). Significant differences amongtreatments, indicated by different letters, were separated by Peto and Peto X2analyses,seesupplementarymaterialTableS5.7.
Contrarytothestudiedfunctionaltraits(Reco,GPP,gS,Fv/Fm),resultsfrom
factorial ANOVA indicates that plant morphological traits were barely
affected by the soil region or the matrix influence, but mostly by the
provenanceof theseedlingand/or themicrobialcommunity (TableS5.5).
OnlytheSpecificLeafArea(SLA)wasinfluencedbytheinteractionofsoil
regionxmicrobialcommunity(nativevsnon‐native),andmatrixinfluence
xmicrobial community x seedling provenance (Table S5.5), although the
Tukey’s test did not separate significant differences among groups. The
root:shootratiowasdependentonseedlingprovenancewithhighervalues
observed forGal and Lam compared with Sib seedlings (Fig. S5.4; Table
S5.5).Biomasswasaffectedbytheinteractionofseedlingprovenanceand
microbialcommunities(TableS5.5),withthelowestbiomassobservedfor
Drought (days)
0 10 20 30 40
Sur
viva
l (%
)
20
40
60
80
100
120
N Fi N Fe N Sf S Fi S Fe S Sf
a
ab
bc
cd
de
e

CAPÍTULO5
195
Sib seedlings grown in soilswith nativemicrobial communities. Seedling
height,diameter,andfoliarbiomasswerenotaffectedbyanyfactor(Table
S5.5).Seedlingmorphologicaltraitsdisplayedahighvariation,reflectedin
greatstandarderrorvalues(Fig.S5.4;TableS5.8).
Additionally, for each seedlingprovenance, the functional traitsof
the plant‐soil system along drought were dissimilarly affected by the
influencing factors (i.e. soil region and matrix influence) (Table 5.4);
systemswithGal andLam seedlingswere consistently affectedby region
andmatrix influence along drought in all (Gal) ormost (Lam, except for
Reco, and GPP affected only by matrix influence) functional traits (Table
5.4), with higher values of Reco, GPP, gS and Fv/Fm observed in small
fragments and forest edges and in the southern region along drought;
whereastheresponsetodroughtwithSibseedlingswasonlyconditioned
by region (Table 5.4), with higher values of GPP, gS and Fv/Fm in the
southernregionalongdrought,whileRecowasunaffected,andgSwasalso
affectedbythematrixinfluence(Table5.4),exhibitingthehighestvaluesin
smallfragmentsandundermild‐droughtconditions.
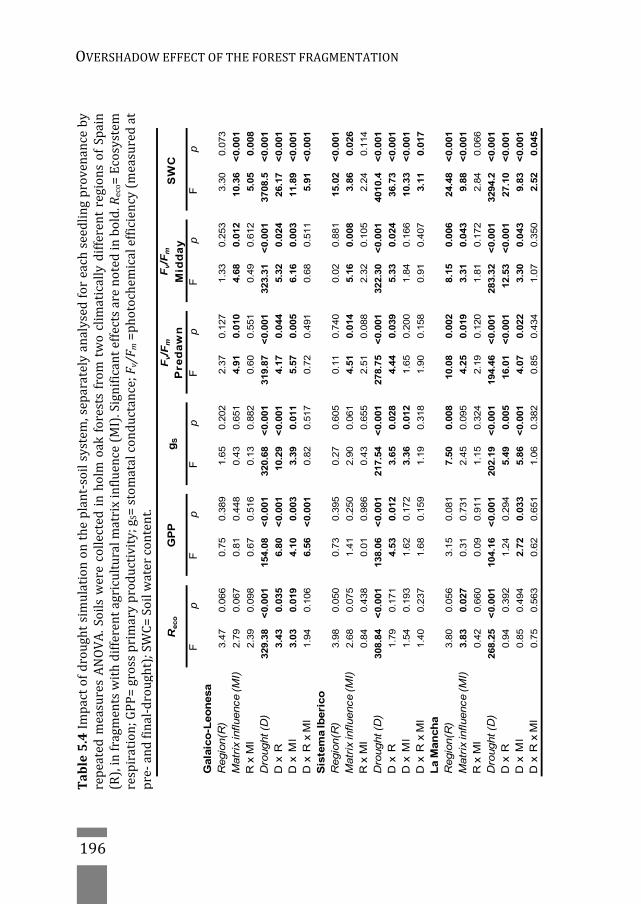
OVERSHADOWEFFECTOFTHEFORESTFRAGMENTATION
196
Reco
GP
Pg
SF
v/F
m
Pre
da
wn
Fv/F
m
Mid
da
yS
WC
Fp
Fp
Fp
Fp
Fp
Fp
Gala
ico
-Leo
nesa
Regio
n(R
)3.4
70.0
66
0.7
50.3
89
1.6
50.2
02
2.3
70.1
27
1.3
30.2
53
3.3
00.0
73
Matr
ix in
fluence (M
I)2.7
90.0
67
0.8
10.4
48
0.4
30.6
51
4.9
10.0
10
4.6
80.0
12
10.3
6<
0.0
01
R x
MI
2.3
90.0
98
0.6
70.5
16
0.1
30.8
82
0.6
00.5
51
0.4
90.6
12
5.0
50.0
08
Dro
ught (D
)329.3
8<
0.0
01
154.0
8<
0.0
01
320.6
8<
0.0
01
319.8
7<
0.0
01
323.3
1<
0.0
01
3708.5
<0.0
01
D x
R3.4
30.0
35
6.8
0<
0.0
01
10.2
9<
0.0
01
4.1
70.0
44
5.3
20.0
24
26.1
7<
0.0
01
D x
MI
3.0
30.0
19
4.1
00.0
03
3.3
90.0
11
5.5
70.0
05
6.1
60.0
03
11.8
9<
0.0
01
D x
R x
MI
1.9
40.1
06
6.5
6<
0.0
01
0.8
20.5
17
0.7
20.4
91
0.6
80.5
11
5.9
1<
0.0
01
Sis
tem
a Ib
eri
co
Regio
n(R
)3.9
80.0
50
0.7
30.3
95
0.2
70.6
05
0.1
10.7
40
0.0
20.8
81
15.0
2<
0.0
01
Matr
ix in
fluence (M
I)2.6
80.0
75
1.4
10.2
50
2.9
00.0
61
4.5
10.0
14
5.1
60.0
08
3.8
60.0
26
R x
MI
0.8
40.4
38
0.0
10.9
86
0.4
30.6
55
2.5
10.0
88
2.3
20.1
05
2.2
40.1
14
Dro
ught (D
)308.8
4<
0.0
01
138.0
6<
0.0
01
217.5
4<
0.0
01
278.7
5<
0.0
01
322.3
0<
0.0
01
4010.4
<0.0
01
D x
R1.7
90.1
71
4.5
30.0
12
3.6
50.0
28
4.4
40.0
39
5.3
30.0
24
36.7
3<
0.0
01
D x
MI
1.5
40.1
93
1.6
20.1
72
3.3
60.0
12
1.6
50.2
00
1.8
40.1
66
10.3
3<
0.0
01
D x
R x
MI
1.4
00.2
37
1.6
80.1
59
1.1
90.3
18
1.9
00.1
58
0.9
10.4
07
3.1
10.0
17
La M
an
ch
aR
egio
n(R
)3.8
00.0
56
3.1
50.0
81
7.5
00.0
08
10.0
80.0
02
8.1
50.0
06
24.4
8<
0.0
01
Matr
ix in
fluence (M
I)3.8
30.0
27
0.3
10.7
31
2.4
50.0
95
4.2
50.0
19
3.3
10.0
43
9.8
8<
0.0
01
R x
MI
0.4
20.6
60
0.0
90.9
11
1.1
50.3
24
2.1
90.1
20
1.8
10.1
72
2.8
40.0
66
Dro
ught (D
)268.2
5<
0.0
01
104.1
6<
0.0
01
202.1
9<
0.0
01
194.4
6<
0.0
01
283.3
2<
0.0
01
3294.2
<0.0
01
D x
R0.9
40.3
92
1.2
40.2
94
5.4
90.0
05
16.0
1<
0.0
01
12.5
3<
0.0
01
27.1
0<
0.0
01
D x
MI
0.8
50.4
94
2.7
20.0
33
5.8
6<
0.0
01
4.0
70.0
22
3.3
00.0
43
9.8
3<
0.0
01
D x
R x
MI
0.7
50.5
63
0.6
20.6
51
1.0
60.3
82
0.8
50.4
34
1.0
70.3
50
2.5
20.0
45
Table5.4Im
pactofdroughtsimulationontheplant‐soilsystem,separatelyanalysedforeachseedlingprovenanceby
repeatedmeasuresANOVA.SoilswerecollectedinholmoakforestsfromtwoclimaticallydifferentregionsofSpain
(R),infragmentswithdifferentagriculturalm
atrixinfluence(MI).Significanteffectsarenotedinbold.R
eco=Ecosystem
respiration;GPP=grossprimaryproductivity;g
S=stomatalconductance;F
v/F m=photochemicalefficiency(measuredat
pre‐andfinal‐drought);SWC=Soilw
atercontent.

CAPÍTULO5
197
Discusion
Impactofdroughtoverthewholeplant‐soilsystem
Allfunctionalindicatorsoftheentireplant‐soilsystem(i.e.Reco,GPPandgS)
were strongly affected by drought, regardless of the studied factors (i.e.
region,matrixinfluence,microbialcommunities,andseedlingprovenance),
which might be explained by the strong relationship between the
functioning of all different ecological compartments under study (plants
and soilmicrobial communities) and soilwater availability (Orchard and
Cook,1983;Reichsteinetal.,2002;Barbaetal.,2013).Theresponsiveness
oftheplant‐soilsystemtodroughtwasdifferentdependingontheoriginal
bioclimatic conditions of soils and on the influence of the agricultural
matrix on them,with abetter resistance todrought of plant‐soil systems
with soils from small fragments and forest edges (i.e. Reco, GPP,
photochemical efficiency atmild/severedrought, and gS atmilddrought)
and from the southernwarmer and drier region (i.e.Reco, photochemical
efficiencyatmild/severedrought,andgSatmilddrought).Both,thedegree
of fragmentationand the soil originhadalsoaprofound repercussionon
the survival of seedlings (i.e. higher survival in small and forest edges,
especially insoils fromthesouthernregion),being lessdependentonthe
seedling provenance or the presence of the nativemicrobial community.
Theseresultssuggestthatthemodulationofdroughteffectsovertheplant‐
soil system was mainly determined by the particular biogeochemical
characteristics of soils associated with the bioclimatic region and the
agriculturalmatrix,supportingourthirdhypothesis.Aswehavepreviously
found in these studysystems, thephysicochemical characteristicsof soils
largely depend on the influence of the surrounding agricultural matrix,
withwetter,more organic and fertile soils found in small fragments and
forestedges(Flores‐Renteríaetal.,2015)(Chapter2and3),whereas the

OVERSHADOWEFFECTOFTHEFORESTFRAGMENTATION
198
bioclimaticregionofsoils,additionallytoitseffectovercertainbiophysical
characteristics (i.e. basic pH and higher K+ on southern region) also
influencedthemicrobialtolerancetodrought(Flores‐Renteríaetal.,2015).
In fact, the GPP exhibited a different response to the agriculturalmatrix
influence depending on the particular bioclimatic conditions (e.g. the
matrix only influenced GPP in soils from the northern region at mild‐
drought).
Response of microbial communities to drought and its effect over theecosystemfunctioning
The lack of significant effect of the presence of native soil microbial
communities on theplant‐soil functioning couldbedue to theoverriding
effect of the soil physicochemical characteristics, although we cannot
discardotherfactorssuchasaninsufficientamountofsoilinoculuminthe
microcosm.
When we focused in particular microbial communities (i.e.
ectomycorrhizal association, EM), EM seedlings percentages were
influenced by both factors native microbial communities and seedling
provenance,withhighervaluesinsoilswithnativemicrobialcommunities,
and onGal provenance comparedwithLam seedlings. The increased EM
percentagesassociatedwiththenativemicrobialcommunities,suggestan
stimulationof lateralroot tip formation(e.g.viahormones, (Rincónetal.,
2003) making more sites available for fungal colonization. On the other
hand, the different EM percentages depending on seedling provenance
couldberelatedwithhostcompatibilityissues,orwiththedifferentcarbon
economy of seedlings, that destined their carbon gain differentially to
survival, growthor/and themaintenanceofEM symbiosis.The increased
EM fungal diversity, in soil with native microorganisms of the northern
region points out to these particular EM fungi as competitive enough to

CAPÍTULO5
199
surpasspriorityeffectsoffungialreadyestablishedinthenursery(Rincón
etal.,2014).
However, despite these differences, only the differences in EM
diversity(i.e.morphotypesperseedling)andmorphotypefrequency,both
associated with the region of soil origin (north and south) appeared to
determinetheresponseoftheplant‐soil‐microbialsystemtodrought.
Although seedling growth was positively correlated with EM
percentages(height,foliarandtotalbiomass)anddiversity(foliarandtotal
biomass),plant‐soilmicrocosmswithmorediverseEMfungalprofiles(i.e.
northern region) showed the lowest physiological performance under
drought (Reco, Fv/Fm), which together with negative correlations between
physiological traits (Reco,GPP,gS,Fv/Fm) andEMpercentagesordiversity,
suggests a rather negative impact of EM abundance and diversity on the
functioning of thewhole system. There has been proposed amutualism‐
parasitism continuum considering parasitic mycorrhizal fungi on plants
whennetcostof thesymbiosisexceedsnetbenefit (Johnsonetal.,1997).
This continuum canbe affectedby both biotic and abiotic environmental
factors(Johnsonetal.,1997),butalsobythefungalgenotypeandecotype
(Mandyam and Jumpponen, 2015), our results suggesting a shift in the
mutualistic relationexplainedbyboth thedominanceof anopportunistic
nurseryEMfungalmorphotype,and/orthestressfuldroughtconditionsof
thesystem.
Responseofholmoakseedlingstodrought
Ourresultsshowedthat,despitethesignificantreductioninphotosynthetic
efficiency and gross primary productivity,Q. ilex seedlings, regardless of
their provenance, were able to maintain carbon gain under low water
availability (mild drought, ~12‐18% SWC), a stress‐tolerance strategy
previouslyreportedforthisspecies(Corcueraetal.,2005;Valladaresetal.,

OVERSHADOWEFFECTOFTHEFORESTFRAGMENTATION
200
2008;Gimenoetal.,2009),whichcanbeaparticularly important trait to
cope with unpredictable heat waves (Ghouil et al., 2003; Gimeno et al.,
2009). We found not enough support for our initial hypothesis that
seedlingprovenancewouldinfluencetheresponsetodroughtoftheplant‐
soil system, since only twomorphological traits (i.e. biomass, root:shoot
ratio)weredependentonthisfactor,whereastheirphysiologyorsurvival
rates were unaffected. However, our experimental design was likely
limiting in capturing differences attributable to adaptive features of
seedlingsdrivenbytheclimateofthelocalityfromwhichtheyoriginated,
as it has been repeatedly observed for Q. ilex in other studies (Gratani,
1995; Gratani et al., 2003; Pesoli et al., 2003; Andivia et al., 2012), but
insteadrevealedanoverridingeffectofsoilproperties,dependentonboth
theregion(i.e.bioclimaticconditions)andtheagriculturalmatrixinfluence
(i.e.fragmentation).

CAPÍTULO5
201
Conclusions
The influence of the agricultural matrix over the soil physicochemical
characteristics, depending on the local bioclimatic conditions, could
modulate tosomeextendthe functionalresponseof theplant‐soilsystem
to drought stress. Besides, the local bioclimatic conditions of soils could
control the adaptation to drought of the native microbial communities,
which in turn influenced the functional response of the soil system to
drought.Despiteofthepositiveeffectofnativesoilmicrobialcommunities
on ectomycorrhizal percentages and fungal diversity, both negatively
impacted the response of the plant‐soil system to drought. Expected
seedling provenance effects were probably overridden by the strong
influenceofthefactorsagriculturalmatrixinfluenceandregion,suggesting
that the soil physicochemical characteristics were more influent on the
responseoftheplant‐soilsystemtodrought.

OVERSHADOWEFFECTOFTHEFORESTFRAGMENTATION
202
References
Agerer,R.(1997).ColourAtlasofEctomycorrhizae,Einhorn‐Verlag.Alados, C. L., Y. Pueyo, O. Barrantes, J. Escós, L. Giner and A. B. Robles (2004).
Variationsinlandscapepatternsandvegetationcoverbetween1957and1994 ina semiaridMediterraneanecosystem.LandscapeEcology,19(5):543‐559.
Almagro,M., J. López, J. I. Querejeta andM.Martínez‐Mena (2009). TemperaturedependenceofsoilCO2effluxisstronglymodulatedbyseasonalpatternsof moisture availability in a Mediterranean ecosystem. Soil Biology andBiochemistry,41(3):594‐605.
Andivia, E., M. Fernández, J. Vázquez‐Piqué and R. Alejano (2012). Twoprovenances ofQuercus ilex ssp. ballota (Desf) Samp. nursery seedlingshave different response to frost tolerance and autumn fertilization.EuropeanJournalofForestResearch,131(4):1091‐1101.
Barba, J., J.CurielYuste, J.Martínez‐VilaltaandF.Lloret(2013).Drought‐inducedtree species replacement is reflected in the spatial variability of soilrespiration in a mixed Mediterranean forest. Forest Ecology andManagement,306(0):79‐87.
Blondel,J.(2010).TheMediterraneanregion:biologicaldiversitythroughtimeandspace.Oxford,UK,OxfordUniversityPress.
Cook,F.J.andV.A.Orchard(2008).Relationshipsbetweensoilrespirationandsoilmoisture.SoilBiologyandBiochemistry,40(5):1013‐1018.
Corcuera,L.,F.Morales,A.AbadíaandE.Gil‐Pelegrín(2005).Seasonalchangesinphotosynthesis and photoprotection in a Quercus ilex subsp. ballotawoodlandlocatedinitsupperaltitudinalextremeintheIberianPeninsula.TreePhysiology,25(5):599‐608.
CurielYuste,J.,J.Barba,A.J.Fernandez‐Gonzalez,M.Fernandez‐Lopez,S.Mattana,J.Martinez‐Vilalta,P.NolisandF.Lloret(2012).Changes insoilbacterialcommunity triggered by drought‐induced gap succession precededchanges insoilCstocksandquality.EcologyandEvolution,2(12):3016‐3031.
Curiel Yuste, J., A. J. Fernandez‐Gonzalez, M. Fernandez‐Lopez, R. Ogaya, J.Penuelas,J.SardansandF.Lloret(2014).Strongfunctionalstabilityofsoilmicrobial communities under semiarid Mediterranean conditions andsubjected to long‐term shifts in baseline precipitation. Soil Biology andBiochemistry,69(0):223‐233.
Díaz,M. and C. L. Alonso (2003).WoodmouseApodemus sylvaticus winter foodsupply:density,condition,breeding,andparasites.Ecology,84(10):2680‐2691.
Díaz,M.,T.SantosandJ.L.Tellería(1999).Effectsof forestfragmentationonthewinterbodyconditionandpopulationparametersofanhabitatgeneralist,the wood mouse Apodemus sylvaticus: a test of hypotheses. ActaOecologica,20(1):39‐49.
Evans,S.andM.Wallenstein(2012).Soilmicrobialcommunityresponsetodryingand rewetting stress: does historical precipitation regime matter?Biogeochemistry,109(1‐3):101‐116.

CAPÍTULO5
203
Evans, S. E. and M. D. Wallenstein (2014). Climate change alters ecologicalstrategiesofsoilbacteria.EcologyLetters,17(2):155‐164.
Flores‐Rentería, D., J. Curiel Yuste, A. Rincón, F. Brearley, J. García‐Gil and F.Valladares(2015).Habitatfragmentationcanmodulatedroughteffectsontheplant‐soil‐microbialsysteminMediterraneanholmoak(Quercus ilex)forests.MicrobialEcology:1‐15.
Flores‐Rentería, D., J. Curiel Yuste, A. Rincón, F. Brearley, J. García‐Gil and F.Valladares(2015).Habitatfragmentationcanmodulatedroughteffectsontheplant‐soil‐microbialsysteminMediterraneanholmoak(Quercus ilex)forests.MicrobialEcology,69(4):798‐812.
Gehring,C.,D.Flores‐Rentería,C.M.Sthultz,T.M.Leonard,L.Flores‐Rentería,A.V.Whipple and T. G. Whitham (2014). Plant genetics and interspecificcompetitive interactions determine ectomycorrhizal fungal communityresponsestoclimatechange.MolecularEcology,23(6):1379‐1391.
Ghouil, H., P. Montpied, D. Epron, M. Ksontini, B. Hanchi and E. Dreyer (2003).Thermal optima of photosynthetic functions and thermostability ofphotochemistry in cork oak seedlings. Tree Physiology, 23(15): 1031‐1039.
Gimeno, T. E., B. Pías, J. P. Lemos‐Filho and F. Valladares (2009). Plasticity andstress tolerance override local adaptation in the responses ofMediterraneanholmoakseedlings todroughtandcold.TreePhysiology,29(1):87‐98.
Gratani, L. (1995). Structural and ecophysiological plasticity of some evergreenspecies of the Mediterranean maquis in response to climate.Photosynthetica,31:335‐343.
Gratani, L., M. Meneghini, P. Pesoli and M. F. Crescente (2003). Structural andfunctionalplasticityofQuercus ilex seedlingsofdifferentprovenances inItaly.Trees,17(6):515‐521.
Hereş,A.‐M.,J.Martínez‐VilaltaandB.ClaramuntLópez(2012).Growthpatternsinrelationtodrought‐inducedmortalityattwoScotspine(PinussylvestrisL.)sites inNE Iberian Peninsula. Trees‐Structure andFunction, 26(2): 621‐630.
IPCC (2007). Climate Change 2007 ‐ Syntesis report, IPCC, IntergovernmentalPanelonClimateChangec/oWorldMeteorologicalOrganization(WMO).
Jiménez,P.,P.DíazFernández,S.Iglesias,M.DeTueroandL.Gil(1996).RegionesdeprocedenciadeQuercusilexL.enEspaña.Madrid,ICONA.
Johnson, N. C., J. H. Graham and F. A. Smith (1997). Functioning of mycorrhizalassociations along the mutualism–parasitism continuum*. NewPhytologist,135(4):575‐585.
Larcher, W. (2000). Temperature stress and survival ability of Mediterraneansclerophyllousplants.PlantBiosystems‐AnInternationalJournalDealingwithallAspectsofPlantBiology,134(3):279‐295.
Lavorel,S.,J.Canadell,S.RambalandJ.Terradas(1998).Mediterraneanterrestrialecosystems: research priorities on global change effects. Global EcologyandBiogeographyLetters,7(3):157‐166.
Lázaro‐Nogal, A., S. Matesanz, T. Gimeno, A. Escudero and F. Valladares (2012).Fragmentationmodulates the strong impact of habitat quality and plant

OVERSHADOWEFFECTOFTHEFORESTFRAGMENTATION
204
cover on fertility andmicrobial activity of semiarid gypsum soils. PlantandSoil,358(1‐2):213‐223.
Malmivaara‐Lämsä,M.,L.Hamberg,E.Haapamäki,J.Liski,D.J.Kotze,S.Lehvävirtaand H. Fritze (2008). Edge effects and trampling in boreal urban forestfragments – impacts on the soil microbial community. Soil Biology andBiochemistry,40(7):1612‐1621.
Mandyam, K. G. and A. Jumpponen (2015). Mutualism‐parasitism paradigmsynthesized from results of root‐endophyte models. Frontiers inMicrobiology,5.
Matesanz,S.,A.EscuderoandF.Valladares(2009). ImpactofthreeglobalchangedriversonaMediterraneanshrub.Ecology,90(9):2609‐2621.
Ninyerola, M., X. Pons and J. M. Roure. (2005). Atlas climático digital de laPenínsula Ibérica. Metodología y aplicaciones en bioclimatología ygeobotánica. Retrieved 30/04/2014, 2014, fromhttp://www.opengis.uab.es/wms/iberia/index.htm.
Ogaya, R. and J. Peñuelas (2004). Phenological patterns ofQuercus ilex,Phillyrealatifolia, and Arbutus unedo growing under field experimental drought.Ecoscience11:263‐270.
Orchard,V.A.andF.J.Cook(1983).Relationshipbetweensoilrespirationandsoilmoisture.SoilBiologyandBiochemistry,15(4):447‐453.
Pérez‐Priego,O.,L.Testi,F.OrgazandF.J.Villalobos(2010).Alargeclosedcanopychamber formeasuring CO2 andwater vapour exchange ofwhole trees.EnvironmentalandExperimentalBotany,68(2):131‐138.
Pesoli, P., L. Gratani and W. Larcher (2003). Responses of Quercus ilex fromdifferent provenances to experimentally imposed water stress. BiologiaPlantarum,46(4):577‐581.
Pyke,D.A.andJ.N.Thompson(1986).Statisticalanalysisofsurvivalandremovalrateexperiments.Ecology,67(1):240‐245.
Rambal,S., J.‐M.Ourcival,R. Joffre,F.Mouillot,Y.Nouvellon,M.ReichsteinandA.Rocheteau(2003).DroughtcontrolsoverconductanceandassimilationofaMediterraneanevergreenecosystem:scalingfromleaftocanopy.GlobalChangeBiology,9(12):1813‐1824.
Reichstein,M.,J.D.Tenhunen,O.Roupsard,J.‐m.Ourcival,S.Rambal,F.Miglietta,A.Peressotti,M.Pecchiari,G.TironeandR.Valentini(2002).SeveredroughteffectsonecosystemCO2andH2OfluxesatthreeMediterraneanevergreensites:revisionofcurrenthypotheses?GlobalChangeBiology,8(10):999‐1017.
Richard, F., M.‐A. Selosse and M. Gardes (2009). Facilitated establishment ofQuercus ilex in shrub‐dominated communities within a Mediterraneanecosystem:domycorrhizalpartnersmatter?FEMSMicrobiologyEcology,68(1):14‐24.
Rincón, A., M. R. Felipe and M. Fernández‐Pascual (2007). Inoculation of Pinushalepensis Mill. with selected ectomycorrhizal fungi improves seedlingestablishment 2years after planting in a degraded gypsum soil.Mycorrhiza,18(1):23‐32.
Rincón,A.,O.Priha,B.Sotta,M.BonnetandF.LeTacon(2003).Comparativeeffectsof auxin transport inhibitors on rhizogenesis and mycorrhizal

CAPÍTULO5
205
establishment of spruce seedlings inoculatedwith Laccaria bicolor. TreePhysiology,23(11):785‐791.
Rincón, A., B. P. Santamaría, L. Ocaña and M. Verdú (2014). Structure andphylogenetic diversity of post‐fire ectomycorrhizal communities ofmaritimepine.Mycorrhiza,24(2):131‐141.
Riutta, T., E. M. Slade, D. P. Bebber, M. E. Taylor, Y. Malhi, P. Riordan, D. W.Macdonald and M. D. Morecroft (2012). Experimental evidence for theinteracting effects of forest edge, moisture and soil macrofauna on leaflitterdecomposition.SoilBiologyandBiochemistry,49(0):124‐131.
Rivas‐Martínez, S. (1981). Les étages bioclimatiques de la végétation de laPéninsuleIbérique.AnalesdelJardínBotánicodeMadrid,37(2):251‐268.
Sanchez‐Gomez,D.,F.ValladaresandM.A.Zavala(2006).Performanceofseedlingsof Mediterranean woody species under experimental gradients ofirradiance and water availability: trade‐offs and evidence for nichedifferentiation.NewPhytol,170(4):795‐806.
Santos, T. and J. L. Tellería (1998). Efectos de la fragmentación de los bosquessobre los vertebradosde lasmesetas ibéricas.Madrid, Spain,OrganismoAutónomo"ParquesNacionales".
Street, L. E.,G.R. Shaver,M.A.WilliamsandM.T.VanWijk (2007).What is therelationship between changes in canopy leaf area and changes inphotosynthetic CO2 flux in arctic ecosystems? Journal of Ecology, 95(1):139‐150.
Valladares, F., J. J. Camarero, F. Pulido and E. Gil‐Pelegrín (2004). El bosquemediterráneo, un sistema humanizado y dinámico. Ecologia del BosqueMediterráneo en un mundo cambiante. F. Valladares. Madrid, Spain,MinisteriodelMedioAmbiente:13‐25.
Valladares, F., J. Zaragoza‐Castells, D. Sánchez‐Gómez, S. Matesanz, B. Alonso, A.Portsmuth, A. Delgado and O. K. Atkin (2008). Is shade beneficial forMediterraneanshrubsexperiencingperiodsofextremedroughtandlate‐winterfrosts?AnnalsofBotany,102(6):923‐933.
WRB,I.W.G.(2007).WorldReferenceBaseforSoilResources2006, firstupdate2007.FAO.W.S.R.Reports.Rome,Italy.103:116.
Zheng,D.,J.Chen,J.M.LeMoineandE.S.Euskirchen(2005).Influencesofland‐usechangeandedgesonsoil respiration inamanaged forest landscape,WI,USA.ForestEcologyandManagement,215(1–3):169‐182.
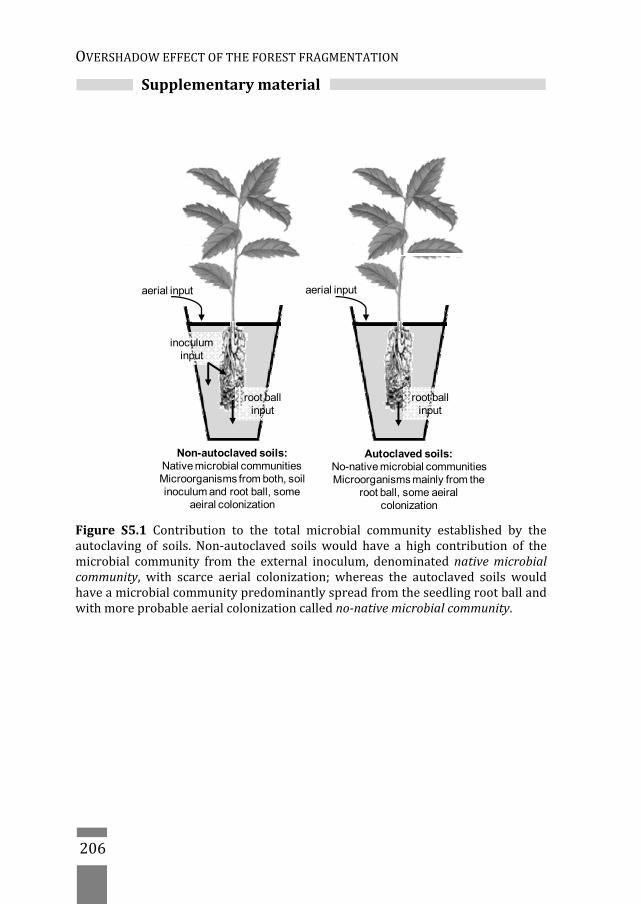
OVERSHADOWEFFECTOFTHEFORESTFRAGMENTATION
206
Supplementarymaterial
Figure S5.1 Contribution to the total microbial community established by theautoclaving of soils. Non‐autoclaved soilswould have a high contribution of themicrobial community from the external inoculum, denominatednativemicrobialcommunity, with scarce aerial colonization; whereas the autoclaved soils wouldhaveamicrobialcommunitypredominantlyspreadfromtheseedlingrootballandwithmoreprobableaerialcolonizationcalledno‐nativemicrobialcommunity.
Autoclaved soils:No-native microbial communitiesMicroorganisms mainly from the
root ball, some aeiralcolonization
Non-autoclaved soils:Native microbial communitiesMicroorganisms from both, soil inoculum and root ball, some
aeiral colonization
aerial inputaerial input
root ball input
root ball input
inoculum input
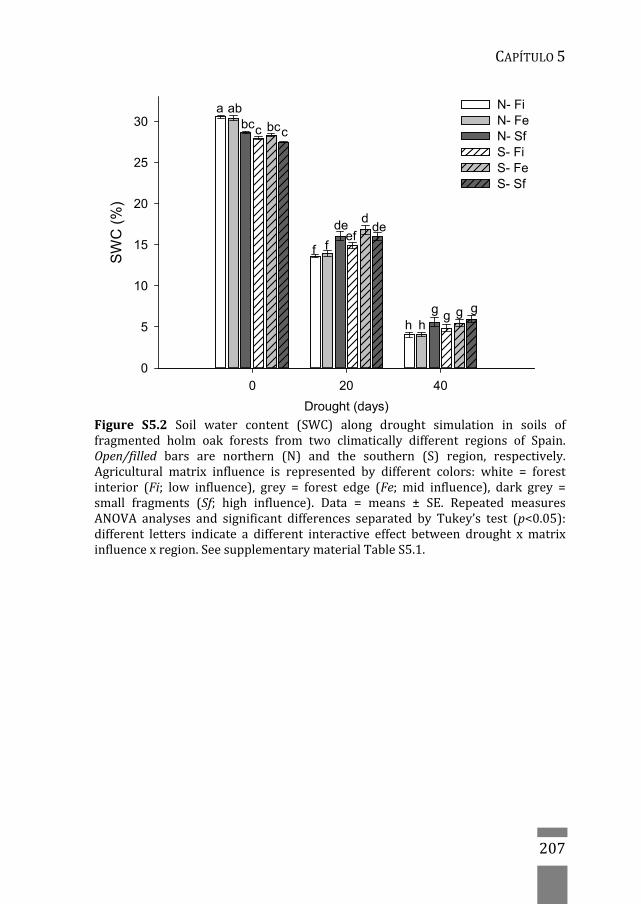
CAPÍTULO5
207
Figure S5.2 Soil water content (SWC) along drought simulation in soils offragmented holm oak forests from two climatically different regions of Spain.Open/filled bars are northern (N) and the southern (S) region, respectively.Agricultural matrix influence is represented by different colors: white = forestinterior (Fi; low influence), grey = forest edge (Fe; mid influence), dark grey =small fragments (Sf; high influence). Data = means ± SE. Repeated measuresANOVA analyses and significant differences separated by Tukey’s test (p<0.05):different letters indicate a different interactive effect between drought xmatrixinfluencexregion.SeesupplementarymaterialTableS5.1.
Drought (days)
0 20 40
SW
C (
%)
0
5
10
15
20
25
30N- Fi N- Fe N- Sf S- Fi S- Fe S- Sf
c
a abbc bcc
f f
de deef
d
hg g
gh
g
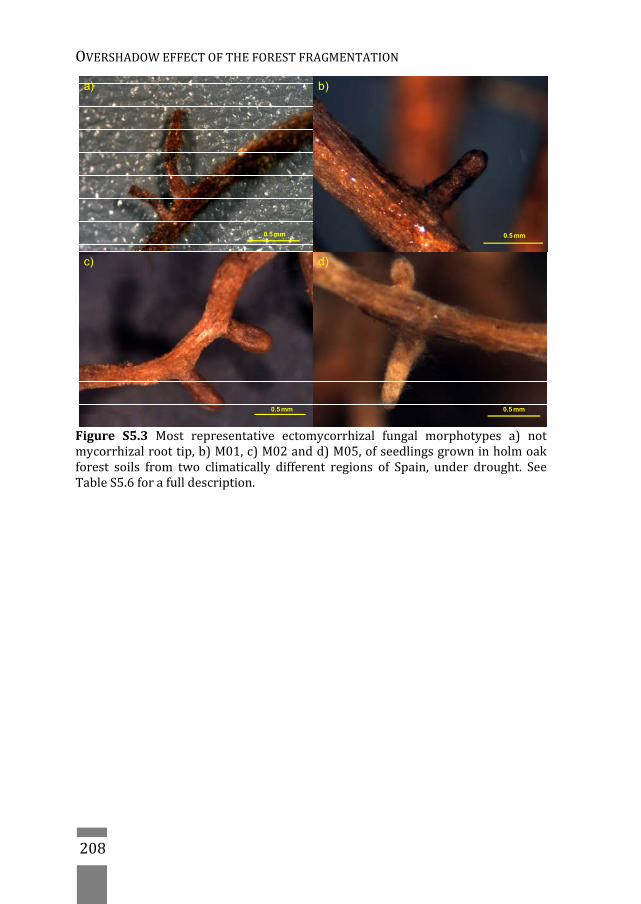
OVERSHADOWEFFECTOFTHEFORESTFRAGMENTATION
208
Figure S5.3 Most representative ectomycorrhizal fungal morphotypes a) notmycorrhizalroottip,b)M01,c)M02andd)M05,ofseedlingsgrowninholmoakforest soils from two climatically different regions of Spain, under drought. SeeTableS5.6forafulldescription.
0.5 mm
0.5 mm 0.5 mm
0.5 mm
a) b)
c) d)

CAPÍTULO5
209
FigureS5.4Finalroot:shootratioofseedlingsgrowninsoilsoffragmentedholmoak forests from two climaticallydifferent regionsof Spain, underdrought. Left:open/filledbarsrepresentnorthern(N)orsouthern(S)region,respectively.Theagricultural matrix influence is represented by different colors: white = forestinterior (Fi; low influence), grey = forest edge (Fe; mid influence), dark grey =smallfragments(Sf;highinfluence).Right:seedlingprovenanceisrepresentedbydifferent fill patterns (Gal = Galaico‐Leonesa; Sib = Sistema Iberico; Lam = LaMancha). Data = means ± SE. ANOVA analysis and significant differences byTukey’s test (p<0.05), significant differences among seedling provenances arerepresentedbydifferentletters.SeesupplementarymaterialTableS5.5.
Roo
t:sh
oot
0.0
0.5
1.0
1.5
2.0
2.5
3.0
a a
b
n.s.
SouthernFi Fe SfNorthern
Fi Fe Sf Gal Sib Lam

OVERSHADOWEFFECTOFTHEFORESTFRAGMENTATION
210
Table S5.1 Summary of the physicochemical characteristics of soils fromfragmentedholmoakforests.Data=mean±SE.ElaboratedfromFlores‐Renteríaetal.(2015).
TableS5.2Numberofplant‐soilmicrocosmswithsoilscollectedattwolocations(Northern/Southern), in fragmented forests (Fi= forest interior, Fe= forest edge,Sf= small fragment), with native or no‐native microbial communities (MC), andwithdifferent seedlingprovenances (Gal=GalaicoLeonesa;Sib=Sistema Iberico;Lam= La Mancha), one year after their establishment in the greenhouse, undercontrolledconditions.
Northern Southern
Forest interior
Forest edge Small fragments
Forest interior
Forest edge Small fragments
SWC (%) 31.33 ± 1.22 46.41 ± 1.4 49.84 ± 2.17 37.86 ± 0.85 39.65 ± 1.34 45.17 ± 1.63
SOM (%) 5.5 ± 0.47 16.84 ± 1.88 19.84 ± 2.39 9.32 ± 1.12 11.00 ± 1.12 14.09 ± 1.75
pH 6.36 ± 0.41 7.69 ± 0.06 7.32 ± 0.11 7.90 ± 0.04 7.83 ± 0.05 7.87 ± 0.04
Organic N (%) 0.23 ± 0.01 0.58 ± 0.07 0.78 ± 0.12 0.29 ± 0.01 0.29 ± 0.03 0.46 ± 0.07
P2O5 (mg Kg-1) 12.32 ± 1.75 14.91 ± 1.22 34.39 ± 4.21 2.93 ± 0.57 7.79 ± 1.25 16.47 ± 1.68
K+ (mg·Kg-1) 170.8 ± 32.8 462.8 ± 55.2 529.9 ± 38.9 532.9 ± 69.3 556.24 ± 67.6 791.48 ± 55.8
Northern Southern
Native MC No-native MC Native MC No-native MC
Fi Fe Sf Fi Fe Sf Fi Fe Sf Fi Fe Sf
Gal 10 6 10 8 8 6 7 7 7 8 7 7
Sib 9 7 7 8 6 5 6 8 8 3 7 6
Lam 6 5 7 8 4 8 6 4 4 6 5 4

CAPÍTULO5
211
TableS5.3Responseoftheplant‐soilsystem
todroughtsimulation(D)inholmoakforestsoilsfromtwoclimatically
differentregionsofSpain(R),collectedinfragmentsw
ithdifferentagriculturalm
atrixinfluence(MI).Datawere
analysedbyrepeatedmeasuresANOVA.Significanteffectsarenotedinbold.R
eco=Ecosystem
respiration;GPP=gross
primaryproductivity;g
S=stomatalconductance;F
v/F m=photochemicalefficiency(measuredatpre‐andfinal‐drought);
SWC=Soilw
atercontent.
Rec
oG
PP
g SF v
/Fm
Pre
daw
nF v
/Fm
Mid
day
SW
C
Fp
Fp
Fp
Fp
Fp
Fp
Reg
ion(
R)
12.0
4<0
.001
1.19
0.27
73.
530.
061
8.39
0.00
45.
150.
024
30.1
3<0
.001
Mat
rix in
fluen
ce (
MI)
9.52
<0.0
012.
050.
131
3.91
0.02
111
.68
<0.0
0111
.43
<0.0
0122
.67
<0.0
01
R x
MI
3.53
0.03
10.
110.
896
0.27
0.76
41.
650.
194
1.28
0.28
17.
75<0
.001
Dro
ught
(D
)94
5.14
<0.0
0139
6.66
<0.0
0176
7.92
<0.0
0182
4.35
<0.0
0197
8.40
<0.0
0111
383.
67<0
.001
D x
R5.
900.
003
9.75
<0.0
0118
.89
<0.0
0121
.11
<0.0
0121
.64
<0.0
0187
.88
<0.0
01
D x
MI
4.06
0.00
37.
14<0
.001
10.3
4<0
.001
9.43
<0.0
0110
.42
<0.0
0132
.23
<0.0
01
D x
R x
MI
2.37
0.05
25.
73<0
.001
2.17
0.07
22.
070.
128
2.07
0.12
910
.47
<0.0
01
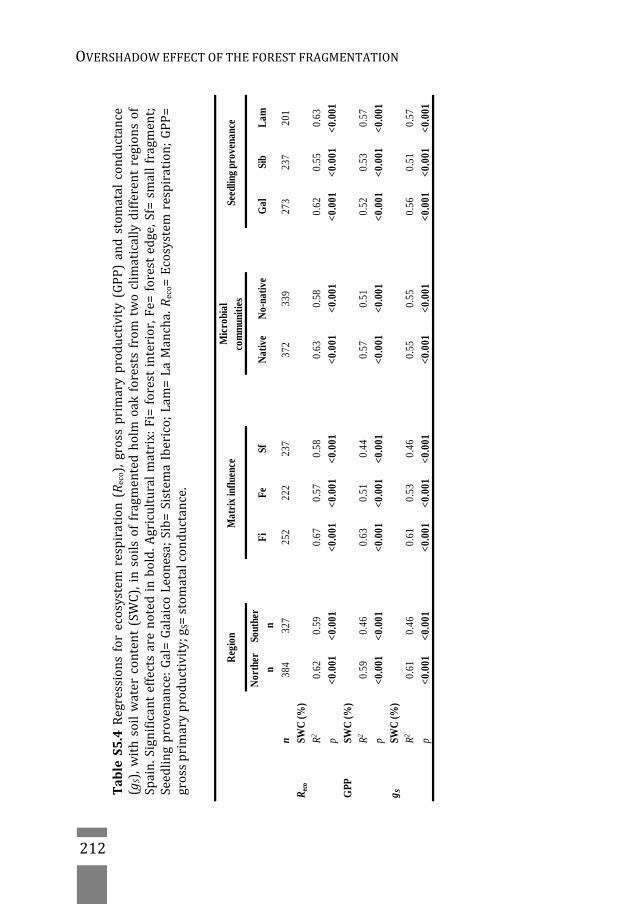
OVERSHADOWEFFECTOFTHEFORESTFRAGMENTATION
212
TableS5.4Regressionsforecosystem
respiration(Reco),grossprimaryproductivity(GPP)andstom
atalconductance
(gS),w
ithsoilwatercontent(SW
C),insoilsoffragmentedholmoakforestsfromtwoclimaticallydifferentregionsof
Spain.Significanteffectsarenotedinbold.Agriculturalm
atrix:Fi=forestinterior,Fe=forestedge,Sf=smallfragm
ent;
Seedlingprovenance:Gal=GalaicoLeonesa;Sib=Sistem
aIberico;Lam
=LaMancha.R
eco=Ecosystem
respiration;GPP=
grossprimaryproductivity;g
S=stomatalconductance.
Reg
ion
Mat
rix
influ
ence
Mic
robi
al
com
mun
ities
Seed
ling
prov
enan
ce
Nor
ther
nSo
uthe
rn
FiFe
SfN
ativ
eN
o-na
tive
Gal
Sib
Lam
n38
432
725
222
223
737
233
927
323
720
1R
eco
SWC
(%)
R20.
620.
590.
670.
570.
580.
630.
580.
620.
550.
63p
<0.0
01<0
.001
<0.0
01<0
.001
<0.0
01<0
.001
<0.0
01<0
.001
<0.0
01<0
.001
GPP
SWC
(%)
R20.
590.
460.
630.
510.
440.
570.
510.
520.
530.
57p
<0.0
01<0
.001
<0.0
01<0
.001
<0.0
01<0
.001
<0.0
01<0
.001
<0.0
01<0
.001
g SSW
C(%
)R2
0.61
0.46
0.61
0.53
0.46
0.55
0.55
0.56
0.51
0.57
p<0
.001
<0.0
01<0
.001
<0.0
01<0
.001
<0.0
01<0
.001
<0.0
01<0
.001
<0.0
01
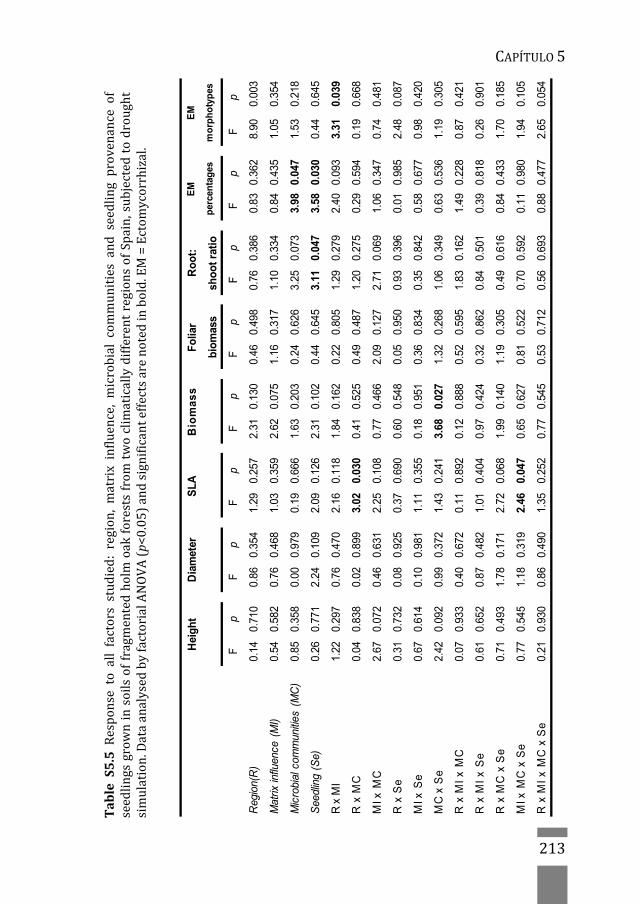
CAPÍTULO5
213
TableS5.5Responsetoallfactorsstudied:region,m
atrixinfluence,microbialcom
munitiesandseedlingprovenanceof
seedlingsgrowninsoilsoffragm
entedholmoakforestsfrom
twoclimaticallydifferentregionsofSpain,subjectedtodrought
simulation.DataanalysedbyfactorialANOVA(p<0.05)andsignificanteffectsarenotedinbold.EM=Ectom
ycorrhizal.
Hei
gh
tD
iam
eter
SL
AB
iom
as
sF
olia
r
bio
mas
s
Ro
ot:
sho
ot
rati
o
EM
per
cen
tag
es
EM
mo
rph
oty
pes
Fp
Fp
Fp
Fp
Fp
Fp
Fp
Fp
Reg
ion(
R)
0.14
0.71
00.
860.
354
1.29
0.25
72.
310.
130
0.46
0.49
80.
760.
386
0.83
0.36
28.
900.
003
Mat
rix in
fluen
ce (
MI)
0.54
0.58
20.
760.
468
1.03
0.35
92.
620.
075
1.16
0.31
71.
100.
334
0.84
0.43
51.
050.
354
Mic
robi
al c
omm
uniti
es (
MC
)0.
850.
358
0.00
0.97
90.
190.
666
1.63
0.20
30.
240.
626
3.25
0.07
33.
980.
047
1.53
0.21
8
See
dlin
g (S
e)0.
260.
771
2.24
0.10
92.
090.
126
2.31
0.10
20.
440.
645
3.11
0.04
73.
580.
030
0.44
0.64
5
R x
MI
1.22
0.29
70.
760.
470
2.16
0.11
81.
840.
162
0.22
0.80
51.
290.
279
2.40
0.09
33.
310.
039
R x
MC
0.04
0.83
80.
020.
899
3.02
0.03
00.
410.
525
0.49
0.48
71.
200.
275
0.29
0.59
40.
190.
668
MI x
MC
2.67
0.07
20.
460.
631
2.25
0.10
80.
770.
466
2.09
0.12
72.
710.
069
1.06
0.34
70.
740.
481
R x
Se
0.31
0.73
20.
080.
925
0.37
0.69
00.
600.
548
0.05
0.95
00.
930.
396
0.01
0.98
52.
480.
087
MI x
Se
0.67
0.61
40.
100.
981
1.11
0.35
50.
180.
951
0.36
0.83
40.
350.
842
0.58
0.67
70.
980.
420
MC
x S
e2.
420.
092
0.99
0.37
21.
430.
241
3.68
0.02
71.
320.
268
1.06
0.34
90.
630.
536
1.19
0.30
5
R x
MI
x M
C0.
070.
933
0.40
0.67
20.
110.
892
0.12
0.88
80.
520.
595
1.83
0.16
21.
490.
228
0.87
0.42
1
R x
MI
x S
e0.
610.
652
0.87
0.48
21.
010.
404
0.97
0.42
40.
320.
862
0.84
0.50
10.
390.
818
0.26
0.90
1
R x
MC
x S
e0.
710.
493
1.78
0.17
12.
720.
068
1.99
0.14
01.
190.
305
0.49
0.61
60.
840.
433
1.70
0.18
5
MI x
MC
x S
e0.
770.
545
1.18
0.31
92.
460.
047
0.65
0.62
70.
810.
522
0.70
0.59
20.
110.
980
1.94
0.10
5
R x
MI
x M
C x
Se
0.21
0.93
00.
860.
490
1.35
0.25
20.
770.
545
0.53
0.71
20.
560.
693
0.88
0.47
72.
650.
054

OVERSHADOWEFFECTOFTHEFORESTFRAGMENTATION
214
Table S5.6 Description of the ectomycorrhizal fungalmorphotypes of seedlingsgrown in holm oak forest soils from two climatically different regions of Spain,underdrought.SeeFig.S5.3
Morphotype Macroscopic description Rhizomorphs
M01 Dark brown/reddish mantle, felty mantle surface, un-branched, straight to slightly bent tips.
See Fig. S5.3b.
Present
M02 Dark brown/reddish mantle, smooth mantle surface, un-branched, straight tips.
See Fig. S5.3c.
Present
M03 Black/reddish mantle, smooth mantle surface, un-branched, straight tips
Absent
M04 Black mantle, smooth mantle surface, un-branched, slightly bent tips
Present
M05 White/yellow mantle, smooth mantle surface with loose hyphae, dichotomous and straight tips. See Fig. S5.3d.
Present
M06 Black/reddish mantle, grainy mantle surface with loose hyphae, dichotomous/coralloid, slightly bent tips
Absent
M07 Yellowish mantle, smooth mantle surface with loose hyphae, pinnate, slightly bent tips
Absent
M08 White mantle, un-branched, loose hyphae, slightly bent tips
Absent
M09 Black mantle, grainy mantle surface with loose black hyphae, un-branched, slightly bent tips
Present
M10 Black mantle, grainy mantle surface with loose black hyphae, tuberoid
Present

CAPÍTULO5
215
Table S5.7 Effect of all the studied factors: region, matrix influence, microbialcommunities and seedling provenance, on the survival ofQuercus ilex seedlingssubjectedtodroughtandgrowninsoilsoffragmentedholmoakforestsfromtwoclimaticallydifferentregionsofSpain.Significanteffects(PetoandPetoanalyses)arenoted inbold (p<0.05).Gal=GalaicoLeonesa; Sib=Sistema Iberico;Lam=LaMancha.
Factor Pair of factors X2
Region Northern vs. Southern 23.89**
Matrix influence Forest interior vs. forest edge 8.34**
Forest interior vs. small fragments 30.64**
Forest edge vs. small fragments 6.69**
Microbial communities Native vs. No-native 1.63 n.s.
Seedling provenance Gal vs. Sib 0.10 n.s.
Gal vs. Lam 0.08 n.s.
Sib vs. Lam 0.33 n.s.

OVERSHADOWEFFECTOFTHEFORESTFRAGMENTATION
216
TableS5.8GrowthofdifferentprovenancesofholmoakseedlinginsoilscollectedfromfragmentedforestsintwoclimaticallydifferentregionsofSpain,withnativeorno‐nativemicrobial communities and subjected todrought simulation.Data=means±SE.Agriculturalmatrixinfluence:Fi=forestinterior,Fe=forestedge,Sf=smallfragment;Seedlingprovenance:Gal=Galaico‐Leonesa;Sib=SistemaIberico;Lam=LaMancha;SLA=SpecificLeafArea.
n Height (cm)
Diameter (mm2)
SLA
(cm2 g-1)
Biomass
(g) Foliar
biomass (g) Root:shoot
ratio
Nor
the
rn
Fi
Nat
ive
Gal 10 20.1±2.4 33.8±6.0 22.2±0.9 12.5±1.3 2.1±0.2 1.7±0.1
Sib 9 21.6±3.7 38.5±4.0 23.1±0.8 10.6±1.2 2.4±0.5 1.3±0.2
Lam 6 25.8±4.0 50.8±8.1 20.7±1.1 13.7±1.2 2.4±0.3 1.4±0.1
No-
nativ
e
Gal 8 20.3±2.4 41.7±5.8 23.3±0.9 13.4±0.5 2.4±0.3 1.7±0.2
Sib 8 22.9±3.2 41.7±2.6 21.7±1.0 11.5±1.1 2.4±0.3 1.3±0.1
Lam 8 24.1±2.8 53.8±13.4 22.8±1.3 13.2±1.4 2.7±0.5 1.2±0.2
Fe
Nat
ive
Gal 6 20.2±2.6 32.7±6.9 24.9±1.0 12.2±1.3 2.1±0.4 1.7±0.3
Sib 7 18.1±1.5 39.3±5.2 21.7±1.2 9.7±0.7 2.1±0.3 1.3±0.2
Lam 5 21.4±2.2 44.9±8.4 20.0±1.5 12.1±1.4 1.9±0.3 1.6±0.2
No-
nativ
e Gal 8 25.2±1.5 37.4±6.9 25.0±1.9 12.3±1.1 2.0±0.3 1.7±0.2
Sib 6 22.9±3.0 38.7±3.9 22.9±1.4 11.9±1.1 2.4±0.4 1.3±0.1
Lam 4 17.9±4.5 34.9±3.5 34.1±1.5 11.8±2.4 1.9±0.7 1.8±0.2
Sf
Nat
ive
Gal 10 20.2±2.4 39.4±6.5 23.1±1.0 11.2±1.1 2.3±0.4 1.6±0.5
Sib 7 22.3±3.7 33.3±4.3 22.6±1.1 9.4±0.9 2.3±0.4 1.1±0.1
Lam 7 22.3±2.3 36.9±4.8 21.9±1.0 12.2±1.0 2.9±0.5 1.1±0.1
No-
nativ
e
Gal 6 21.6±4.7 35.2±8.4 23.3±3.0 11.7±1.7 1.6±0.5 4.5±2.6
Sib 5 19.0±4.5 44.7±6.8 24.7±3.4 11.7±1.3 2.1±0.5 1.3±0.2
Lam 8 13.8±2.9 31.1±7.7 25.5±1.8 8.8±1.2 1.5±0.4 3.9±2.2
So
uthe
rn
Fi
Na
tive
Gal 7 22.1±1.8 38.3±6.8 27.2±4.3 12.5±1.1 2.5±0.4 1.5±0.2
Sib 6 17.2±2.6 38.1±7.5 24.1±1.6 9.2±1.2 2.0±0.5 1.3±0.4
Lam 6 21.7±3.5 34.1±5.1 22.1±1.6 10.6±0.8 1.6±0.4 2.1±0.4
No-
nativ
e
Gal 8 19.4±3.2 30.0±7.6 23.4±1.1 10.0±1.0 1.6±0.2 2.4±0.6
Sib 3 21.9±3.1 44.8±8.4 18.4±0.4 13.8±1.0 2.6±0.1 1.2±0.3
Lam 6 21.7±2.6 35.6±7.4 21.1±0.6 13.5±1.9 2.9±0.7 1.3±0.1
Fe
Nat
ive
Gal 7 18.1±2.8 38.7±6.8 23.5±0.4 9.8±1.2 1.9±0.5 1.2±0.2
Sib 8 18.1±1.4 42.1±5.2 21.5±1.3 9.4±1.2 2.1±0.4 1.2±0.2
Lam 4 21.4±2.8 30.1±13.5 20.5±1.6 9.6±1.6 2.0±0.6 1.6±0.3
No-
nativ
e
Gal 7 21.4±2.4 30.0±2.6 21.5±1.5 10.2±1.0 1.7±0.3 1.6±0.2
Sib 7 19.8±1.4 36.5±2.5 21.3±1.2 10.8±1.1 2.4±0.4 1.3±0.1
Lam 5 16.9±2.6 52.7±11.1 22.0±1.5 10.9±2.2 1.8±0.7 1.6±0.2
Sf
Nat
ive
Gal 7 24.9±3.0 33.7±2.1 21.5±1.1 12.0±1.2 2.6±0.3 1.3±0.1
Sib 8 20.0±1.9 33.0±5.0 22.7±2.7 8.8±0.9 1.9±0.3 1.4±0.2
Lam 4 25.4±2.3 46.5±7.3 30.0±5.4 13.2±0.4 2.1±0.5 1.6±0.3
No
-na
tive
Gal 7 19.4±2.9 29.1±5.9 25.1±1.4 10.6±1.3 2.0±0.3 1.5±0.1
Sib 6 18.9±3.9 39.0±3.7 22.0±2.1 10.8±1.6 2.1±0.5 1.5±0.3
Lam 4 19.3±2.0 34.2±9.6 21.9±1.3 12.2±0.5 2.0±0.2 2.0±0.3

Disc
C
cusióng
apítu
generaly
lo6
yconcluusioness


CAPÍTULO6
219
Discusióngeneral
6.1Respuestadelsistemaplanta‐suelo‐microorganismoalafragmentación
6.1.aEfectodelafragmentaciónsobreelcrecimientodelasplantas
Nuestros resultados demuestran que la fragmentación de los encinares
ejerceuna influenciapositivasobreel tamañode lasencinas, conárboles
másgrandesenlosbordesdelencinaryenlosfragmentospequeños.Este
incrementopuededeberse,entreotrosfactores,alamayordisponibilidad
derecursos(agua,nutrienteso luz)comoconsecuenciadeladisminución
de competencia con otros árboles, aunque no podemos descartar otros
factores como el manejo, o la historia de uso de estos encinares. Cabe
destacar que este efecto positivo es un patrón consistente en ambas
regiones de estudio, así como en otros encinares fragmentados en la
Península Ibérica (SantosyTellería,1998), loquesugiereque la relación
entreeltamañodelarboladoylainfluenciadelafragmentaciónescondeun
fuerte componente causal. Asimismo, este aumento de tamaño puede
deberseaunaretroalimentaciónpositiva,comosehaestudiadoparaotras
especiesdelgéneroQuercusenlosecosistemasMediterráneos(verAponte
etal.,2011),donde lamayordisponibilidadderecursostendríaunefecto
positivosobretamañodelasencinas, lascualesasuvez,proporcionarían
mayorcantidadderecursosparalascomunidadessubterráneas,loqueasu
vezestimulalaactividadyrecicladodenutrientesparalaplanta.
6.1.bRepercusióndelaumentode las encinas sobre las condicionesambientalesyfuncionalesdelsuelo
El aumento del tamaño de los árboles asociado a la fragmentación
repercute positivamente en el funcionamiento del suelo, principalmente
modificandolascondicionesmicro‐ambientalesdelmismo,tantoabióticas
(mayorfertilidadyhumedad,menorpHytemperatura)comobióticas(más

DISCUSIÓNGENERAL
220
materiaorgánicaybiomasamicrobiana).Este incrementoen lacapacidad
funcional de los suelos se vio reflejado en la mayor respiración del
ecosistema (incluyendo planta y suelo, Reco; capítulos 4 y 5) y la mayor
actividad enzimática (capítulo 2) y consumo de fuentes de carbono
(capítulo 3), efecto que en algunos casosperduró al aplicarseuna sequía
crónica, p. ej. mayor actividad enzimática (capítulo 4). Si bien otros
estudios han descrito esta influencia de la cobertura vegetal sobre la
actividaddelsuelo(Lázaro‐Nogaletal.,2012;Riuttaetal.,2012),eltrabajo
desarrolladoenestatesisañadeunadimensiónmecanicista,mostrandola
interaccióndelosdiferentesfactoresresponsablesdeesteincrementodel
funcionamiento microbiano como consecuencia de la fragmentación del
hábitat.
Losmodelos de ecuaciones estructuralesmostraron que el efecto
neto de la fragmentación en el funcionamiento del suelo en un encinar
meso‐mediterráneo se explica a través de una compleja cascada de
relaciones causa‐efecto interconectadas, tanto directas como indirectas,
entre los diferentes factores (abióticos y bióticos) y compartimentos
ecológicos (planta y microorganismos) del ecosistema. Las encinas más
grandes, con mayor influencia de la matriz agrícola, presentaron mayor
productividad, lo que se refleja tanto en el mayor contenido de materia
orgánicayfertilidad(p.ej.proporciónC:NyPC1denutrientes),comoenun
incremento en su capacidad de retención de agua (humedad del suelo),
muyasociadoaesemayorcontenidoenmateriaorgánica(Boix‐Fayosetal.,
2001; Franzluebbers, 2002). Las encinas, directamente y a través de su
influencia sobre la materia orgánica, amortiguaron la temperatura del
suelo, posiblemente mediante la disminución de la tasa de evaporación
(BelskyyCanham,1994;HastwellyMorris,2013).Eltamañoycercaníade
las encinas, además, se vio asociado con una acidificación neta del suelo
probablemente debida a la acumulación demateria orgánica y de ácidos

CAPÍTULO6
221
húmicos,yalefectoacidificantedelentornorizosféricorelacionadoconla
absorcióndenutrientesylaliberacióndemetabolitossecundarios(Dakora
yPhillips,2002;Fagetetal.,2013).
Aunque la cercanía al árbol explica gran parte de la variabilidad
espacialde larespiracióndelsuelo,comosehaestudiadoenecosistemas
similares(Matíasetal.,2012;Barbaetal.,2013),observamostambiénuna
relación muy significativa con la temperatura y humedad del mismo,
independientemente de la cercanía a la planta, lo que indica la enorme
dependencia que la actividad metabólica del suelo tiene del clima.
Asimismo,lasactividadesenzimáticasderivadasdelaactividadmicrobiana
fueron sensibles a pequeñas variaciones en el pH, un factor que ha sido
descrito con anterioridad como extremadamente importante para
determinar la actividad metabólica de los microorganismos del suelo
(FiereryJackson,2006;Sinsabaughetal.,2008;Legayetal.,2014).Eneste
respecto, los modelos de ecuaciones estructurales nos permitieron
discernir que el efecto del incremento de la materia orgánica sobre las
actividades enzimáticas no es directo, tal como sugieren otros estudios
(Sinsabaughet al., 2008;Burnset al., 2013;Baldrian,2014), si noque se
produce indirectamente a través de su influencia sobre otros factores,
como la biomasamicrobiana, el pH, la humedad o la relación C:N, que sí
ejercen un control directo sobre la actividad metabólica de las
comunidadesmicrobianas.Porotraparte, elobservadoefectodirectodel
tamañode los árboles y su cercanía sobre la actividad enzimática podría
reflejar la estimulación de la capacidad descomponedora de materia
orgánica, estímuloenparte atribuible a los exudados radicales (Dakora y
Phillips,2002;Kuzyakov,2010).
Por tanto, podemos concluir que el tamaño de las encinas
(fuertemente dependiente de la influencia de la matriz) y los cambios
micro‐ambientales inducidos por las mismas controlan fuertemente el

DISCUSIÓNGENERAL
222
funcionamiento del suelo, y que este control responde a complejas
relacionescausa‐efectoentrelaplantaylascomunidadesmicrobianas.
6.1.cEfectode la fragmentacióndelencinarsobre la fertilidady lascomunidadesmicrobianasdelsuelo
Además del efecto sobre las encinas, la matriz agrícola circundante
favoreció directamente la acumulación de nutrientes en suelos de
fragmentos pequeños y en los bordes de los fragmentos grandes en
comparación con los interiores (capítulo 2‐4). Este efecto de fertilización
podría ser el resultado del arrastre por escorrentía de los nutrientes de
dichamatrizhacialossuelosmásinfluenciados(BoutinyJobin,1998).
Al igualque la fertilidaddelsuelo, la fragmentacióndelhábitaten
los encinares mediterráneos fragmentados afectó directamente a la
diversidad genética y a la estructura de las comunidades microbianas,
efectoquefueaúnmayorqueelindirectoatravésdelasencinas(capítulo
3). De hecho, como se ha señalado previamente, gran parte de la
variabilidad de las comunidades microbianas fue explicada por la
disponibilidaddenutrientes(Wardle,1998;O'Donnelletal.,2001;Fierery
Jackson,2006;Bowenetal.,2011;Ramirezetal.,2012;Tardyetal.,2014),
fuertementeinfluenciadasporlafragmentacióndelencinar.
Al contrario que la estructura y diversidad genética de las
comunidades microbianas, su funcionamiento (actividad enzimática y
diversidad de substratosmetabolizados) dependió principalmente de las
modificacionesmicro‐ambientalesdelsuelocausadasporlasencinas.Esto
sugiere un desacoplamiento parcial entre los factores que controlan la
estructura de las comunidades microbianas y su funcionamiento: el
ensamblajeydiversidaddelascomunidadesnoestántotalmenteligadosa
su capacidad de metabolizar diferentes sustratos y de mineralizar
diferentes nutrientes. Estos resultados podrían indicar diferencias en la
composición de la comunidad activa y la comunidad microbiana total

CAPÍTULO6
223
(O'Donnelletal.,2001;JonesyLennon,2010;Placellaetal.,2012;Barnard
et al., 2013), dado que las condiciones ambientales desfavorables (p. ej.
áreas abiertas) pueden asociarse con inactividad de parte de las
comunidadesdebacteriasyhongos(JonesyLennon,2010).
A pesar de esta diferente sensibilidad de la estructura y de la
funcionalidad de las comunidades microbianas, tanto los modelos de
ecuacionesestructuralescomolacomparacióndematricesdedisimilitudes
mostraron una relación entre la diversidad bacteriana y su capacidad de
metabolizardiferentessustratos.Laexistenciadeestacomplejarelaciónha
sido frecuentemente analizada, a veces con resultados contradictorios
(Griffithsetal.,2000;O'Donnelletal.,2001;Belletal.,2005;Langenheder
etal.,2010;Levineetal.,2011;CurielYusteetal.,2014;Tardyetal.,2014;
Mendes et al., 2015), aunque la relación encontrada aquí y en estudios
previos (Bell et al., 2005;Tardyet al., 2014), sugiereque lasalteraciones
ambientales, como las derivadas de la fragmentación del hábitat, con la
capacidad de producir cambios en la estructura y diversidad de las
comunidades microbianas, podrían ejercer un efecto negativo sobre su
funcionamiento.
6.1.d Dependencia espacial de la respuesta de las comunidadesmicrobianasalafragmentación
Lainfluenciapositivatantodelacercaníaytamañodelasencinascomode
la influenciadelamatrizsobreel funcionamientoydiversidadlocal(alfa‐
diversidad) de las comunidades microbianas contrasta con la
heterogeneidad espacial (beta‐diversidad) tanto estructural como
funcional, observada (capítulo 3). Precisamente, las áreas con más
influencia de lamatriz agrícola (fragmentos pequeños y bordes) o de las
encinas (con cobertura), mostraron comunidades microbianas más
homogéneas (menos beta‐diversas), en contraste con la mayor
heterogeneidadespacialdelasmismasenáreasnoperturbadasdelinterior

DISCUSIÓNGENERAL
224
defragmentosgrandesozonasnocubiertasporencinas.Enprimerlugar,
esto sugiriere que la respuesta de las comunidades microbianas a las
perturbacionesesdependientedelaescalaespacialalaquesedetermina,
lo cual debería ser tenido en cuenta si queremos entender y predecir las
respuestas de estas comunidades ante perturbaciones ambientales. Por
otro lado, ya que la disminución de beta‐diversidad puede ser utilizada
comoun indicadordehomogenizacióndelhábitat (Oldenet al., 2004), la
convergencia observada podría atribuirse a filtros medioambientales
causadospor lahomogenizaciónde las condicionesabióticasy/obióticas
en las áreas menos beta‐diversas (fragmentos pequeños, bordes y con
cobertura), con respecto a las áreas más beta‐diversas (interiores del
encinaryáreasabiertas).Lamayorhomogenizacióndelascomunidadesen
escenariosdefragmentación,especialmentebajovegetación,indicanque,a
pesar del enriquecimiento de las comunidades microbianas y su
funcionalidad a escalamicro‐local (alfa‐diversidad), a escala depaisaje la
fragmentación está asociada con un empobrecimiento estructural y
funcionaldelasmismas,probablementeconconsecuenciasnegativassobre
la capacidad de estos suelos para responder a futuras alteraciones
climáticas(CurielYusteetal.,2011;Barnardetal.,2013).
6.1.eDependenciadelaregióndeorigendelsuelosobrelarespuestadelsistemaplanta‐suelo‐microorganismoalafragmentación
Losresultadosobtenidosparalosmicrocosmosconsuelosprocedentesde
la región del norte (supra‐mediterránea) confirmaron los resultados
observadosen losmicrocosmosconsuelosde laregiónsury losestudios
realizados en campo en el encinarde la región sur (meso‐mediterráneo).
Losresultadosconfirmanlainfluenciapositivadelafragmentaciónsobreel
tamañodelasencinasylascaracterísticasfísico‐químicasdelsuelo,siendo
las diferencias ocasionadas por la influencia de la matriz agrícola más
determinantes para la planta y el suelo, que las diferencias entre las

CAPÍTULO6
225
regiones de estudio (capítulo 4 y 5). Por el contrario, las condiciones
bioclimáticas particulares de cada región ejercieron un control diferente
sobrelabiomasayladiversidaddelascomunidadesmicrobianas.Poruna
parte, los suelos de la región del norte, más húmeda y fría, mostraron
mayorbiomasamicrobianaasociadaamascantidaddemateriaorgánica,y
comunidades con mayor diversidad bacteriana, especialmente en suelos
con poca influencia de la matriz agrícola (fragmentos grandes), en
contrasteconlaregióndelsur,engeneralconmenorbiomasamicrobianay
unacomunidadfúngicamásdiversaqueladelaregiónnorte(capítulo4).
Esto sugiere una dominancia fúngica en la región más seca y cálida,
probablementerelacionadaconlamayoradaptacióndeloshongosaestos
ambientes(CurielYusteetal.,2011;Grigulisetal.,2013;Fuchsluegeretal.,
2014).Asimismo, todos los rasgos fisiológicos funcionalesmedidosen las
plántulasdeencina(GPP,conductividadestomática,eficienciafotoquímica)
respondieron positivamente a la fragmentación, manteniendo tasas
metabólicas más altas las plántulas crecidas en suelos con una mayor
influencia de la matriz agrícola (fragmentos pequeños y bordes), que
finalmentesereflejabaensumayorsupervivencia(capítulo4y5).
Nuestros resultados sugieren que la fragmentación del encinar
tiene un fuerte impacto en el sistema planta‐suelo‐microorganismo
independientemente de la región de estudio, lo cual sugiere que puede
extrapolarse también a otras regiones de encinares fragmentados con
influenciaagrícola.

DISCUSIÓNGENERAL
226
6.2 Respuesta del sistema planta‐suelo‐microorganismo a la sequía enambientesfragmentados
6.2.a Efectos de la sequía crónica sobre la capacidad funcional delsistemaplanta‐suelo‐microorganismo
En general, la sequía crónica aplicada a los experimentos controlados en
microcosmos (capítulos 4 y 5) afectó sustancialmente al funcionamiento
del sistema planta‐suelo‐microorganismo, altamente dependiente de la
disponibilidad de agua, lo que se reflejó en los diversos indicadores
funcionalesmedidos(enzimas,respiraciónyproductividaddelecosistema
ydiversidadfuncional).Estadisminucióndelaactividadmetabólicahasido
descrita en estudios previos tanto para la respiración del suelo (Rey y
Jarvis, 2006; Curiel Yuste et al., 2007), y sus actividades enzimáticas
(Sardans y Peñuelas, 2005; Zornoza et al., 2006), como para la
productividadycrecimientodeQ.ilex(Pesolietal.,2003;OgayayPeñuelas,
2004). Por otro lado, el efecto de la sequía sobre el funcionamiento del
componente autotrófico del sistema (GPP demicrocosmos deQ. ilex) fue
menos acentuado que sobre los indicadores que integraban el
funcionamientomicrobiano(Reco,actividadesenzimáticas).Estadiferencia
se vio enfatizada amedida que las condiciones de sequía se agudizaron,
evidenciando una menor disminución del metabolismo bajo sequía en
comparaciónconlosmicroorganismosdentrodelsistema.
6.2.bEfectosdelasequíasobreladiversidaddebacteriasyhongos
Uno de los resultadosmás concluyentes obtenidos durante la simulación
climática(sequíayrehidratación;capítulo4)fuelarespuestaantagónicade
las comunidades bacteriana y fúngica a lo largo del gradiente de
disponibilidad hídrica; las comunidades bacterianas aumentaron su
diversidadencondicionesdemayordisponibilidadagua(antesdelasequía
yenrehidratación)y locontrariopasócon loshongos,másdiversosante

CAPÍTULO6
227
condiciones de limitación hídrica. Estos resultados refuerzan la idea
anteriormente comentada de que los hongos tienen mejores estrategias
para evitar las limitaciones hídricas en comparación a las bacterias
(Drenovsky et al., 2004; Curiel Yuste et al., 2011; Barnard et al., 2013).
Mientrasquelasbacterias,organismosquehanevolucionadoenelmedio
acuoso(Boeretal.,2005)encuentranunentornoóptimoencondicionesde
buena disponibilidad hídrica, los hongos, organismos mayoritariamente
evolucionados en el medio terrestre, son más abundantes, diversos y
capaces de mantener su metabolismo en ambientes hídricos limitantes
(CurielYusteetal.,2011;Grigulisetal.,2013).Lacapacidaddeloshongos
de evitar las zonas secas y orientarsemediante el sistema de hifas hacia
fuentesdeaguamáseficientementequelasbacteriaspodríaestardetrásde
esta mayor ventaja en condiciones de sequía (Curiel Yuste et al., 2011;
Barnardetal.,2015).
6.2.cDependencia de la región de origen sobre la respuesta de lascomunidadesmicrobianasalasequíaylafragmentación
Larespuestadelascomunidadesmicrobianas(diversidadyensamblaje)en
el sistema planta‐suelo‐microorganismos ante la sequía y rehidratación
simuladasdependieronengranmedidadelaregiónbioclimáticadeorigen
(capítulo 4). Así, las comunidades microbianas de la región norte, más
húmedayfría,mostraronunamayorsensibilidadalasequíaquelasdela
región sur, lo cual sugiere que las condiciones históricas (más limitación
hídrica en la región del sur), pudieron actuar como filtro ambiental
seleccionandoespeciesmicrobianastolerantesalasequía,queresistieron
mejoralascondicionessimuladas(Cruz‐Martinezetal.,2009;CurielYuste
etal.,2014;EvansyWallenstein,2014).
Además,laregióndeestudioafectóladiversidaddemorfotiposde
hongosectomicorrícicosasociadosa lasplántulas,quefuemayorparalos
suelosmássensiblesalasequíadelaregióndelnorte,encomparacióncon

DISCUSIÓNGENERAL
228
los del sur (capítulo 5). Además de esta correlación negativa entre
diversidad ectomicorrízica y resistencia a la sequía, encontramos que la
respuesta a la sequía del sistema planta‐suelo se correlacionó
negativamenteconunmayorporcentajedemicorrización.Estosresultados
sugierenelaumentoenladiversidadytasademicorrizaciónpuedehaber
afectado positivamente a la presencia de morfotipos posiblemente
oportunistas, que bajo condiciones sub‐optimas de humedad pudieron
tenerunefectonegativoenlarespuestadelsistema(capítulo5;verRincón
etal.,2007;SmithyRead,2010).Tambiénobservamosquelapresenciade
microorganismosnativosdelsueloafectópositivamentealadiversidadyal
porcentaje de micorrización de las plántulas, lo que sugiere que los
propágulos de hongos ectomicorrícicos provenientes de suelos de
encinaresfragmentadospresentaroncompatibilidadconlasplántulasdeQ.
ilexyfueronsuficientementecompetitivosparaestablecerseapesardelos
posiblesefectosdeprioridad,generadosporlasmicorrizasyaestablecidas
(Rincónetal.,2014).
Al contrario que los indicadores de diversidad genética y
composición (estructura) de las comunidades microbianas, la respuesta
funcionaldeestascomunidadesalasequíaestuvoprincipalyfuertemente
determinada por los efectos de la fragmentación del encinar, siendo los
suelosconmayorinfluenciadelamatrizagrícola(fragmentospequeñosy
bordes), con unamayor cantidad demateria orgánica y por lo tanto con
mayor capacidad de retención de agua, los que mantuvieron tasas
metabólicas mayores durante la sequía simulada (actividad ureasa, Reco;
capítulos4 y5, respectivamente).Nuestros resultados,por tanto, indican
que la fuerte influencia de la fragmentación sobre las características
fisicoquímicas del suelo y sobre el funcionamiento del sistema planta‐
suelo‐microorganismooscureciócualquierposibleefectode laadaptación
diferencialdelasplántulasfrutodelascondicionesbioclimáticashistóricas

CAPÍTULO6
229
asociadas con su procedencia (capítulo 5), como ha sido observado en
otros estudios (Gratani, 1995; Gratani et al., 2003; Pesoli et al., 2003;
Andivia et al., 2012). Este resultado muestra que para entender la
respuestadelosecosistemasalcambioclimáticoenescenariosdecambios
ambientalesmásgeneralespuedesermásimportanteentenderlosefectos
de la fragmentación sobre las condiciones abióticas (físico‐químicas) y
bióticas(masbiomasaasociadaamenoscompetencia)delecosistemaque
entender la capacidadde adaptaciónde los organismos a las condiciones
concretasdesequía.
6.3Consideracionesfinales
Colectivamente,nuestrosresultadossugierenquelosefectospositivosde
la fragmentación del encinar sobre las características abióticas del suelo
(fisicoquímicas) y las condiciones bióticas (menos competencia por
recursosymayorbiomasavegetal),podríanaminorarenciertamedidalos
efectos negativos de la sequía sobre el sistema planta‐suelo‐
microorganismo en los encinaresmediterráneos rodeados de unamatriz
agrícola.Además,nuestros resultados señalanque laestructuraactualde
las comunidadesmicrobianas, fruto de la selección histórica a la que los
microorganismos han sido sometidos, determina el funcionamiento de
estascomunidadesasícomoelfuncionamientoecosistémicoysurespuesta
a la sequía. Sin embargo, queda por entender cómo el empobrecimiento
estructuralyfuncionalnetodelascomunidadesmicrobianasasociadocon
la fragmentaciónobservadaaescaladepaisaje(beta‐diversidad)afectaal
funcionamientodelsistemaplanta‐suelo‐microorganismoyasurespuesta
anteelcambioclimático,concretamentealasequía.
DISCUSIÓNGENERAL
230
Conclusiones
1. LafragmentacióndelencinarMediterráneo,medidacomoelgrado
de influencia de la matriz agrícola, produjo importantes
alteraciones en el sistema planta‐suelo‐microorganismo, que
fuerontantodirectascomoindirectas.
2. Encinasmásgrandesenlaszonasconunainfluenciamedia(borde)
yalta(fragmentospequeños)delamatrizagrícola,fuerontambién
más productivas, observándose mayor cantidad de materia
orgánicaenelsuelo.Estaacumulacióndemateriaorgánica indujo
cambios en las condicionesabióticas (microclimaypH)ybióticas
(biomasa microbiana) del suelo, impactando positivamente la
actividadmicrobianayporlotantolafuncionalidaddelsistema.
3. La fertilidad del suelo se vio directamente favorecida por la
influenciadelamatrizagrícola,afectandoasuvezlacomposicióny
diversidadlocal(alfadiversidad)delascomunidadesmicrobianas.
La estructura de las comunidades bacterianas se relacionó
positivamente con su capacidad para metabolizar diferentes
fuentesdecarbono.
4. Lafragmentacióndelencinarafectónegativamentea laestructura
de las comunidades microbianas y su funcionalidad a escala de
paisaje (beta‐diversidad), con posibles consecuencias negativas
sobrelacapacidadderespuestadeestossuelosalcambioglobal.
5. El futuro incremento de la sequía previsto para la cuenca
Mediterránea podría tener repercusiones en la proporción de las
comunidadesmicrobianasfavoreciendoalascomunidadesfúngicas
sobre las bacterianas, y ralentizando las tasas metabólicas del
suelo.

CAPÍTULO6
231
6. Laadaptaciónhistóricadelascomunidadesmicrobianasalasequía
dependedelaregiónbioclimáticadeorigendelsuelo,ypuedetener
unefecto importante sobre la capacidadde resistencia/resiliencia
delascomunidadesmicrobianasanteelaumentodelasequía.
7. Lamicorrizacióndelasplantasseasocióaunarespuestanegativa
del sistemaa la sequía, probablemente en relación con el balance
coste‐beneficio (en términos de carbono para la planta) del
mantenimientodelasimbiosis.
8. Elefecto tantode laregiónbioclimáticadeorigendelsuelo, como
de la matriz agrícola, predominó sobre las posibles diferencias
derivadas de la procedencia de las encinas esto indica que para
comprender la respuesta de los ecosistemas al cambio climático
posiblemente sea más importante analizar la influencia de estos
factores que la capacidad de adaptación y diferenciación
poblacional de ciertas especies de plantas a las condiciones de
sequía.
9. Lafragmentacióndelencinarpodríamodularlarespuestafuncional
de los microorganismos a la sequía como resultado de su efecto
sobre el incrementode la capacidad de retenciónde agua y de la
fertilidaddelossuelos, incrementandoasuvezladiversidadlocal
delascomunidadesmicrobianas.Sinembargo,quedaporentender
cómoelempobrecimientodelascomunidadesmicrobianasaescala
de paisaje y asociado con la fragmentación, afecta al
funcionamiento del sistema planta‐suelo‐microorganismo y a su
respuestaalasequía.

DISCUSIÓNGENERAL
232
Conclusions
1. Mediterranean holm oak forest fragmentation, measured as the
degreeofinfluenceoftheagriculturalmatrix,directlyandindirectly
impacted the plant‐soil‐microbial system causing significant
alterations.
2. Treesgrewbiggerinmediumandhighagriculturalmatrixinfluence
(i.e.forestedgeandsmallfragments)resultingintheaccumulation
ofmoreorganicmatterinsoils.Thishigherlevelsoforganicmatter
induced changes in the abiotic (microclimate and pH) and biotic
(microbial biomass) edaphic conditions, stimulating themicrobial
activityandconsequentlythefunctioningofthesoil‐system.
3. Soil fertility was directly enhanced by the influence of the
agricultural matrix, which in turn affected the composition and
local diversity (alpha‐diversity) of microbial communities; at the
same time, the structure of these communities was positively
relatedwiththeirabilitytometabolizedifferentcarbonsources.
4. Holm oak forest fragmentation negatively affected the structure
andmetabolismofmicrobialcommunitiesatlandscapescale(beta‐
diversity),withpotentialnegativeconsequencesontheresponseof
thesesoilstoclimatechangerelatedconstraints.
5. The forecasteddrought increase in theMediterraneanbasincould
have an impact on the relative proportions of soil microbial
communities, favoring fungal‐dominated soil communities,
probablyleadingtoadecelerationofmetabolicsoilrates.
6. Historic adaptation of microbial communities to drought was
relatedwiththebioclimaticregionofsoils,whichcouldhavemajor
effects on the resistence/resilience abilities of microbial
communitiestoincreaseddrought.

CAPÍTULO6
233
7. Micorrizationimprovedseedingdevelopment,butitwasassociated
withanegativeresponseofthewholeplant‐soilsystemtodrought,
probablyrelatedwith thehighcost‐benefitcarbonbalance for the
planttomaintainthesymbiosis.
8. Theeffectofboththebioclimaticregionofsoilsandtheagricultural
matrix influence overshadowed possible differences arising from
theprovenanceofseedlings,indicatingtheimportanceofanalyzing
these factors over those related with adaptation capacity and
population differentiation of plants to drought for understanding
theresponsetoclimatechangeattheecosystemlevel.
9. Holm oak forest fragmentation could modulate the functional
responseofmicroorganisms todrought,asaresultof the induced
increment in thewater holding capacity and fertility of soils, and
the enhancement of local diversity of microbial communities.
However,it isstillunknownhowtheimpoverishmentofmicrobial
communities at the landscape scale associated with forest
fragmentation,willaffectthefunctioningoftheplant‐soil‐microbial
systemanditsresponsetodrought.

REFERENCIAS
234
Referencias
Andivia, E., M. Fernández, J. Vázquez‐Piqué y R. Alejano (2012). Twoprovenances of Quercus ilex ssp. ballota (Desf) Samp. nurseryseedlings have different response to frost tolerance and autumnfertilization. European Journal of Forest Research, 131(4): 1091‐1101.
Aponte,C.,L.V.García,I.M.Pérez‐Ramos,E.GutiérrezyT.Marañón(2011).Oak trees and soil interactions inMediterranean forests: a positivefeedbackmodel.JournalofVegetationScience,22(5):856‐867.
Baldrian, P. (2014). Distribution of extracellular enzymes in soils: spatialheterogeneityanddeterminingfactorsatvariousscales.SoilScienceSocietyofAmericaJournal,78(1):11‐18.
Barba, J., J. Curiel Yuste, J. Martínez‐Vilalta y F. Lloret (2013). Drought‐inducedtreespeciesreplacementisreflectedinthespatialvariabilityof soil respiration in amixedMediterranean forest. Forest EcologyandManagement,306(0):79‐87.
Barnard, R. L., C. A. Osborne yM. K. Firestone (2013). Responses of soilbacterial and fungal communities to extreme desiccation andrewetting.ISMEJ,7(11):2229‐2241.
Barnard, R. L., C. A. Osborne yM. K. Firestone (2013). Responses of soilbacterial and fungal communities to extreme desiccation andrewetting. The ISME Journal: Multidisciplinary Journal of MicrobialEcology,7(11):2229‐2241.
Barnard, R. L., C. A. Osborne y M. K. Firestone (2015). Changingprecipitation pattern alters soil microbial community response towet‐upunderaMediterranean‐typeclimate.ISMEJ,9(4):946‐957.
Belsky,A.J.yC.D.Canham(1994).Forestgapsandisolatedsavannatrees.BioScience,44(2):77‐84.
Bell,T.,J.A.Newman,B.W.Silverman,S.L.TurneryA.K.Lilley(2005).Thecontribution of species richness and composition to bacterialservices.Nature,436(7054):1157‐1160.
Boer,W.d.,L.B.Folman,R.C.SummerbellyL.Boddy (2005).Living inafungal world: impact of fungi on soil bacterial niche development.FEMSMicrobiologyReviews,29(4):795‐811.
Boix‐Fayos, C., A. Calvo‐Cases, A. C. Imeson y M. D. Soriano‐Soto (2001).Influence of soil properties on the aggregation of someMediterranean soils and the use of aggregate size and stability aslanddegradationindicators.CATENA,44(1):47‐67.
Boutin,C.yB.t.Jobin(1998).Intensityofagriculturalpracticesandeffectsonadjacenthabitats.EcologicalApplications,8(2):544‐557.
Bowen,J.L.,B.B.Ward,H.G.Morrison,J.E.Hobbie,I.Valiela,L.A.DeeganyM. L. Sogin (2011).Microbial community composition in sediments

CAPÍTULO6
235
resistsperturbationbynutrientenrichment.TheISMEJournal,5(9):1540‐1548.
Burns,R.G.,J.L.DeForest,J.Marxsen,R.L.Sinsabaugh,M.E.Stromberger,M.D.Wallenstein,M.N.WeintraubyA.Zoppini(2013).Soilenzymesinachangingenvironment:currentknowledgeandfuturedirections.SoilBiologyandBiochemistry,58:216‐234.
Cruz‐Martinez,K.,K.B.Suttle,E.L.Brodie,M.E.Power,G.L.AndersenyJ.F.Banfield (2009). Despite strong seasonal responses, soil microbialconsortia are more resilient to long‐term changes in rainfall thanoverlyinggrassland.ISMEJ,3(6):738‐744.
CurielYuste, J.,D.D.Baldocchi,A.Gershenson,A.Goldstein,L.MissonyS.Wong (2007). Microbial soil respiration and its dependency oncarboninputs,soiltemperatureandmoisture.GlobalChangeBiology,13(9):2018‐2035.
CurielYuste, J.,A. J.Fernandez‐Gonzalez,M.Fernandez‐Lopez,R.Ogaya, J.Penuelas, J.SardansyF.Lloret(2014).Strong functionalstabilityofsoilmicrobialcommunitiesundersemiaridMediterraneanconditionsand subjected to long‐term shifts in baseline precipitation. SoilBiologyandBiochemistry,69(0):223‐233.
CurielYuste, J.,A. J.Fernandez‐Gonzalez,M.Fernandez‐Lopez,R.Ogaya, J.Peñuelas y F. Lloret (2014). Functional diversification withinbacterial lineages promotes wide functional overlapping betweentaxonomicgroupsinaMediterraneanforestsoil.FEMSMicrobiologyEcology,90(1):54‐67.
CurielYuste,J., J.Peñuelas,M.Estiarte,J.Garcia‐Mas,S.Mattana,R.Ogaya,M. Pujol y J. Sardans (2011). Drought‐resistant fungi control soilorganic matter decomposition and its response to temperature.GlobalChangeBiology,17(3):1475‐1486.
Dakora, F. y D. Phillips (2002). Root exudates as mediators of mineralacquisitioninlow‐nutrientenvironments.PlantandSoil,245(1):35‐47.
Drenovsky,R.E.,D.Vo,K.J.GrahamyK.M.Scow(2004).Soilwatercontentand organic carbon availability are major determinants of soilmicrobial community composition. Microbial Ecology, 48(3): 424‐430.
Evans, S. E. y M. D.Wallenstein (2014). Climate change alters ecologicalstrategiesofsoilbacteria.EcologyLetters,17(2):155‐164.
Faget, M., S. Blossfeld, P. Von Gillhaußen, U. Schurr y V. M. Temperton(2013).Disentanglingwhoiswhoduringrhizosphereacidificationinroot interactions: combining fluorescence with optode techniques.FrontiersinPlantScience,4.

REFERENCIAS
236
Fierer, N. y R. B. Jackson (2006). The diversity and biogeography of soilbacterial communities. Proceedings of the National Academy ofSciences,USA,103(3):626‐631.
Franzluebbers,A.J.(2002).Waterinfiltrationandsoilstructurerelatedtoorganic matter and its stratification with depth. Soil and TillageResearch,66(2):197‐205.
Fuchslueger, L., M. Bahn, K. Fritz, R. Hasibeder y A. Richter (2014).Experimental drought reduces the transfer of recently fixed plantcarbon to soil microbes and alters the bacterial communitycomposition in amountainmeadow.NewPhytologist, 201(3): 916‐927.
Gratani, L. (1995). Structural and ecophysiological plasticity of someevergreen species of the Mediterranean maquis in response toclimate.Photosynthetica,31:335‐343.
Gratani,L.,M.Meneghini,P.PesoliyM.F.Crescente(2003).StructuralandfunctionalplasticityofQuercusilexseedlingsofdifferentprovenancesinItaly.Trees,17(6):515‐521.
Griffiths,B.S.,K.Ritz,R.D.Bardgett,R.Cook,S.Christensen,F.Ekelund,S.J.Sørensen,E.Bååth,J.Bloem,P.C.DeRuiter,J.DolfingyB.Nicolardot(2000). Ecosystem response of pasture soil communities tofumigation‐inducedmicrobialdiversityreductions:anexaminationofthebiodiversity–ecosystemfunctionrelationship.Oikos,90(2):279‐294.
Grigulis, K., S. Lavorel, U. Krainer, N. Legay, C. Baxendale, M. Dumont, E.Kastl, C.Arnoldi,R.D.Bardgett, F.Poly,T.Pommier,M. Schloter,U.Tappeiner,M.Bahny J.‐C.Clément(2013).Relativecontributionsofplant traits and soil microbial properties to mountain grasslandecosystemservices.JournalofEcology,101(1):47‐57.
Hastwell, G. T. y E. C. Morris (2013). Structural features of fragmentedwoodland communities affect leaf litter decomposition rates. BasicandAppliedEcology,14(4):298‐308.
Jones,S.E.yJ.T.Lennon(2010).Dormancycontributestothemaintenanceof microbial diversity. Proceedings of the National Academy ofSciences,107(13):5881‐5886.
Kuzyakov,Y.(2010).Primingeffects:Interactionsbetweenlivinganddeadorganicmatter.SoilBiologyandBiochemistry,42(9):1363‐1371.
Langenheder, S., M. T. Bulling, M. Solan y J. I. Prosser (2010). Bacterialbiodiversity‐ecosystem functioning relations are modified byenvironmentalcomplexity.PLoSONE,5(5):e10834.
Lázaro‐Nogal, A., S. Matesanz, T. Gimeno, A. Escudero y F. Valladares(2012). Fragmentation modulates the strong impact of habitatqualityandplantcoveronfertilityandmicrobialactivityofsemiaridgypsumsoils.PlantandSoil,358(1‐2):213‐223.

CAPÍTULO6
237
Legay, N., C. Baxendale, K. Grigulis, U. Krainer, E. Kastl,M. Schloter, R. D.Bardgett, C. Arnoldi,M. Bahn,M. Dumont, F. Poly, T. Pommier, J. C.Clément y S. Lavorel (2014). Contribution of above‐ and below‐ground plant traits to the structure and function of grassland soilmicrobialcommunities.AnnalsofBotany.
Levine, U. Y., T. K. Teal, G. P. Robertson y T. M. Schmidt (2011).Agriculture's impact onmicrobial diversity and associated fluxes ofcarbondioxideandmethane.ISMEJ,5(10):1683‐1691.
Matías,L.,J.CastroyR.Zamora(2012).Effectofsimulatedclimatechangeon soil respiration in aMediterranean‐type ecosystem: rainfall andhabitattypearemoreimportantthantemperatureorthesoilcarbonpool.Ecosystems,15(2):299‐310.
Mendes,L.,S.Tsai,A.Navarrete,M.deHollander,J.vanVeenyE.Kuramae(2015). Soil‐Borne microbiome: linking diversity to function.MicrobialEcology:1‐11.
O'Donnell,A.,M.Seasman,A.Macrae,I.WaiteyJ.Davies(2001).Plantsandfertilisersasdriversofchangeinmicrobialcommunitystructureandfunctioninsoils.PlantandSoil,232(1‐2):135‐145.
Ogaya, R. y J. Peñuelas (2004). Phenological patterns of Quercus ilex,Phillyrea latifolia, and Arbutus unedo growing under fieldexperimentaldrought.Ecoscience11:263‐270.
Olden, J. D., N. LeRoy Poff, M. R. Douglas, M. E. Douglas y K. D. Fausch(2004). Ecological and evolutionary consequences of biotichomogenization.TrendsinEcology&Evolution,19(1):18‐24.
Pesoli, P., L.Gratani yW.Larcher (2003).ResponsesofQuercus ilex fromdifferent provenances to experimentally imposed water stress.BiologiaPlantarum,46(4):577‐581.
Placella,S.A.,E.L.BrodieyM.K.Firestone(2012).Rainfall‐inducedcarbondioxide pulses result from sequential resuscitation ofphylogenetically clustered microbial groups. Proceedings of theNationalAcademyofSciences,USA,109(27):10931‐10936.
Ramirez,K.S.,J.M.CraineyN.Fierer(2012).Consistenteffectsofnitrogenamendments on soil microbial communities and processes acrossbiomes.GlobalChangeBiology,18(6):1918‐1927.
Rey, A. y P. Jarvis (2006).Modelling the effect of temperature on carbonmineralization rates across a network of European forest sites(FORCAST).GlobalChangeBiology,12(10):1894‐1908.
Rincón,A.,M.R.FelipeyM.Fernández‐Pascual(2007).InoculationofPinushalepensis Mill. with selected ectomycorrhizal fungi improvesseedlingestablishment2yearsafterplanting inadegradedgypsumsoil.Mycorrhiza,18(1):23‐32.

REFERENCIAS
238
Rincón, A., B. P. Santamaría, L. Ocaña y M. Verdú (2014). Structure andphylogenetic diversity of post‐fire ectomycorrhizal communities ofmaritimepine.Mycorrhiza,24(2):131‐141.
Riutta,T.,E.M.Slade,D.P.Bebber,M.E.Taylor,Y.Malhi,P.Riordan,D.W.MacdonaldyM.D.Morecroft (2012).Experimentalevidence for theinteracting effects of forest edge, moisture and soil macrofauna onleaf litterdecomposition.SoilBiologyandBiochemistry,49(0):124‐131.
Santos,T.yJ.L.Tellería(1998).Efectosdelafragmentacióndelosbosquessobre los vertebrados de las mesetas ibéricas. Madrid, Spain,OrganismoAutónomo"ParquesNacionales".
Sardans,J.yJ.Peñuelas(2005).DroughtdecreasessoilenzymeactivityinaMediterraneanQuercus ilexL. forest. SoilBiologyandBiochemistry,37(3):455‐461.
Sinsabaugh,R.L.,C.L.Lauber,M.N.Weintraub,B.Ahmed,S.D.Allison,C.Crenshaw,A.R.Contosta,D.Cusack,S.Frey,M.E.Gallo,T.B.Gartner,S. E. Hobbie, K. Holland, B. L. Keeler, J. S. Powers, M. Stursova, C.Takacs‐Vesbach,M. P.Waldrop,M.D.Wallenstein,D. R. Zak y L.H.Zeglin (2008). Stoichiometry of soil enzyme activity at global scale.EcologyLetters,11(11):1252‐1264.
Smith,S.E.yD.J.Read(2010).MycorrhizalSymbiosis,ElsevierScience.Tardy, V., O. Mathieu, J. Lévêque, S. Terrat, A. Chabbi, P. Lemanceau, L.
RanjardyP.‐A.Maron(2014).Stabilityofsoilmicrobialstructureandactivitydependsonmicrobialdiversity.EnvironmentalMicrobiologyReports,6(2):173‐183.
Wardle,D.A.(1998).Controlsoftemporalvariabilityofthesoilmicrobialbiomass: A global‐scale synthesis. Soil Biology and Biochemistry,30(13):1627‐1637.
Zornoza,R.,C.Guerrero,J.Mataix‐Solera,V.Arcenegui,F.García‐OrenesyJ.Mataix‐Beneyto (2006). Assessing air‐drying and rewetting pre‐treatmenteffectonsomesoilenzymeactivitiesunderMediterraneanconditions.SoilBiologyandBiochemistry,38(8):2125‐2134.

AGRADECIMIENTOS
239
Agradecimientos
Este proyecto, ahora materializado, fue posible gracias a mis directores,
que sin planearlo se complementaron y nos fuimos llenando de
interacciones cada vezmás ricas, complejas y divertidas.Muchas gracias
AnaRincón,portuempuje,dedicaciónycalidadhumana,eresunejemploa
seguir en todos los sentidos.Muchas gracias a Jorge Curiel por estar tan
comprometidoeneldesarrollodeestatesis,portuhonestidadypordarme
ese empujón que siempre hace falta. Y muchas gracias a Fernando
Valladarespordejarmeentraraestegrupoyconsolidarestasinteracciones
sinlascualesmitiempoenEspañanohubieseexistido.Seguimos.
Agradezcoelapoyotécnicocercanoe imprescindibledeLolaLópez,tanto
en el laboratorio, como en el invernadero; de Miguel Fernández
ayudándomeenelcampoyenelinvernadero;deDavidLópezencualquier
problema técnicoque surgiese.Ademásagradezco infinitamenteel apoyo
enelaprendizajedetécnicasdeJuanCarlosGarcíaGil,FrancisQ.Brearley,
DadidElliot,Asunciónde losRíos yOscarPérez‐Priego; y aAnaHereş, y
LauraBarriosporsuapoyoconlosanálisisestadísticos.
Ademáshecontadoconlavaliosaayudadeestudiantesdegradoymaster,
nacionalesyextranjeros,a loquemegustaríaagradecer:AliciadeGracia,
Abby Dolinger, Brian Crooks, Jenna Mitchell, Emily Bachner, Macarena
Pingarron,IoannaBoudouris.
Alosgruposdeecologíamediterráneaeinteraccionesbeneficiosasconlos
que ha sido un placer compartir estos años: Silvia Matesanz, Teresa
Gimeno, Elena Granda, Ana Lázaro, Raquel Benavides, Elena Beamonte,
Lars Markesteijn, Elena Concepción, Sonia Rabasa, María Almagro; los
pasajeros, Inés Carrascón, Mario Zabal, Jerônimo Boelsums, Alice Godoy,
Sara Villén, Fernando Silveira, Juan Mentruyt, Beatriz Salgado, Natalia
Ricote; y los que me soportaron hasta el final de este proceso, Cristina
Crespo,AlexandraRodríguez, JorgeDurán, Leticia Pérez,MarioDíaz, Ana
Rey.

AGRADECIMIENTOS
240
Casiporúltimo,peronomenos importante,un agradecimientoenorme a
dospersonasconlasquehetrabajadodemaneramáscercana,conlasque
he compartido tantas y tantas horas de trabajo, emociones, altibajos, etc.
Unaschicasmaravillosasyúnicascomodoscoposdenieve,muchasgracias
AliciaForneryTeresaMorán.ATerepor todoel tiempocompartido,por
estarsiempreresolviéndomemisdudas,portupacienciaytutiempo,eres
de primera, sigue incrementando tu currículum, sobretodo la parte más
importanteypor laquesete iluminalamirada, ladanza.AAliciaporser
comoeres,unapersonamuynoblequelodatodosinpedirnada,asísete
quierenuncacambies.
Ymásqueunagradecimiento,unreconocimientoami familiaenextenso
porapoyarmeyporsupacienciaapesardeladistancia;porfindevueltaa
casa. Mi padre siempre dice que lo mejor hasta el final, así que no es
necesariodecirquiénsinosolodecirgraciasalapersonaquemeempujóa
comenzaréstaaventura,lamásllenadeemociones,detodotipo,quenunca
haya tenido, que llena mi vida cada día y que me ha ayudado siempre.
Gracias.
Yehuanuiuitlahtokuitlaxokomeh,tlakotonahtomakuayomeh,
thachichinoahtokuautopomeh,auamouelitihtemiktiatonelhuayomeh.


Efectos de la fragmentación del encinar en las interacciones
planta-suelo-microorganismos
Effects of forest fragmentation on the
plant-soil-microbial interactions
Dulce Yaahid Flores RenteríaTesis Doctoral
SynopsisThe ecological consequences of habitat fragmentation on soil functioning largely depend on the
influence of the plants that triggers a cascade of causal-effect relations that stimulates soil microbial activity. The negative effects of drought on the fragmented holm oaks forest could be
ameliorated by the increased fertility and water holding capacity of soils on the small fragments, especially in soils with historic adaptation to drought.
SinopsisLas consecuencias ecológicas de la fragmentación del hábitat sobre el funcionamiento del suelo dependen en gran medida de la influencia de las plantas que desencadenan una cascada de relaciones causa-efecto que estimula la actividad microbiana del suelo. Los efectos negativos de la sequía en los encinares fragmentados podrían ser modulados por el aumento de la capacidad de retención de agua y la fertilidad de los suelos en los fragmentos pequeños, especialmente en suelos con adaptación histórica a la sequía.