Nieuwsbrief creative counseling sjoukje drenth bruintjes juli 2014

1
The Current State of Cross-border E-commerce in Europe
The first preliminary results
Dr. Jesse Weltevreden, Sjoukje Goldman MSc, Julia Keuter BA

2 2 _________________________________________________ Source: Blendle
3 3
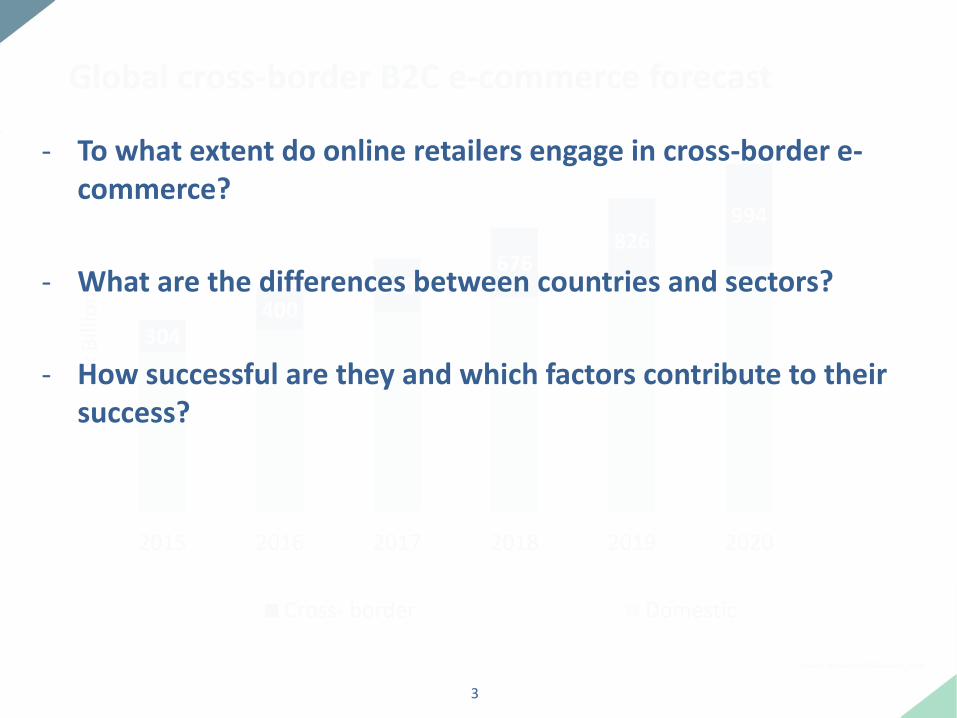
304 400
530 676
826 994
2015 2016 2017 2018 2019 2020
x B
illio
n $
Cross- border Domestic
Global cross-border B2C e-commerce forecast
_________________________________________________ Source: Accenture/AliResearch, 2015
- To what extent do online retailers engage in cross-border e-commerce?
- What are the differences between countries and sectors?
- How successful are they and which factors contribute to their success?

4 4
Methodology

5 5

6 6
Study area: EU28 + Iceland, Norway & Switzerland
Research objects: Companies in b2c e-commerce Online shops selling products Online shops with headquarter in the study area X

7 7
Data collection
1. Web scraping to acquire lists of online shops per country: 67,500 online shops 2. Web visitor data from SimilarWeb to estimate the number of cross-border Web visitors per online shop 3. Content analysis among 10,000 online shops to determine their cross-border e-commerce strategy (double blind coding by 75 student assistants, all native speakers) 4. Online survey among the 10,000 online shops to determine their cross-border e-commerce success (to be started in September 2016)

8 8
What we will NOT present today but also know….
• Use of payment methods (+/- 600) • Use of trust marks (+/- 100) • Use of carriers • Cross-border e-commerce localization strategies • Contact channels • Legal information • Results per sector • And more….

9 9
Cross-border Web visitors

10 10
0%
20%
40%
60%
80%
100%
100% 80% 60% 40% 20% 0%
Cu
mu
lati
ve n
um
ber
of
on
line
sho
ps
(in
%)
Share of domestic Web visitors per online shop (in %)
Number of online shops in Europe according to share of domestic Web visitors*
40% has less than 15% cross-border Web visitors
_________________________________________________ Source: Amsterdam University of Applied Sciences, based on SimilarWeb data
70% has less than 30% cross-border Web visitors
_________________________________________________ * Figures (EU28 + Iceland, Norway & Switzerland) are weighted by the size of national e-commerce markets (based on 2014 figures of E-commerce Europe) (N=67,372 online shops).

11 11
Average share of cross-border Web visitors per country (in %)
Less than 10 percent
10 to 15 percent
15 to 20 percent
20 to 30 percent
30 percent or more
_________________________________________________ Figures (EU28 + Iceland, Norway & Switzerland) are weighted by the size of national e-commerce markets (based on 2014 figures of E-commerce Europe) and individual country figures by the weighted average distribution of Web visitor size classes of online shops in the 31 European countries (N=67,372 online shops).
_________________________________________________ Source: Amsterdam University of Applied Sciences, based on SimilarWeb data
6%
13%
21%
40%
0% 25% 50%
Greece
Finland
Hungary
Bulgaria
Poland
Czech Republic
Italy
Slovenia
Norway
Romania
Denmark
Sweden
Netherlands
Slovakia
Iceland
Lithuania
Latvia
France
Croatia
Portugal
Estonia
Spain
Germany
Malta
Switzerland
Belgium
Cyprus
Ireland
United Kingdom
Austria
Luxembourg
European average: 23,6%

12 12
Average share of Web visitors per country of origin for online shops in Croatia*
_________________________________________________ * Figures are weighted by the weighted average distribution of Web visitor size classes of online shops in the 31 European countries Weighted figures (N=370 online shops).
_________________________________________________ Source: Amsterdam University of Applied Sciences, based on SimilarWeb data
13 13
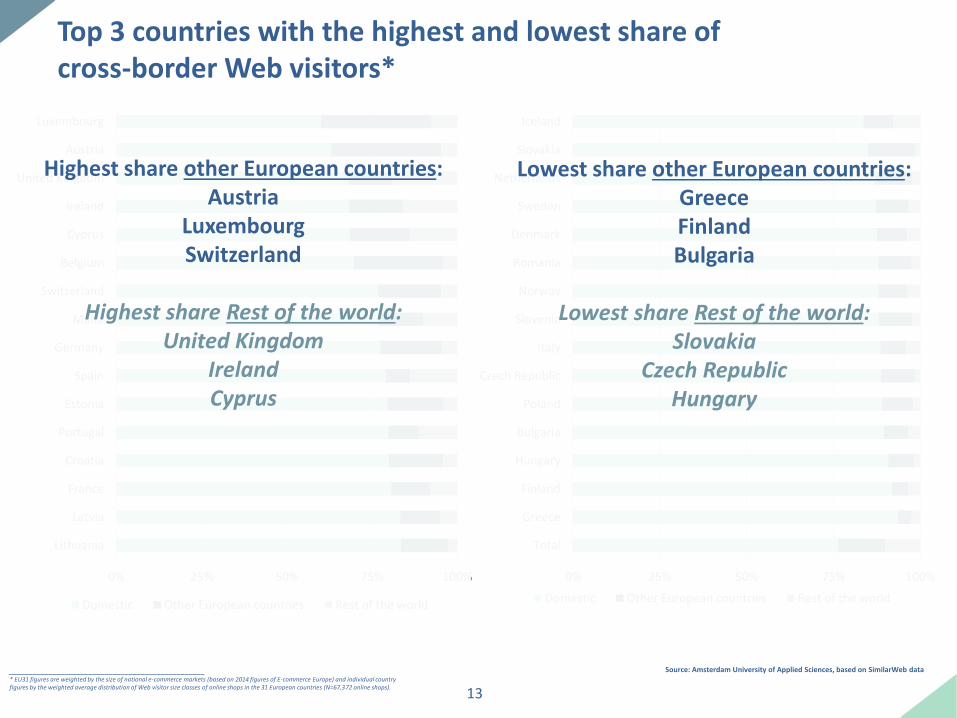
Top 3 countries with the highest and lowest share of cross-border Web visitors*
_________________________________________________ Source: Amsterdam University of Applied Sciences, based on SimilarWeb data _________________________________________________
* EU31 figures are weighted by the size of national e-commerce markets (based on 2014 figures of E-commerce Europe) and individual country figures by the weighted average distribution of Web visitor size classes of online shops in the 31 European countries (N=67,372 online shops).
0% 25% 50% 75% 100%
Total
Greece
Finland
Hungary
Bulgaria
Poland
Czech Republic
Italy
Slovenia
Norway
Romania
Denmark
Sweden
Netherlands
Slovakia
Iceland
Domestic Other European countries Rest of the world
0% 25% 50% 75% 100%
Lithuania
Latvia
France
Croatia
Portugal
Estonia
Spain
Germany
Malta
Switzerland
Belgium
Cyprus
Ireland
United Kingdom
Austria
Luxembourg
Domestic Other European countries Rest of the world
Highest share other European countries:
Austria Luxembourg Switzerland
Highest share Rest of the world:
United Kingdom Ireland Cyprus
Lowest share other European countries:
Greece Finland Bulgaria
Lowest share Rest of the world:
Slovakia Czech Republic
Hungary

14 14
Relationship between cross-border Web visitors of online shops and cross-border buyers per country
_________________________________________________ Source: Amsterdam University of Applied Sciences, based on data from
SimilarWeb and Eurostat
_________________________________________________ Individual country figures are weighted by the weighted average distribution of Web visitor size classes of online shops in the 31 European countries (N=67,372 online shops).
Poland
Romania Iceland
Estonia
Spain
Cyprus Austria
Luxembourg
0%
25%
50%
75%
0% 25% 50% 75%
Percentage of cross - border buyers per country
Shar
e o
f cr
oss
-bo
rder
Web
vis
ito
rs p
er c
ou
ntr
y
In countries with a high share of cross-border buyers online shops also have relatively many
cross-border Web visitors.

15 15
Cross-border Strategy
16 16
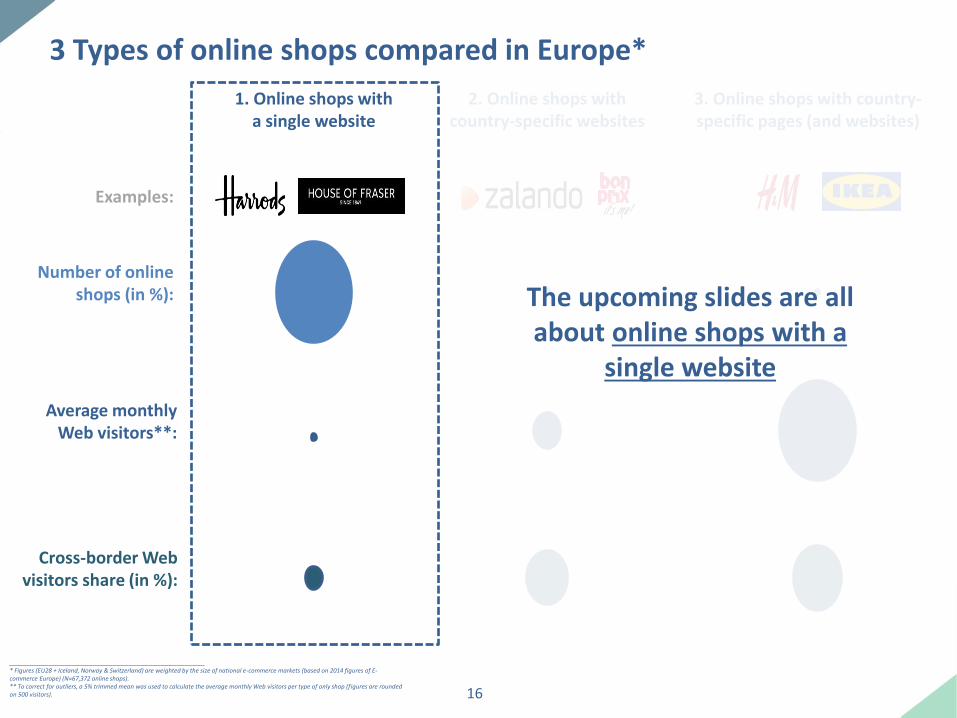
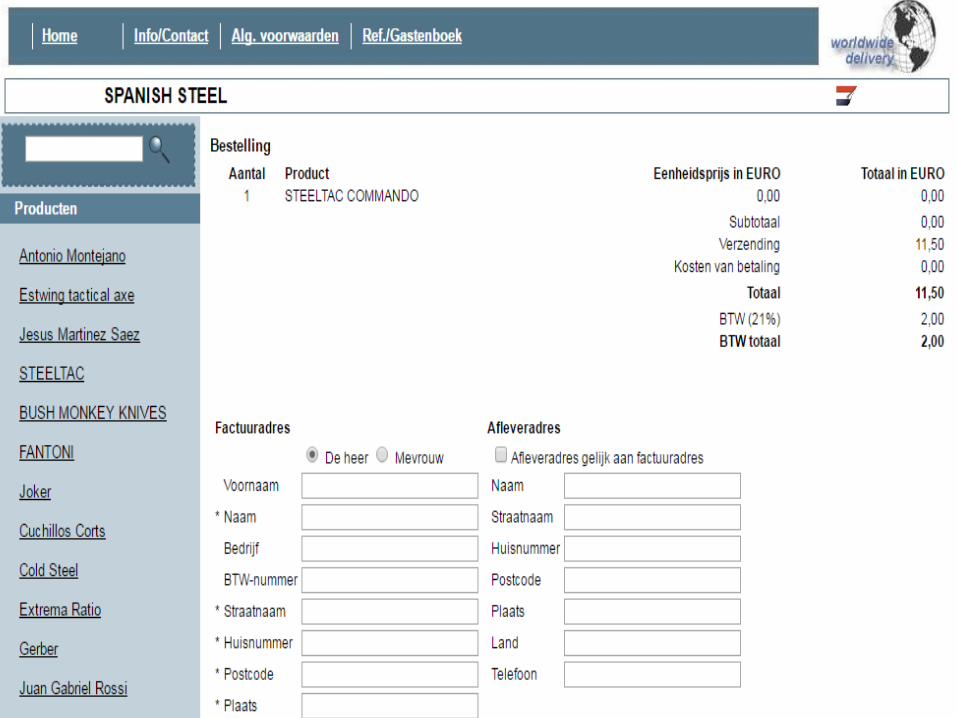
3 Types of online shops compared in Europe*
1. Online shops with a single website
2. Online shops with country-specific websites
3. Online shops with country-specific pages (and websites)
Examples:
Number of online shops (in %):
Average monthly Web visitors**:
Cross-border Web visitors share (in %):
97% 2,3% 0,5%
64%
268,500 12,500
54% 23%
838,500
_________________________________________________ * Figures (EU28 + Iceland, Norway & Switzerland) are weighted by the size of national e-commerce markets (based on 2014 figures of E-commerce Europe) (N=67,372 online shops). ** To correct for outliers, a 5% trimmed mean was used to calculate the average monthly Web visitors per type of only shop (figures are rounded on 500 visitors).
The upcoming slides are all about online shops with a
single website

17 17
Average share of online shops* with direct international ordering (per country**)
Less than 15 percent
15 to 30 percent
30 to 50 percent
50 to 70 percent
70 percent or more
_________________________________________________ * Figures only include online shops with a single website. ** Figures (EU28 + Iceland, Norway & Switzerland) are weighted by the size of national e-commerce markets (based on 2014 figures of E-commerce Europe) and individual country figures by the weighted average distribution of Web visitor size classes of online shops in the 31 European countries (N=8,570 online shops).
_________________________________________________ Source: Amsterdam University of Applied Sciences
European averages: Purely domestic shipment: 35% International shipment after contact by e-mail or phone: 5%
1%
44%
9%
46% Deliver world wide
Deliver only to countries in Europe
Deliver to countries in and outside Europe (but not world wide)
Deliver only to countries outside Europe
Direct international ordering: 60%
18 18
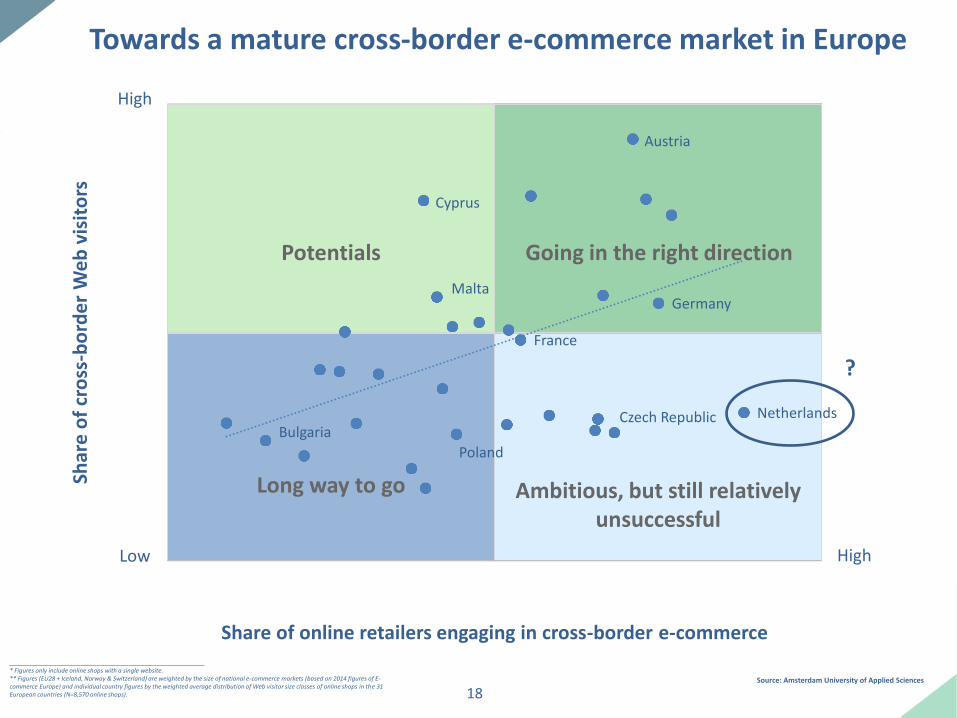
Towards a mature cross-border e-commerce market in Europe
Long way to go Ambitious, but still relatively unsuccessful
Potentials Going in the right direction
Share of online retailers engaging in cross-border e-commerce
Shar
e o
f cr
oss
-bo
rde
r W
eb
vis
ito
rs
High
Low High
Bulgaria
Poland
Czech Republic Netherlands
France
Germany Malta
Cyprus
Austria
0% 50% 100%
Shar
e o
f cr
oss
-bo
rder
Web
vis
ito
rs
Share of online retailers engaging in cross-border e-commerce
?
_________________________________________________ * Figures only include online shops with a single website. ** Figures (EU28 + Iceland, Norway & Switzerland) are weighted by the size of national e-commerce markets (based on 2014 figures of E-commerce Europe) and individual country figures by the weighted average distribution of Web visitor size classes of online shops in the 31 European countries (N=8,570 online shops).
_________________________________________________ Source: Amsterdam University of Applied Sciences
19 19

20 20
Success factors for online shops with a single website
Having (international) trust marks has no significant impact on the cross-border Web visitors share
Offering international delivery and particularly delivery both in and outside Europe has a significant impact on the cross-border Web visitor share
Offering language translation has a significant impact on the cross-border Web visitor share
Offering a currency switch has a significant impact on the cross-border Web visitor share
_________________________________________________ * Figures only include online shops with a single website. ** Figures (EU28 + Iceland, Norway & Switzerland) are weighted by the size of national e-commerce markets (based on 2014 figures of E-commerce Europe) and individual country figures by the weighted average distribution of Web visitor size classes of online shops in the 31 European countries (N=8,570 online shops).
_________________________________________________ Source: Amsterdam University of Applied Sciences

21 21
Conclusions

22 22
There is much variation among countries in Europe with regard to cross-border activity and success Some countries are already moving in the right direction, but many still have a long way to go Developing a (highly localized) country-specific strategy is key in becoming successful in cross-border e-commerce Current (domestic) trust marks do not seem to boost cross-border traffic. Pressing need for a strong international trust mark?

23 23
Planning & Contact details
General report ready in September Country reports available upon request
Dr. Jesse Weltevreden Professor of E-business [email protected] +31 (0)6 10 15 32 68
Sjoukje Goldman MSc PhD Candidate [email protected] +31 (0)6 21 15 78 08
Julia Keuter BA Junior Researcher [email protected]
24
Thank you for your attention!