
Edwards FloTrac Sensor Edwards Vigileo Monitor€¦ · Supported by Edwards Lifesciences, LLC...
24
1 Performance Assessments of the Performance Assessments of the FloTrac Sensor and FloTrac Sensor and Vigileo Vigileo Monitor Monitor Edwards Edwards Edwards Edwards Edwards Edwards Edwards Edwards FloTrac FloTrac FloTrac FloTrac FloTrac FloTrac FloTrac FloTrac Sensor Sensor Sensor Sensor Sensor Sensor Sensor Sensor & & & & & & & & Edwards Edwards Edwards Edwards Edwards Edwards Edwards Edwards Vigileo Vigileo Vigileo Vigileo Vigileo Vigileo Vigileo Vigileo Monitor Monitor Monitor Monitor Monitor Monitor Monitor Monitor
Transcript of Edwards FloTrac Sensor Edwards Vigileo Monitor€¦ · Supported by Edwards Lifesciences, LLC...

1
Performance Assessments of the Performance Assessments of the
FloTrac Sensor and FloTrac Sensor and VigileoVigileo MonitorMonitor
EdwardsEdwardsEdwardsEdwardsEdwardsEdwardsEdwardsEdwards FloTrac FloTrac FloTrac FloTrac FloTrac FloTrac FloTrac FloTrac SensorSensorSensorSensorSensorSensorSensorSensor
& & & & & & & &
EdwardsEdwardsEdwardsEdwardsEdwardsEdwardsEdwardsEdwards VigileoVigileoVigileoVigileoVigileoVigileoVigileoVigileo MonitorMonitorMonitorMonitorMonitorMonitorMonitorMonitor

2
Topics
• System Configuration
• Performance and Validation– Dr. William T. McGee, “Validation of a Continuous
Cardiac Output Measurement Using Arterial Pressure Waveforms”
– Dr. Gerard R. Manecke, “Cardiac Output Determination Using the Arterial Pulse Wave: A Comparison of a Novel Algorithm Against Continuous and Intermittent Thermodilution”
– Dr. Jeffrey L. Horswell, “Arterial Pressure-Based Method of Continuous Cardiac Output Monitoring Accurately Follows Trends in Cardiac Output During and After Surgery”
3
System Configuration
VigileoMonitor
PreSep Catheter(ScvO2)
Venous OximetryVenous Oximetry
CardiacCardiacOutputOutput
FloTrac Sensor(peripheral artery)
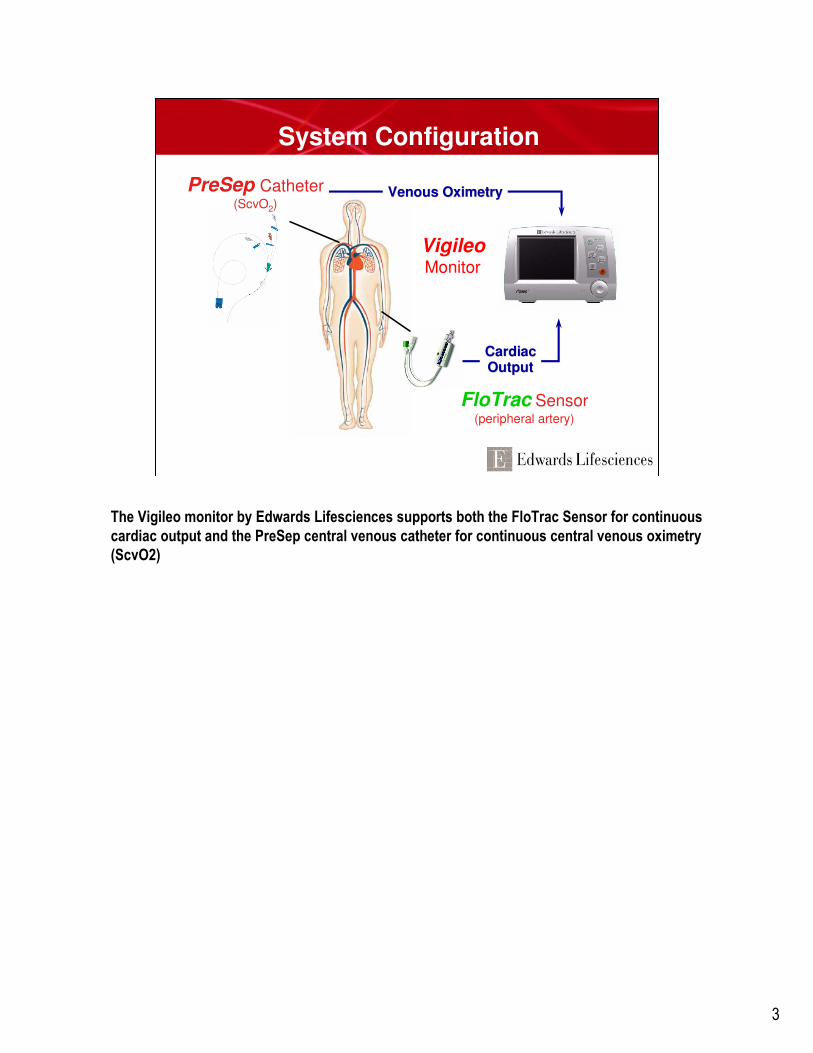
The Vigileo monitor by Edwards Lifesciences supports both the FloTrac Sensor for continuous
cardiac output and the PreSep central venous catheter for continuous central venous oximetry
(ScvO2)

4
Vigileo Monitor
• Continuously computes stroke volume from the patients arterial pressure signal
• Displays key hemodynamic parameters on a continuous basis (every 20 sec)
• Essentially NO calibration necessary– The user simply enters patient age, gender, height
and weight to initiate monitoring
– Advanced waveform analysis compensates for:
– Patient-to-patient differences in vasculature
– Real time changes in vascular tone
– Differing arterial sites
• Venous oximetry available when used with appropriate Edwards oximetry technology
The Vigileo monitor continuously displays and updates Continuous Cardiac Output, Cardiac
Index, Stroke Volume, Stroke Volume Index, Systemic Vascular Resistance*, Systemic
Vascular Resistance Index*, and Stroke Volume Variation every 20 seconds when used with
the FloTrac Sensor. DO2 and DO2I are also available for intermittent calculation.** These
parameters help guide the clinician in optimizing stroke volume through precision guided
management of preload, afterload, and contractility.
Vascular tone = vessel compliance and resistance
Vigileo then helps identify the adequacy of cardiac output by monitoring central venous
(ScvO2) or mixed venous (SvO2) oxygen saturation when used with Edwards venous Oximetry
technologies.
* These parameters require the CVP value to be slaved from bedside monitor for continuous
monitoring. SVR/SVRI can also be assessed on the Derived Value Calculator for intermittent
calculations using either slaved or manually entered MAP, CVP, and CO values.
**These parameters require the SpO2 and PaO2 values to be manually entered. If CO is being
continuously monitored, the calculator will default to the existing CO value. Otherwise, the
user may override the continuous value to manually enter CO.

5
FloTracFloTrac SensorSensor
The specially designed FloTrac sensor provides the high fidelity arterial pressure signal required by the Vigileo monitor to calculate the stroke volume.
The Vigileo monitor uses the patient’s arterial pressure waveform to continuously measure cardiac output. With inputs of height, weight, age and gender, patient-specific vascular
compliance is determined.
The FloTrac sensor measures the variations of the arterial pressure which is proportional to
stroke volume. Vascular compliance and changes in vascular resistance are internally
compensated for.
Cardiac output is displayed on a continuous basis by multiplying the pulse rate and calculated
stroke volume as determined from the pressure waveform.
The FloTrac sensor is easily setup and calibrated at the bedside using the
familiar skills used in pressure monitoring.

6
Performance

7
“Validation of a Continuous Cardiac Output Measurement Using Arterial
Pressure Waveform”
William T. McGee, MD, MHA, et al.
8
Validation of a Continuous Cardiac Output Measurement Using Arterial Pressure Waveforms
William T. McGee, MD, MHA, et al.
Methods
• APCO, ICO, CCO data collected from 84 patients
– (69 OR and in ICU, 15 ICU only)
– 2 US, 2 European centers
– Average age 67.7 (+/- 12.0) years, 65.5% male
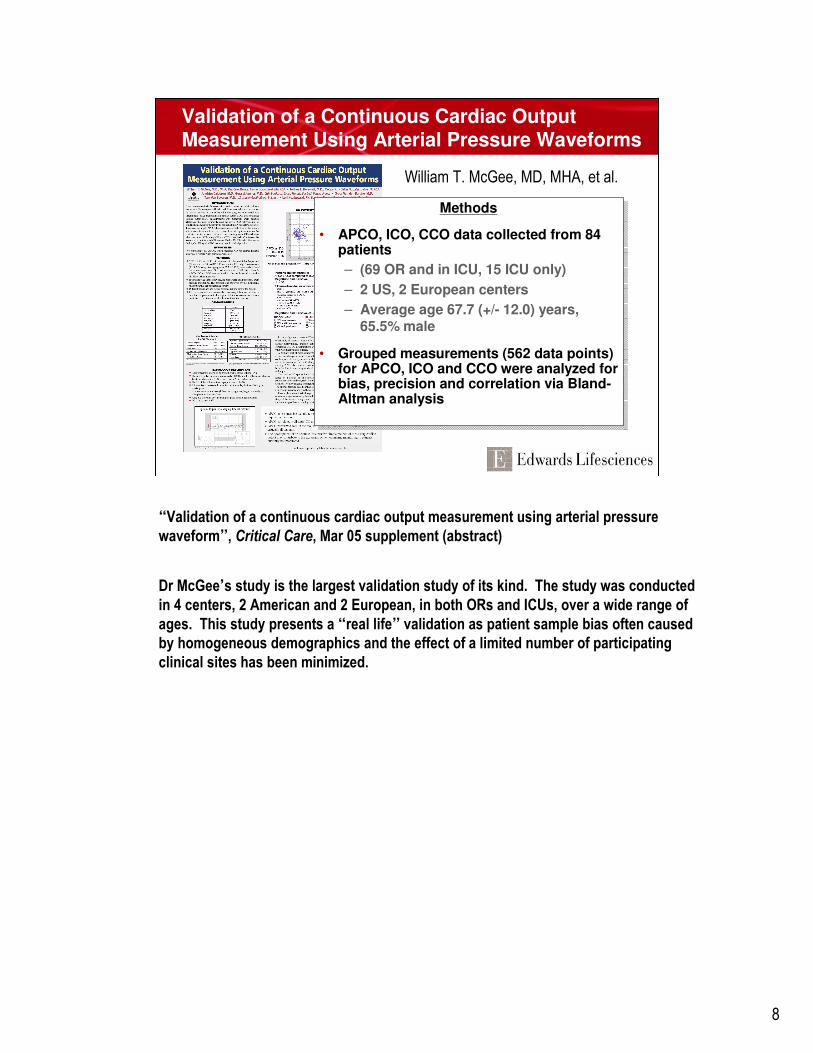
• Grouped measurements (562 data points) for APCO, ICO and CCO were analyzed for bias, precision and correlation via Bland-Altman analysis
Methods
• APCO, ICO, CCO data collected from 84 patients
– (69 OR and in ICU, 15 ICU only)
– 2 US, 2 European centers
– Average age 67.7 (+/- 12.0) years, 65.5% male
• Grouped measurements (562 data points) for APCO, ICO and CCO were analyzed for bias, precision and correlation via Bland-Altman analysis
“Validation of a continuous cardiac output measurement using arterial pressure waveform”, Critical Care, Mar 05 supplement (abstract)
Dr McGee’s study is the largest validation study of its kind. The study was conducted in 4 centers, 2 American and 2 European, in both ORs and ICUs, over a wide range of
ages. This study presents a “real life” validation as patient sample bias often caused by homogeneous demographics and the effect of a limited number of participating
clinical sites has been minimized.

9
Validation of a Continuous Cardiac Output Measurement Using Arterial Pressure Waveforms
William T. McGee, MD, MHA, et al.
A wide variety of patient demographics were included in this study with broad age and BSA
ranges.

10
Validation of a Continuous Cardiac Output Measurement Using Arterial Pressure Waveforms
William T. McGee, MD, MHA, et al.
All patients recruited had an existing PAC as required for their particular therapies. Many were
cardiac patients or had a history of cardiac disease. Important to note is the high prevalence
of arrhythmias in the patient sample, as many pulse contour or pulse power based devices
tend to have technical difficulties calculating CO through disrhythmias.
11
Validation of a Continuous Cardiac Output Measurement Using Arterial Pressure Waveforms
William T. McGee, MD, MHA, et al.
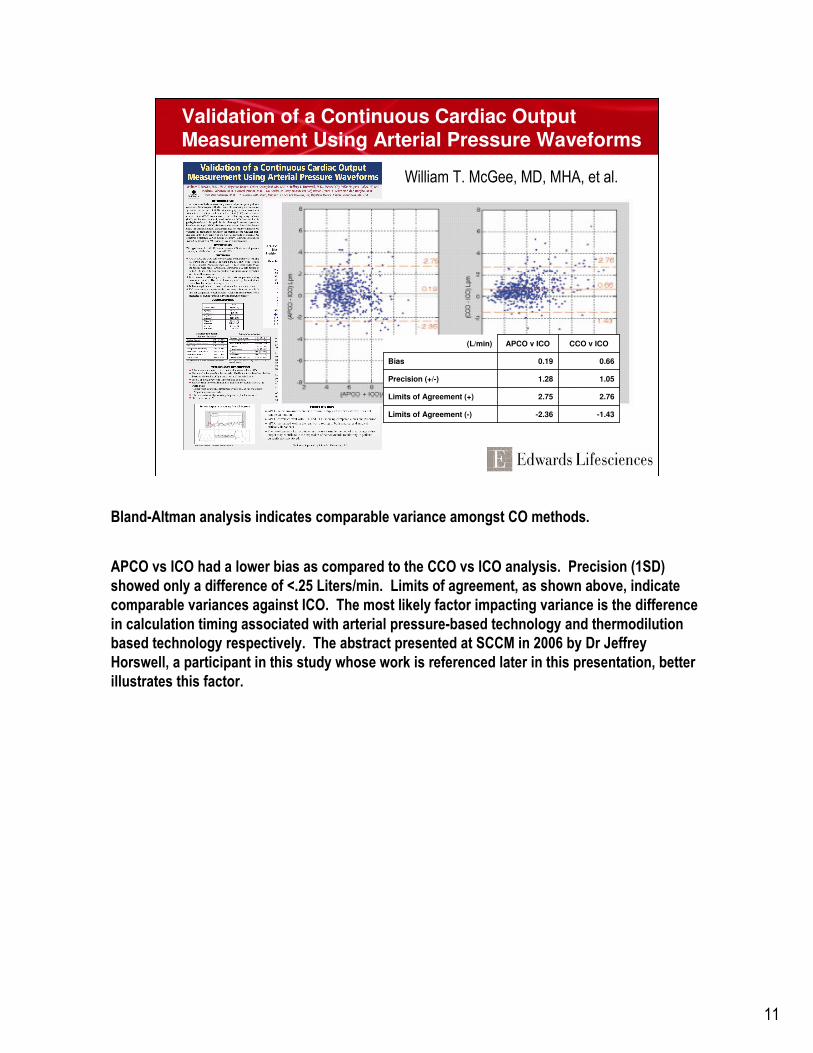
-1.43-2.36Limits of Agreement (-)
2.762.75Limits of Agreement (+)
1.051.28Precision (+/-)
0.660.19Bias
CCO v ICOAPCO v ICO(L/min)
Bland-Altman analysis indicates comparable variance amongst CO methods.
APCO vs ICO had a lower bias as compared to the CCO vs ICO analysis. Precision (1SD)
showed only a difference of <.25 Liters/min. Limits of agreement, as shown above, indicate
comparable variances against ICO. The most likely factor impacting variance is the difference
in calculation timing associated with arterial pressure-based technology and thermodilution
based technology respectively. The abstract presented at SCCM in 2006 by Dr Jeffrey
Horswell, a participant in this study whose work is referenced later in this presentation, better
illustrates this factor.

12
Validation of a Continuous Cardiac Output Measurement Using Arterial Pressure Waveforms
William T. McGee, MD, MHA, et al.
FloTrac, associated with APCO, is:
* Less invasive, requiring only an existing arterial catheter
* Correlates well with ICO and CCO
* Performs well in a real world setting
* Could be used to help monitor a population of patients who currently are not monitored with
a PAC but could benefit from its most basic parameters (i.e., CO, CI, SV, SVI, SVV)

13
“Cardiac Output Determination using
the Arterial Pulse Wave: A Comparison of a Novel Algorithm
Against Continuous and Intermittent Thermodilution”
Gerard Manecke, MD, et al.

14
Cardiac Output Determination using the Arterial Pulse Wave: A
Comparison of a Novel Algorithm Against Continuous and
Intermittent ThermodilutionGerard R. Manecke Jr., M.D., Mathew Peterson, M.D., William R. Auger, M.D.
UCSD Medical Center, San Diego, CA
Introduction
Assessment of cardiac output using the arterial pulse wave has been accomplished with varying success, usually requiring calibration
with another method(1). We tested a new algorithm based on arterial pulsatility that does not require such calibration. Comparisons
were made against standard thermodilution techniques using a pulmonary artery catheter.
Methods
In 11 cardiothoracic surgery patients (7 men and 4 women) cardiac output (CO) was monitored immediately after surgery. An arterial
pressure based algorithm calculated cardiac output from arterial pressure (APCO) in real time while a pulmonary artery (PA) catheter
(777HF8 CCO Catheter, Edwards Lifesciences, Irvine, California) was used to measure continuous (CCO) and intermittent bolus
thermodilution cardiac output (ICO). A laptop-based data acquisition system provided continuous calculation and storage of APCO, as well
as storage of the PA-based CO determinations. Each bolus cardiac output was calculated as the average of four measurements taken over
approximately 5 minutes. APCO values were determined by averaging the individual values (3 per minute) over a 5 minute interval
surrounding the time of bolus determination. CCO values were taken immediately prior to the bolus determinations, and represent a 5
minute average. Bland-Altman analysis, based on 65 comparison points, was used to determine bias and precision in the comparison of the
CO techniques.
Results
The CCO range was 2.77-9.60 L/min, with the mean being 6.02±1.58 L/min.
The mean bias between APCO and CCO was –0.38±0.83 L/min (figure 1),
and the mean bias between APCO and ICO was 0.04±0.99 L/min.
Conclusion
This APCO algorithm provides a reliable, minimally invasive method for
measuring CO that requires neither dilution nor CO reference for calibration.
It shows strong correlation and minimal bias with both traditional intermittent
bolus thermodilution and continuous cardiac output over a wide range of
values.
References
1. J Cardiothoracic Vasc Anesth 18:185-189, 2004
Bland-Altman plot. Mean = -0.38, 2SD = 1.28, -
2SD = -2.04
Supported by Edwards Lifesciences, LLC
Critical Care Medicine. 32(12) Supplement:A43, December 2004.
Dr Manecke’s study was the first FloTrac validation. Again, the comparison is with
thermodilution PAC but with a smaller more homogeneous patient population. The structure
of this study is more comparable to validation studies conducted for other devices as it is a
small, homogeneous sample in a single center.
In this study, the range of CCO data collected was between 2.77 L/min and 9.60 L/min.
Variance between APCO and CCO was analyzed, resulting with Limits of Agreement of 1.28
and -2.04. Precision between APCO:CCO and APCO:ICO are shown in the Results section,
indicating little difference in variance between the two data sets. Thus, “It (the study) shows
strong correlation and minimal bias with both traditional intermittent bolus thermodilution and
continuous cardiac output over a wide range of values (when compared with APCO).”

15
“Arterial Pressure-Based Method of Continuous Cardiac Output Monitoring Accurately Follows Trends in Cardiac
Output During and After Surgery”
Jeffrey L. Horswell, MD, et al.
16
Validation of a Continuous Cardiac Output Measurement Using Arterial Pressure Waveforms
Jeffrey L. Horswell, MD and Christina M. Worley, RN
Methods
• APCO, ICO, CCO data collected from 23 cardiovascular surgery patients
– Average age 63 (+/- 12.0) years, 65% male
– All ASA class III or IV
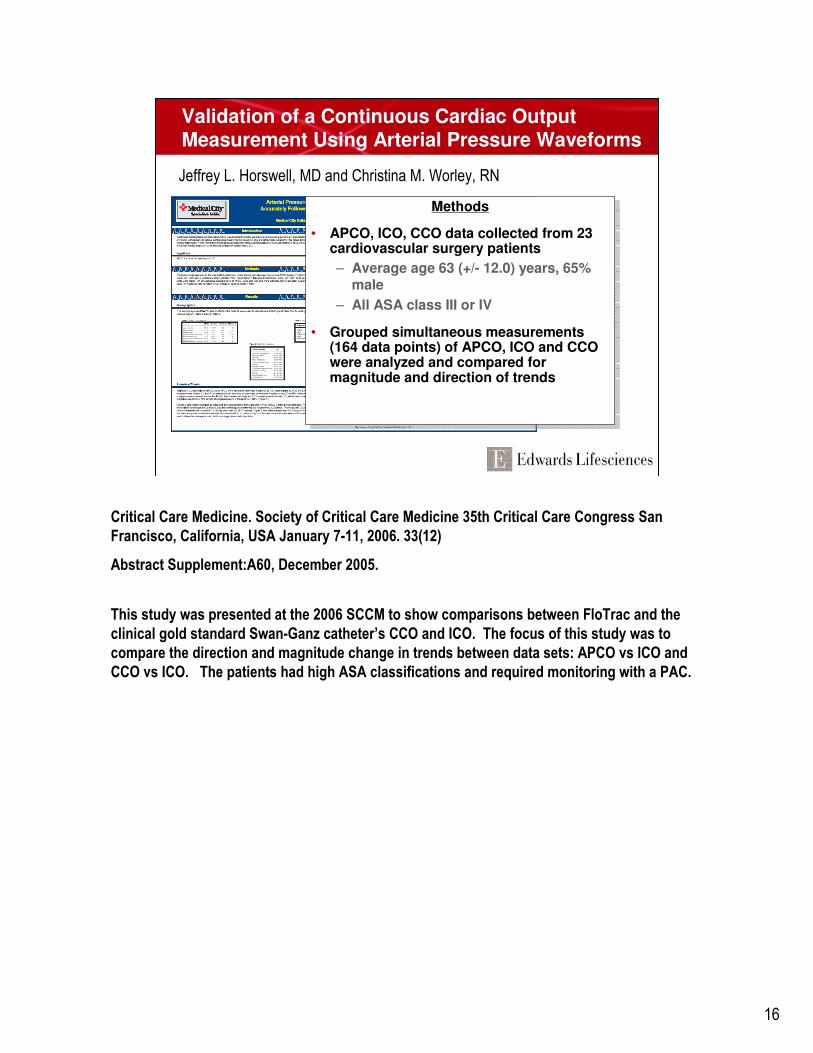
• Grouped simultaneous measurements (164 data points) of APCO, ICO and CCO were analyzed and compared for magnitude and direction of trends
Methods
• APCO, ICO, CCO data collected from 23 cardiovascular surgery patients
– Average age 63 (+/- 12.0) years, 65% male
– All ASA class III or IV
• Grouped simultaneous measurements (164 data points) of APCO, ICO and CCO were analyzed and compared for magnitude and direction of trends
Critical Care Medicine. Society of Critical Care Medicine 35th Critical Care Congress San
Francisco, California, USA January 7-11, 2006. 33(12)
Abstract Supplement:A60, December 2005.
This study was presented at the 2006 SCCM to show comparisons between FloTrac and the
clinical gold standard Swan-Ganz catheter’s CCO and ICO. The focus of this study was to
compare the direction and magnitude change in trends between data sets: APCO vs ICO and
CCO vs ICO. The patients had high ASA classifications and required monitoring with a PAC.

17
Validation of a Continuous Cardiac Output Measurement Using Arterial Pressure Waveforms
Jeffrey L. Horswell, MD and Christina M. Worley, RN
The procedures conducted on this sample primarily were CABG, valve therapy, or a
combination of the two. Patient demographics were broad, with patient ages ranging from 44
to 84 and a broad range of BSAs, from 55 kgs to 151 kgs.

18
Validation of a Continuous Cardiac Output Measurement Using Arterial Pressure Waveforms
Jeffrey L. Horswell, MD and Christina M. Worley, RN
∆ Magnitude & Direction
<15%
15 - 30%
>30%
∆ Magnitude & Direction
<15%
15 - 30%
>30%
The above show the differences between the comparison data being very little in terms of
differences in magnitude and direction of trends.
The green figures represent pairs of data with less than 15% difference in magnitude and
direction; the yellow figures represent pairs of data with a 15% - 30% difference; and the light
red figures represent pairs with more than a 30% difference.
The differences between the two comparisons, APCO vs ICO and CCO vs ICO, were
comparable.

19
Validation of a Continuous Cardiac Output Measurement Using Arterial Pressure Waveforms
Jeffrey L. Horswell, MD and Christina M. Worley, RN
APCO responds quickly to changes in cardiac output.
One of the most significant factors affecting differences in the magnitude and timing of
changes in trends between the two continuous technologies, APCO and CCO, is the averaging
time.
As FloTrac has trends based on a 20 second averaging time, the response to changes in
hemodynamics will be evident earlier than with CCO Swan-Ganz, which could have averaging
times ranging from 3 to 6 minutes*, depending upon signal noise. The differences in
averaging time results in time phasing of trends.
•Stat mode

20
Validation of a Continuous Cardiac Output Measurement Using Arterial Pressure Waveforms
Jeffrey L. Horswell, MD and Christina M. Worley, RN
APCO/CCO
MAP
PP
In this example, the patient’s CO and HR remain relatively constant over the time, as shown in
the APCO/CCO trend. Both MAP and PP increased over the same time span. The constant CO
(and HR) with increasing MAP and PP indicates there has been a change in vascular tone.
The APCO algorithm detects changes in vascular tone via analysis of waveform
characteristics. CO systems based upon an indicator dilution method of calculating CO
require regular calibration because they do not compensate continuously for changes in
vascular tone.
APCO does not require a manual method of recalibration.

21
Validation of a Continuous Cardiac Output Measurement Using Arterial Pressure Waveforms
Jeffrey L. Horswell, MD and Christina M. Worley, RN
CONCLUSIONS
• APCO is a new, less invasive method for continuous cardiac output monitoring.
• APCO requires only arterial catheterization and does not necessitate central venous access or injection of a dilution medium for calibration.
• APCO compares favorably with trending both the direction and magnitude of CO change as compared to the clinical gold-standard, more invasive-PAC method.
• Patients who currently are not monitored with a PAC for CO may benefit from a less invasive method of providing this assessment.

22
Summary
• APCO is a new, less invasive method for continuous cardiac output monitoring
• APCO requires only arterial catheterization and does not necessitate central venous access or injection of a dilution medium for calibration
• APCO compares favorably with trending both the direction and magnitude of CO change as compared to the clinical gold-standard, more invasive-PAC method
• Patients who currently are not monitored with a PAC for CO may benefit from a less invasive method of providing this assessment
• APCO algorithm automatically accommodates for changes in vascular tone (without a manual method of calibration)

23
Any quotes used in this material are taken from independent third-party publications and are not intended to imply that such third party reviewed or endorsed any of the products of Edwards Lifesciences.
Rx only. See instructions for use for full prescribing information.
Edwards Lifesciences devices placed on the European market meeting the essential requirements referred to in Article 3 of the Medical Device Directive 93/42/EEC bear the CE marking of conformity.
Edwards, the stylized E logo, FloTrac and Vigileo are trademarks of Edwards Lifesciences Corporation. Edwards Lifesciences, PreSep, and Swan-Ganz are trademarks of Edwards Lifesciences Corporation and are registered in the United States Patent and Trademark Office.
© 2006 Edwards Lifesciences LLC
All rights reserved. AR01271

24