
Edmund Cannon Banking Crisis University of Verona Lecture 3.
28
Edmund Cannon Banking Crisis University of Verona Lecture 3
-
Upload
gladys-sutton -
Category
Documents
-
view
218 -
download
1
Transcript of Edmund Cannon Banking Crisis University of Verona Lecture 3.
Edmund Cannon
Banking CrisisUniversity of Verona
Lecture 3
Plan for today2
Review of Monday and Tuesday
Finish material from Tuesday
Opportunity for questions
I shall discuss the formative assessment tomorrow (after I have marked it).
Today’s Material: More about Risk
Measuring risk: how do they do it (VaR)?
Insuring risk: Credit Default Swaps
Systemic risk and endogeneity; housing market
REPO
How to measure risk3
Regulators interested in downside risk (things going wrong).
Variance (or standard deviation) does not measure precisely this.
Most widely used measure is Variance-at-Risk
Usually abbreviated VaR (VAR = Vector Auto Regression)
VaR = how bad things are if worst 1% (or x% happens)
≈ 1% critical value of the probability distribution
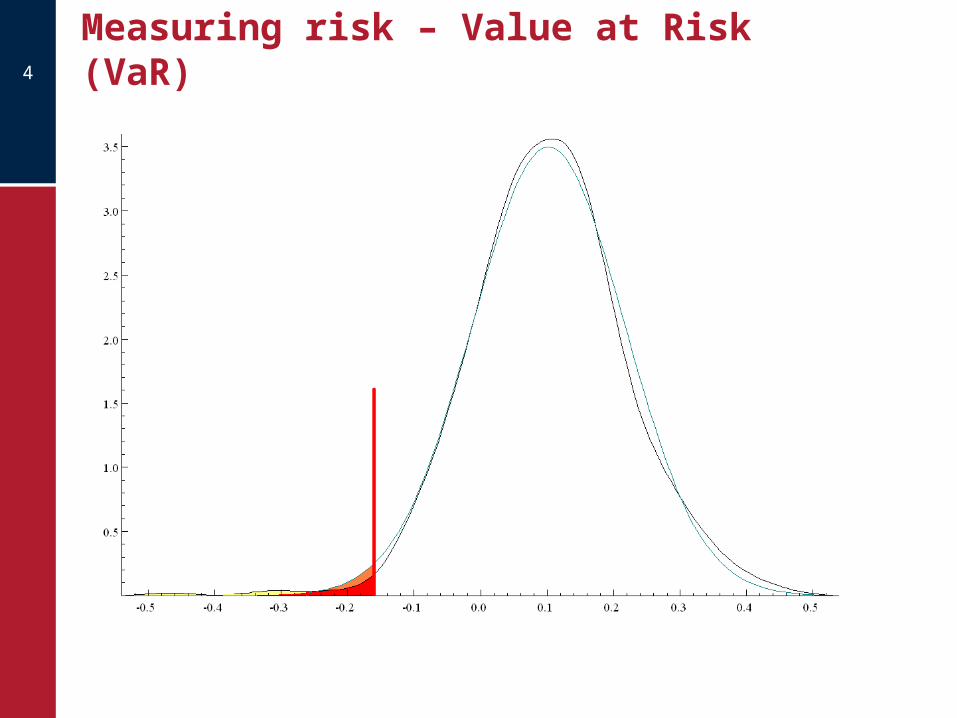
Measuring risk – Value at Risk (VaR)4
Normal or non-Normal5
If returns are Normal (= Gaussian) then:
The variance is a sufficient statistic for all measures of risk;
Estimates of the variance have a chi-squared distribution so it is easy to model how risk depends upon estimation error.
If returns are non-Normal then:
The variance cannot tell us about the risk of certain situations;
Estimates of the variance are unbiased but that is about all we can say;
Any model assuming Normality will heavily under-estimate “extreme events”.
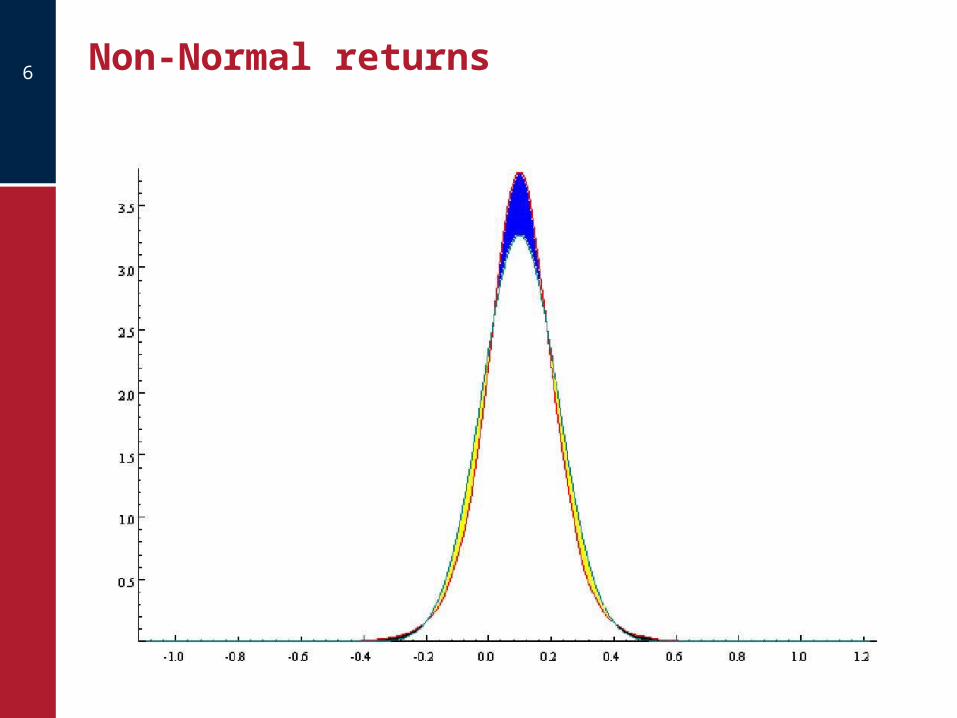
Non-Normal returns6
Statistical issues with VaR7
Statistical issues:
Expected value and Variance relatively easy to estimate;
Characteristics of “Tails” much harder to estimate.
Intuitive explanation of statistical problem:
By definition, very rare events are very rare;
Therefore there are very little data.
Possible solution:
make strong assumptions about the probability distribution (eg Normal)
Further problem: many estimates based on inadequate data (eg from last ten years: series is too short).
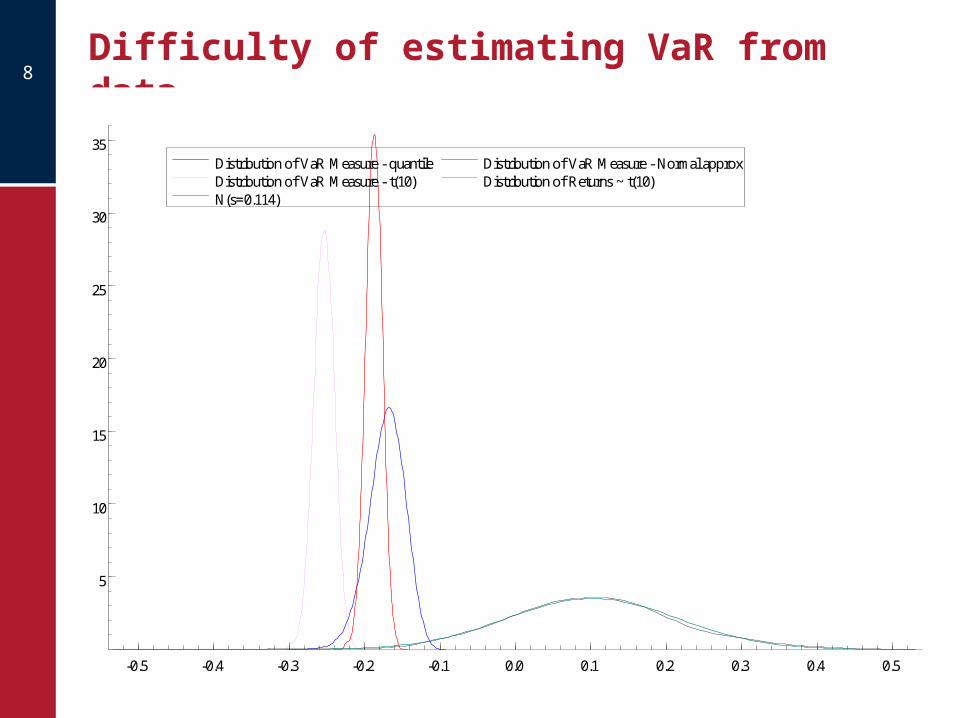
Difficulty of estimating VaR from data
8
Distribution of VaR Measure - quantile Distribution of VaR Measure - t(10) N(s=0.114)
Distribution of VaR Measure - Normal approx Distribution of Returns ~ t(10)
-0.5 -0.4 -0.3 -0.2 -0.1 0.0 0.1 0.2 0.3 0.4 0.5
5
10
15
20
25
30
35Distribution of VaR Measure - quantile Distribution of VaR Measure - t(10) N(s=0.114)
Distribution of VaR Measure - Normal approx Distribution of Returns ~ t(10)
Reducing risk with insurance: Credit Default Swaps9
One way to reduce risk is to move risk off balance sheet – eg CDO.
Alternatively a bank can hold a risky asset on the balance sheet but purchase insurance through a Credit Default Swap.
The CDS insures against default. Insurance against price movements is insured through conventional future contracts (which I do not discuss).
Compare CDS with conventional insurance.
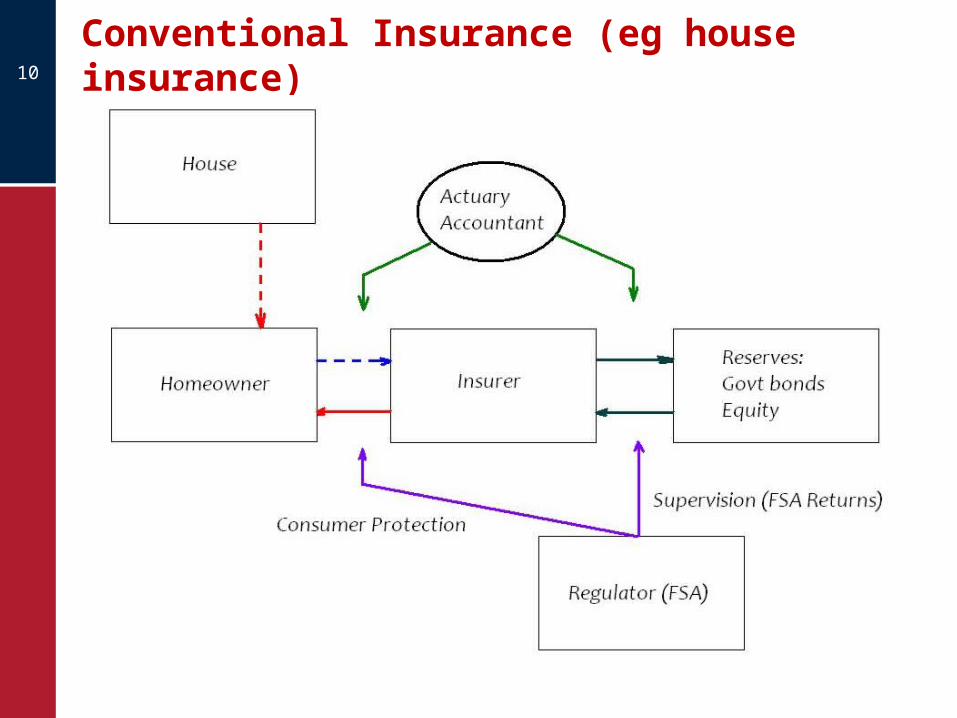
Conventional Insurance (eg house insurance)10
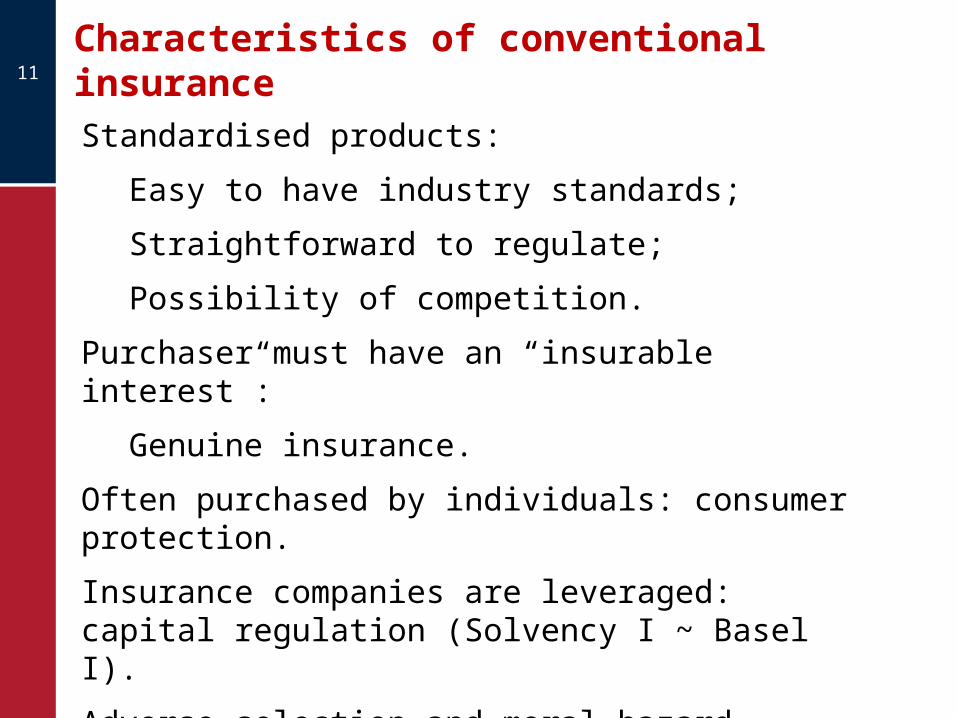
Characteristics of conventional insurance11
Standardised products:
Easy to have industry standards;
Straightforward to regulate;
Possibility of competition.
Purchaser must have an “insurable interest”:
Genuine insurance.
Often purchased by individuals: consumer protection.
Insurance companies are leveraged: capital regulation (Solvency I ~ Basel I).
Adverse selection and moral hazard.
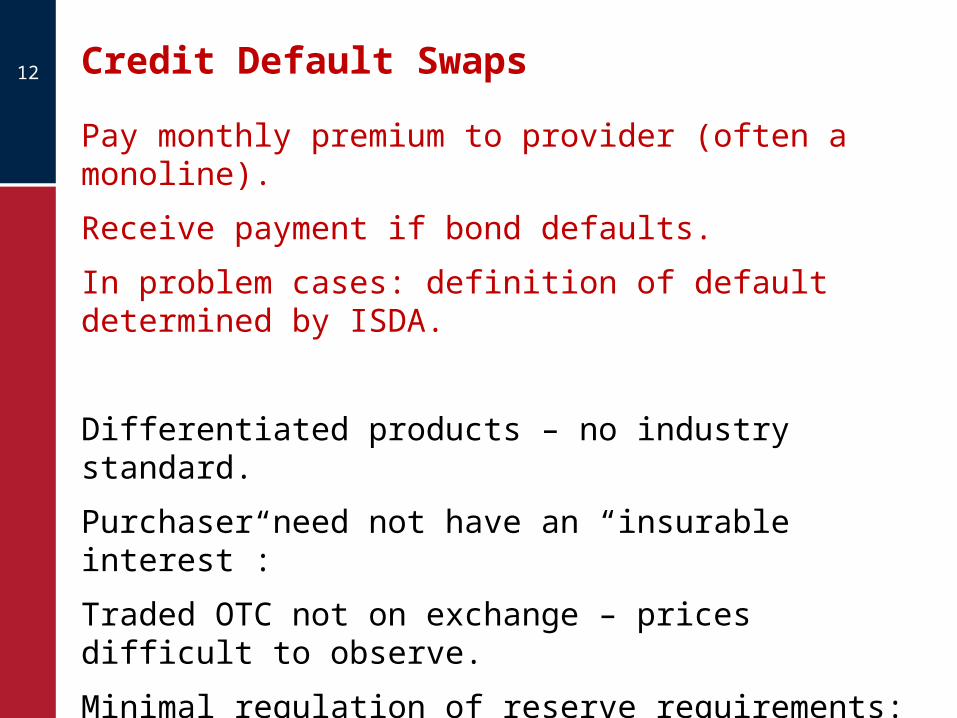
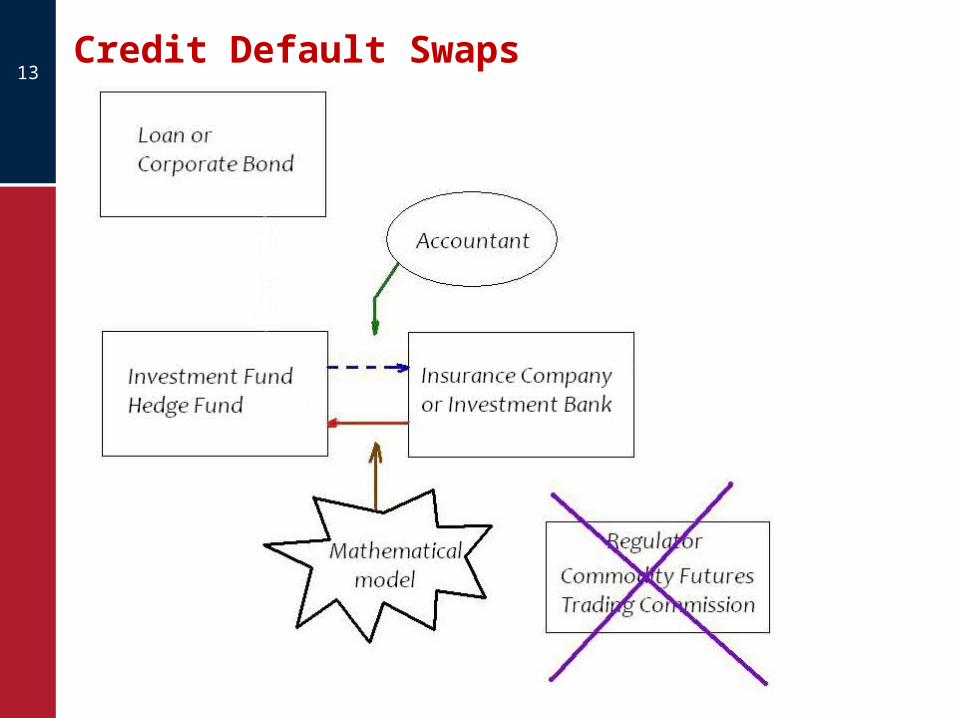
Credit Default Swaps12
Pay monthly premium to provider (often a monoline).
Receive payment if bond defaults.
In problem cases: definition of default determined by ISDA.
Differentiated products – no industry standard.
Purchaser need not have an “insurable interest”:
Traded OTC not on exchange – prices difficult to observe.
Minimal regulation of reserve requirements:
Market participants impose capital requirements.
Who is the appropriate counter party for sovereign debt?
Credit Default Swaps13
“Endogenous” Risk14
Basic idea:
Economic insitutions magnify good and bad shocks.
Mechanism 1: Leverage
Unexpectedly good results increase capital (equity)
Banks lend more
Creates a bubble
Mechanism 2: Expectations / perceptions of risk
Firms only use recent data to evaluate risk
Selection bias
Too optimistic in good times; too pessimistic in bad times.

Leverage and endogenous risk (Shin)15
Leverage increases endogenous risk in all leveraged institutions, not just banks.
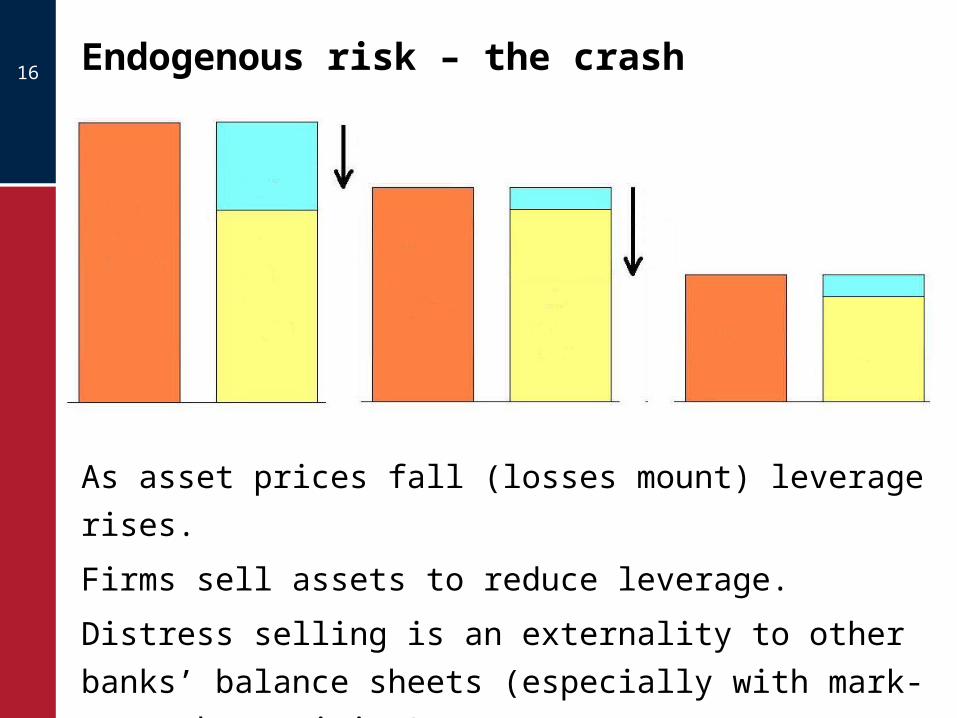
Endogenous risk – the crash16
As asset prices fall (losses mount) leverage rises.
Firms sell assets to reduce leverage.
Distress selling is an externality to other banks’
balance sheets (especially with mark-to-market
pricing).
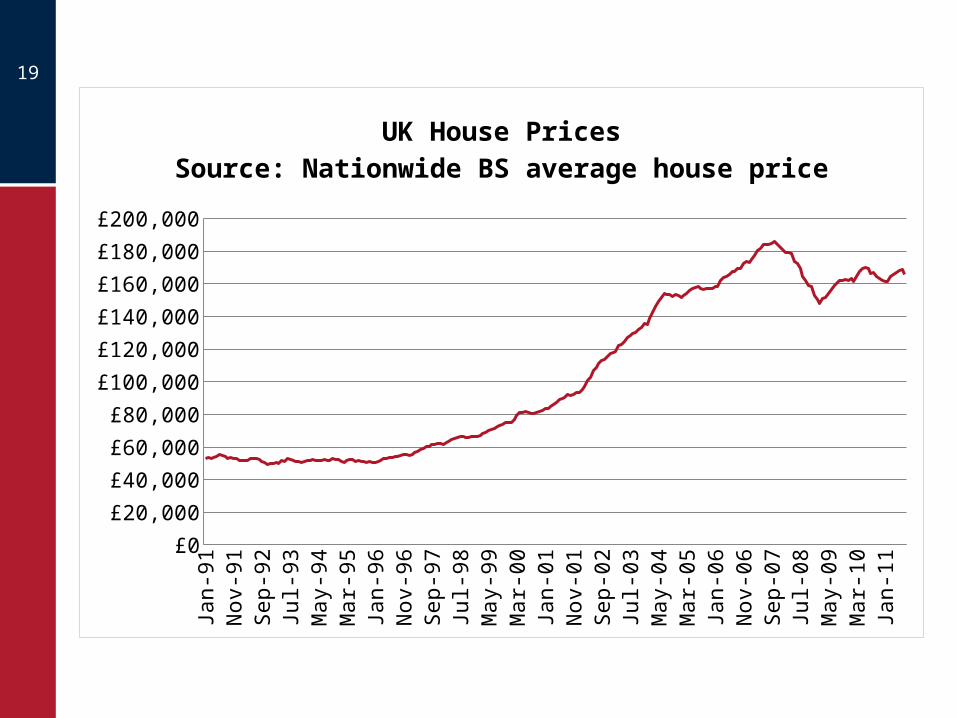
House price bubbles17
House prices are very variable.
House prices rise
Fewer defaults
Mortgage banks make high profits and increase equity
Under-estimate default risk
Lend more money on easier terms
House prices rise further

18
01.0
3.19
99
01.0
8.19
99
01.0
1.20
00
01.0
6.20
00
01.1
1.20
00
01.0
4.20
01
01.0
9.20
01
01.0
2.20
02
01.0
7.20
02
01.1
2.20
02
01.0
5.20
03
01.1
0.20
03
01.0
3.20
04
01.0
8.20
04
01.0
1.20
05
01.0
6.20
05
01.1
1.20
05
01.0
4.20
06
01.0
9.20
06
01.0
2.20
07
01.0
7.20
07
01.1
2.20
07
01.0
5.20
08
01.1
0.20
08
01.0
3.20
09
01.0
8.20
09€0
€100,000
€200,000
€300,000
€400,000
€500,000
€600,000
Irish Property PricesSource: BIS, taken from Dept of Environ-ment, Heritage & Local Government, Eire.
Existing properties: whole coun-try
Existing properties: Dublin
19
01/1
991
01/1
992
01/1
993
01/1
994
01/1
995
01/1
996
01/1
997
01/1
998
01/1
999
01/2
000
01/2
001
01/2
002
01/2
003
01/2
004
01/2
005
01/2
006
01/2
007
01/2
008
01/2
009
01/2
010
01/2
011£0
£20,000
£40,000
£60,000
£80,000
£100,000
£120,000
£140,000
£160,000
£180,000
£200,000
UK House PricesSource: Nationwide BS average house price
20
01
/03
/19
70
01
/03
/19
72
01
/03
/19
74
01
/03
/19
76
01
/03
/19
78
01
/03
/19
80
01
/03
/19
82
01
/03
/19
84
01
/03
/19
86
01
/03
/19
88
01
/03
/19
90
01
/03
/19
92
01
/03
/19
94
01
/03
/19
96
01
/03
/19
98
01
/03
/20
00
01
/03
/20
02
01
/03
/20
04
01
/03
/20
06
01
/03
/20
08
01
/03
/20
1010
100
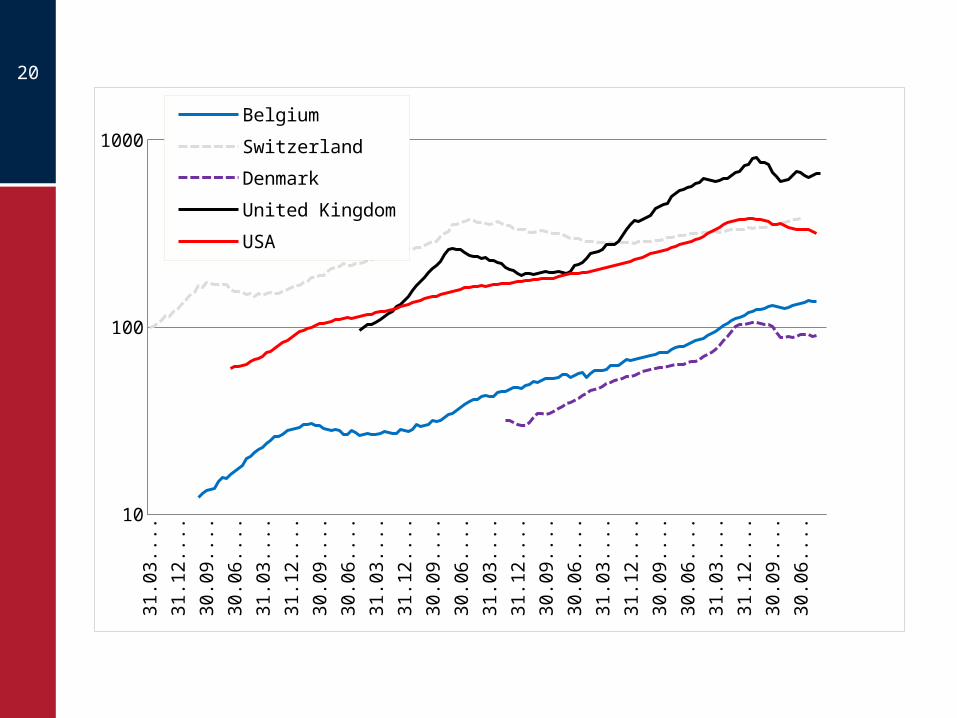
1000Belgium
Switzerland
Denmark
United Kingdom
USA
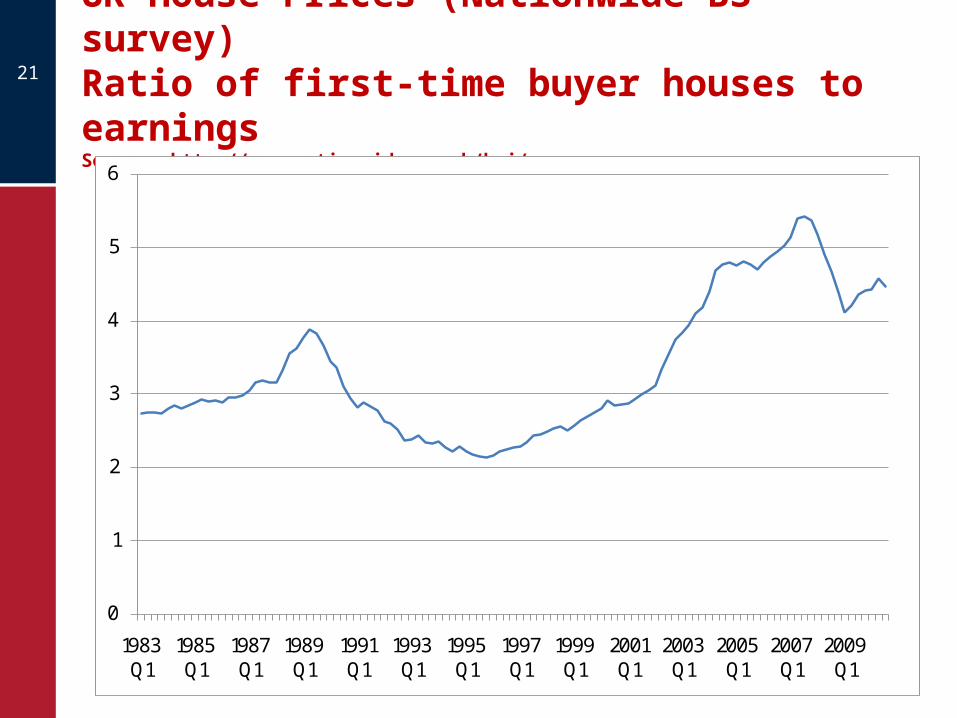
UK House Prices (Nationwide BS survey)Ratio of first-time buyer houses to earningsSource: http://www.nationwide.co.uk/hpi/
21
0
1
2
3
4
5
6
1983 Q1
1985 Q1
1987 Q1
1989 Q1
1991 Q1
1993 Q1
1995 Q1
1997 Q1
1999 Q1
2001 Q1
2003 Q1
2005 Q1
2007 Q1
2009 Q1
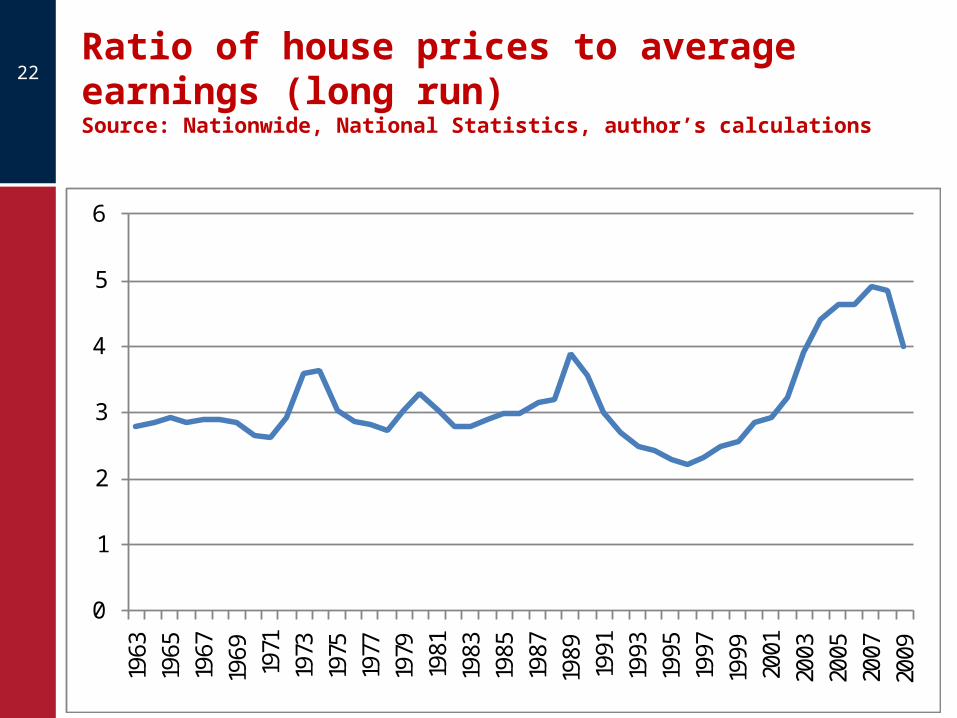
Ratio of house prices to average earnings (long run)Source: Nationwide, National Statistics, author’s calculations
22
0
1
2
3
4
5
6
1963
1965
1967
1969
1971
1973
1975
1977
1979
1981
1983
1985
1987
1989
1991
1993
1995
1997
1999
2001
2003
2005
2007
2009
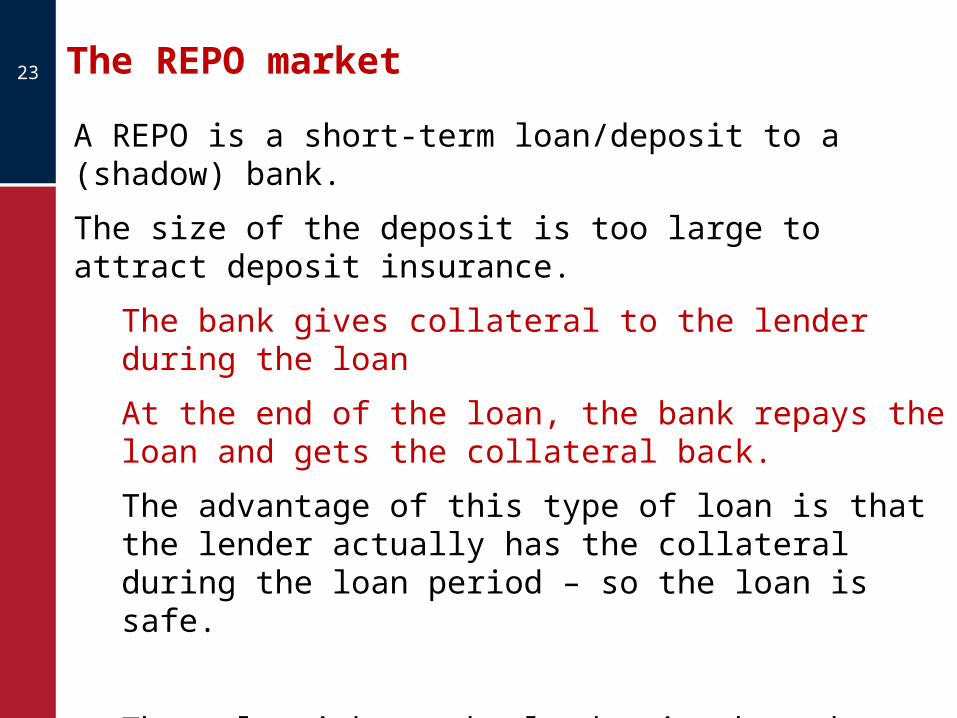
The REPO market23
A REPO is a short-term loan/deposit to a (shadow) bank.
The size of the deposit is too large to attract deposit insurance.
The bank gives collateral to the lender during the loan
At the end of the loan, the bank repays the loan and gets the collateral back.
The advantage of this type of loan is that the lender actually has the collateral during the loan period – so the loan is safe.
The only risk to the lender is that the collateral itself may lose value or default.
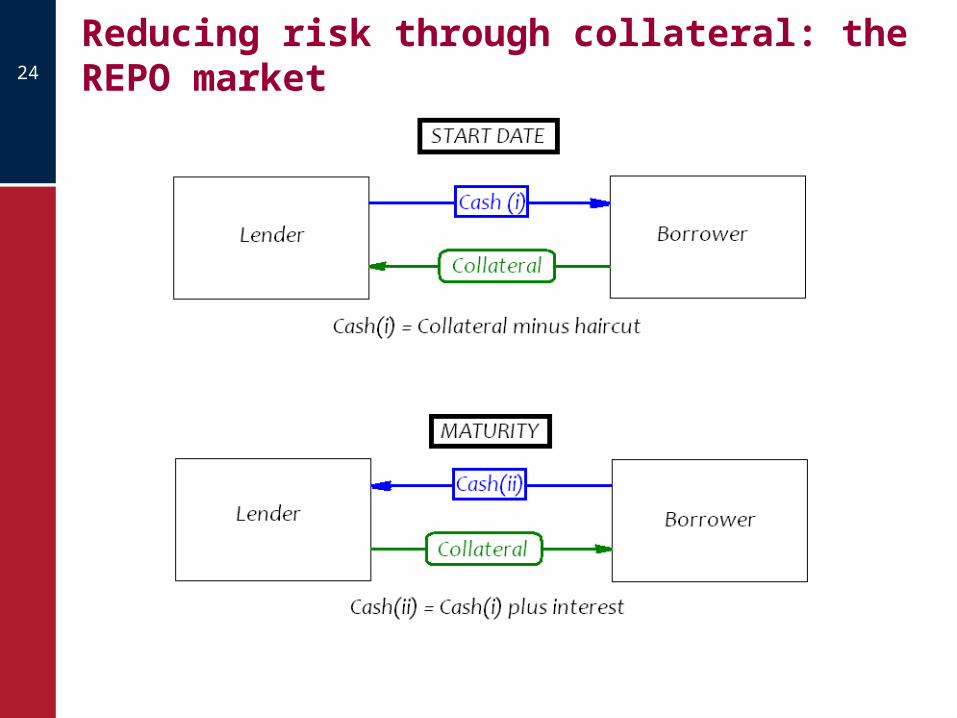
Reducing risk through collateral: the REPO market24
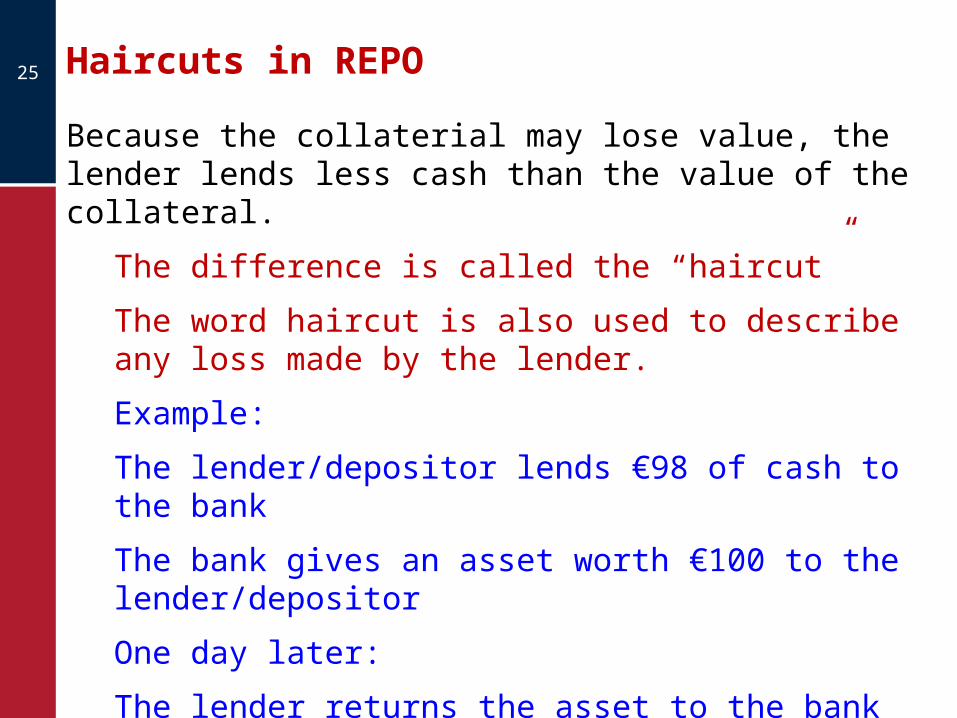
Haircuts in REPO25
Because the collaterial may lose value, the lender lends less cash than the value of the collateral.
The difference is called the “haircut”
The word haircut is also used to describe any loss made by the lender.
Example:
The lender/depositor lends €98 of cash to the bank
The bank gives an asset worth €100 to the lender/depositor
One day later:
The lender returns the asset to the bank
The bank repays €100 cash
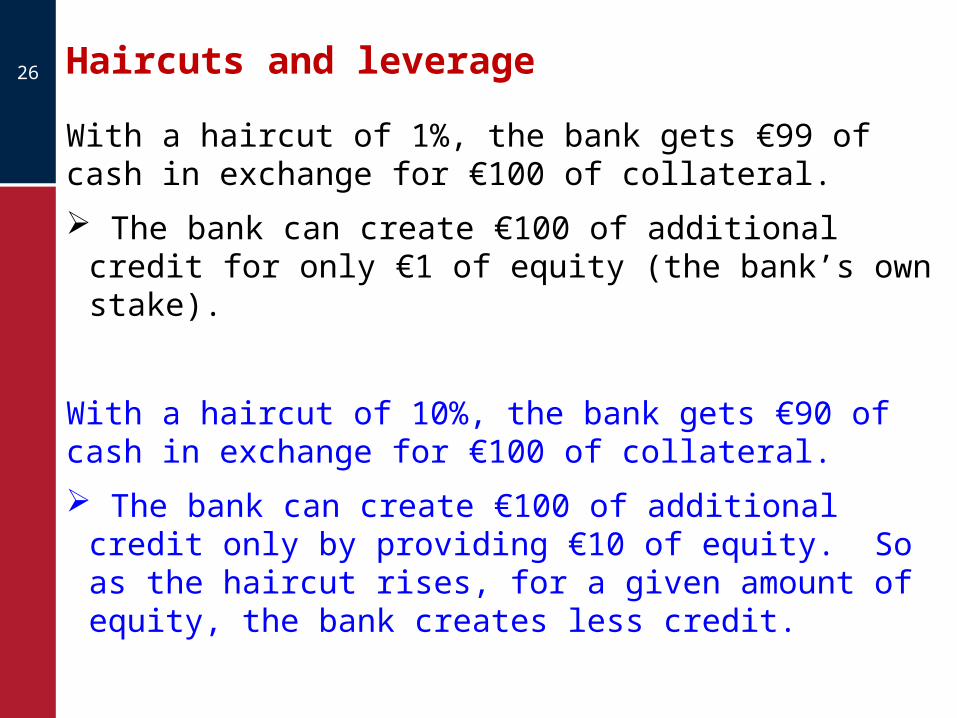
Haircuts and leverage26
With a haircut of 1%, the bank gets €99 of cash in exchange for €100 of collateral.
The bank can create €100 of additional credit for only €1 of equity (the bank’s own stake).
With a haircut of 10%, the bank gets €90 of cash in exchange for €100 of collateral.
The bank can create €100 of additional credit only by providing €10 of equity. So as the haircut rises, for a given amount of equity, the bank creates less credit.
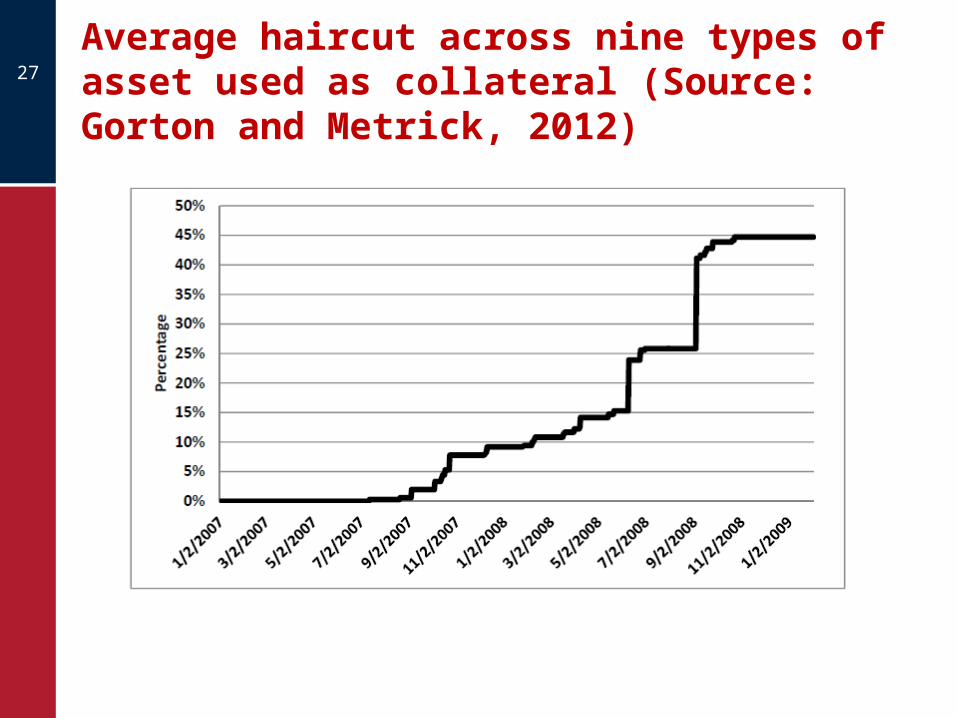
Average haircut across nine types of asset used as collateral (Source: Gorton and Metrick, 2012)
27
Haircuts and pro-cyclicity28
Perceptions of higher risk lead to higher haircuts.
Less credit is created because banks’ equity is fixed in the short run.
The bank must reduce its assets by selling them: but since everyone else is selling too, prices fall.
The falls in price lead perceptions of risk to rise further and so haircuts continue to rise.