edition - University of Wisconsin–Stout
61
., Assessing the Percentage of Business and Industry Utilizing Lean Strategies Where University of Wisconsin-Stout Graduates are Employed By Thomas Harvey A Research Paper Submitted in P31iial Fulfillment of the Requirements for the Master of Science Degree III Training and Development Approved: 4 Semester Credits J ames Keyes, PhD The Graduate School University of Wisconsin-Stout August 2010 1
Transcript of edition - University of Wisconsin–Stout

.,
Assessing the Percentage of Business and Industry Utilizing Lean
Strategies Where University of Wisconsin-Stout
Graduates are Employed
By
Thomas Harvey
A Research Paper Submitted in P31iial Fulfillment of the
Requirements for the Master of Science Degree
III
Training and Development
Approved: 4 Semester Credits
J ames Keyes, PhD
The Graduate School University of Wisconsin-Stout
August 2010
1

The Graduate School University of Wisconsin-Stout
Menomonie, WI
2
Author: Harvey, Thomas K.
Title: Assessing the Percentage of Business and Industry Utilizing Lean
Strategies Where University of Wisconsin-Stout Graduates are Employed
Graduate Degree/ Major: MS Training and Development
Research Adviser: James Keyes, Ph.D.
MonthlYear: August 2010
Number of Pages: 61
Style Manual Used: American Psychological Association, 6th edition
Abstract
Lean manufacturing or lean production is an organizational approach to process
management, known simply as lean. Lean focuses on the removal of any aspect of a process not
intended to bring about greater customer satisfaction and product value. The purpose of this
study was to determine the percentage of businesses and industries utilizing lean, as an
operational strategy, where University of Wisconsin-Stout graduates were employed. The aim
was to understand the increase in the number of student enrollments in lean related courses
offered by the College of Operations and Management at the University of Wisconsin-Stout.
Quantitative data was gathered by a research-based survey sent to 425 Bachelor of
Science graduates from the University of Wisconsin-Stout (Stout). The three majors targeted in
the study were Business, Business Administration and Engineering Technology; pat1icipants
graduated between 1995 and 2008. Responses were returned from 20% of p311ici pants.

3
The results of the survey indicated lean strategies are used widely by business and
industries where Stout graduates are employed. Almost half, 48%, of respondent's report that
their current employer utilizes lean methods within their organization. Of those reporting to use
lean, 52% reported the use of lean throughout the entire organization, with 29% repOliing the use
of the lean in production/operations side of the organization.
The increase in the number of students enrolling in lean-based operations and business
classes appears to be based on the wide implementation of lean strategies across a range of
business and industries. The University of Wisconsin-Stout may continue to see a continued
demand for the knowledge, skills and abilities based centered on the principles of lean
production.

The Graduate School
University of Wisconsin Stout
Menomonie, WI
Acknowl edgments
4
I would like to acknowledge and thank all of my instructors that I have encountered in
my pursuit of my degrees. My goal would not be possible without the help and suppoli of the
home unit, thanks to you both.

5
Table of Contents
.......................................................................................... . .... . ................ Page
Abstract .. ............................................................................................................. ............................ 2
List of Tables .............................................. .. .................................................................................. 7
List of Figures ............................................................................................. .... ... .. ........ .. ..... ..... .... ... 8
Chapter I: Introduction ...... ................... .... ........ ...... ............................................ ....... .... .................. 9
Statement of the Problem ................. ........................................................................................... 9
Purpose of the Study ................................................................................................................. 10
Assumptions of the Study ......................................................................................................... 10
Definition of Tenns ................................................................................................................... 10
Limitations of the Study ............................................................................... ............. .. .............. 12
Methodology .......... .. .................. ...... ... .. .................................................................................... 12
Chapter II : Literature Review ........................ .......................................................................... ..... 14
Lean Manufacturing-An Overview .................................................... ..................... ... ............... 14
Benchmarking ........................................................................................................... 16
Just in Time ............................................................................................................... 17
Six Sigma .................................... .. ..... .. ...... ........................................... ....... .... ...... ... 19
Lean Six Sigma .... ... ........... .......... ..... ... .. ............ .... .. ... ...... .. ........ .. ...... ...... ...... ....... ... 21
Theory of Constraints ......................... ..... .... .. .... .. .. ................................................... 24
Chapter III: Methodology ............................................................................................................. 27
Subject Selection and Description ....................... .. ................. ............................................... ... 27
Instrumentation ....................................................................... .................................................. 27
Data Collection Procedures ....................................................................................................... 28

6
Data Analysis ............................................................................................................................ 29
Limitations .......... .......................................................................................................... ........ .... 30
Summary .......................................................................................... ........ .... .......... ................... 30
Chapter IV: Results ...................................................................................................................... 31
Data Analysis ........... ...... .... ................................... ................. ... ....... ....... ....... ........................... 31
Organizations where Lean is utilized ........................................................................................ 33
When Lean is not utilized ....................................................................... ........ .......................... 37
A Look at University of Wisconsin-Stout Graduates .............................. .... ............................. 39
Chapter V: Discussion .... .............................................................................. .......... ...................... 41
Limitations ................................................................................................................................ 41
Conclusions ............................................................................................................................... 41
Recommendations ........................................................................................ ............................. 42
References .............................................................................. ...... ................. .. ....... ....................... 45
Appendix A : Survey Invitation ..................................................................................................... 48
Appendix B: IRB Exemption .... .. .................................................. .. ....... ................ ....................... 49
Appendix C: Survey Results ......................................................................................................... 50

7
List of Tables
Table] : Select the business or industry that best describes your organization ................ .. .. .. 3]
Table 2: How many people are in your organization? ... ...... ... ...... ........ ............ .... .... ............... 32
Table 3: Within your organization, where do you employ lean? ................................... .... ..... 34
Table 4: How long has your organization used lean? .............................................................. 34
Table 5: Lean has given our organization a return on our investment in it .................... ........ 35
Table 6: In what way could or should UW Stout be preparing graduates to utilize lean in
industry ............................................................................................ 40

8
List of Figures
Figure 1: Do you cunently use lean as your operational strategy? .................................... 33
Figure 2: Select the benefits your organization has realized in its use of Lean ...................... 37
Figure 3: Reasons an organization may not use Lean .................................................... 39

9
Chapter I: Introduction
Today's businesses are facing a competitive global marketplace. While many books and
articles have been written regarding lean as an operational and process management strategy,
little information exists on the number of organizations in business and industry utilizing lean at
the time of this study. However, lean is not the only operational strategy currently in use in
business and industry; competing with lean is: Six Sigma, Theory of Constraints, Lean Six
Sigma, Just in Time. Process management, as defined by the book of the same name (Becker,
Kugeler and Rosemann, 2003) is a method of planning and measuring outputs of a process in
business or manufacturing. Organizations across sectors and scales of business and industry see a
managed process as a way to increased profitability. Not all organizations employ an operational
or process management strategy; some organizations have even moved away from lean in recent
times in favor of a more agile approach to manufacturing (James, 2005). The research was
conducted to ascertain the number of businesses and organizations using lean where graduates of
the University of Wisconsin-Stout are cUlTently employed specifically.
Statement of the Problem
The University of Wisconsin-Stout programs in Business, Business Administration and
Engineering Technology has experienced an increase in the demand for courses based in lean
theory and practice. This study was conducted in an attempt to understand the demand for lean
courses and to project if the need would continue. Little data exists as to the percentage of
organizations utilizing lean practices in 2010 or what operational or process management
strategy is in place where University of Wisconsin-Stout graduates gained employment.

10
Purpose of the Study
The intention of this study was to determine if the Business, Business Administration and
Engineering Technology programs at the University of Wisconsin-Stout should continue to meet
the demands of the students seeking course work relating to lean methodologies. Furthermore,
the study will conclude if a change is needed to increase the number of classes and coops offered
to students of these programs.
Assumptions of the Study
The assumptions of this study are:
1. Not all respondents will know their current employers organizational or
operational strategy.
2. Not all invitees will participate in the study.
3. Not all contact information provided to the researcher may be up to date and
accurate.
Definition of Terms
Benchmarking. A continuous, systematic process for evaluating the products, services
and work processes of an organization recognized as representing the best practices in
organizational improvement (Spendolini, 1992).
Just In Time (lIT). A system of planning for a manufacturing process that optimizes the
scheduling of materials to alTive at the manufacturer when needed and in only quantities req uired
for meeting the objective (Hirano & Makota, 2006).
Lean. Lean manufacturing or lean production is an organizational approach to process
management. Lean focuses on the removal of any aspect of a process not intended to bring about
greater customer satisfaction and product value. (Endsley, Maghill, and Godfrey, 2006).

11
Lean Six Sigma. Is a relatively new process improvement method that combines both
lean and Six Sigma methodologies. It began in the late 1990s as companies began cross-training
employees in the two frameworks and combined aspects of each operational strategy (George,
Rowlands & Kastle, 2004).
Original Equipment Manufactures. (OEM) Is a manufacturer or producer of a finished
product; generally the last manufacturer before the end-user purchases the product (Womack,
Jones, & Roos, 1990).
Process Management. The application of the Imowledge, skills, techniques of an
organizations to define, visualize, measure, control, report and improve processes with the goal
to meet customer requirements with profit (Thorn, 2009).
Theory of Constraints. An approach to continuous improvement (reducing operating
expenses and inventory and increasing output) based on a five-step procedure: (1) identifying
constraints, (2) exploiting the binding constraints, (3) subordinating everything else to the
decisions made in the second step, (4) increasing capacity of the binding constraints, and (5)
repeating the process when new binding constraints are identified. It seeks to identify a
company's constraints or bottlenecks and exploit them so that tlu'oughput is maximized and
inventories and operating costs are minimized. (Goldratt, 1984)
Total Quality Management (TQM) This management strategy employs all facets of an
organization (design, engineering, production, marketing, and finance) in order to meet their
business objectives and meet customer expectations by minimizing production errors,
streamlining the supply chain, utilizing modern equipment and training employees (Aguayo,
1991 ).

Six Sigma. Developed by Motorola, this management strategy seeks to reduce the
OCCUITence of error and variability through data analysis (Motorola University , 2010).
Value. Is a determination of the worth of a product or service that is assessed by the
customer (Womack, Jones, & Roos, 1990).
Limitations of the Study
12
1. The subjects of this study are limited the undergraduates of the University of
Wisconsin-Stout programs in Business, Business Administration and Engineering
Technology from the years running consecutively from 1995 to 2009.
2. The participation is voluntary by respondents.
3. Respondent has to know of the operational strategies of their employer, past and
present.
4. Recommendations are for the University of Wisconsin-Stout, it's programs,
Business, Business Administration and Engineering Technology and the College
of Operations and Management.
5. The findings in this studying are not predicted to be valid after 5 years.
Methodology
A web-based anonymous survey was selected to pursue this inquiry. An invitation to
pmiicipate was sent to all UW -Stout graduates drawn from a spectrum of undergraduate and
graduate programs in Business, Business Administration and Engineering Technology at the
University of Wisconsin-Stout. Targeted business and industry graduates were: distribution, food
production, and hospitality/tourism, manufacturing, medical, and retail.

13
A return rate of20% was realized on theon-line survey sent out to 425 graduates of the
University of Wisconsin-Stout programs Business, Business Administration and Engineering
Technology. The selected graduates were from the 1995 to 2009. All invitees were provided the
0ppOliunity to withdraw from the survey at any time.
Approval for this research was sought from the Institutional Review Board (lRB) at the
University of Wisconsin-Stout, which granted an exemption for this research. The survey and
data were compiled with the help and technical assistance from the Applied Research Center
located at the University of Wisconsin-Stout.

Chapter II: Literature Review
Lean Manufacturing-An Overview
14
The intention of this study was to asceliain the number of employers in business and
industry utilizing lean as a strategy where University of Wisconsin-Stout graduates were
cUlTently employed. Lean manufacturing was a process developed by Toyota Production System
and the early influence of Dr. W. Edwards Deming, a renowned American statistician; Deming
worked along side the Japanese during their post-war industrial growth (Aguayo, 1991). Deming,
founder of Total Quality Management (TQM) (Dobyns, 1990), promoted the concepts of quality
through the reductions of flaws inherent in the process of manufacture of a product, streamlining
the supply chain as well as modernizing equipment and training employees to the highest degree
possible. Later in life Deming stated that, in issues effecting quality, 96% of the problems were
in the work system and 4% attributed to the individual worker (George, Rowlands & Kastle,
2004). Deming did not work alone to develop quality improvement methods while in Japan;
Taiichi Ohno, Shigeo Shingo and Eiji Toyoda worked to continually develop Deming's concept
into a process at Toyota, from the years 1948-75 (Emiliani, Stec, Grasso, & Stodder, J., 2007).
The lean manufacturing concept began within the Toyota Production System in Japan and
was both investigated and documented in the seminal work of James Womack, Daniel Jones and
Daniel Roos (1990). Womack, Jones & Roos gave credit to follow researcher John Krafcik for
coining the term lean as early as 1988 (Krafcik, 1988). There was an apparent need for lean, in
the large scale, original equipment manufactures (OEM) of the world as explained by Womack
(1990) the author of The Machine That Changed the World, was in outgrowth of organizational
expectations placed on modern mass production. No longer was the individual craftsperson able
to produce their quality goods at a competitive price most consumers can afford, a result of the

15
industrial revolution. While mass-producers can produce mass goods manufactured at a price
consumers can afford, there are both wastes and variations in product quality associated with
minimally skilled workers running complex and expensive machinery. To meet the demands of
the consumer in the post-industrial era OEM utilized resources that, by today ' s standards, were
wasteful. The extra employees, extra material and replacement parts on-hand needed to keep up
production are all examples of waste; the craftsperson did not have to contend with such
overhead as pali of their production methods. Lean production/manufacturing is as simple as
getting the right things to the right place, at the right time and in the right quantity to achieve the
perfect work flow. Nothing more and nothing less is needed or warranted in this production
model. This philosophy changed the way business and industry chased profit.
Lean manufacturing offers a dynamic work environment that is too restrictive operates
under severe limitations or prescriptive constraints. Womack, Jones & Roos gave the example of
one Japanese automaker, Toyota, which had the flexibility to offer more automotive products in
the marketplace than did the big 3 auto makers of Detroit during the same period in time. Toyota
was capable of producing the feat with half the labor effort and they did it in half the production
time it would have taken General Motors (GM) to do the same. They achieved this benchmark
by consistently evaluating the process constructing their system of production. Toyota also
changed the way a worker viewed the down time of retooling a machine. At one time a worker
would enjoy the long work delay associated setting up to run a different product on the
production line. A worker may have considered this retooling as pali of business and the
company absorbs the loss resulting from such an event. Toyota convinced their workers it was to
everyone's mutual benefit (increase in productivity and wage) to change a retooling process that
16
was measured in the number of hours, to a process that took only minutes to produce the same
outcome.
While this production method is spreading around the world and into a variety of
industries, Womack and Jones (1996) asserted in order to make the transition to lean and to
capitalize on what lean could do for an organization is dependent on a committed workforce.
With lean workers need different skills; workers are now sharing what is known about their work
and adding the to the process of production. Information is shared across the organization not
just up and down as traditionally held organization operates. This meant workers were more
challenged on the job; they have become more productive, perhaps even stressed about their
work. Less individual pursuit and more collaborative engagement across the organization was
the new norm. Professional skills will be needed along with creativity and problem solving skills.
Thinking became more important than doing as one conceptualizes their newfound
responsibilities within the organization. Teamwork was central across sectors of in organization;
ad hoc groups are formed as needed to service specific ends.
While it is important to have a complete understanding of ones own organizational
capacity, the concept of how well one organization does inside their own sector of business and
industry is critical for a high performing organization. A systematic process for evaluating the
products, services and work processes of an organization, recognized as representing the best
practices, expands the knowledge of how efficiently one's operations are truly running. This
barometer is known in manufacturing as benchmarking.
Benchmarking According to Spendolini (1992) the utilization of metrics, within the areas of product
design and development, cycle time, production time, material handling, overhead costs and

17
finally the retail prices, allows an organization to rank itself with similar organizations within an
industry, when compared to others in the same industry. Once the common and comparative
practices are identified and compared from one organization to another, especially an innovator
or a leader with in the industry, an organization can indentify the areas within their own
organization they need to change in order to become more efficient (and competitive) in their
operations. Additionally, benchmarking is used to establish criteria in which an organization can
also measure itself for use in the future or in comparison of the effolis past. Lean is often a viable
operational and process management strategy to achieve and evaluate industry-leading
benchmarks. However, lean methodologies have direct competition as an operational strategy in
business and industry around the world setting or challenging existing benchmarks with differing
approaches to process management.
Just in Time As early as 1934 the principles of Just in Time (lIT) emerged as Sakichi Toyoda moved
from textiles into automobile and then truck production (Ohno, 1988). As an earlier operational
strategy of Toyotas Total Production System, "The goal is to provide the right information, to the
right people, at the right time-just in time so they can take action based on that information
(Kerschberg and Jeong, 2005)." This key tenant of JIT is seen in the lean philosophy the
production methods of today.
Under ideal operational conditions for Just in Time, a company would have just enough
production material on the floor, on a single day to produce the given number of units set for
production for that day. Additionally, any product manufactured that day would be shipped
immediately. Any material aITiving could be queued for immediate use. Thus we observe a cycle
of planned management where needs are forecasted and production follows. While this ideal was

rarely obtained, organizations have realized a return on investment in the application of these
principles. Inventory is seen as waste; it represents tied-up capital, which could be utilized to
greater effect if it were not sitting on a shelf. Idol machinery and over staffing human capital
were seen as equally inefficient.
18
These ideal principles are achieved by commanding the inventory control process and
production, with the foresight of anticipating consumer demand for the product. However,
reducing unneeded inventory and simply controlling total outputs does not address or reflect the
Demming view of quality improvement. With lIT, the most likely oPPOltunity to improve on the
customer delight of the product is on-time delivery; early delivery of the product or service
offered to the customer is the extent of the potential improvement in this process management
approach.
lIT can be administered on management levels where buy-in for the entire organization is
not necessary, depending on the long term strategic planning of the organization. lIT does
require commitment from the top of an organization it does not require a workforce trained in
applying a celtain prescribed process to each task or duty. For Ohno (1988) the belief was
quality was sure to improve, considering there is just enough material to produce what is needed
and the worker would strive to get it right the first time knowing resources were limited in
availability. This had the potential of putting an undue stress on the line worker to reach this
goal, unaided by improvements within the system. Oil production and refinement are examples
in the influence of lIT principles appear to work will for an industry (Bongiorni 2004). The
downfall of this philosophy may be in the dependence of suppliers of material. In 1992 General
Motor's attempt at lIT was hampered by a railroad strike, which left idled a 70,000 workforce.

19
This vulnerable aspect of JIT, coupled with the fact that it may be hard to determine future
demand of a product made it largely ineffective for wide application in business and industry.
Six Sigma Six Sigma was developed at Motorola USA in 1981 (Telmant, 2001) as a methodology
to improve the quality of outputs by reducing the cause of defects and variations of products in
their manufacturing and business operations. This approach developed as a result of Motorola's
loss of television-set market share to the superior Japanese television manufacturer. Much like
Deming's statistically based TQM (Stamatis, 2004), Motorola's production methods are
statistically founded as well. One Sigma, as it is known in manufacturing, is a yield of 31 % in
defect-free products; Motorola's Six Sigma strives to meet an impressive 99.9966% defect-free
production goal. In every day terms it means this: 3.4 defects are found in one million customer
requested products (Long, 2010). For example, of the 3.2 million prescriptions written for
patients in the U.S. each year (Caplan, 2007), 7,000 deaths occur as a result of unreadable or
illegible writing on the part of the person writing the prescriptions. Here we can see numbers do
matter, the move to improvement has to be made and a sound process was needed to reduce
operational errors in areas other than manufacturing.
While an accuracy rate of99.999978% is laudable for many industries and businesses, it
is not accurate enough in the medical field. There is no significant statistical difference in these
elTor percentages year after year; this is an on going issue with the medical industry. The point
here is that numbers are not the only metric to measure customer satisfaction or safety. There are
times in which business and industry has to move beyond the numbers. To this end Motorola has
moved Six Sigma into 3 levels of their organization (Motorola University, 2010), as a metric, as
a methodology, and as a management system.

20
Six Sigma is more than a method of removing flaws often inherent in the manufacturing
process and thus the product. For Six Sigma companies the potential for process improvement
needs to be included in every business practice, including those jobs that are considered non
revenue producing. Six Sigma has been applied to business practices that appear to be
unconventional, such as properly filed paperwork, customer complaints, and even effectiveness
of solvents used in manufacturing to cleaning the corporate offices. Once indices and metrics are
developed they could be applied in broad application.
As quality management methods stand, Six Sigma shares the need for organization wide
buy-in, which is lead and supported by top management. FUliher, an organization will have
processes for business and manufacturing that are documented; they can be measured, analyzed,
improved shared, and even benchmarked. However, what sets Six Sigma apart from other
methodologies is the way in which leadership supports this philosophy, considering the (often
high) up front costs, the need to produce measureable and quantifiable financial retUl11 for a Six
Sigma project, use of ranked participants as change agents and finally the likelihood that
decisions will be based on data sets; to the exclusion of other information. This very prescriptive
approach requires an understanding of a statistical understanding to accountability; this is not an
approach, which lead to a quick financial retUl11 on problem solving. Further, to implement Six
Sigma an organization will either have to develop a belt-canying Six Sigma expert or obtain this
knowledge base from outside the organization. Most organizations do not have the resources or
the sustained 10ng-telID vision to accomplish this complex feat. However, this may be changing
as Six Sigma can now be seen expanding into sectors of business and industry where Six Sigma
application is an emerging trend (Edgeman & Dugan, 2008).
In the work titled, "Six Sigma from products to people to pollution," Edgeman and

21
Dugan (2008) assert the day has arrived for the Six Sigma concepts to move beyond the walls of
OEM's and into arenas that may not seem to fit the Six Sigma customer profile. While the
widely accepted approach of Define-Measure-Analyze-Improve-Control (DMAIC) or Design for
Six Sigma (DFSS) inherent to Six Sigma are similar to Deming's Plan-Do-Study-Act, they are
now taking on ethical issues in their application outside of manufacturing. Although historically
aligned to profit, the DFSS of Six Sigma may help in the advancement of genetic engineering,
for example, but what if prolonged life leads a company to payout benefits longer than they may
have before a certain discovery is made and implemented? This conundrum seems to be in
opposition of the fundamental assumption that statistics always provides the answer.
While Six Sigma has improved the situation of the recipients of such a discovery it may
not help the bottom line of the healthcare business applying this methodology, a double-edged
sword if you will. This may explain the need for an operations methodology where the statistics
are not weighed as heavily in consideration of the organizations objectives. While Six Sigma has
a focus on reducing variations on the production of a product and service through process
management, for some organizations more is needed on the organizational level.
Lean Six Sigma Six Sigma is not a process management approach that fits for all organizations. In an
effort to seek out a viable process improvement method, which fits the strategic objectives of an
organization, a combination of both lean and Six Sigma methodologies have been combined in
what is known as Lean Six Sigma. What qualifies Lean Six Sigma as a process improvement
method is the fact customer delight is seen as the preeminent goal. Statistical data is used to
identify and eliminate problems inherent in the production process and leadership and
employees have to buy into the philosophy. (George, Rowlands and Kastle, 2004). Lean Six

22
Sigma combines production objectives and customer satisfaction into one process.
The four critical elements in Lean Six Sigma are not significantly different than lean or in
Six Sigma. Process improvement, when evaluated shares many common attributes. Customer
delight, improvement to the processes, teamwork of individuals based in different departments
through out the organization, and their decisions that are data-based, and leadership at the top of
the organization in support of the methodology (George, Rowlands & Kastle) are foundations to
the Lean Six Sigma philosophy.
Today's consumers are under siege with the amount of products and services offered
from the global marketplace. No longer does Motorola just a cell phone to consumers, they offer
117 models in their attempt to prove they understand customer delight (Motorola University).
Gone are the days were business produced just what an engineer recommended, or what the boss
wanted to see and when the boss wanted to see it. Customers have the ability to shop in the
international marketplace, the Internet, and select the product at the price where they find
consumer value resides as they define it. Lean Six Sigma ensures that the first question that is
asked is asked in the customer's behalf. The manufacture has to consider the "Voice of the
Consumer" (VOC) when operating in today's highly competitive business environment. Defects
no longer have to be tolerated; this is a different than the time were at the time when only 1 or 2
OEM's of a product served the world.
Determining what is a defect and how to reliably measure them is an impOliant step for
any provider of goods or of a service. For one business it may be helpful service, for others it
may be timely shipping of a product that delights the customer. Each organization needs to
understand how the customer expectations have a perception on value. Value is impOliant for the
customer, not just during improvement projects but at all times that the goods and services are

23
out in the public domain. Organizations utilizing Lean Six Sigma try to uphold this concept as a
key premise to their operations. Once an organization gains an understanding of the customer
they then have to evaluate their process to meet the covenanted customer delight benchmark.
Trial and error are no longer the accepted approach to process improvement. Customer
expectations are often too high for a new product or technology; they want it to work right the
moment it comes off the shelf. Reducing variations or defects in the products or services is the
key tenant in the Six Sigma approach. In their book "What is Six Sigma," George, Rowlands,
and Kastle (2004) offer a case study (p. 27) as an example of the lean attributes to demonstrate
how the 2 are tied together. Six surgeons were performing similar bypass surgeries; each
requested a surgical tray that reflected their own approach to surgery. That required six different
trays prepared for six different surgeons. By assembling all the surgeons in one room the topic
was explored as to why each surgeon a distinctly different set of tools for the same procedure. As
the surgeons reflected on this question it was evident there was a methodology to examine their
various needs. Considering the fact there was statistical evidence that proved there was a benefit
to the patients in having 6 different surgical trays the doctors agreed to a standardized surgical
tray. By applying these tools, reduction in the variation of services offered (Six Sigma) along
with the process thinking (lean), Stanford hospital was able to reduce costs $25 million and at the
same time reduced mortality from 7.1 % down to 3.7% in the cardio depaJ1ment.
This example demonstrates that Six Sigma requires skill sets in two different abilities to
implement this methodology. First is the statistical analysis of all the aspects of the business that
can be identified and measured, The second skill set needed is the ability evaluate the process
and the work flow of an organization. The change agents needed to bring this about are trained in
the same manner as Six Sigma; green belts are the lower level where information is generally

24
collected and analyzed. The black belt has the responsibility for the project overall. These
certifications are earned tlu'ough a comprehensive training program which may be offered in-
house, by outside consultants and finally, at colleges and universities.
Theory of Constraints As lean has emerged as a product Toyota Production System, the Theory of Constraints
(TOC) evolved out of the previous work of Eliyahu Goldratt PhD. Optimized Production
Technology was an attempt by Goldratt to address the needs of industry and an attempt to
enlarge the production capacity of any manufacturer tlu'ough a process reliant on his software
application. Disappointed by the fact his idea never came into fruition Goldratt followed up his
software with a book entitled Goal (Goldratt & Cox, 1986), which explored the idea of
constraints and bottlenecks; a constraint is anything that prevents a producer from reaching their
capacity. A "bottle neck is any resource whose capacity is equal to or less than the demand
placed upon it. The maximum speed at which a producer can manufacture goods is related to the
slowest operation within the system. A non-bottleneck is any resource whose capacity is greater
than the demand placed on it " (Goldratt & Cox, p. 139). When considering the capacity of a
manufacturer to produce their product Goldratt evaluates tlu'ee areas he believes effects
production. The first is tlu'oughput, this is seen as a goal in the number of units to produce or the
money generated from producing these units; secondary is the operating expense. This category
looks at how much money it will cost to produce given the number of units. And finally,
inventory is the money the company has to invest in order to meet the tlu·oughput. In order the
measure these 3 areas consistently Goldratt has developed 5 steps to evaluate any given
production process (page 301):
Step 1. Identify the system's bottlenecks.

Step 2 Decide how to exploit the bottlenecks.
Step 3 Subordinate everything else to the above decision.
Step 4 Elevate the systems bottlenecks.
Step 5 If, in a previous step, a bottleneck has been broken go back to step 1.
25
There is not a limit, minimum or maximum to the number of constraints an organization
can face . These constraints may be internal, not being able to meet the demand of the consumer;
it may be external as well. An example of external constraint is when production exceeds
consumption. Goldratt has updated his earlier work and now includes the notion of a Thinking
Process as a way to not only manage a production process but also manage the system. With this
updated model Goldratt asserts the real power to effectively and efficiently bring about change
within an organization are (Goldratt Institute, 2009 p.9) :
• Understanding the interdependencies between and across processes that contribute to
delivering a product or service,
• Understanding the impact that those interdependencies and normal variability have on
their cOlnbined, overall performance, and
• Appropriately buffering for interdependencies and normal variability so that that
performance can be predictably and consistently high.
The TOe Thinking Processes utilizes logic trees to provide a plan for change. The
process guides the organization through the decision making of problem structuring, problem
identification, solution building, and identification of bottlenecks to overcome, and finally the
implementation of the solution. Goldratt claims once organizational leadership adopts his

26
methodology the producer will be able to address any sudden shift in the marketplace (Goldratt
Institute). However, this operational strategy appears limited in both scope and metrics when
compared to lean, Six Sigma and Lean Six Sigma methodologies. It appears to focus on a few
individuals within an organization having the vision and values to affect the outputs of the
organization. This approach cannot be seen as needing organization wide by in. In the three
operational and quality improvement methods already explored in this work TOC does not have
the holistic vision lean or Six Sigma produce for an organization. TOC does not address the
value-added process to ensure customer delight many of today's OEM's believe is necessary in
the increasingly global marketplace.
The theories behind the concept of bottlenecks are not a product of Eliyahu Goldratt
alone. The idea in which production will only be as strong as the weakest link of the supply
chain/operations was explored greatly in the Just in Time operational philosophy (Olmo).
It is clear from the literature reviewed for this research lean offers the best balance of
supply chain logistics, production methodology and overall operational strategy of all the process
management philosophies in existence today. It can be a holistic approach for an organization to
reduce what is not need to bring delight to the customer. Lean has also displayed the ability to
move beyond serving the OEM's of the world. Furthetlliore, Gary Conner, author of Lean for the
small shop, (2001) makes the case for the use oflean; it is time to expand the limits of lean to
just OEM's. The practices are scalable to the smallest shops, offices and the small businesses in
America today.

27
Chapter III: Methodology
Research was conducted to asceliain the number and scope of businesses and
organizations utilizing lean where graduates of the University of Wisconsin-Stout (UW Stout)
are currently employed. A convenience survey was conducted with graduates of the Business,
Business Administration and Engineering Technology programs from the years 1995 through
2009. The research for this study was to determine if the Business, Business Administration and
Engineering Technology programs at the UW Stout should expand their capacity to offer lean
methodology related courses. This chapter will describe how subjects selection and description,
the method of constructing the instrument, the data collection procedures, how the data was
analyzed and finally, the limitations of this research.
Subject Selection and Description
To investigate the number of businesses and organizations practicing in lean concepts a
sample group for a qualitative study was drawn from graduates holding a Bachelor of Science
degree from the University of Wisconsin-Stout. The subjects in this research graduated in the
years 1995 to 2009 from the Business, Business Administration and Engineering Technology
programs within the College of Operations and Management at the university. This population of
undergraduates had the opportunity to enroll in process improvement related course work while
attending the University of Wisconsin-Stout.
Instrumentation
The anonymous survey constructed for this research was developed following the
discovery in the lack of a reliable data on the number of business and organizations utilizing lean
practices. A need to investigate trends relating to lean was also apparent as the investigation for
the construction of the instrument took place. The instrument was designed to identify

28
organizations inside and outside of traditional OEM's employing lean principles. To effectively
utilize the data for future purposes it was critical to identify: which sectors of the economy use
lean, the number of people within the organization, where within an organization a process
improvement methods were utilized, and how long was the method in place. It was also
impOltant to research process improvement methods in place before an organization moved to
lean or away from lean practices. It was also important for the respondent of the survey to
convey their understanding of why lean may work for their organization as well as why lean may
not work for an organization. Equally impoltant was to understand why an organization would
move to adopt lean principles and what would keep an organization from implementing lean.
This study has been reviewed and the project is exempt under Category 2 of the Federal
Exempt Guidelines by The University of Wisconsin-Stout's Institutional Review Board ORB)
(Appendix B). The IRB has determined this study meets the ethical obligations required by
federal law and University of Wisconsin-Stout policies, IRB approval was sought to protect and
preserve the rights of the participants. All personal contact infOlmation was deposed at the
conclusion of the data collection.
Data Collection Procedures
An email was sent to 425 University of Wisconsin-Stout graduates inviting them to
participate the 18 question qualitative survey. One week later a reminder to paIticipant in the
survey was dispatched to the entire group. Participation in this anonymous online survey was
voluntary; the paIticipant had the right to stop the survey at any time. Participant confidentiality
was protected. Their selection and palticipation were not shared with other palties and all such
information relating to participants was destroyed at the conclusion of the data collection
process.

29
The respondent observed two decision points in the survey. One point explores lean as
the current process improvement strategy or process management where the University of
Wisconsin-Stout graduate was employed. In the same setting, the instance where lean was not
the cunent process improvement strategy; the respondent was asked to share their understanding
of why lean was not the current process improvement strategy or process management approach.
The respondents chose one decision point and proceed to share their knowledge of their
organization.
Data Analysis
The Research was conducted to ascertain the number and scope of businesses and
organizations utilizing lean where graduates of the University of Wisconsin-Stout were
employed. Considering no two qualitative surveys are the same each approach to their evaluation
will be different (Patton, 2002). However, using a through literature review and the data from the
survey, an evaluation was performed based on the prearranged goals for the research.
• Evaluate the number of organizations utilizing lean philosophies where University of
Wisconsin-Stout finds employment.
• Sectors of business and industry where is lean operated.
• Length of time lean been in use at the current employer.
• Why lean is working.
• If lean is not used, why not.
• What is process improvement strategy or process management is utilized in place of lean.
Coding of the data was done using NVivo Qualitative software through the Applied
Research Center at the University of Wisconsin-Stout. After all the data was collected and coded,
it was reviewed for revisions where needed. After all coding was completed; reports were
created to determine the frequency of the comments in each theme. Tables and figures were
created for each theme/subtheme containing frequencies.

30
Limitations
The subjects of this study are limited the undergraduates of the University of Wisconsin
Stout programs in Business, Business Administration and Engineering Technology from the
years running consecutively from 1995 to 2009.
Summary
a. The participation of respondents was voluntary.
b. The respondent had to know of the operational strategies of their employer, past
and present.
c. Recommendations are for the University of Wisconsin-Stout, it ' s programs,
Business, Business Administration and Engineering Technology and the College
of Operations and Management.
d. The findings in this studying are not predicted to be valid after 5 years.
A web-based survey was used to reach alumni of the University of Wisconsin-Stout. This
national investigation was intended to reveal both the industries and the sector of the business
where lean and other process improvement methodologies are practiced. An addition to those
goals, it is important to establish a benchmark at this time in order to understand trends that
develop as a result of future research into this topic.

31
Chapter IV: Results
The intention of this chapter is to report the findings of the eighteen question instrument
sent out to Stout graduates in business and industry. At the third question, "Do you cUlTently use
lean as a strategy within your organization?" a decision point is created. If a respondent replies to
the question in the affirmative, the subject is directed to one set of questions illuminating the
practices oflean principles within the paI1icuiar organization. If the respondent replied that lean
was not used, the respondent was directed to a different set of questions than those, which replied
in the affirmative. The rational for the approach was to understand ifthere is a shift away from or
towards lean and to understand what other process management techniques exist in the
organizations where graduates of the University of Wisconsin-Stout work.
Data Analysis
The first question in the survey was constructed to ascertain the specific sector of a
business or industry the Stout graduate was employed within. When the question as asked,
"Describe the business or industry that best describes your organization," 100% of respondents
selected an option; there is a clear understanding of the cross section of opportunities for Stout
grads.
Table 1
Select the business or industry that best describes your organization.
Response Frequency (N=78) Percentage
Manufacturing 31 38%
14
I
17%
- - --- . - .- - _. 8
I
10%
InsurancelFinancial
Hospitality/Tourism
- - --
6 1- 8% Retail

32
- . - -
Distribution 5 7%
Technology 5 7%
Medical 4 6%
Service 4 6%
Food Production 1%
The second question was focused the number of employees in the organizations where
Stout students were working. The size of an organization may speak to the notion of how fast
change can occur within an organization, or how responsive that organization might be to
adapting to new methodologies. The finds reflect there are more small and large firms utilizing
lean methods, however, around 10% of the sampled population works in the mid-range size of
organizations; just under half of the respondents work in large organizations.
Table 2
How many people are in your organization?
Response Frequency (N=78) Percentage
1-10 8 10%
11-25 9 11% L _____ _ I 26-50 4 5%
51-100 5 6%
101-500 16 21%
More than 500 37 47%

33
Organizations where Lean is utilized
The survey addresses one of the principle questions of this investigation, which was, "Do
you cUlTently use lean as a strategy within your organization?" The effort was to quantify the
number of employers utilizing lean, a question which lacked sufficient evidence and lead to this
research. Any recommendations to result out of the research would be expressed based on the
findings. Clearly, lean is practiced in about half of all the employers of students from the
Business; Business Administration and Engineering Technology programs sat the University of
Wisconsin-Stout.
Figure 1
Do you currently use Lean as a strategy within your organization?
Yes
No
It is not only important to know how many employers utilize lean methodologies, but
where, within an organization lean is practiced; question 4 sought to answer that. This reflects an
effOli to understand which aspect of an organization can benefit from this process management ·
approach. A majority of replies stated the use of lean throughout the entire organization. This
opposes the idea lean is limited to the production aspect in business and industry.

34
Table 3
Within your organization, where do you employ lean?
Response Frequency (N=31) Percentage
Top to Bottom 19 61%
Production 8 26%
-Supply Chain 3 10%
Industrial Engineering 3%
The fifth question of the survey, results reflected in Table 4, addresses how long lean has
been practiced in the corresponding organization. Stout graduates reported 52% of their
employers have made commitments to lean for 5 or more years. While the remainder, 48% have
implemented lean in the last 5 years or less; 29% of respondents have seen lean come online in
their organization since 2008. The data shows the slight decline in the use of lean principles in
the last 3-5 years, however the numbers of organizations putting lean into practice is beginning
to increase once again.
Table 4
How long has your organization used lean?
Response Frequency (N=31) Percentage
Ten years or more 3 10%
Five to ten years 13 42%
Three to five years 6 19%
r _ • • _.~ . -- - -
Two years 3 10%
One year 3%
Less than one year 5 16%

35
ImpOliant to any organization for the methodologies selected for process management is
profit or a return on investment (ROI) for an organization, lean is no exception. When asked,
"Has lean given your organization a return on its investment?" In Table 5 Stout graduates
reported they strongly agreed, at a rate of 39% of the time, that lean had provided a return on
investment to their organization. Those that would agree to the statement are slightly higher at a
rate of 42%. While 16% of respondents could not confirm if lean lead to a profit of a loss, it is
clear for 81 % of those polled, their organization have receive a financial benefit for establishing
lean as their method of process management.
Table 5
Lean has given our organization a return on our investment in iI.
Response
Strongly agree
Disagree
Neither agree or disagree
~ Agree
Strongly agree
Frequency (N=31)
o
5
13
12
Percentage
3%
0%
16%
42%
39%
Not all organizations started with lean as a way to reduce waste, improve efficiencies,
and maximize customer delight. Some organizations tried the statistical-based model introduced
by Demming in the last century; Total Quality Management was attempted by 13 % of employers
of Stout graduates before moving to lean. Toyota's Just-in-Time principles were applied injust
6% of organizations surveyed. The highest rating of this category went to Motorola's Six Sigma;
29% of the locations Stout graduates were employed at use the variation-control process

36
management method. For some employers, 29%, lean is the first recognized attempt at a process
management solution, having not tried any other methodology previously. It appears that 16% of
respondents utilize a multi-method approach to process management. One Stout graduate
observed both Total Quality Management and Theory of Constraints employed in their
workplace, at the same time. Others repolied the use of Six Sigma in one area of the organization
while at the same time utilizing Just-in-Time concepts for a competitive edge. One Stout
alumnus indicated that "several tools from multiple strategies" were implemented in their place
of work; this demonstrates a "cafeteria" approach where one picks and chooses from all the
options available, based on what they want out of each operational strategy.
When asked, "what brought your organization to lean?" 42% of those polled responded
that it was a management decision to move to lean practices some where within their
organization. Streamlining a process was the motivation of moving to lean for 26% of
organizations. The choices of the reputation of lean, a management decision, too many
operational enors, to reduce waste, streamline process and the recommendation of a consultant
were all the reasons for 7% of the sampled population to accept lean as their organizations
operational strategy. Because lean addresses all of the considerations stated above, leans
reputation lead 6% of those examined to use lean in day-to-day operations. While lean is known
for its ability to reduce waste, it was only 10% of the population that admitted it as the single,
most impoliant reason for the move to lean.
The move to lean is intended to produce a benefit to an organization. When the use of
lean had ended for an organization this research attempted to understand the issues sunounding
the decision to move away from lean practices. Of those responding to this question on the
survey 50% of respondents believed it was not the COlTect organizational fit. There were 20%

that responded that when current management left, so did the lean practices within the
organization.
Figure 2
Select the benefits your organization realized in its use of Lean
37
40% ,------------------------------------------------------------------------
30% +----------------------------------------------------------------i
20% +-------------------------------------------,---~-----
10% +-------------------------------------------;
Greater teamwork
across organization
Increase production
When Lean is not utilized
Reduction of Reduced Reduced waste Increased All of the above errors redundancy profits
As stated above, 52% of respondents indicated that lean was not in use at their respective
place of employment. Of those employers where University of Wisconsin-Stout were employed,
half of the aforementioned respondents had observed no process management approach was in
place. It is fair to conclude from the statistical analysis that only 25% of all employers examined
in this research do not use any fOlmal, planned, or measurable approach in how their employers
conduct their operations. Six Sigma is clearly the second choice in the workplace; for those
polled, 20%, have selected Six Sigma as their pre felTed operation strategy. Total Quality
Management and Just-in-Time shared equal usage in non-lean use at ten percent. Three
respondents failed to indicate which operational strategy, other than lean, was in place at the

38
employer. Lean Sigma was intentionally left off the list of options to choose from . Those that did
utilize lean would have answered a different set of questions based on how the decision point
was placed early in the survey.
There were organizations which had implemented lean in their past, but had moved to
another operational strategy. Half, 50%, of those that had implemented lean, had moved on to
Six Sigma as their operational strategy. While 17% have accepted Just-in-Time as the new
approach to conducting business. The length of time lean was in use in organizations where Stout
graduates work is informative. Employers that no longer use lean principles had stated, at a rate
of 17%, that lean was used for 3 to 5 year time period before the use of lean had ended.
However, the majority, 83%, stated that lean was only in practice for one year or less before its
discontinuance. To attempt to understand why lean may not have worked for certain
organizations, respondents replied 5% of the time that lean was too complex. On a similar track
50% of those polled stated that lean was not a con-ect fit for the organization that had moved
away from lean principles. When management changed so did the process management approach
according to 4% of the population; it appeared lean left with the management that support it.
In examining the reasons why an organization may not be seeking a lean advantage, the
sample group, as displayed in Figure 3, stated 52% of organizations lack the knowledge to utilize
lean. While the lean philosophy states that anything that does not add value to the customer is
waste and, thus, should be eliminated, 22% of respondents stated there was no value in
implementing lean. Too implement lean would have been too complex of a process management
philosophy to practice, according to 13% of those polled. That figure comprises a 65% segment
of organizations that have either no knowledge of lean of believe it is too complex to implement.
For organizations not using lean, 9% believed they would not know when they are "there";

meaning the outcomes or justification for the use of lean are not easily identifiable. A small
percentage, 4%, believed the successes of Jean methods are yet unproven.
Figure 3
Reasons an organization may not use Lean
60% ~---------------------------------------------------------
52% 50% +--------------------------------------------------r--~
40% -r-------------------------------------------------~
30% ~-------------------------------------------------~
22% 20% +--------------------------------------f---,------~
13% 9%
10% +---~~M------------------~
0% +--------'--
Success is unproven
Won't know when "there"
Too complex Don't see value in No knowledge of Lean Lean
A Look at University of Wisconsin-Stout Graduates
39
The largest segment of respondents, 74%, identified themselves as undergraduates with a
degree in General Business Administration. The next largest population, 16% had graduated
Stout with an undergraduate degree in Engineering Technology; 9% of those polled did not
identify which program they had graduated from.
When asked how the alumni ofthis survey believed the University of Wisconsin-Stout
had prepared them for an organization interested in lean, 5% strongly disagreed with asseltion
they were prepared. Almost in balance with those graduates, 3%, that strongly believed
University of Wisconsin-Stout had prepared them for lean practices in business and industry. An
additional 20% of respondents disagree with the premise that they we prepared to practice lean, a
40
smaller percentage compared to the 23% that did agree the University of Wisconsin-Stout had
prepared them for lean in the workplace. However, 49% of those surveyed took a neutral
position and stated they neither, agree with or disagree with the question pertaining to the
question asking if the University of Wisconsin-Stout had prepared them well for lean in business
and industry.
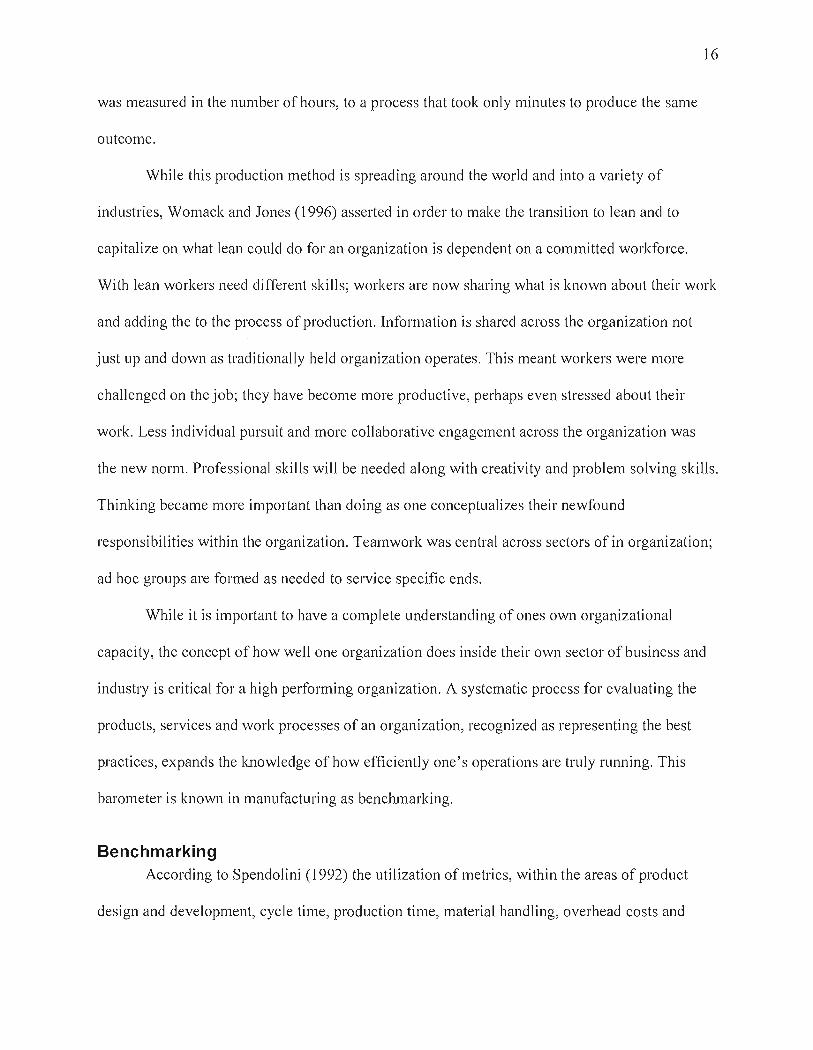
When University of Wisconsin-Stout graduates were asked how Stout could or should be
preparing students for lean in business and industry their insights can be seen in Table 6.
Table 6
In }Fhat way could or should UW Stout be preparing graduates to utilize lean in industry.
Response Frequency (N=57) Percentage
More classes on lean 33 58%
Co-ops and internships 36 63%
On campus workshops 24 42%
Guest speakers 19 33%
It is clear that the graduates of the University of Wisconsin-Stout have clear ideas on
their preparation for work in business and industry. Their views reflect a hands-on approach to
learning about lean. The possibility of working in an organization where lean principles are
currently practiced was seen as the greatest opportunity to bring that knowledge forward. A
greater concentration of classes focused on lean was also important to a majority of respondents.
While a large minority believed their knowledge, skills and ability of using lean would improve
with workshops and guest speakers on campus.

41
Chapter V: Discussion
To determine the number of organizations utilizing lean as an operational strategy or
process management, where University of Wisconsin-Stout graduates work, a convenience
survey was conducted among graduates of the Business, Business Administration and
Engineering Technology programs from the years 1995 through 2009. The investigation was to
assist in determining the scope of the use of lean within an organization and if there has been an
identifiable trend in the increase or decrease of the use of lean and how to prepare students to
meet the needs of business and industry.
Limitations
The subjects of this study are limited the undergraduates of the University of Wisconsin
Stout programs in Business, Business Administration and Engineering Technology from the
years running consecutively from 1995 to 2009.
a. The participation of respondents was voluntary.
b. There is no way to confirm the responses to the survey.
c. The respondent had to know of the operational strategies of their employer, past
and present.
d. The findings in this studying are not predicted to be valid after 5 years.
Conclusions
This work examined operational strategies other than lean, which are in place in business
and industry. Some operational strategies focus specifically at the supply chain .TIT, for example.
There was also production methodologies (TOe) used conjunction with supply chain practices
(.TIT) in places where graduates of Stout worked. Both TQM and Six Sigma are centered on the

42
elimination of variations in production was also practiced among those surveyed. Even the
blended methodologies of Lean Six Sigma which is focused on the improving organizational
efficiencies through the practice of eliminating variations in production and the elimination of
any process that does not add value to the customer was popular in organizations surveyed. Six
Sigma and Lean Six Sigma requires highly trained individuals specializing in the analyzing of
data; this approach requires individuals committed to the process and may not have another
function . within the organization. Lean does not require the level statistical evaluation Six Sigma
requires, which may be one of the reasons lean is in place in 48% of respondents work. It is
easier to employ within an organization and the stmi-up costs are not as great as the cost of
implementing a Six Sigma strategy (George, Rowlands and Kastle). Lean offers what may be the
most widely adaptable approach to process management applicable to modern production
methods to be seen to date.
Recommendations
Lean is the most widely applied process management methodology in place for working
graduates of the University of Wisconsin-Stout. Of the organizations investigated, 20% utilized
Six Sigma while TQM along with JIT both experienced a rate of implementation of just 10%
each. When compared to 48% of respondents stating lean practices where in use, lean is
practiced at a rate that is more than twice as large as the nearest alternative methodology. Lean
usage appears to be on the increase in the last several years. In the last five years 48% of those
surveyed stated lean had been implemented. Those repOliing, 52%, state lean has been a part of
their organizations philosophy for five years or longer. It is also import to note that while 61 % of
organizations use lean through out their entire organization, 26% of organizations found it

43
beneficial to the production side of the organization. Only 10% of respondents claimed the use of
lean was limited to the supply chain management.
As a result of this study there is reason to believe that further research into the process
management practices of employers where University of Wisconsin-Stout graduates are
employed should continue. The first consideration for this recommendation is to help identify
trends in business and industry as it relates to what operational strategies many University of
Wisconsin-Stout graduates may experience in the workforce. The second consideration is to
advise the University of Wisconsin-Stout as to the forecasted need for education of lean
principles graduates will need when they enter the workforce. While there is a clear need for the
University of Wisconsin-Stout to continue or increase the number of lean related course
offerings, respondents have identified the oppol1unity of increased co-ops and internships as vital
to their understanding and preparation to practice lean in business and industry upon graduation.
Only slightly less significant was the need for more or more extensive classes on lean. This
would address the needs of 85% of respondents that don't use lean; stating their organizations
lack a working knowledge oflean, that it is too complex or don't see the value to their
organization to implement lean. It appears the recommendation of those surveyed would
decrease the lack of understanding and knowledge for the application of lean in their respective
organizations. When Stout graduates contribute to the success of an organization through their
knowledge and application of lean principles it not only increase the value of the graduate to the
employer, but to the University of Wisconsin-Stout in its attempt to meet the needs of business
and industry.
The survey respondents revealed there are benefits to the utilization of lean within the
place of their employment. If students have a working and applicable knowledge oflean it may

44
increase their opportunity for employment. This claim is substantiated by the fact that those
organizations that employ lean practices, 81 % have claimed to receive a return on the investment
for implementing lean. As Figure 2 revealed, there are many benefits for the use of lean in
business and industry. The University of Wisconsin-Stout can play an impOliant pati in preparing
individuals for the practice of lean. If a Stout graduate has the knowledge, skills and ability to
lead an organization to reduce errors in production, reduce waste and increase profits, the
demand for their services will be in demand. Thus the demand for University of Wisconsin-Stout
students will increase in business and industry.
It is clear that process management is a way to success for a globally completive
organization. This research proves lean experiences the widest application of process
management methods applied today, where graduates of the University of Wisconsin-Stout
graduates work. Lean is seen in organizations of various sizes and in various sectors of the
economy. To meet the needs of organizations moving to lean or already utilizing lean practices
the University of Wisconsin-Stout serves a critical role. The exposure to lean for students outside
of business administration and engineering technology is becoming increasing important based
on the results of this survey. My hope is this research leads the University of Wisconsin-Stout to
evaluate the needs of business and industry and offer the students of Stout an education rich in
applicable lean practices in preparation of their employment in a variety of areas around the
world.

References
Aguayo, R. (1991). Dr. Deming: The American who taught the Japanese about quality.
Fireside: Whitby, Ontario
Becker, J., Kugeler, M. & Rosemann, M. (2003). Process management. New York: Springer
Publishers
45
Bongiorni, S. (2004). All in the timing. The Greater Baton Rouge Business Report. 19 July 2004
Caplan, J (2007). Cause of death: Sloppy doctors. Time. Retrieved from
http://www.time.com/time/healthiarticle/0.8599.1578074.00.html
Conner, G. (2001). Lean manufacturing for the small shop. Dearborn, Michigan: Society of
Manufacturing Engineers
Edgeman, R. & Dugan, G (2008). Six sigma from products to people to pollution. Total Quality
Management. 19(1-9)
Emiliani, B. Stec, D., Grasso, L & Stodder, J. (2007). Better thinking, better results: case study
and analysis of a enterprise-wide lean transformation. Center for Lean Business
Management, ISBN 978-0-9722591-2-5
George, M., Rowlands, D. & Kastle, B. (2004). What is lean six sigma? New York:
McGraw-Hill
Goldratt, E. & Cox, J. (1986). The goal: a process of ongoing improvement. Hudson, NY: North
River Press
Goldratt Institute (2009). The theory of constraints and its thinking processes. Manuscript
submitted for publication.
Hirano, H. & Makota, F. (2006). JIT is flow: practice and principles of lean manufacturing.
Vancouver, W A: PCS Press Inc.

James, T. (2005). Stepping back from lean. Manufacturing Engineer, 84 (1) p. 16-21
Johnson R., Kast, F. & Rosenzweig, 1. (1973). The themy and management of systems. New
York: McGraw-Hill
Kerschberg, L. and Jeong, H. (2005). Just-in-time knowledge management. Retrieved from
eceb.gmu. edu/pubs/JIT _ KM_ Kerschberg_Jeongpd!
Krafcik,1. (1988). Triumph of the lean production system. Sloan Management Review, 30(1)
p.41-52
Long, 1. (2010). What is lean? Manuscript submitted for publication.
Motorola University (2010). What is six sigma? Retrieved from
http://www.motorola.com/BusinessIUS-EN/Motorola+University/Six+Sigma+Articles
Ohno, T. (1988). Toyota production system. New York: Productivity Press
Patton, M. (2002). Qualitative research and evaluations methods. Thousand Oaks, CA: Sage
Publications
Spendolinni, M. (1992). The benchmarking book. New York: AMACON
46
Stamatis, D. (2004). Six sigma fundamentals: a complete guide to the system, method and tools.
New York: Productivity Press
Tennant, G. (2001). Six sigma: spc and tqm in manufacturing and services. Aldershot, UK:
Gower Publishing
Thorn, W. (2009). People, process, and petformance management in project management.
Retrieved from http://www.pmhut.com!people-process-and -performance-management -in
proj ect -management

Womack, J ., Jones, D. & Roos, D. (1990). The machine that changed the ."orld. New York:
Simon & Schuster
Womack, 1. & Jones, D. (1996). Lean thinking. New York: Simon & Schuster
Womack, 1. & Jones, D. (2005). Lean solutions. New York: Free Press
47
48
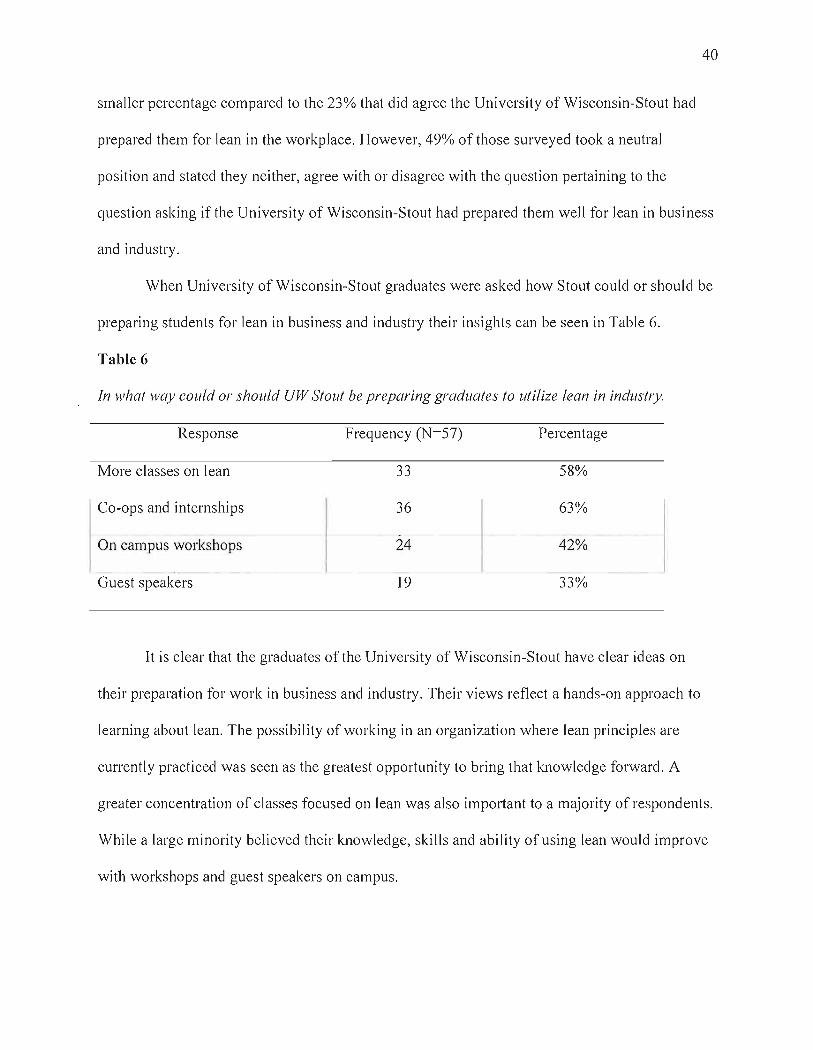
Appendix A: Survey Invitation
Greetings Fellow Stout Alum:
My name is Tom Harvey and I am currently pursuing a graduate degree at UW-Stout. I am researching Lean as a management strategy across the spectrum of business and industries represented by Stout graduates. Even if your organization does not currently use Lean there are questions in the survey for you as well. This, less than 5-minute, survey will allow post-secondary institutions, such as Stout, to improve their educational priorities based on your input into this research; so please participate now.
You can double-click on the provided link to complete the survey, if necessary you may copy & paste the link into your Internet browser to connect to the survey. Your participation in this study is entirely voluntary. You may choose not to participate without any adverse consequences to you. If you complete the survey I will provide you with the results of my research , just email for a copy at the completion of the research.
This survey will terminate in 15 days so your quick action is vital to this research. Feel free to contact me at (715) 456-3623 cell, (715) 232-1145 office or by email at [email protected] if you have any questions or ideas pertaining to my research; any input is welcome. Thank you for your valuable time. Go Blue Devils!
This project has been reviewed by the UW-Stout IRI3 as required by the Code of Federal Regulat ions Title 45 Part 46

/~;::::;STO UT
Date:
To:
From:
f, I 11
152 Voc Rehab Buildmg
UnivclsityofWiscof)<;in StOlit P.O. [lo, 790 tv1mlOIllOJHC, WI 5·1751 0700
7151232·1126 7151232·1749 (fax) !..l!..t l) It ... .,, ',",'·.·) I'V)', l o ll! c ll u ! r~ :
Appendix B: IRB Exemption
December 16, 2009
Thomas Harvey Jim Keyes
Sue Foxwell, Research Administrator and Human ~6UJ y~~ Protections Administrator, UW -Stout Institutional Review Board for the Protection of Human Subjects in Research (IRB)
Subject: Protection of Human Subjects in Research
49
Your project, "Lean Manufacturing in Business & Induslly " is Exempt from review by the Institutional Review Board for the Protection of Human Subjects. The project is exempt under Category 2 of the Federal Exempt Guidelines and holds for 5 years. Your project is approved from December 14,2009, through December 13,2014.
Please copy and paste the following message to the top of your survey form before dissemination:
[I.T=h=iS=. p=ro=~c=ct=h=as=b=c=cn=r=CY=ic=W=Cd=b=Y=t1=lc=U=W=-=S=to=ut=IR=B=as=rc='q=ui=rc=d=b=Y =th=c C=o=d=c =of==;
Federal Regulations Title 45 Part 46 I I L-__________________________________________ ~
If you are conducting an online surveylinterview, please copy and paste the following message to the top of the form:
"This research has been approved by the UW-Stout IRB as required by the Code of Federal regulations Title 45 Part 46."
Please contact the IRB if the plan of your research changes. Thank you for your cooperation with the IRB and best wishes with your project.
*NOTE: This is the only notice you will receive - no paper copy will be sent.

50
Appendix C: Survey Results
1. Select the business or industry that best describes your organization.
# Answer Response % 1 a. Distribution 3 4%
2 b. Food Production I 1 1%
3 c. Hospitality/Tourism 7 9%
4 d. Manufacturing 26 33%
5 e. Medical 5 6%
6 f. Retail 6 8%
7 g. Other 30 38%
Total 78 100%
g. Other # Statistic Value
Financial Services / Banking 6 Mean 5.14
Insurance 6 Variance 3.06
Technology and professional services 3 Standard Deviatio n 1.75
Facility Services 2 Total Responses 78
Aerospace 1
Center for Applied Ethics 1
Construction 1
Distribution/Manufacturing 1
Electrical 1
Government 1
Health Fitness Clubs 1
Multifamily/Real Estate 1
Paper Converting 1
Railroad Transportation 1
Real Estate Development 1
Sawmill for log home company 1
Software / Consulting 1
Wholesale-giftware 1

2. How many people are in your organization?
# Answer Response % I 1-10 8 10%
2 11-25 9 12%
3 26-50 • 4 5%
4 51-100 • 5 6%
5 101-500 • 16 21%
6 More than 500 37 47%
Statistic Val ue Total Responses 78
3. Do you currently use Lean as a strategy within your organization?
# Answer
1 Yes
2 No
Total
Statistic Mean
Variance
Standard Deviation
Total Responses
Response % 41 48%
44 52%
85 100%
Value 1.52
0.25
0.50
85 -
51

4. Within your organization, where do you enlploy Lean?
# Answer Response
1 a. Production/Operations I 8
2 b. Supply Chain 3
3 c. Industrial Engineering 1
4 d. Transpoliation I 0
5 e. Top to bottom 19
Total 31
Statistic Value Mean 3.61
Variance 3.31
Standard Deviation 1.82
Total Responses 31
5. To the best of your knowledge how long has your organization used Lean?
# Answer Response 1 Ten years or more - 3
2 Five to ten years 1 • .",,- .. '''" ;.:. ..... ""''''_ 13
3 Three to fi ve years -' - l 6
4 Two years 3
5 One year 1
6 Less than one year 5
Total 31
Statistic Value Mean 3.03
Variance 2.57
Standard Deviation 1.60
Total Responses 31
% 10%
42%
19%
10%
3%
16%
100%
52
% 26%
10%
3%
0%
61%
100%

53
6. Lean has given our organization a return on our investment in it. State your understanding of this statement.
# Answer Response % 1 Strongly Disagree 1 3%
2 Disagree I 0 0%
3 Neither Agree nor 5 16%
4 Agree r~ ',11 •• 13 42%
5 Strongly Agree ,.i.c_' '~"'-I 12 39%
Total 31 100%
Statistic Value Mean 4.13
Variance 0.85
Standard Deviation 0.92
Total Responses 31
7. What, if any, was your operational strategy before moving to Lean?
Answer Response % 1 a. None r·," " 9 29%
2 b.TQM 4 13%
3 c. Six Sigma ~. 9 29%
4 d. Just In Time • 2 6%
5 e. Lean Sigma I 0 0%
6 f. TOe Manufacturing I 0 0%
7 g. Other I 7 23%
Total 31 100%
I g. Other

Not positive - know that other methods were used, though
Tools from mUltiple strategies still incorporated today.
Both Band F
Depends on the area, we use Six Sigma and Just in Time also
All Above
VMr
Statistic Value Mean 3.26
Variance 5.06
Standard Deviation 2.25
Total Responses 31
8. If you do not utilize Lean, select your current operational strategy?
# Answer 1 a. None
2 b.TQM
3 c. Six Sigma
4 d. Just In Time
5 e. TOe Manufacturing
6 f. Other
Total
f. Other N/A
Response 15
3
6
3
0
3
30
Statistic Value Mean 2.30
Variance 2.70
Standard Deviation 1.64
Total Responses 30
9. If your organization has moved away from Lean as an operational strategy what are you currently using?
% 50%
10%
20%
10%
0%
10%
100%
54

# Answer Response %
1 a.TQM 0 0%
2 b. Six Sigma 3 12%
3 c. Just In Time 1 4%
4 d. TOe Manufacturing 0 0%
5 e. Never used Lean 20 77%
6 f. Other 2 8%
Total 26 100%
f. Other N/A
Statistic Value Mean 4.65
Variance 1.20
Standard Deviation 1.09
Total Responses 26
10. To the best of your knowledge, if your organization has used Lean in the past, how long was it employed?
Answer 1 Ten years or more I
2 Five to ten years I
3 Three to five years
4 Two years I
5 One Year I
6 Less than one year
Total
Statistic Mean
Value 5.50
Variance 1.50
Total Responses I 6 I
Response % 0 0%
0 0%
1 17%
0 0%
0 0%
5 83%
6 100%
I Standard Deviation I 1.22 I
55
11. If your organization does not use Lean select the reason it does not.

56
# Answer Response %
a. Too expensive 0 0%
2 b. No knowledge of Lean . -."-!.- - • '....:. r,ta 12 52%
3 c. Too complex 3 13%
4 d. Success is unproven 1 4%
5 e. It is just "the latest thing" 0 0%
6 f. Won't know when we are 2 9%
7 g. Did not see a value in it 5 22%
Total 23 100%
Statistic Value Mean 3.65
Variance 4.60
Standard Deviation 2.14
Total Responses 23

12. What brought your organization to Lean?
# Answer 1 Leans reputation
2 Management decision
3 Too many operational
4 Reduce waste
5 Streamline processes
6 Recommendation of
7 Other -Total
Other Has always been part of our culture.
All of above
Management, reputation, operational elTors, reduce waste.
All of the above
Economy
Statistic Value
Mean 3.71
Variance 4.01
Standard Deviation 2.00
Total Responses 31
57
Response % 2 6%
13 42%
0 0%
3 10%
8 26%
0 0%
5 16%
31 100%

58
13. Select the benefits to your organization has realized in its use of Lean.
# Answer Response
Increase in production 2
2 Reduction of errors 2
3 Reduced waste 5
4 Reduced redundancy 2
5 Increased profits 7
6 Greater team work across
7 Other 12
Total 31
Other All of above
Several of the above (reduced waste, redundancy, increased production efficiency,
All of the above on various projects
None yet
Statistic Value Mean 4.97
Variance 4.03
Standard Deviation 2.01
Total Responses 31
%
6%
6%
16%
6%
23%
3%
39%
100%
8

59
14. Describe your understanding of why Lean may not have worked within your organization.
Answer
1 Too complex
2 Proved unsuccessful
3 Change in management
4 Moved to different
5 Was not the COlTect fit in
6 Other
Total
Other nla
Hasn't been used.
I
I
Probable would not work in my industry
Just a distribution plant that has not tried Lean
Unknown
Statistic Value Mean 4.65
Variance 1.82
Standard Deviation 1.35
Total Responses 20
Response %
1 5%
0 0%
4 20%
0 0%
10 50%
5 25%
20 100%

60
15. UW Stout has prepared me well for the use of Lean as an operational strategy in business/industry?
# Answer Response 1 Strongly Disagree 3
2 Disagree 12
3 Neither Agree nor 30
4 Agree 14
5 Strongly Agree • 2 I- -
Total 61
Statistic Value Mean 3.00
Variance 0.77
Standard Deviation 0.88
Total Responses 61
16. In what way could/should UW Stout be preparing graduates to utilize Lean in industry?
# Answer Response 1 a. More classes on Lean 33
2 b. Co-ops and Internships 36
3 c. On campus workshops l"'''1,' '"'~ .~=i, 24
4 d. Guest speakers 19
Statistic Value Total Responses 57
% 5%
20%
49%
23%
3%
100%
% 58%
63%
42%
33%

61
17. Class of:
Value Total 1997 5 2007 4
2000 7 1995 2 2009
1996 6 1999 5 [No Value] 9
2008 6 2006 5
2001 4 2005 6 Value Total
2003 8 1998 4 BS 78
2002 9 2004 [No Value] 9
6
18. Prinlary Degree
Value I Total General Business Administration I 64
Engineering Technology 14
[No Value] 9