
Edinburgh Research Explorer · Examples include the Full-Scale Engineered Barriers ... 2011) and...
34
Edinburgh Research Explorer A new hydro-mechanical model for bentonite resaturation applied to the SEALEX experiments Citation for published version: Thatcher, KE, Bond, AE, McDermott, C, Fraser Harris, A & Norris, S 2016, 'A new hydro-mechanical model for bentonite resaturation applied to the SEALEX experiments' Environmental Earth Sciences. DOI: 10.1007/s12665-016-5741-z Digital Object Identifier (DOI): 10.1007/s12665-016-5741-z Link: Link to publication record in Edinburgh Research Explorer Document Version: Peer reviewed version Published In: Environmental Earth Sciences Publisher Rights Statement: © Springer-Verlag Berlin Heidelberg 2016 General rights Copyright for the publications made accessible via the Edinburgh Research Explorer is retained by the author(s) and / or other copyright owners and it is a condition of accessing these publications that users recognise and abide by the legal requirements associated with these rights. Take down policy The University of Edinburgh has made every reasonable effort to ensure that Edinburgh Research Explorer content complies with UK legislation. If you believe that the public display of this file breaches copyright please contact [email protected] providing details, and we will remove access to the work immediately and investigate your claim. Download date: 14. Jun. 2018
Transcript of Edinburgh Research Explorer · Examples include the Full-Scale Engineered Barriers ... 2011) and...

Edinburgh Research Explorer
A new hydro-mechanical model for bentonite resaturationapplied to the SEALEX experiments
Citation for published version:Thatcher, KE, Bond, AE, McDermott, C, Fraser Harris, A & Norris, S 2016, 'A new hydro-mechanical modelfor bentonite resaturation applied to the SEALEX experiments' Environmental Earth Sciences. DOI:10.1007/s12665-016-5741-z
Digital Object Identifier (DOI):10.1007/s12665-016-5741-z
Link:Link to publication record in Edinburgh Research Explorer
Document Version:Peer reviewed version
Published In:Environmental Earth Sciences
Publisher Rights Statement:© Springer-Verlag Berlin Heidelberg 2016
General rightsCopyright for the publications made accessible via the Edinburgh Research Explorer is retained by the author(s)and / or other copyright owners and it is a condition of accessing these publications that users recognise andabide by the legal requirements associated with these rights.
Take down policyThe University of Edinburgh has made every reasonable effort to ensure that Edinburgh Research Explorercontent complies with UK legislation. If you believe that the public display of this file breaches copyright pleasecontact [email protected] providing details, and we will remove access to the work immediately andinvestigate your claim.
Download date: 14. Jun. 2018

1
A new hydro-mechanical model for bentonite resaturation applied to the SEALEX experiments
KE Thatcher1, AE Bond1, P Robinson1, C McDermott2, AP Fraser Harris2 and S Norris3
1Quintessa Ltd, 633/635 Birchwood Boulevard, Warrington, WA3 7QU. UK
2University of Edinburgh
3Radioactive Waste Management Limited
Tel: +44 (0)1925 885959
Keywords: bentonite, coupled modelling, resaturation
Acknowledgements
This work was conducted within the international DECOVALEX Project
(http://www.decovalex.org), with funding from Radioactive Waste Management Limited
(RWM) (http://www.nda.gov.uk/rwm), a wholly–owned subsidiary of the Nuclear
Decommissioning Authority.
Abstract
Bentonite barriers perform safety critical functions in many radioactive waste disposal
concepts, but it is challenging to accurately predict bentonite resaturation behaviour in
repository settings. Coupled models of the hydro-mechanical (HM) response of bentonite are
used to demonstrate understanding of bentonite behaviour in experiments and to predict the
response of bentonite in a repository environment. Following trials of a range of numerical
approaches, a new model is presented, referred to as the Internal Limit Model, which makes
use of key observations on limiting stresses supported in bentonite samples in experimental
data. This model is based on the Modified Cam Clay model, and uses the observation that for a
given dry density of bentonite, there is a limiting stress that the sample can support, be that
stress due to swelling, compaction or suction, to explicitly couple the hydraulic and mechanical
models. The model is applied to experimental data from the SEALEX experiments, involving a
70/30 by mass mixture of MX80 bentonite and sand. The model is able to reproduce the
experimental data using a single set of parameters for all the experiments considered. This
builds confidence that the model will be useful in the future for predictive modelling given
appropriate data to characterise the bentonite material being used.
1 Introduction
Bentonite barriers perform safety critical functions in many radioactive waste disposal
concepts, but it is challenging to accurately predict bentonite resaturation behaviour in
repository settings. Bentonite is primarily chosen for backfilling and seals because it has a very
low permeability when saturated, but also because it swells as its water content increases,
closing any gaps in the engineered barrier system (Sellin and Leupin 2013). These two

2
properties reduce the likelihood of radionuclide migration through the engineered barrier.
Coupled models of the hydro-mechanical (HM) response of bentonite are used to demonstrate
understanding of bentonite behaviour in experiments and to predict the response of bentonite
in a repository environment. To date, models have been built that can be calibrated to
produce good fits to experimental data, however a true predictive modelling capability,
particularly for time dependent processes such as resaturation, remains to be demonstrated.
A wide range of experimental programmes have considered bentonite swelling and
resaturation under a variety of conditions. Examples include the Full-Scale Engineered Barriers
Experiment (Nagra, 2013) at Grimsel Underground Research Laboratory (URL); the Canister
Retrieval Test at Äspö Hard Rock Laboratory (Kristensson and Börgesson, 2015) and; the
Engineered Barriers (EB) test at the Mont Terri URL (Mayor et al., 2005). These experiments
have provided data to improve conceptual understanding of processes affecting bentonite
behaviour and also allowed development of models.
Many models for the stress-strain behaviour of bentonite are based on a modification of the
thermodynamically derived Cam Clay model (Roscoe and Schofield 1963). The Modified Cam
Clay model (MCC; Roscoe and Burland, 1968), adapts the Cam Clay model to have a continuous
yield surface so that it is more suitable for implementation in numerical codes. The most
commonly used model for bentonite is the Barcelona Basic Model (BBM; Alonso et al. 1990)
which extends the MCC to account for partially saturated soils by including suction as an
independent stress variable and making volumetric strain (i.e. swelling) and the stiffness of the
bentonite dependent on suction. These relationships are empirical calibrations, based on
observations from experiments. A number of variants of the BBM are used including the
Barcelona Expansive Model (BExM; Alonso et al., 1999), which accounts for two structural
levels in the bentonite associated with micropores and macropores. The BBM and associated
models have been implemented in a number of numerical codes including CodeBright
(www.etcg.upc.edu/recerca/webs/code_bright/code_bright), TOUGH-FLAC (Rutqvist et al.,
2011) and COMSOL (Navarro et al. 2016), and have been used in a large number of modelling
studies (e.g. Wang et al. 2013; Rutqvist et al. 2014).
The work presented here concerns modelling the SEALEX experiments (Barnichon et al., 2011),
run by the Institut de Radioprotection et de Sûreté Nucléaire (IRSN) in France at the
Tournemire URL. These experiments are designed to improve understanding of the controls on
the long-term performance of bentonite-based seals and consider resaturation of the seals
alongside loss of containment. In-situ experiments are complemented by laboratory
experiments and a 1/10th scale mock-up experiment, all focussed on a 70:30 dry mass mixture
of MX80 bentonite and quartz sand.
Initial work on modelling the SEALEX data implemented and tested a variety of process models
in order to assess their suitability for representing the experiments (Bond et al., 2014; Bond et
al., 2015a,b,c). The process models were implemented in the multi-physics finite
volume/mixed element code QPAC (Maul, 2013; Bond et al., 2013; Benbow et al., 2014), taking
advantage of the fact that the process models could be specified as modeller input, rather
than through code development. This significantly increased the speed at which process
3
models could be investigated, as well as significantly reducing the risk of introducing errors in
the results.
In the interests of benefitting from the considerable previous modelling experience on
bentonite resaturation, the BBM model was one of the process models considered; the
expectation was that parameterisations from the literature could be used to help calibrate the
free parameters in the model, and address the data gaps in the SEALEX data (Section 2). For a
number of reasons, outlined in the Supplementary Information, this expectation was not
realised and so an alternative model described in this paper was used. The model presented in
this paper is the final process model that was selected for application to the SEALEX
experimental dataset. It represents a new approach that uses the experimental data directly in
the model parameterisation to couple hydraulic and mechanical processes more explicitly than
in the BBM, but remains based on the MCC mechanical model.
This work was carried out as part of DECOVALEX-2015 (www.decovalex.org) in which 6 teams
developed coupled HM models of the SEALEX experiments. Comparison of the teams’ work is
discussed in Millard et al. (2016a) and Millard et al. (2016b). This paper presents the model
and modelling results of one of the six teams; Quintessa Ltd on behalf of Radioactive Waste
Management Ltd (Bond et al., 2015c).
2 SEALEX experiments
The in-situ SEALEX experiments (Barnichon and Bauer, 2011) comprise a number of 60 cm
diameter boreholes drilled into Toarcian argillite at the Tournemire Underground Rock
Laboratory (URL). Bentonite/sand seals are emplaced in these boreholes and are instrumented
such that the resaturation of the seal can be studied and experiments can be performed to
simulate possible conditions in a geological repository, for example, incomplete resaturation or
a loss of confinement. The different boreholes are used to test different ratios of bentonite to
sand in the seals and the form of the bentonite sand mixture, for example, precompacted
blocks or pellets. The Toarcian argillite is an indurated clay formation consisting of shales and
marls, with a very low permeability to saturated water flow (~10-21 – 10-18 m2), significant
porosity (~9%) and with a strong tendency to show hydraulic ‘self-sealing’ characteristics post
excavation (Thatcher et al., 2016).
The SEALEX project considers seals composed of MX80 bentonite mixed with different
amounts of sand. Just one of these mixtures has been considered in the DECOVALEX project: a
70/30 dry weight mixture of MX80 bentonite and quartz sand. Samples were prepared with
two different dry densities and 11% water content by mass (Table 1). The density of the MX80
grains is 2.77 Mg/m3 and that of the sand grains is 2.65 Mg/m3, such that the solid density of
the mixture 𝜌𝑠𝑜𝑙𝑖𝑑=2.73 Mg/m3.

4
Table 1: Properties of the bentonite-sand mixtures used.
Dry Density Porosity Void Ratio
1.67 Mg/m3 0.39 0.64
1.97 Mg/m3 0.28 0.39
2.1 Laboratory tests
Water retention curve
The water retention curve was determined for samples of 1.67 Mg/m3 bentonite-sand mixture
under both constant volume and free swell conditions (Figure 7). For the constant volume
case, a dry density of 1.67 Mg/m3 has a porosity of 0.39, which means that when all the
available pore space is filled with water, the water content should be 23 wt%. The data show
over 25 wt% water content is reached which suggests that almost 10% more water is injected
into the sample than there appears to be space for. Given this data is based on weighing of
samples, which should be accurate, it appears that either the water or the bentonite grains
must increase in density. There is some evidence that when included in the crystalline
structure of the bentonite interlayers, water density can increase (e.g. Jacinto et al., 2012) but
this doesn’t appear to be a widely accepted theory amongst experimentalists working with
bentonite. The data from the experiment suggest that when modelling bentonite, it may not
be necessary to strictly constrain saturations to be less than or equal to 1.
For both the constant volume and the free swell data, suction does not tend to zero for
increasing water content. This is particularly noticeable in the free swell data, where suction
exists even at a water content of 250 wt%. This small but non-zero suction is caused by the
chemical interactions of water and bentonite, which is present even as the ratio of water to
bentonite reaches very high levels.
Infiltration test
An infiltration test was performed on a 1.67 Mg/m3 dry density sample of bentonite-sand
mixture with a water content of 11 wt%. The sample was 50 mm in diameter and 250 mm in
height and was placed in a metal cylinder to prevent radial volume change within a vertically
confined hydration cell. The sample was hydrated from the bottom with an air outlet at the
top. Relative humidity was measured at 50, 100, 150 and 200 mm from the water inlet.

5
The data from the infiltration test shows a rapid increase in relative humidity at 50 mm from
the water inlet, whilst it takes almost 85 days for any significant change in relative humidity at
200 mm away from the water inlet.
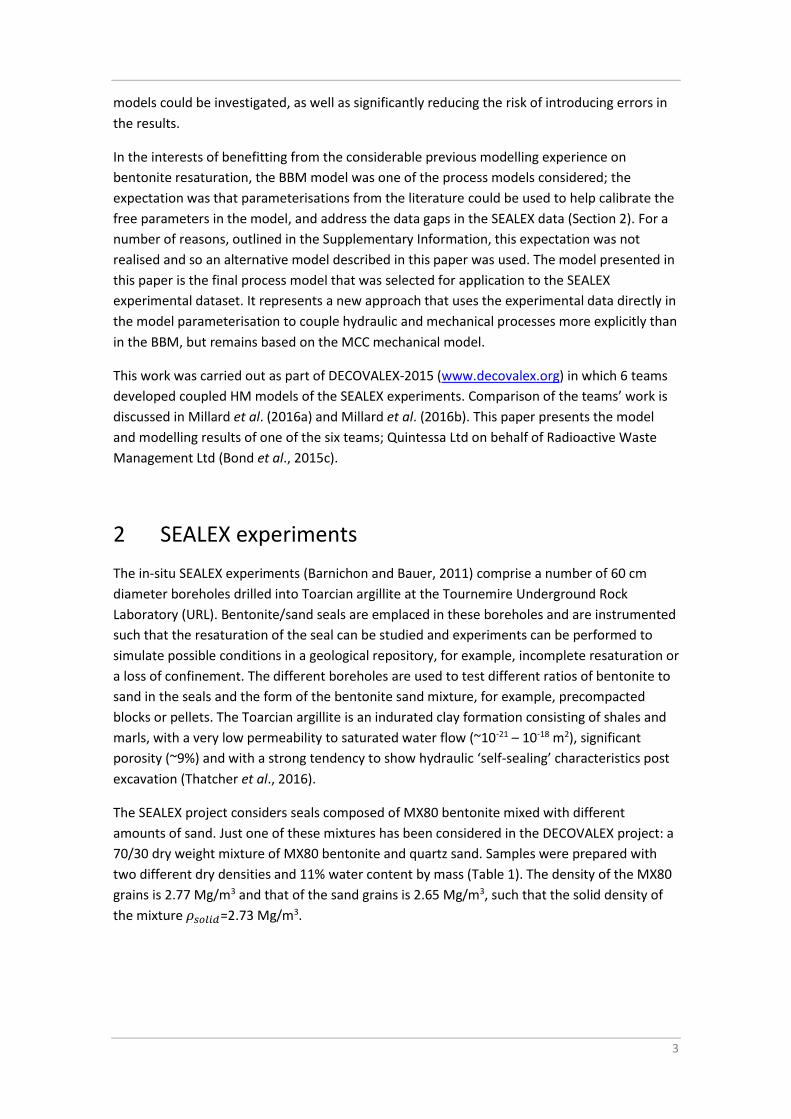
Oedometer test
Oedometer tests were performed on four samples of bentonite-sand mixture, three with a dry
density of 1.67 Mg/m3 and one at a dry density of 1.97 Mg/m3. The higher density sample had
a smaller diameter than the other samples such than when placed in the oedometer cell, it
would swell radially to a dry density of 1.67 Mg/m3. The four samples were prepared with 11
wt% water content and then different suctions were applied to the samples, causing the
samples to swell (Table 2).
Once the samples had stabilized from the change in suction, each sample was subjected to a
loading-unloading cycle within the oedometer cell. The void ratio of the samples was
measured during the test and supplied to the modelling teams (Figure 1). The experimental
results show very consistent behaviour across three of the tests (SO-02, -03, -04). These tests
show a small amount of elastic deformation under initial loading and then the samples fail
plastically at slightly different stresses, with the wettest sample failing at the lowest stress. All
three samples have a very similar failure path. As the loading is reduced, the samples rebound
elastically with tests SO-02 and SO-03 following a very similar path. The gradient in test SO-04
is very similar to the other two tests, but the initial void ratio is lower.
Test SO-01, using a sample at zero suction, shows quite different behaviour from the other
samples, with most of the deformation being recovered when the sample is unloaded,
indicating much less plastic failure in the sample. This oedometer test was set up differently to
the other three tests, with a higher dry density and a void space around the sample. However,
a convincing conceptual argument for the very different behaviour of the sample has not been
made and therefore this oedometer test was not included in the modelling.
Table 2: Details of the four samples used in oedometer tests.
Test Initial dry
density (Mg/m3)
Initial diameter
(mm)
Applied suction
(MPa)
SO-01 1.97 35.13 0
SO-02 1.67 38 4.2
SO-03 1.67 38 12.6
SO-04 1.67 38 38.0
6
Figure 1: Results of oedometer tests on samples at 4 different suctions. Data were supplied by the DECOVALEX Task leader, and are reported in Wang et al (2013c).
2.2 1/10th scale mock-up
Description of experiment
In support of the in-situ experiments, a 1/10th scale mock-up of the in-situ experiments was
carried out in the laboratory to reproduce the behaviour of the bentonite-sand mixture,
without the added complication of understanding the interaction with the argillite (Wang et al.
2013d). The seal in this experiment is 120 mm long with a diameter of 55.5 mm and the
hydration cell has a radius of 60 mm so that there is a gap (“technological void”) between the
seal and the cell as in the in-situ experiment. The mock-up experiment is set up in a vertical
cell, and the gap is uniform around the sample. The bentonite sand mixture has an initial dry
density of 1.97 Mg/m3.
The mock-up experiment proceeded in three phases:
1. Phase 1, Initial hydration: vertical deformation was prevented and the sample was
hydrated by injection of water into a porous plate at the base of the sample. During
this phase, the build-up of vertical pressure was monitored. This phase continued for 1
year.
2. Phase 2, Vertical swelling: the confining pressure was released and the sample was
allowed to swell in the vertical direction. Initially hydration only occurred from the
base of the sample, but once 2.8% vertical strain was reached, the sample was also
hydrated from the top until 20% strain was reached.
3. Phase 3, Confinement: vertical deformation was again prevented and the build-up of
vertical swelling pressure recorded. Hydration continued at both the top and bottom
of the cell during this phase.

7
Phases 2 and 3 are designed to represent a loss of confinement and subsequent re-
confinement, which will be imposed on in-situ experiment PT-A1 in the future. The data
available from the mock-up experiment include the mass of water injected into the
experiment, the change in vertical stress with time and the vertical displacement during Phase
2.
Experimental results
During Phase 1, the experimental swelling pressure data show a rapid initial increase but then
decrease rapidly before slowly increasing again (Figure 2B). This trend is interpreted to be
caused by the presence of the “technological void”, although without any radial stress data, it
is not possible to be certain of the mechanisms. Initially, the bentonite swells in all directions
creating a vertical stress and filling the void. When the bentonite hits the walls of the
hydration cell radially, stresses build up rapidly which causes the bentonite to fail plastically,
essentially moving more mass sideways and releasing the vertical stress. As hydration then
continues, the vertical stress builds up again.
When the load is released, the measured displacement shows an instantaneous elastic
response of ~2 mm followed by a slower response due to the continued hydration (Figure 2C).
When hydration is turned on at the top, the sample swells more rapidly.
The initial volume of the technical void is 49 mL, which corresponds closely to the initial
volume injected into the hydration cell very rapidly at the start of the experiment (Figure 2A).
The total volume of void space in the experiment prior to hydration was around 72 mL
(technical void plus porosity) which is very similar to the total volume of water injected into
the experiment (71 mL).

8
Figure 2: Results of the mock-up test during Phase 1 (A and B), Phase 2 (C) and Phase 3 (D). Data were supplied by the DECOVALEX Task leader, and are reported in Wang et al, 2013d.
2.3 In-situ experiment
Description of experiment
The in-situ experiment considered here is called PT-A1 and involves a 70/30 dry mass mixture
of MX80 bentonite and quartz sand precompacted into monolithic disks with no internal joints
and with 11% water content by mass. The seal is 120 cm long with a diameter of 55 cm and sits
between two porous plates within a sealing system in the borehole (Figure 3). The borehole
has a diameter of 60 cm, so there is a “ technological void”, between the seal and the argillite,
but this gap in non-uniform, being largest above the seal and non-existent beneath. The
compacted dry density of the seal as emplaced is 1.97 Mg/m3, but once it has swelled to fill the
gaps in the experiment, it is expected to have a dry density of 1.67 Mg/m3.
Hydration of the seal occurred in two phases, from a water tank in the gallery:
1. A back pressure of 2 bars (20 m water head) was applied in the tank, which allowed
filling the void between the rock and the device in 2 hours;
2. The back pressure was removed and a water head of 1 m above the axis of the
borehole was maintained for the remainder of the experiment.
The seal was instrumented with pressure sensors and relative humidity sensors and the data
available for modelling teams comprised the injected water mass, the relative humidity at a

9
number of locations within the seal, the axial stress at either end of the seal and the radial
stress at the centre of the seal.
Figure 3: Schematic diagram of the PT-A1 in-situ test after XX.
Experimental results
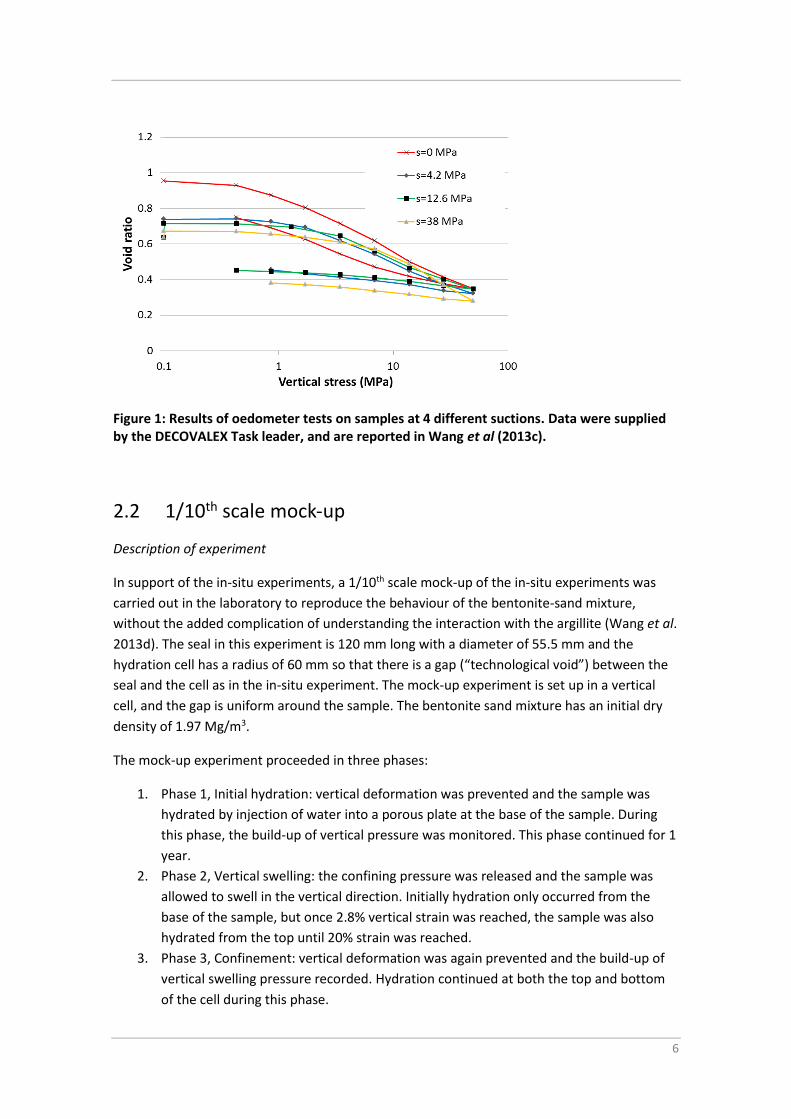
The mass of injected water (Figure 4A) during Phase 1 of injection is around 80 kg, which
corresponds to the water required to fill the technical void around the seal (44 litres), a gap
between the downstream lid and the argillite (33 litres) and smaller gaps between blocks and
around sensors. During Phase 2, water continues to enter the system for around 70 days, after
which the direction of water flow changes, and water flows out of the system.
Relative humidity data show that in three locations, humidity rises from the onset of the
experiment and has a similar shape to the infiltration test (Figure 4D). However at the fourth
location (PT-A1_W_52_5-2), the relative humidity increases very rapidly at the onset of water
injection and thereafter the relative humidity both decreases and increases at this location.
The difference in relative humidity values at the four locations within the sample indicates
heterogeneity within the experiment, whereas the experiment was set up to give
homogeneous results at each location.
The axial stress data show an increase in stress with time (Figure 4B), but the stresses at either
end of the sample are different. This observation is inconsistent with the conceptual model as
we expect a stress on one end of the sample to cause an equal and opposite stress at the other
end to maintain force balance.

10
The radial stress data show stresses increasing from the start of injection (Figure 4C). Sensor 2,
which is on top of the sample, shows stresses building up from a later starting date due to the
time required for the seal to swell into the technological void. The seal appears to have
swelled to the top of the borehole 50 days into the experiment, so after that, we would expect
the technical void to be filled with bentonite and there be little free water.
As with the relative humidity data, the radial stress data shows significant heterogeneity, with
the highest stress being seen close to the measurement point with high initial relative
humidity. This suggests that there could be a discrete feature in the seal (e.g. a crack or joint)
that is causing this part of the seal to preferentially hydrate.
There are a number of features in this data set that not readily understandable based on the
description of the experiment. A possible explanation for water flow out of the experiment
could be that the bentonite is filling voids and squeezing water out, but the stress data indicate
that the void is filled after 50 days, whereas water flows out of the experiment from 70 to 200
days. The heterogeneity in the data is not obviously consistent with the initial and boundary
conditions of the experiment. It appears as though there is very localised preferential
resaturation at one side of the seal. The axial stress data indicate that the sample exerts more
stress in one direction than the other, which if true, would require frictional losses of energy
between the bentonite and the argillite, or a very heterogeneous stress response over the
ends of the seals. Given that the data are not readily understandable based on the description
of the experiment, the aim of the modelling of this experiment is to capture broad trends
rather than a detailed calibration.
11
Figure 4: Results from the in-situ test including (A) mass of injected water; (B) axial stress; (C) radial stress; and (D) relative humidity with approximate measurement locations shown. Data were supplied by the DECOVALEX Task leader.
3 Model Description
The model proposed here is called the Internal Limit Model (ILM) and is a fully coupled hydro-
mechanical model based on Richards’ equation for the hydraulics, momentum balance for the
mechanics and the MCC to represent plastic deformation. In QPAC, a mixed element approach
is adopted for the mechanics and a more conventional finite volume approach is used for the
hydraulics. Observations from laboratory data are used to define an Internal Limit Curve (ILC),
which is used to parameterise both mechanical and hydraulic properties of the bentonite.
The mechanical problem is expressed in terms of conservation of momentum, which is
otherwise referred to as the Navier equation (Howell et al., 2009)
𝜌𝜕2�̅�
𝜕𝑡2 = ∇�̿� − 𝜌�̅�, [1]
where 𝜌 [kg/m3] is the solid density, �̅� [m] is the displacement vector, 𝑡 [s] is time, �̿� [MPa] is
the stress tensor and �̅� [m/s2] is the vector of the acceleration due to gravity. The equation
effectively ensures a local force balance for pseudo steady state. The stress vector (�̅�) assumes
a pseudo steady state and is given by:
�̅� = 𝑆̿(𝜀̅ − �̅�) − 𝑃 [2]

12
Where 𝑆̿ [MPa] is the elastic stiffness matric, 𝜀 ̅[-] is the strain vector, �̅� [-] represents arbitrary
additional strains e.g. swelling strain and plastic strain, and 𝑃 [MPa] is fluid pressure.
For this application, an isotropic elastic stiffness matrix is used whereby
𝑆̿ =
[ Λ + 2τ Λ Λ 0 0 0
Λ Λ + 2τ Λ 0 0 0Λ Λ Λ + 2τ 0 0 00 0 0 2τ 0 00 0 0 0 2τ 00 0 0 0 0 2τ]
[3]
Where Λ = 𝜉 ∗ 𝐸 (1 + 𝜉) ∗ (1 − 2𝜉)⁄ and 𝜏 = 𝐸/(2(1 + 𝜉)), 𝐸 [MPa] is Youngs Modulus and
𝜉 [-] is Poisson’s ratio. Poisson’s ratio is a constant and Young’s Modulus is dependent on the
average effective stress (𝜅0 and 𝜅1 are constants, see Table 3):
𝐸 = 𝜅0 + 𝜅1 [1
3(𝜎𝑖𝑖
′ + 𝜎𝑗𝑗′ + 𝜎𝑘𝑘
′ )] [4]
For swelling bentonite at a constant temperature, it is assumed that there are two additional
sources of strain: swelling strains due to changes in water content of the bentonite; and plastic
strains due to plastic failure of the bentonite. Swelling strains are discussed later as they are
coupled to the hydraulics.
Plastic strains are calculated according to the MCC model (Roscoe and Burland 1968). The
plastic yield surface is given by:
[𝑞
𝑀]2+ 𝑝′ (𝑝′ − 𝑝𝑐) = 0 [5]
whilst the virgin consolidation line in the MCC model, which describes how the yield surface changes with stress, has the equation:
𝑣 = 𝛤 − 𝜆 ln 𝑝′ [6]
where 𝑣 [-] is the specific volume (𝑣 = 1 + 𝑒, where 𝑒 [-] is the void ratio), 𝑝′ [MPa] is the effective confining stress, 𝑞 [MPa] is deviatoric stress, 𝑝𝑐 [MPa] is the pre-consolidation pressure (which is a point on the virgin consolidation line) and 𝑀, 𝛤 and 𝜆 are all constant parameters. The plastic strain is calculated as the derivative of the plastic yield surface.
The hydraulic problem is expressed in terms of conservation of mass:
𝜕
𝜕𝑡(𝜃𝜌𝑓𝜑) = −∇ ∙ (𝜌𝑓𝑢) + 𝑄 [7]
Where 𝜃 [-] is porosity, 𝜌𝑓 [kg/m3] is fluid density, 𝜑 [-] is saturation, 𝑢 [m/s] is the fluid
velocity and 𝑄 [kg/m3/s] is a source or sink.
After trying a number of different formulations for the fluid migration, Richard’s equation is
chosen. Richard’s equation can be used where gas flow is very fast compared to water flow, so
that gas flow does not need to be solved for in the equations. It was found that model results
using Richards’s equation were as good as full multiphase flow, but since gas flow was not
represented, fewer free parameters were required:

13
u = −k
𝜇∇(𝑃 + 𝜌𝑔𝑧) [8]
Where u [m/s] is the fluid velocity tensor, k [m2] is the effective permeability tensor, 𝜇 [Pa.s] is
the fluid viscosity and 𝑧 [m] is height.
The intrinsic permeability is dependent on a function of dry density D(𝜌𝑑𝑟𝑦) calibrated against
the infiltration test.
𝑘 = 𝑘010𝐷(𝜌𝑑𝑟𝑦) [9]
The saturation (𝜑) dependent relative permeability (𝑘𝑟𝑒𝑙) is given by:
𝑘𝑟𝑒𝑙 = 𝜑4 [10]
Water pressure (𝑃𝑤 [MPa]) is calculated by subtracting the net suction (Ψ [MPa]) from the gas pressure (𝑃𝑔 [MPa]):
𝑃𝑤 = 𝑃𝑔 − Ψ [11]
Suction is determined from the Internal Limit Curve (ILC) as described below.
The ILC is based on the observation of Wang et al. (2012), that for a given composition of
bentonite, one can define a log-linear relationship between the swelling pressure and the void
ratio of the bentonite (or the bentonite/sand mixture). For MX80 bentonite, data reported in
Wang et al. (2012) have been used to define a relationship between void ratio and swelling
pressure as shown in Figure 5. The ILC curve has the form:
𝑝 = 𝑝0 ∗ 𝑒𝑥𝑝((−𝑒)/𝜆) [12]
where 𝑝0 [MPa] and 𝜆 [-] are constants calibrated against the data and 𝑒 is the void ratio,
which can be related to the dry density (𝜌𝑑𝑟𝑦) by:
𝑒 = (1 − 𝜌𝑑𝑟𝑦/𝜌𝑠𝑜𝑙𝑖𝑑)/(𝜌𝑑𝑟𝑦/𝜌𝑠𝑜𝑙𝑖𝑑) [13]
This relationship between void ratio and swelling pressure (stress) was plotted with the data
from the oedometer tests (Figure 6) and the ILC was found to coincide with the plastic
deformation line in the oedometer test. The correspondence between swelling pressure and
plastic deformation suggests that under swelling conditions, bentonite swells to a stress
corresponding to the point of plastic failure. This observation enables the swelling data to be
used to parameterise plastic failure curve at different void ratios (Equation 6) using the ILC.
Dueck (2004) suggested that the suction of the bentonite (Ψ), could be related to the
unconfined (free) suction (Ψ𝑓𝑟𝑒𝑒) for a given water content, and the stress state, such that
Ψ = Ψ𝑓𝑟𝑒𝑒 − 1/3(𝜎𝑖𝑖 + 𝜎𝑗𝑗 + 𝜎𝑘𝑘) [14]
Equation 11 can also be restated in terms of a relationship between water content (assuming
all voids are filled with water) and free suction (from equation [14] we see that when suction is
zero, free suction must equal stress) and this relationship was plotted against the water
retention function (Figure 7). The ILC model showed a close fit to the experimental data for the
14
free swell condition at water contents < 30 wt% and was therefore used to parameterise part
of the suction curve for free swelling bentonite.
The observation that three independent sets of data can be described by a single relationship,
the Internal Limit Curve, suggests that this relationship could represent a fundamental limit
within the material. Swelling pressure cannot exceed the plastic deformation limit because an
external energy source would be required to permanently deform the bentonite. If an external
energy source is present, e.g. in a loading test, then the sample will deform plastically. Both
stress and suction are measures of energy density, and the Dueck model suggests that to some
extent, energy can be transferred between suction pressure and stress. It would therefore
follow that if there is a limiting stress that the sample can support, there is also a limiting
suction.
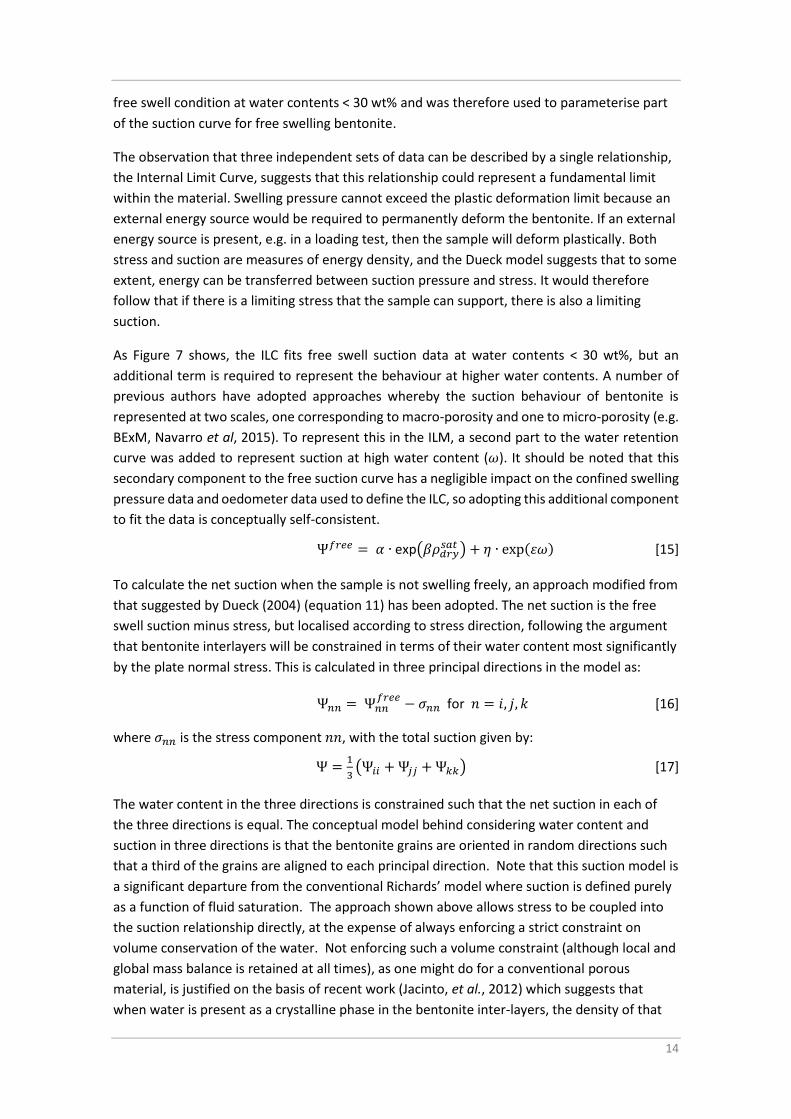
As Figure 7 shows, the ILC fits free swell suction data at water contents < 30 wt%, but an
additional term is required to represent the behaviour at higher water contents. A number of
previous authors have adopted approaches whereby the suction behaviour of bentonite is
represented at two scales, one corresponding to macro-porosity and one to micro-porosity (e.g.
BExM, Navarro et al, 2015). To represent this in the ILM, a second part to the water retention
curve was added to represent suction at high water content (𝜔). It should be noted that this
secondary component to the free suction curve has a negligible impact on the confined swelling
pressure data and oedometer data used to define the ILC, so adopting this additional component
to fit the data is conceptually self-consistent.
Ψ𝑓𝑟𝑒𝑒 = 𝛼 ∙ exp(𝛽𝜌𝑑𝑟𝑦𝑠𝑎𝑡 ) + 𝜂 ∙ exp(𝜀𝜔) [15]
To calculate the net suction when the sample is not swelling freely, an approach modified from
that suggested by Dueck (2004) (equation 11) has been adopted. The net suction is the free
swell suction minus stress, but localised according to stress direction, following the argument
that bentonite interlayers will be constrained in terms of their water content most significantly
by the plate normal stress. This is calculated in three principal directions in the model as:
Ψ𝑛𝑛 = Ψ𝑛𝑛𝑓𝑟𝑒𝑒
− 𝜎𝑛𝑛 for 𝑛 = 𝑖, 𝑗, 𝑘 [16]
where 𝜎𝑛𝑛 is the stress component 𝑛𝑛, with the total suction given by:
Ψ =1
3(Ψ𝑖𝑖 + Ψ𝑗𝑗 + Ψ𝑘𝑘) [17]
The water content in the three directions is constrained such that the net suction in each of
the three directions is equal. The conceptual model behind considering water content and
suction in three directions is that the bentonite grains are oriented in random directions such
that a third of the grains are aligned to each principal direction. Note that this suction model is
a significant departure from the conventional Richards’ model where suction is defined purely
as a function of fluid saturation. The approach shown above allows stress to be coupled into
the suction relationship directly, at the expense of always enforcing a strict constraint on
volume conservation of the water. Not enforcing such a volume constraint (although local and
global mass balance is retained at all times), as one might do for a conventional porous
material, is justified on the basis of recent work (Jacinto, et al., 2012) which suggests that
when water is present as a crystalline phase in the bentonite inter-layers, the density of that

15
water may depart significantly from the equivalent liquid water density due to the presence of
charged ions in the bentonite, allowing water molecules to sit closer together. Hence water
saturation could exceed unity in the models, although in practice the water saturation never
exceeded 1.15, which is consistent with the results of Jacinto et al., (2012).
In the ILM, swelling strain is calculated based on the change in water content in the bentonite. Swelling strain is calculated in the three principal directions as follows:
𝜀𝑛𝑛𝑠𝑤𝑒𝑙𝑙 =
𝑎
3 (𝜔𝑛𝑛−𝜔0)𝑚𝑠
𝜌𝑤𝑉𝑐𝑜𝑚𝑝 (18)
where 𝜔0 is the initial water content (kg/kg), 𝜔𝑛𝑛 is the water content in direction 𝑛𝑛, 𝑚𝑠 is
the mass of solids (kg), 𝜌𝑤 is the density of water (kg/m3), 𝑉𝑐𝑜𝑚𝑝 is the compartmental volume
(m3) and 𝑎 is a swelling efficiency term which reflects that not all additional water will cause a
volume increase, some will just fill void space in the sample. The calculation is considered in
three principal directions following the conceptual model that bentonite grains are aligned
principally in one of the three directions. The amount of stress in the three principal directions
is different, so the free suction and therefore water content will be different in the three
directions, however the net suction will be the same.
In developing the model, it was decided to find a single model and parameterisation that could
explain all the data from laboratory to field scale. This seemed a more valuable exercise than
calibrating to each experiment separately, since a truly predictive model should be able to
represent the outcome of these experiments given parameters supplied on the bentonite
properties. The laboratory experiments did not provide sufficient data to calibrate the models,
so inclusion of all the experimental steps in the calibration provides additional data points and
types of data against which the model can be calibrated. This approach to calibration means
that for some models, a better calibration could be achieved if that model were considered
alone. The parameterisation is given in Table 3.

16
Figure 5: Swelling pressure data for the final dry density of bentonite in a 70/30 bentonite/claystone mixture (Wang et al 2012) plotted against the Internal Limit Curve (Equation 12, parameteristed to fit the swelling data).
Figure 6: Data from the oedometer tests at intial dry density of 1.67 Mg/m3 (Wang et al., 2013c) plotted with the ILC, using the same parameterisation for the ILC as in Figure 5.

17
Figure 7: Water retention data for free swelling and constant volume samples (Wang et al, 2013c) along side the ILC curve modified to give saturated water content for a given dry density, but using the same parameters as Figure 5 and Figure 6.
Table 3: Parameters used in all models.
ILM Parameters
α 1.3×10⁻⁶ [MPa] Fit to Wang et al. (2012)
β 8.5 [m3/Mg] Fit to Wang et al. (2012)
Hydraulic Parameters
k_0 0.75×10⁻²⁰ [m2] Calibrated to infiltration test
D(𝜌𝑑𝑟𝑦)
1.47 [Mg/m3] -> 0.55 [-]
1.57 [Mg/m3] -> 0.25 [-]
1.67 [Mg/m3] -> -0 [-]
1.97 [Mg/m3] -> -0.2 [-]
Calibrated to infiltration test
𝜂 0.42 [MPa] Fit to water retention data
ε -1.5[-] Fit to water retention data

18
Mechanical Parameters
Poisson’s ratio 0.27 [-] Assumed
𝜅0 50 [MPa] Calibrated
𝜅1 30 [-] Calibrated
M 1.25 [-] Calibrated
a 0.5 [-] Calibrated
4 Models and results
4.1 Laboratory tests
Infiltration test
The infiltration test is represented in the model by a 1D axisymmetric grid with discretisation
only in the axial direction (Figure 8A). Given the symmetry of the experimental setup, with
water supplied from a porous stone across the base of the sample, there is no reason to expect
radial variations. The material properties are as described in Table 3 and the initial conditions
of the bentonite are dry density of 1.67 Mg/m3, water content of 10.8 wt% and the sample is
under atmospheric pressure. There are zero displacement boundary conditions on all the
boundaries of the model and no flow conditions everywhere apart from the base of the model,
which has a specified water pressure of 0.1 MPa. Note that as Richards’ equation is used, the
air outlet at the top of the experimental setup is not explicitly represented.
A comparison of the measured and modelled relative humidity at four points in the
experiment is shown in Figure 8B. The trends in the experimental data are as expected with
sensor RH01, located closest to the water inlet, showing the fastest and greatest increase in
relative humidity and sensor RH04 showing the slowest and smallest increase in relative
humidity. The model can capture these broad trends, but it was difficult to find a calibration
which produced fast-enough wetting at RH01 whilst still fitting the other three sensors. This
could indicate that the hydraulic process model is not capturing all the physical processes in
the bentonite when the sample gets close to being fully water-saturated.

19
Figure 8: (A) Schematic of the infiltration test showing the model grid and the location of the output from the model, which corresponds to the sensor locations in the experiment. (B) Comparison of experimental data (dots) and model results (lines).
Oedometer tests
In the oedometer experiments, suction in the samples is controlled in the experiments and
after imposition of a different suction to each sample, the suction is held constant throughout
the experiment. In modelling the oedometer tests, it was therefore decided only to represent
mechanical processes and to assume that the sample is always in equilibrium with the imposed
suction; as the sample changes size, this will imply a change in water content. The imposed
suction is input into the model as a fixed time series.
The oedometer tests are represented in the model by a 1D axisymmetric grid with
direcretisation only in the axial-direction (Figure 9A). As with the infiltration test, there is no
reason to expect radial or angular variations within the bentonite. The material properties are
as described in Table 3 and the initial conditions of the bentonite are dry density of 1.67
Mg/m3, water content of 10.8 wt%, corresponding to a suction of 64 MPa. At the start of the
model, the suction is changed for each sample and the swelling of the sample recorded, before
the loading starts. The boundary conditions are all zero displacement apart from the top
boundary, which has an applied stress of 0.1MPa whilst the sample swells due to reduction in
suction, and thereafter the applied stress varies through time up to 50 MPa, consistent with
the experimental procedure.
The models capture all the main features of the data (Figure 9B), including the initial elastic
deformation, plastic failure and the elastic rebound on unloading. As the samples are loaded,
the model shows the water content decreasing and then the water content increasing again as
the load is removed. This is a direct consequence of the stress-suction coupling and the water
retention curve being dependent on water content. Unfortunately the samples were not

20
weighed during the experiment. If they had been, this could have provided a good constraint
on whether the proposed model reflects the real situation.
Figure 9: (A) Schematic of the odeometer test showing the model grid. (B) Comparison of experimental data (dots) and model results (lines).
4.2 1/10th scale mock-up
Model description
The mock-up experiment was set up to be axially symmetric, so an axially symmetric cylindrical
model is used (Figure 10A). The presence of the “technological void” at the outer radius of the
sample means that water can enter the sample radially and the sample can swell radially.
Therefore, unlike the previous models, the model of the mock-up experiment required radial
discretisation to allow non-homogeneous water content and swelling in the radial direction.
The bentonite/sand mixture has an initial dry density of 1.97 Mg/m3 and water content of 10.8
wt%. The sample is initially under no stress and has a diameter of 55.5 mm within the
hydration cell of diameter 60 mm.
The “technological void” space that was present at the start of the experiment has been
represented in the model by the boundary conditions imposed on the radial surface of the
model. The technological void is assumed to fill with water at the start of the experiment and
then the bentonite swells into the void, closing the gap. The mechanical boundary is a strain
dependent stress boundary, which becomes very stiff when the radial displacement of the
sample is 2.25 mm, i.e. large enough to fill the technological void. A constant water pressure
boundary at 0.1 MPa allows water to enter the sample here, but the boundary is turned to no-
flow once the volume of water that has flowed in through this boundary reaches the volume of
the technological void.
The bottom boundary has zero displacement and a constant water pressure of 0.1 MPa. The
top boundary has a time and strain dependent stress to mimic periods of confinement and free
swell. In Phase 1, the boundary is made very stiff so that a small displacement creates a large

21
stress, effectively preventing any displacement. In Phases 2 and 3, the sample is allowed to
swell to 20% strain, but thereafter, a small increase in displacement caused a large stress on
the boundary thereby preventing further swelling. The hydraulic boundary condition at the top
boundary is also strain dependent, with no flow at strains less than 2.8% and then a constant
water pressure of 0.1 MPa at higher strains.
Modelling results
The model captures the main features of the data well (Figure 10) including the initial rapid
increase in stress followed plastic collapse seen in the data (Figure 10B), although the timings
are approximately a factor of 2 too fast in the model. Alternative model calibrations
considering only the mock-up data were able to fit the timings better, but these resulted in
poorer results for the oedometer and in-situ experiments. The peak swelling pressure is also
captured in the model, but by 100 days, the swelling pressure in the model is falling very
slightly, while in the experiment the swelling pressure continues to rise slightly. The drop in
swelling pressure in the model is due to the bentonite homogenising; this may be starting to
happen in the data, at around 300 days, but a longer time series would be needed to confirm
this behaviour.
The model fits the injection data well, but after 100 days, the rate of injection slows down in
the data but not in the model. As in the infiltration test, this could indicate that the model
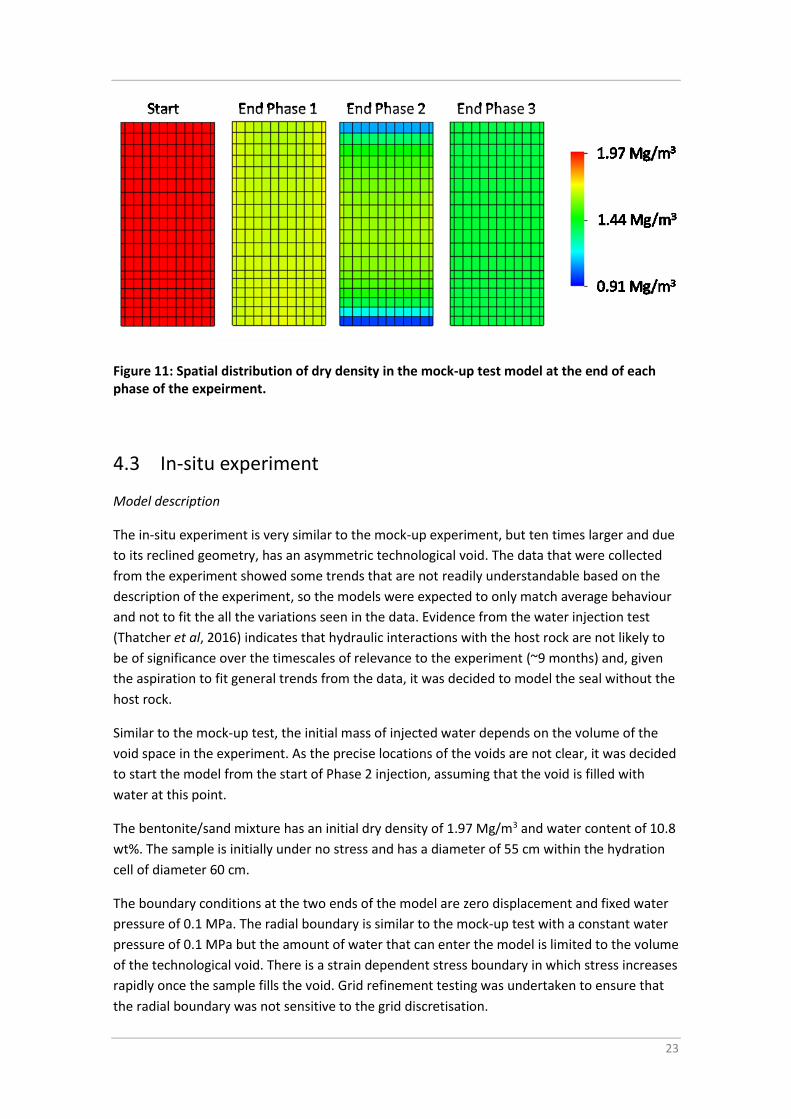
doesn’t capture water flow well at higher water content. At the end of Phase 1, the model
shows a homogeneous distribution of dry density (Figure 11). There is a small amount of
plastic strain at the end of Phase 1, corresponding to a general volume increase across the
sample.
Once the confining pressure is released, the sample rapidly expands upwards. The model
captures the initial very rapid elastic response to the load being removed, but the subsequent
swelling due to water injection at the base of the sample is faster in the model than in the
data. Once water enters the sample from the top as well as the bottom, the model shows a
slightly slower rate of swelling than the data, and overall the model reaches 20% strain at the
same time as in the experiment. By the end of Phase 2, the model shows that very little has
changed in the middle of the sample, but that the dry density (Figure 11) has significantly
decreased at the top and bottom of the sample.
When the sample is confined again in Phase 3, the swelling pressure builds up again. The final
value of swelling pressure is much lower now, as would be expected given the lower dry
density of the sample. The model slightly under predicts the amount of swelling pressure, and
a common theme throughout the modelling was that it was difficult to get the correct swelling
pressure in both Phase 1 and Phase 3. There was a tendency to over predict swelling in Phase 1
and under predict in Phase 3, and improved calibration in one phase resulted in a less good
calibration in the other phase.

22
Figure 10: (A) Schematic of the mock-up test showing the model grid and the technological void. (B-E) Comparison of experimental data (dots) and model results (lines) for mass of injected water (B); axial stress (C); radial stress (D); and relative humidity (D).
23
Figure 11: Spatial distribution of dry density in the mock-up test model at the end of each phase of the expeirment.
4.3 In-situ experiment
Model description
The in-situ experiment is very similar to the mock-up experiment, but ten times larger and due
to its reclined geometry, has an asymmetric technological void. The data that were collected
from the experiment showed some trends that are not readily understandable based on the
description of the experiment, so the models were expected to only match average behaviour
and not to fit the all the variations seen in the data. Evidence from the water injection test
(Thatcher et al, 2016) indicates that hydraulic interactions with the host rock are not likely to
be of significance over the timescales of relevance to the experiment (~9 months) and, given
the aspiration to fit general trends from the data, it was decided to model the seal without the
host rock.
Similar to the mock-up test, the initial mass of injected water depends on the volume of the
void space in the experiment. As the precise locations of the voids are not clear, it was decided
to start the model from the start of Phase 2 injection, assuming that the void is filled with
water at this point.
The bentonite/sand mixture has an initial dry density of 1.97 Mg/m3 and water content of 10.8
wt%. The sample is initially under no stress and has a diameter of 55 cm within the hydration
cell of diameter 60 cm.
The boundary conditions at the two ends of the model are zero displacement and fixed water
pressure of 0.1 MPa. The radial boundary is similar to the mock-up test with a constant water
pressure of 0.1 MPa but the amount of water that can enter the model is limited to the volume
of the technological void. There is a strain dependent stress boundary in which stress increases
rapidly once the sample fills the void. Grid refinement testing was undertaken to ensure that
the radial boundary was not sensitive to the grid discretisation.

24
Modelling results
The models compare reasonably well with the data, considering that there are a number of
features in the data that that are not readily understandable based on the description of the
experiment. Given the uncertainty in the data, more emphasis was placed on achieving a good
calibration to Step 1.
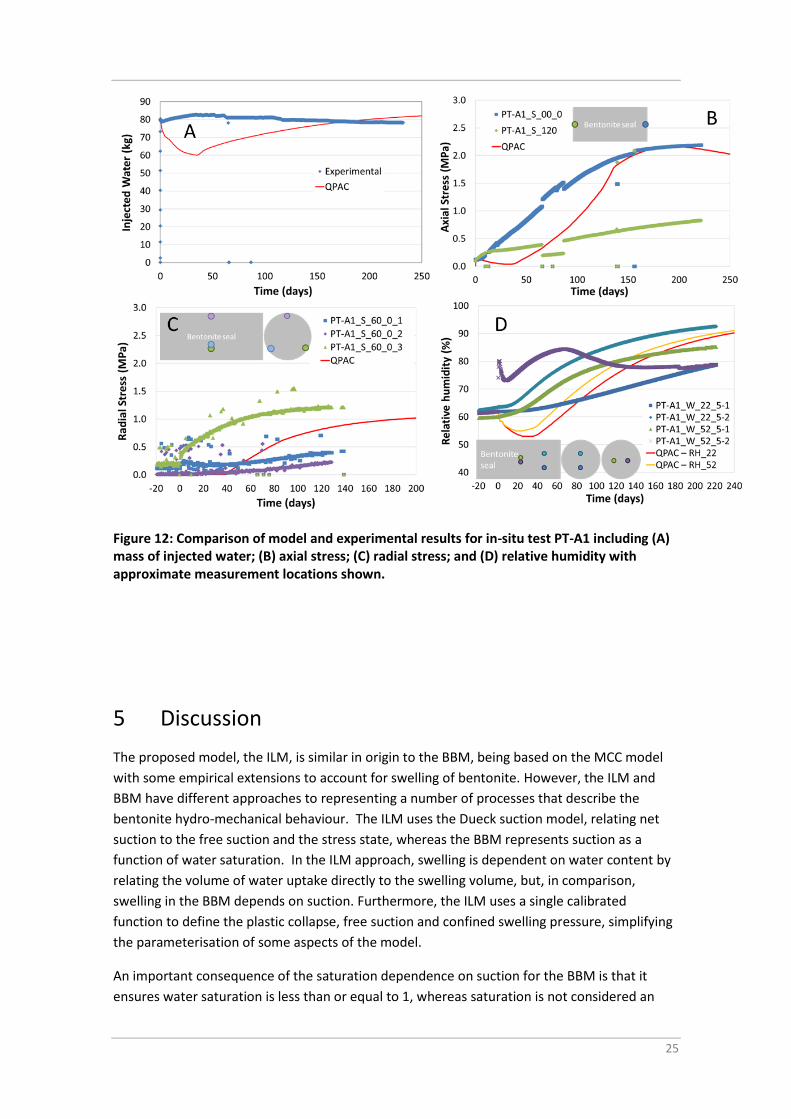
The modelled amount of water injected in Phase 1 is dependent on the void space in the
model, so the model results are only reported from the start of Phase 2. Figure 12A shows
water being squeezed out of the “technological void” as the seal swells into the void, because
the bentonite swells faster than the water is able to enter the bentonite. This behaviour in the
model is very sensitive to the parameterisation and is derived from a specific set of
assumptions regarding the behaviour of water in the void (e.g. no gel formation). Given the
parametric sensitivity, this result should be treated with caution.
The modelled relative humidity lies generally within the range of the measured values (Figure
12D). The model shows a dip in relative humidity at the start of the experiment that is caused
by an increase in suction, which is in turn caused by an increase in the free swell suction
because the dry density has decreased. This increase in dry density is caused by the outer
annulus of the cylinder of bentonite expanding, and because we are considering a continuous
solid, tends to cause the inner part of the bentonite cylinder also to expand.
The modelled axial stress lies between the measurements at either end of the sample, which is
a reasonable result since it was expected that the axial stress should be the same at either end
of the sample. After an initial increase in stress the model actually shows a decrease in stress
due to plastic failure, which is consistent with the mock-up test data, but such a decrease is
not shown in the in-situ test data. This could be due to different methods of measuring stress
in the two experiments. In the mock-up test, stress was measured by a piston across the whole
sample, whereas in the in-situ test, stress was measured only at the centre of the sample.
Data from the experiment indicate that it takes around 30 days for the seal to swell into the
technological void, so radial stresses only start to build up after this point. The magnitude of
the radial stress is well matched for one of the sensor locations, but given the experimental
set-up, it is not clear why sensors located at similar heights in the experiment should not show
similar stresses. .
25
Figure 12: Comparison of model and experimental results for in-situ test PT-A1 including (A) mass of injected water; (B) axial stress; (C) radial stress; and (D) relative humidity with approximate measurement locations shown.
5 Discussion
The proposed model, the ILM, is similar in origin to the BBM, being based on the MCC model
with some empirical extensions to account for swelling of bentonite. However, the ILM and
BBM have different approaches to representing a number of processes that describe the
bentonite hydro-mechanical behaviour. The ILM uses the Dueck suction model, relating net
suction to the free suction and the stress state, whereas the BBM represents suction as a
function of water saturation. In the ILM approach, swelling is dependent on water content by
relating the volume of water uptake directly to the swelling volume, but, in comparison,
swelling in the BBM depends on suction. Furthermore, the ILM uses a single calibrated
function to define the plastic collapse, free suction and confined swelling pressure, simplifying
the parameterisation of some aspects of the model.
An important consequence of the saturation dependence on suction for the BBM is that it
ensures water saturation is less than or equal to 1, whereas saturation is not considered an

26
important constraint in the ILM, with saturations able to rise above 1. This is consistent with
experimental evidence both from the literature (e.g. Jacinto et al., 2012) and with observations
from laboratory data in the SEALEX experiments, where more water entered the sample during
determination of the constant volume water retention curve than there was calculated pore
space. Hydraulic and mechanical processes are more strongly coupled in the ILM than the
BBM, through the ILC used for both the water retention curve and the virgin consolidation line,
as well as suction being dependent upon stress in the sample. Coupling these processes makes
conceptual sense in terms of stress (or energy) conservation within the bentonite and also
makes parameterisation of some aspects of the model simpler through the easily measured
ILC.
The ILM has been successfully applied to the SEALEX experiments considered. The most
difficult experiment to understand is the in-situ experiment, PT-A1, and this is reflected in the
poorer correspondence between the model results and the experimental observations. This
was not a surprising result, given that the data are not readily understandable based on the
description of the experiment. Further evidence that there may be problems with the PT-A1
experimental data can be obtained from comparison with the mock-up test. The mock-up test
was designed to be similar to the in-situ test and therefore it might be expected that similar
trends would be seen in the water injection data (although different magnitudes) and similar
trends and magnitudes in the swelling data. The mass of water injected into the experiment
shows quite different trends between the two experiments. In the mock-up test, the mass
increases monotonically, where as in the in-situ experiment, after the initial rapid increase, the
mass of water injected into the system decreases after 50 days. There is not a clear
explanation for the difference between these experiments that would cause such different
injection trends. The swelling pressure for both experiments is similar, reaching an axial
swelling pressure of around 2 MPa at around 200 days although this result is only found in one
of the two axial stress sensors in the in-situ experiment; stress at sensor PT-A1_S_00_0 is
consistent with the mock-up test whereas PT-A1_S_120 is not.
The experimental results from the mock-up test have been compared to another SEALEX in-
situ test, PT-N1 (Wang et al., 2013d). PT-N1 has exactly the same experimental design as PT-A1
however, the results from the two experiments are quite different. Wang et al. (2013d) show
that there is a good correspondence between the results of PT-N1 and the mock-up test and a
visual comparison of the PT-N1 results to the in-situ model results also shows good
correspondence. This evidence suggests that the differences between the model results and
experimental finding from PT-A1 may be in part caused by experimental procedure and should
not be interpreted as a problem with the model.
The comparison of the ILM results with laboratory and mock-up test results shows that the ILM
is capable of representing the key processes required. With a dry density dependent intrinsic
permeability, the ILM reproduced the infiltration test results. The hydro-mechanical parts of
the ILM are able to reproduce the oedometer data, including initial swelling during suction
imposition and the subsequent stress response to loading and unloading. The plastic collapse
seen in the mock-up test was reproduced by the model, albeit occuring over a more rapid
timescale than experimentally observed, however alternative calibrations were possible that
better reproduced the timing at the expense of poorer fits to the other experimental data.

27
Areas for improvement of the model include an improved model for hydraulic conductivity at
higher water saturations to improve the fit of to the infiltration test data close to the water
inlet, and an improved swelling model to enable the model of the mock-up test to capture the
swelling both in Phase 1 and in Phase 3.
A key process that has not been included explicitly in the models is the formation of gel in the
technological void in the mock-up and in-situ tests. Gel is expected to form in the technological
void in the mock-up test where bentonite was in contact with free water, by exfoliation of
bentonite sheets into the water. It is not clear whether the gel impacts the uptake of water
into the main mass of the sample, or whether it affects the development of radial stress in the
sample, or has a role in clogging water flow in the technological void. These effects may be
implicitly included in the parameterisation of the model, but further consideration of gel
formation may improve models, particularly where some of the bentonite has a very high
water content and there is significant void space.
Notwithstanding the problematic data for the in-situ test, the overall approach to defining a
single model parameterisation for all experiments has been successful. Whilst calibrations to
individual experiments produced a closer fit between model and data, it is important to
consider a parameterisation across all the experiments if true prediction of experimental
outcomes is required. A blind prediction exercise was performed whereby the mock-up test
results were predicted based only on the laboratory data (Millard et al., 2016). This exercise
revealed that whilst it was possible to predict the end points of the experiment (e.g. swelling
pressure and volume of water injected) reasonably well (indeed a numerical analysis wasn’t
required for this), the details of the transient effects were much more difficult to predict. The
data provided from the laboratory experiments were found to be insufficient in defining a
unique model for the mock-up test and, in particular, data on the water content at various
stages of the oedometer tests and measures of radial alongside axial stresses would have
provided much greater constraints for the models.
6 Conclusions
A new model for the hydro-mechanical behaviour of bentonite is proposed, based on the
observation that there appears to be a limiting stress that a sample of bentonite can be under,
whether that stress is caused by swelling, compaction or suction. This observation enabled
linking of the hydraulic and mechanical models through a single equation called the Internal
Limit Curve.
The model was successfully used to represent a range of experiments conducted under the
SEALEX experimental programme. The approach to modelling the experiments was to find a
single parameter set that could be used to model all experiments and this was achieved with
particularly good results for experimental data from the laboratory and mock-up tests. The
modelling results for the in-situ test (PT-A1) represented the experimental data less well, but
this may be due to experimental conditions rather than a short-coming of the model.

28
Whilst the model generally performs well, there is scope for improvement in two areas in
particular. The hydraulic properties of the bentonite when the water content is high would
merit further work, to improve the time dependent behaviour of the model, and some further
work on swelling could improve the mock-up test model in Phases 1 and 3. In addition, when
bentonite is resaturated in the presence of a void space, exfoliation is expected to cause
particles of bentonite to move into the water, forming a gel in the void space; as bentonite
swells to fill the void the gel will be compressed and is expected to return to a solid bentonite.
This process has not been represented in the model but could be important for understanding
how water enters the bentonite and the final dry density distribution of the bentonite.
The model has been developed specifically for the SEALEX experiments, but should be
applicable more generally to a range of bentonite types, different bentonite/sand mixtures
and for a range of experiments. Further work is required to confirm that this is the case.
7 References
Alonso E, Gens A, Josa A (1990) A constitutive model for partially saturated soils. Géotechnique
40(3):405-430
Alonso EE, Vaunat J, Gens A (1999) Modelling the mechanical behaviour of expansive clays.
Engineering Geology 54:173-183. doi:10.1016/S0013-7952(99)00079-4
Barnichon J-D, Dick P, Bauer C (2011) The SEALEX in situ experiments: Performance tests of
repository seals. In: Harmonising Rock Engineering and the Environment – Qian & Zhou (eds)
© 2012 Taylor & Francis Group, London, ISBN 978-0-415-80444-8, pp. 1391-1394
Benbow SJ, Rivett MO, Chittenden N, Herbert AW, Watson S, Williams SJ, Norris S (2014)
Potential migration of buoyant LNAPL from Intermediate Level Waste (ILW) emplaced in a
geological disposal facility (GDF) for UK radioactive waste. Journal of Contaminant Hydrology
167, 1–22
Bond A, Thatcher K, Chittenden N, McDermott C, Fraser-Harris, A (2014) RWM Coupled
Processes Project: First Annual Report for RWM participation in DECOVALEX-2015 Tasks A and
C1. AMEC report to RWM 18040-TR-002 v2.0.
Bond A, Thatcher K, Chittenden N, McDermott C, Fraser-Harris, A (2015a) RWM Coupled
Processes Project: Second Annual Report for RWM participation in DECOVALEX-2015 Tasks A
and C1. AMEC report to RWM 18040-TR-003 v3.0.
Bond A, Thatcher K, Chittenden N, McDermott C, Fraser-Harris, A (2015b) RWM Coupled
Processes Project: Third Annual Report for RWM participation in DECOVALEX-2015 Tasks A and
C1. AMEC Foster Wheeler report to RWM 18040-TR-004 v2.0.
Bond A, Thatcher K, Chittenden N, McDermott C, Fraser-Harris, A Wilson J. (2015c) Final Report
of the Coupled Processes Project: Outcomes from DECOVALEX-2015. AMEC Foster Wheeler
report to RWM 18040-TR-005 v1.0.Bond A, Millard A, Nakama S, Zhang C, Garitte B. (2013)

29
Approaches for representing hydromechanical coupling between large engineered voids and
argillaceous porous media at ventilation experiment, Mont Terri. Journal of Rock Mechanics
and Geotechnical Engineering 2013; 5 (2).
Dueck, A., 2004, Hydro-mechanical properties of a water unsaturated sodium bentonite. Phd
Thesis, Lund University, 250 p.
Jacinto AC, Villar M, Ledesma A (2012). Influence of water density on the water retention curve
of expansive clays. Géotechnique 62 (8), 657–667.
Mayor JC, García-Siñeriz JL, Alonso E, Alheid HJ, P. Blümbling (2005): Final report of
theEngineered Barrier Emplacement Experiment in Opalinus Clay (FIS5 - 1999 – 00121
EURATOM).
Maul, P., 2013. QPAC: Quintessa’s general-purpose modelling software. Quintessa Report QRS-
QPAC-11. Available at www.quintessa.org
Millard A, Mokni N, Barnichon J-D, Thatcher KE, Bond AE, Fraser-Harris AP, McDermott C,
Blaheta R, Michalec Z, Hasal M, Nguyen T-S, Nasir O, Fedors R, Yi H, Kolditz O, 2016a
Comparative modelling of laboratory experiments for the hydro-mechanical behaviour of a
compacted bentonite-sand mixture. Submitted to this volume
Millard A, Mokni N, Barnichon J-D, Thatcher KE, Bond AE, Fraser-Harris AP, McDermott C,
Blaheta R, Michalec Z, Hasal M, Nguyen T-S, Nasir O, Yi H, Kolditz O, 2016b Comparative
modelling approaches of hydro-mechanical processes in sealing experiments at the
Tournemire URL. Submitted to this volume
Nagra (2013). Main outcomes and review of the FEBEX In Situ Test (GTS) and Mock-Up after 15
years of operation. Arbeitsbericht NAB 13-96.
Navarro, V., Asensio, L., Alonso, J., Yustres, Á., Pintado, X (2016). Multiphysics Implementation
of Advanced Soil Mechanics Models. Computers and Geotechnics 60 (2014) 20-28.
Roscoe KH, Schofield AN (1963) Mechanical behaviour of an idealised ‘wet clay’. Proc. 2nd
European Conf. on Soil Mechanics and Foundation Engineering, Wiesbaden, 1:47-54.
Roscoe KH, Burland JB (1968) On the generalised stress-strain behaviour of ‘wet clay’.
Engineering Plasticity, edited by J Heyman and FA Leckie, 535-609, Cambridge University Press.
Rutqvist J, Ijiri Y, Yamamoto H (2011) Implementation of the Barcelona Basic Model into
TOUGH-FLAC for simulations of the geomechanical behaviour of unsaturated soils. Computers
& Geosciences 37:751-762. doi:10.1016/j.cageo.2010.10.011
Rutqvist J, Zheng L, Chen F, Liu H-H, Birkholzer (2014) Modelling of coupled thermo-hydro-
mechanical processes with links to geochemistry associated with bentonite-backfilled
repository tunnels in clay formations. Rock Mech Rock Eng 47:167-186. doi:10.1007/s00603-
013-0375-x

30
Sellin P, Leupin OX (2013) The use of clay as an engineered barrier in radioactive-waste
management – A review. Clay and clay minerals 61:477-498. doi:
10.1346/CCMN.2013.0610601
Kristensson O and Börgesson L (2015). Canister Retrieval Test: Final report. SKB Technical
Report TR-14-19.
Thatcher KE, Bond AE, Norris S, 2016 Engineered damage zone sealing during a water injection
test at the Tournemire URL. Submitted to this volume
Wang Q, Tang AM, Cui Y-J, Delage P, Gatmiri B (2012) Experimental study of the swelling
behaviour of bentonite/claystone mixture. Engineering Geology, 124:59-66
doi:10.1016/j.enggeo.2011.10.003
Wang Q, Cui Y-J, Tang AM, Barnichon J-D, Saba S and Ye W-M (2013a) Hydraulic conductivity
and microstructure changes of compacted bentonite/sand mixture during hydration.
Engineering Geology, 164:67-76 doi:10.1016/j.enggeo.2013.06.013
Wang Q, Tang AM, Cui Y-J, Barnichon J-D, Ye W-M (2013b) Investigation of the hydro-
mechanical behaviour of compacted bentonite/sand mixture based on the BExM. Computers
and Geotechnics 54:46-52. doi:10.1016/j.cageo.2010.10.011
Wang Q, Tang AM, Cui Y-J, Delage P, Barnichon J-D, Ye W-M (2013c) The effects of
technological voids on the hydro-mechanical behaviour of compacted bentonite-sand mixture.
Soils and Foundations 53:232-245 doi:10.1016/j.sandf.2013.02.004
Wang Q, Tang AM, Cui Y-J, Barnichon J-D, Ye W-M (2013d) A comparative study on the hydro-
mechanical behaviour of compacted bentonite/sand plug based on laboratory and field
infiltration tests. Engineering Geology 162:79-87 doi:10.1016/j.enggeo.2013.05.009
31
Supplementary Material:
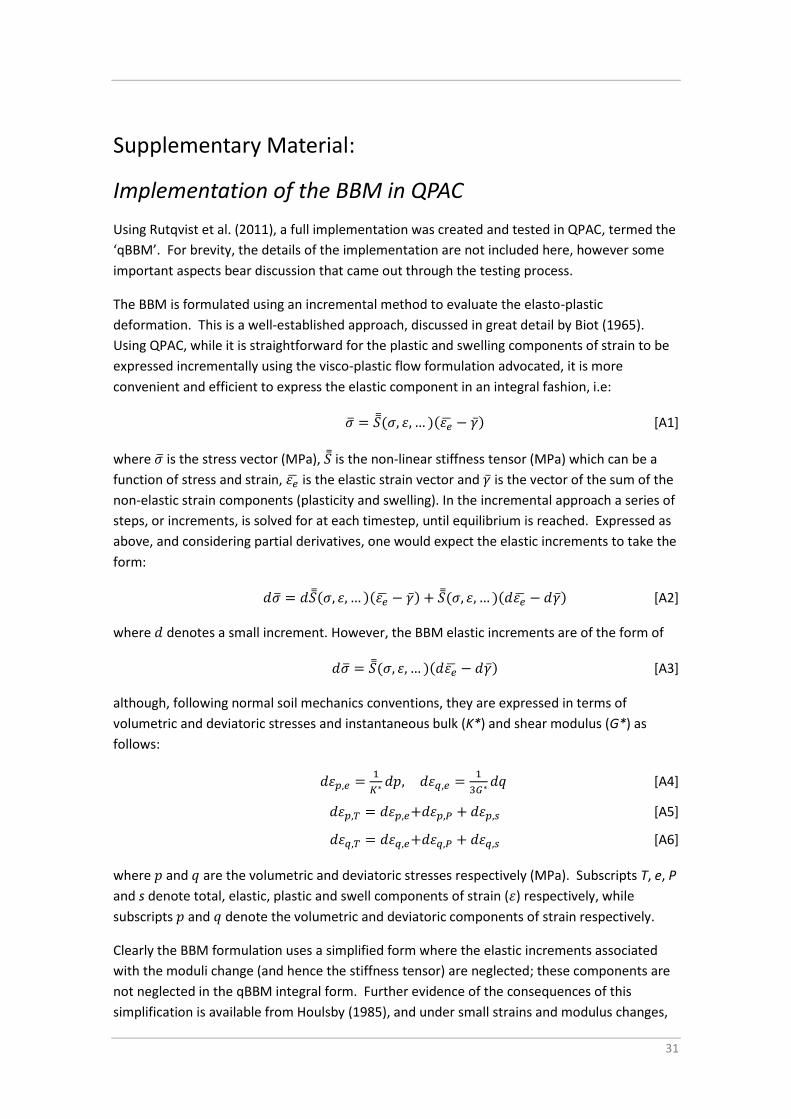
Implementation of the BBM in QPAC
Using Rutqvist et al. (2011), a full implementation was created and tested in QPAC, termed the
‘qBBM’. For brevity, the details of the implementation are not included here, however some
important aspects bear discussion that came out through the testing process.
The BBM is formulated using an incremental method to evaluate the elasto-plastic
deformation. This is a well-established approach, discussed in great detail by Biot (1965).
Using QPAC, while it is straightforward for the plastic and swelling components of strain to be
expressed incrementally using the visco-plastic flow formulation advocated, it is more
convenient and efficient to express the elastic component in an integral fashion, i.e:
�̅� = 𝑆̿(𝜎, 𝜀, … )(𝜀�̅� − �̅�) [A1]
where �̅� is the stress vector (MPa), 𝑆̿ is the non-linear stiffness tensor (MPa) which can be a
function of stress and strain, 𝜀�̅� is the elastic strain vector and �̅� is the vector of the sum of the
non-elastic strain components (plasticity and swelling). In the incremental approach a series of
steps, or increments, is solved for at each timestep, until equilibrium is reached. Expressed as
above, and considering partial derivatives, one would expect the elastic increments to take the
form:
𝑑�̅� = 𝑑𝑆̿(𝜎, 𝜀, … )(𝜀�̅� − �̅�) + 𝑆̿(𝜎, 𝜀, … )(𝑑𝜀�̅� − 𝑑�̅�) [A2]
where 𝑑 denotes a small increment. However, the BBM elastic increments are of the form of
𝑑�̅� = 𝑆̿(𝜎, 𝜀, … )(𝑑𝜀�̅� − 𝑑�̅�) [A3]
although, following normal soil mechanics conventions, they are expressed in terms of
volumetric and deviatoric stresses and instantaneous bulk (K*) and shear modulus (G*) as
follows:
𝑑𝜀𝑝,𝑒 =1
𝐾∗ 𝑑𝑝, 𝑑𝜀𝑞,𝑒 =1
3𝐺∗ 𝑑𝑞 [A4]
𝑑𝜀𝑝,𝑇 = 𝑑𝜀𝑝,𝑒+𝑑𝜀𝑝,𝑃 + 𝑑𝜀𝑝,𝑠 [A5]
𝑑𝜀𝑞,𝑇 = 𝑑𝜀𝑞,𝑒+𝑑𝜀𝑞,𝑃 + 𝑑𝜀𝑞,𝑠 [A6]
where 𝑝 and 𝑞 are the volumetric and deviatoric stresses respectively (MPa). Subscripts T, e, P
and s denote total, elastic, plastic and swell components of strain (𝜀) respectively, while
subscripts 𝑝 and 𝑞 denote the volumetric and deviatoric components of strain respectively.
Clearly the BBM formulation uses a simplified form where the elastic increments associated
with the moduli change (and hence the stiffness tensor) are neglected; these components are
not neglected in the qBBM integral form. Further evidence of the consequences of this
simplification is available from Houlsby (1985), and under small strains and modulus changes,

32
the impacts of these missing components will be small. As expressed in ‘p’ ‘q’ space the key
differences between the BBM-FLAC and qBBM models are illustrated schematically in Figure
A1. As plastic strain accumulates, the two models deviate giving rise to different 𝑝-𝑞 gradients
under loading and unloading in the qBBM. In contrast the BBM shows the same 𝑝-𝑞 gradient
for both loading and unloading paths when plastic strain is not being incremented. The
behaviours of the two models are identical if the bulk modulus is kept constant, and this was
demonstrated through simple qBBM - FLAC benchmarking. Experimental data of the type that
can be plotted in 𝑝-𝑞 space is limited, but there is some evidence of 𝑝-𝑞 lines changing
gradient (Rutqvist et al., 2011).
Figure A1. Illustration of the effect of the integral method versus the conventional BBM approach for a simple oedometer test in p-q space for constant suction.
A further issue relates to the elastic model used in the BBM. The model implies non-zero
strain at zero stress and a very small bulk modulus at low strains - the BBM bulk modulus is of
the form:
𝐾∗ = (1 + 𝑒)𝜎𝑝
𝜅 [A7]
where 𝜅 is the elastic modulus (dimensionless) and a function of suction. In practice the
(1 + 𝑒) term is relatively weak and is discarded in some formulations. Integrating this
equation for a constant suction yields an integral form of the bulk modulus:
𝐾 = 𝜎𝑝,0
exp(𝜀𝑝,𝑒
𝑒0𝜅)
𝜀𝑝,𝑒 [A8]
where 𝜎𝑝,0 is the reference volumetric stress (by convention 0.1 or 0.01 MPa), 𝑒0 is the
reference void ratio. This version of the BBM elastic model is extremely unstable, tending to
infinity at very low strains, dropping to a minimum value and then increasing at larger strains.
For this reason, an alternative bulk modulus model was implemented that approximates the
BBM of the form of model used in the ILM (see main paper, equation 4). In terms of the
Elastic Loading
Plastic Loading
Elastic Recovery
BBM
qBBM
p
q
Roller
boundaries
Bentonite
sample
Specified stress

33
hydraulics, the BBM and qBBM were defined to be functionally identical. Overall the hydro-
mechanical qBBM model, like the BBM, requires 21 or more free parameters (depending on
the options chosen) to implement a single model.
Given the potentially problematic form of the BBM when expressed in an integral form, and
the simplifications in the standard incremental form of the BBM compared with the integral
form, the benefits of using a BBM approach for the DECOVALEX Task A work were considered
to be outweighed by the disadvantages, hence the alternative approach documented in the
main paper was pursued.
Additional References
Biot M.A. (1965). Mechanics of Incremental Deformation. John Wiley & Sons, Inc., New
York/London/Sydney.
Houlsby G.T. (1985). Use of a variable shear modulus in elastic-plastic models for clays.
Computers and Geotechnics 1: 3-13.
Rutqvist J., Ijiri Y. and H. Yamamoto. (2011). Implementation of the Barcelona Basic Model into
TOUGH–FLAC for simulations of the geomechanical behavior of unsaturated soils. Computers
and Geosciences 37:751-762.