A Two-Dimensional Velocity Dealiasing Algorithm for the WSR-88D
RADAR OPERATIONS CENTER
ECP 511 2D Velocity Dealiasing Field Test
Final Report
W. David Zittel 8/31/2012
______________________
W. David Zittel
Test Director
ABSTRACT: A field test of a new two-dimensional velocity dealiasing algorithm (2DVDA) for the WSR-88D was scheduled to coincide with the 2011 hurricane season and included 8 coastal and 5 non-coastal sites. The test could not be completed as originally intended due to problems with the software modifications needed to run the algorithm at field sites. Instead, non-operational RPGs within the ROC’s Applications Branch were configured to record data from 8 WSR-88Ds as Hurricane Irene traveled up the eastern U.S. seaboard August 25-28, 2011. Sites included in the Irene study were Miami, FL, Melbourne, FL, Charleston, SC, Wilmington, NC, Morehead City, NC, Wakefield, VA, Sterling, VA, and Upton, NY. For the ½° azimuthal resolution velocity products at or below 1.5° elevation, the legacy Velocity Dealiasing Algorithm (VDA) had an error rate of 11.98% while the new 2DVDA had an error rate of 0.85%. For the 1° azimuthal resolution velocity products, the legacy VDA had an error rate of 11.17% while the 2DVDA had an error rate of 1.28%. This report compares the velocity dealiasing results between the two algorithms for data from Hurricane Irene and provides examples. It examines the impact of the 2DVDA on kinematic algorithms. In particular, the Mesocyclone Detection Algorithm has a 45% reduction in false detections due to better handling of noisy velocity data. Velocity data from Hurricane Ike (2008) shows that 2DVDA-dealiased velocities have about a 1 m/s increase in magnitude for velocities above the Nyquist velocity. Finally, the report includes examples of the legacy VDA dealiasing errors in clutter from the Amarillo, TX WSR-88D that the 2DVDA was able to handle correctly.
1
Table of Contents Page
1. INTRODUCTION ...............................................................................................................3
2. REASONS FOR ABORTING THE FIELD TEST .............................................................3
3. RESTRUCTURED TEST ....................................................................................................4
4. HURRICANE IRENE ANALYSIS .....................................................................................4
4.1 Methodology ............................................................................................................6
4.2 Irene Base Velocity Comparison Results ................................................................7
4.2 Irene Discussion and Examples ...............................................................................9
5. KINEMATIC ALGORITHM EVALUATIONS ...............................................................12
5.1 Enhanced VAD Wind Profile Algorithm ...............................................................12
5.2 Mesocyclone Detection Algorithm ........................................................................17
5.3 Tornado Detection Algorithm ................................................................................19
6. HURRICANE IKE COMPARISON .................................................................................19
7. AMARILLO (KAMA) ANALYSIS ..................................................................................21
8. RESTRICTIONS ON THE USE OF THE 2DVDA ..........................................................22
9. SUMMARY .......................................................................................................................23
10. ACKNOWLEDGMENTS .................................................................................................23
11. REFERENCES ..................................................................................................................23
2
List of Figures
Figure 1. Graphical depiction of WSR-88D sites used in the analysis of Hurricane Irene. ........................................... 5
Figure 2. Hurricane Irene August 28, 2012 from Upton, NY WSR-88D (KOKX) at 07:21Z ..................................... 11
Figure 3. Hurricane Irene August 27, 2011 from Wakefield, VA WSR-88D (KAKQ) at 15:23Z ............................ 131
Figure 4. Hurricane Irene August 27, 2011 from Wilmington, NC WSR-88D (KLTX) at 04:05Z ........................... 132
Figure 5a. EVWP product from 2DVDA-dealiased velocity data for KLTX on August 27, 2011 at 00:37Z ........... 133
Figure 5b. EVWP product from legacy VDA-dealiased velocity data for KLTX on August 27, 2011 at 00:37Z .... 134
Figure 6a. Vertical profile of wind speeds for the VWP product August 27, 2011 at 00:19Z for KLTX.................. 135
Figure 6b. Vertical profile of RMS values for the VWP product August 27, 2011 at 00:19Z for KLTX ................. 136
Figure 7. Time series of wind direction at 3 kft and 15 kft for KLTX for August 26-27, 2011 from 21Z to 03Z ..... 137
Figure 8. Scatterplot of mesocyclones for KAKQ August 27, 2011 from 15:23Z to 21:05Z .................................... 138
Figure 9. Number of mesocyclones detected by the MDA during Irene for KLTX, KAKQ, and KOKX ................ 138
Figure 10. Results of the Tornado Detection Algorithm from KAKQ August 27, 2011, 12:32Z ............................. 139
Figure 11. Hurricane Ike September 13, 2008 from Houston, TX WSR-88D (KHGX) at 04:39Z ............................. 20
Figure 12. Histograms of legacy VDA and 2DVDA for velocity data from Figure 11 ............................................... 20
Figure 13. KAMA super resolution velocity data from August 23, 2011 at 22:07Z at 0.5° elevation ........................ 21
Figure 14. KAMA super resolution velocity data from August 23, 2011 at 21:12Z at 6.4° elevation ........................ 22
List of Tables
Table 1. WSR-88D sites, Volume coverage patterns and number of volume scans used in the Hurricane Irene
analysis ................................................................................................................................................................. 6
Table 2. Pairing of elevation angles between the VCPs to facilitate statistical analysis. ............................................. 7
Table 3. No. of velocity products with errors for the legacy VDA and the 2DVDA for ½° resolution split cuts by
elevation for Hurricane Irene. .............................................................................................................................. 7
Table 4. No. of velocity products with errors for the legacy VDA and the 2DVDA for 1° resolution split cuts by
elevation for Hurricane Irene. .............................................................................................................................. 7
Table 5. No. of velocity products with errors elevation angle and waveform for Hurricane Irene............................... 8
Table 6. No. of products examined by waveform and by site for Hurricane Irene. ...................................................... 8
Table 7. No. of velocity products with errors by WSR-88D site and by waveform.. ................................................... 9
Table 8. Summary of error counts and sizes for legacy VDA and 2DVDA for three hurricanes. .............................. 10

3
ECP 511 2D Velocity Dealiasing Field Test - Final Report
Radar Operations Center, Applications Branch
W. David Zittel
1. INTRODUCTION
The original goal and intent of the 2-Dimensional Velocity Dealiasing Algorithm (2DVDA) field
test was to provide Radar Operations Center (ROC) Applications Branch meteorologists a
chance to independently evaluate the performance of the new algorithm and to give forecasters in
the field hands-on experience. Conducting a field test before full deployment is desirable as it
provides real time experience with new technology and can gain support for new technology
from operational users if it can be shown to be superior to older technology, which, in this case
was the legacy Velocity Dealiasing Algorithm (VDA). Thirteen sites were recruited to
participate in the field test. From the Weather Service’s Central Region they included Des
Moines, IA (KDMX), Goodland, KS (KGLD), and Pueblo, CO (KPUX); from the Eastern
Region they included Burlington, VT (KCXX) and Wilmington, NC (KLTX); from the Southern
Region they included Brownsville, TX (KBRO), Corpus Christi, TX (KCRP), Key West, FL
(KBYX), Lake Charles, LA (KLCH), Miami, FL (KAMX), and Tallahassee, FL (KTLH); and
from the Western Region they included Boise, ID (KCBX) and Great Falls, MT (KTFX). The
test was to begin in mid-August 2012 and run through the end of the year. As discussed in
Section 2 we were not able to complete the field test as originally planned.
2. REASONS FOR ABORTING THE FIELD TEST
To facilitate development and testing, a version of the 2DVDA software has been incorporated
into the RPG software in a non-operational mode for the past couple of years. That is, while
field sites have no way to activate the algorithm, developers using non-operational RPGs can run
and test the 2DVDA. The most advanced version was slated for fielding in the summer of 2012
in ORPG Software Build 13 with the goal of making it operational at that time. To facilitate the
field test for the summer/fall of 2011 we needed to implement the RPG Build 13 version of the
2DVDA into Build 12.2 RPG software that was already fielded. A software modification kit was
assembled that included a new azimuthal recombination algorithm and installation directives to
run one instance of the velocity dealiasing software for super resolution ½° products on one RPG
processor (A) and a second instance of the velocity dealiasing software for 1° resolution products
on the second RPG processor (B). After sites installed the modifications, at least three separate
problems were observed: 1) the task to transmit Level 2 Archive data via the LDM feed aborted
itself; 2) both instances of the velocity dealiasing algorithm ended up installed on the same RPG
processor; and 3) the recombination algorithm was non-compliant with coding standards in that
it allowed a radial to be tagged with an azimuth of 360° whereas coding standards require the
azimuth to be set to 0°. The first problem caused the WSR-88D NWS sites to not be able to send
their Level 2 Archive data to NCDC for archival. The second problem resulted in failures in one
or both instances of the velocity dealiasing algorithm when significant weather was present. The
Des Moines WSR-88D site in particular was adversely impacted. They uninstalled the software
modifications but hadn’t disabled the 2DVDA and so with the modified software removed were
unable to turn off the 2DVDA. Consequently the velocity dealiasing algorithms failed with

4
significant weather in the county warning area. Only after putting the radar into VCP 121, which
uses the Multiple PRF Dealiasing algorithm, were they able to stay up. The third problem
resulted in data at 359° being smeared azimuthally through tens of degrees to the first radial in
the scan which may not have been at north. The NCAR/RAP radar data web site was one site
with corrupted velocity data. Any one of the three problems would have been sufficient to abort
the field test. The third problem was the first one noticed. Within two days of observing the
smearing in the velocity data, the test director aborted the field test and asked all sites to uninstall
the software kit. Ten of 13 sites had installed the modification kit. To ensure there were no
residual problems, the ROC director opted to have the affected sites reinstall Software Build
12.2. Because the test bed WSR-88D (KCRI) was already being modified to have dual
polarization, ROC test bed equipment was no longer available for testing corrections to the
software kit so no attempt was made to restart the field test.
3. RESTRUCTURED TEST
As mentioned in Section 1 there were two components to the field test. One was exposure of the
new algorithm to operational users which, for reasons described in Section 2, we were not able to
complete. The other component was to evaluate the performance of the 2DVDA using data from
the WSR-88D field test sites using non-operational Radar Product Generator software within the
Applications Branch. As this portion of the field test simply required Level II data feeds into the
ROC, the errors in the kit mailed to the field sites had no impact. Coincidentally, as the test team
was assessing how to proceed with the test, Hurricane Irene developed in the Atlantic Ocean just
to the east of the Caribbean Sea with a projected track that would take it up the eastern US
seaboard. The test director decided to reconfigure the non-operational RPGs in the Applications
Branch to support data collection from radar sites along the East Coast. The results of this test
were presented at the AMS’s 30th
Conference on Hurricanes and Tropical Meteorology held in
Ponte Vedra Beach, Florida April 15-20, 2012. Much of that material is reproduced in this
report. The original manuscript and presentation are available at the following URL:
https://ams.confex.com/ams/30Hurricane/webprogram/Paper205076.html. The 2DVDA’s
impact on kinematic algorithms is included in this report as well as a brief histogram comparison
from Hurricane Ike. Lastly, we include in this report results from testing the 2DVDA on
Amarillo, TX WSR-88D velocity data during an episode where the site experienced dealiasing
errors in ground clutter with strong storms present.
4. HURRICANE IRENE ANALYSIS
From August 25 through August 28, 2011 Hurricane Irene traveled up the eastern U.S. seaboard.
During this period, velocity products were generated in real time from live Level 2 data feeds
using multiple pairs of non-operational Radar Product Generator (RPG) platforms in the ROC
Applications Branch. One of each RPG pair used the legacy VDA while the second RPG used
the 2DVDA. Files containing the products were saved for review afterwards. Data from the
following WSR-88Ds were included in the evaluation: KAMX (Miami, FL), KMLB (Melbourne,
FL), KCLX (Charleston, SC), KLTX (Wilmington, NC), KMHX (Morehead City, NC), KAKQ
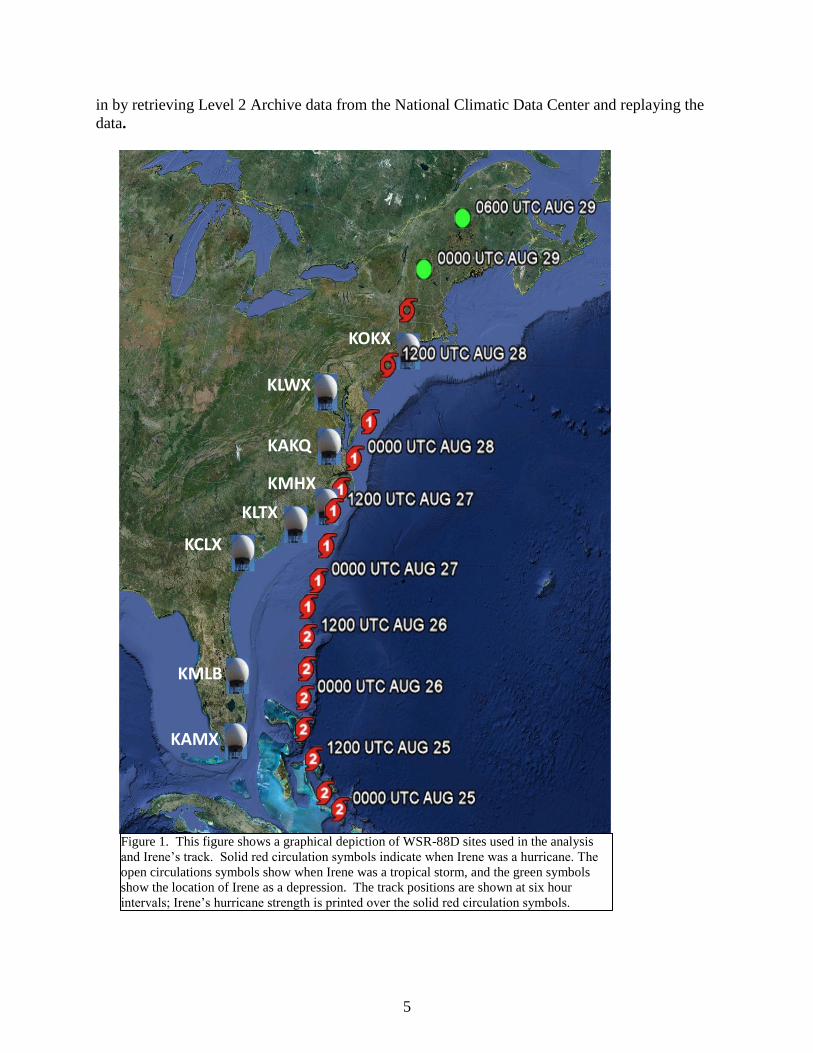
(Wakefield, VA), KLWX (Sterling, VA), and KOKX (Upton, NY). Figure 1 shows, geographic-
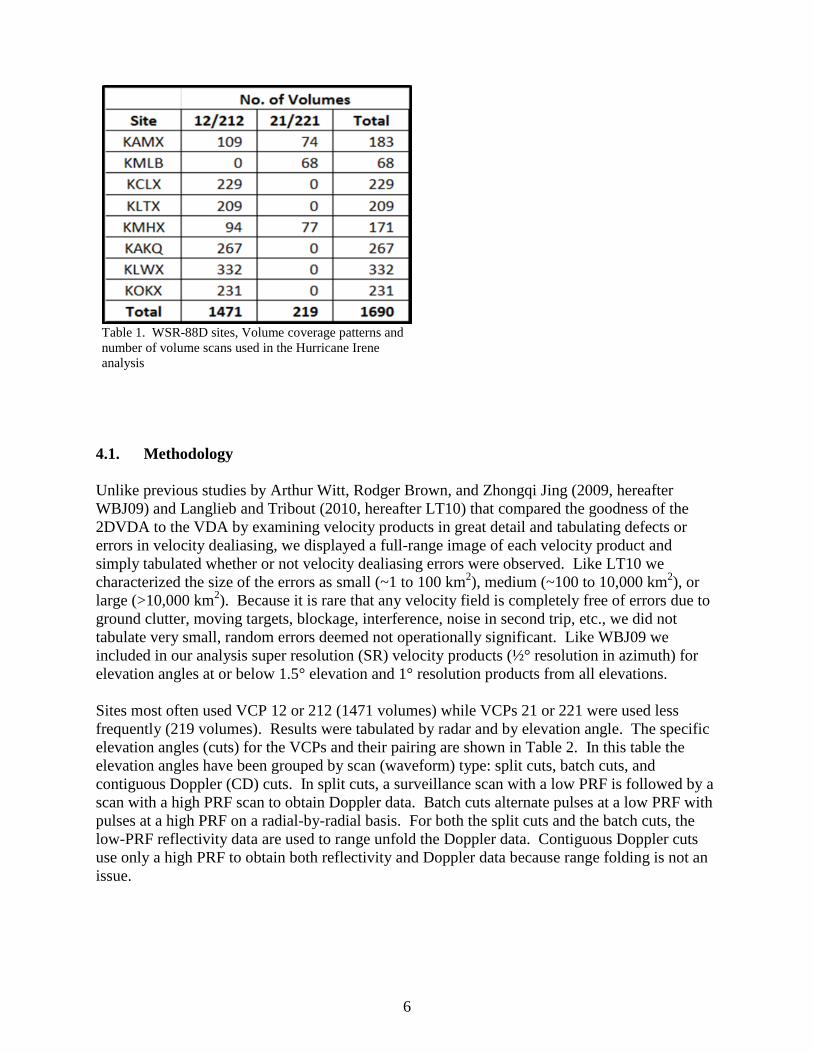
ally, the radars included in the evaluation; Table 1 shows the number of volumes of data for the
radars and the volume coverage patterns. For KLWX and KLTX, data gaps in time were filled
5
KAMX
KMLB
KCLX
KLTX
KMHX
KAKQ
KLWX
KOKX
in by retrieving Level 2 Archive data from the National Climatic Data Center and replaying the
data.
Figure 1. This figure shows a graphical depiction of WSR-88D sites used in the analysis
and Irene’s track. Solid red circulation symbols indicate when Irene was a hurricane. The
open circulations symbols show when Irene was a tropical storm, and the green symbols
show the location of Irene as a depression. The track positions are shown at six hour
intervals; Irene’s hurricane strength is printed over the solid red circulation symbols.
6
4.1. Methodology
Unlike previous studies by Arthur Witt, Rodger Brown, and Zhongqi Jing (2009, hereafter
WBJ09) and Langlieb and Tribout (2010, hereafter LT10) that compared the goodness of the
2DVDA to the VDA by examining velocity products in great detail and tabulating defects or
errors in velocity dealiasing, we displayed a full-range image of each velocity product and
simply tabulated whether or not velocity dealiasing errors were observed. Like LT10 we
characterized the size of the errors as small (~1 to 100 km2), medium (~100 to 10,000 km
2), or
large (>10,000 km2). Because it is rare that any velocity field is completely free of errors due to
ground clutter, moving targets, blockage, interference, noise in second trip, etc., we did not
tabulate very small, random errors deemed not operationally significant. Like WBJ09 we
included in our analysis super resolution (SR) velocity products (½° resolution in azimuth) for
elevation angles at or below 1.5° elevation and 1° resolution products from all elevations.
Sites most often used VCP 12 or 212 (1471 volumes) while VCPs 21 or 221 were used less
frequently (219 volumes). Results were tabulated by radar and by elevation angle. The specific
elevation angles (cuts) for the VCPs and their pairing are shown in Table 2. In this table the
elevation angles have been grouped by scan (waveform) type: split cuts, batch cuts, and
contiguous Doppler (CD) cuts. In split cuts, a surveillance scan with a low PRF is followed by a
scan with a high PRF scan to obtain Doppler data. Batch cuts alternate pulses at a low PRF with
pulses at a high PRF on a radial-by-radial basis. For both the split cuts and the batch cuts, the
low-PRF reflectivity data are used to range unfold the Doppler data. Contiguous Doppler cuts
use only a high PRF to obtain both reflectivity and Doppler data because range folding is not an
issue.
Table 1. WSR-88D sites, Volume coverage patterns and
number of volume scans used in the Hurricane Irene
analysis

7
The number of products evaluated for each elevation angle (or paired elevation angles) is simply
the total number of volume scans. For instance, at 0.5° elevation a total of 1690 SR velocity
products were evaluated while at 0.9° elevation only 1471 SR products were evaluated. The
total number of products evaluated for each algorithm was 9702, 9702, and 8012 for split, batch,
and CD cuts, respectively. Note split cuts include both ½° and 1° resolution products.
Table 2. Pairing of elevation angles between the VCPs to facilitate statistical analysis.
4.2. Irene Base Velocity Comparison Results
For all sites and all elevations the 2DVDA consistently had fewer errors than did the legacy
VDA. Table 3 shows the frequency of errors for all sites by elevation for the SR products in split
cuts. The total number of SR errors for the legacy VDA is 581 while the 2DVDA had only 41
which is more than an order of magnitude fewer. The average error rate (100 x total error
count/(total number of products)) is 11.98% for the legacy VDA and 0.85% for the 2DVDA.
½ Deg Super Resolution Split Cuts
Legacy VDA Error Count 2DVDA Error Count
VCP # of Vols 0.5° 0.9° 1.3°/1.45° Total 0.5° 0.9° 1.3°/1.45° Total
21/221 219 20 - 13 33 1 - 1 2
12/212 1471 286 180 82 548 19 13 7 39
Total 1690 306 180 95 581 20 13 8 41
Table 3. Number of velocity products with errors for the legacy VDA and the 2DVDA for ½° resolution split cuts
by elevation for Hurricane Irene.
Table 4 shows the split cut dealiasing results for the 1° resolution velocity products. The error
rates between the ½° and 1° resolution products are roughly comparable. The legacy VDA
frequency of dealiasing errors is slightly lower for the 1° vs. the ½° resolution products (542 vs.
581). There is ~50% increase in dealiasing errors for the 2DVDA for the 1° resolution products
over the ½° resolution products (62 vs. 41). Still, the 2DVDA average error rate of 1.28% is
almost an order of magnitude smaller than the legacy VDA’s average error rate of 11.17%.
Table 5 shows the number of errors for the batch and contiguous Doppler cuts.
1 Deg Resolution Split Cuts
Legacy VDA Error Count 2DVDA Error Count
VCP # of Vols 0.5° 0.9° 1.3°/1.45° Total 0.5° 0.9° 1.3°/1.45° Total
21/221 219 17 - 10 27 0 - 0 0
12/212 1471 269 161 85 515 26 21 15 62
Total 1690 286 161 95 542 26 21 15 62
Table 4. Number of velocity products with errors for the legacy VDA and the 2DVDA for 1° resolution split cuts by
elevation for Hurricane Irene.
VCPs Split Cuts Batch Cuts Contiguous Doppler Cuts
12/212 0.5° 0.9° 1.3° 1.8° 2.4° 3.1° 4.0° 5.1° 6.4° 8.0° 10.0° 12.5° 15.6° 19.5°
21/221 0.5° 1.45° 2.4° 3.35° 4.3° 6.0° 9.9° 14.6° 19.5°

8
For the batch cuts the dealiasing errors are mostly confined to the lowest two elevation angles at
1.8 and 2.4° for either dealiasing algorithm. Overall, there is ¼ the number of dealiasing errors
in the 2DVDA products over the legacy VDA products (17 vs. 70). The legacy VDA average
error rate is ~0.72% and the 2DVDA average error rate is ~0.18%. The number of products with
errors and the average error rates are exceedingly small for the CD elevation cuts due, primarily,
to our method of evaluation. Although, there was generally little return in the higher elevation
cuts, large-scale images of the velocity products show dealiasing artifacts due to side lobe
contamination.
We also looked at the frequency of errors by radar site. Table 6 shows the number of products
by site for split, batch, and CD cuts. (Refer to Table 1 for the number of volume scans of each
type of VCP for each site.) The site with the fewest products examined was KMLB (748) while
the site with the largest number of products examined was KLWX (5644); the average number of
products per site was about 3400. Some factors that limited the number of products examined
from each site included distance of Hurricane Irene from a radar, use of VCP 121, and the use of
sectorized PRFs. For split cuts (Table 7) the frequency of velocity dealiasing errors between the
½° super-resolution and 1° resolution products using the legacy VDA is roughly comparable and
proportional to the number of products analyzed.
Error Count: Legacy VDA / 2DVDA
Batch Elevation cut 1.8° 2.4° 3.35°/3.1° 4.3°/4.0° 5.1° 6.0°/6.4° Total
Batch Error Count 25 / 10 31 / 6 7 / 1 3 / 0 4 / 0 0 / 0 70 / 17
CD Elevation cut 8.0° 9.9°/10.0° 12.5° 14.6°/15.6° 19.5° - Total
CD Error Count 4 / 1 3 / 2 4 / 1 7 / 4 3 / 0 - 21 / 8
Table 5. Number of velocity products with errors elevation angle and waveform for Hurricane Irene. Each “Error
Count” cell in the table shows the number of legacy VDA products with errors followed by the number of 2DVDA
products with errors.
Site KAMX KMLB KCLX KLTX KMHX KAKQ KLWX KOKX Total
# of Split Products 950 272 1374 1254 872 1602 1992 1386 9702
# of Batch Products 950 272 1374 1254 872 1602 1992 1386 9702
# of CD Products 767 204 1145 1045 701 1335 1660 1155 8012
Total # of Products 2667 748 3893 3553 2445 4539 5644 3927 27416
Table 6. Number of products examined by waveform (split, batch, contiguous Doppler) and by site for Hurricane
Irene.
9
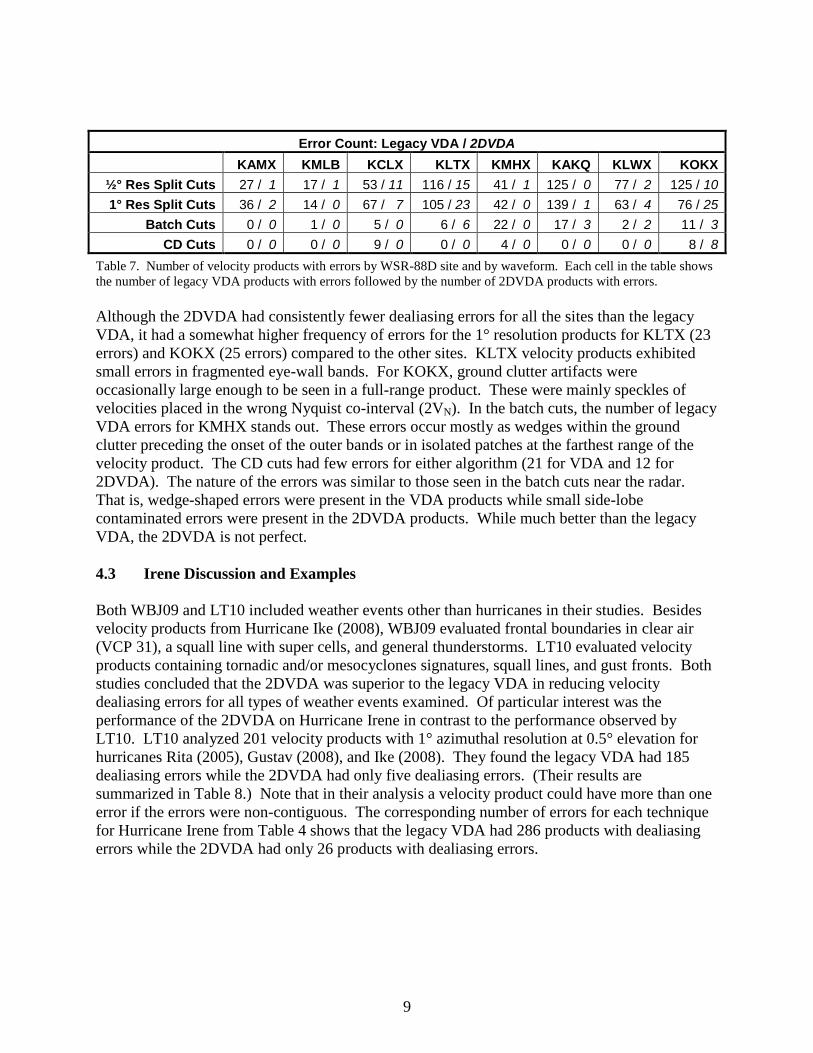
Error Count: Legacy VDA / 2DVDA
KAMX KMLB KCLX KLTX KMHX KAKQ KLWX KOKX
½° Res Split Cuts 27 / 1 17 / 1 53 / 11 116 / 15 41 / 1 125 / 0 77 / 2 125 / 10
1° Res Split Cuts 36 / 2 14 / 0 67 / 7 105 / 23 42 / 0 139 / 1 63 / 4 76 / 25
Batch Cuts 0 / 0 1 / 0 5 / 0 6 / 6 22 / 0 17 / 3 2 / 2 11 / 3
CD Cuts 0 / 0 0 / 0 9 / 0 0 / 0 4 / 0 0 / 0 0 / 0 8 / 8
Table 7. Number of velocity products with errors by WSR-88D site and by waveform. Each cell in the table shows
the number of legacy VDA products with errors followed by the number of 2DVDA products with errors.
Although the 2DVDA had consistently fewer dealiasing errors for all the sites than the legacy
VDA, it had a somewhat higher frequency of errors for the 1° resolution products for KLTX (23
errors) and KOKX (25 errors) compared to the other sites. KLTX velocity products exhibited
small errors in fragmented eye-wall bands. For KOKX, ground clutter artifacts were
occasionally large enough to be seen in a full-range product. These were mainly speckles of
velocities placed in the wrong Nyquist co-interval (2VN). In the batch cuts, the number of legacy
VDA errors for KMHX stands out. These errors occur mostly as wedges within the ground
clutter preceding the onset of the outer bands or in isolated patches at the farthest range of the
velocity product. The CD cuts had few errors for either algorithm (21 for VDA and 12 for
2DVDA). The nature of the errors was similar to those seen in the batch cuts near the radar.
That is, wedge-shaped errors were present in the VDA products while small side-lobe
contaminated errors were present in the 2DVDA products. While much better than the legacy
VDA, the 2DVDA is not perfect.
4.3 Irene Discussion and Examples
Both WBJ09 and LT10 included weather events other than hurricanes in their studies. Besides
velocity products from Hurricane Ike (2008), WBJ09 evaluated frontal boundaries in clear air
(VCP 31), a squall line with super cells, and general thunderstorms. LT10 evaluated velocity
products containing tornadic and/or mesocyclones signatures, squall lines, and gust fronts. Both
studies concluded that the 2DVDA was superior to the legacy VDA in reducing velocity
dealiasing errors for all types of weather events examined. Of particular interest was the
performance of the 2DVDA on Hurricane Irene in contrast to the performance observed by
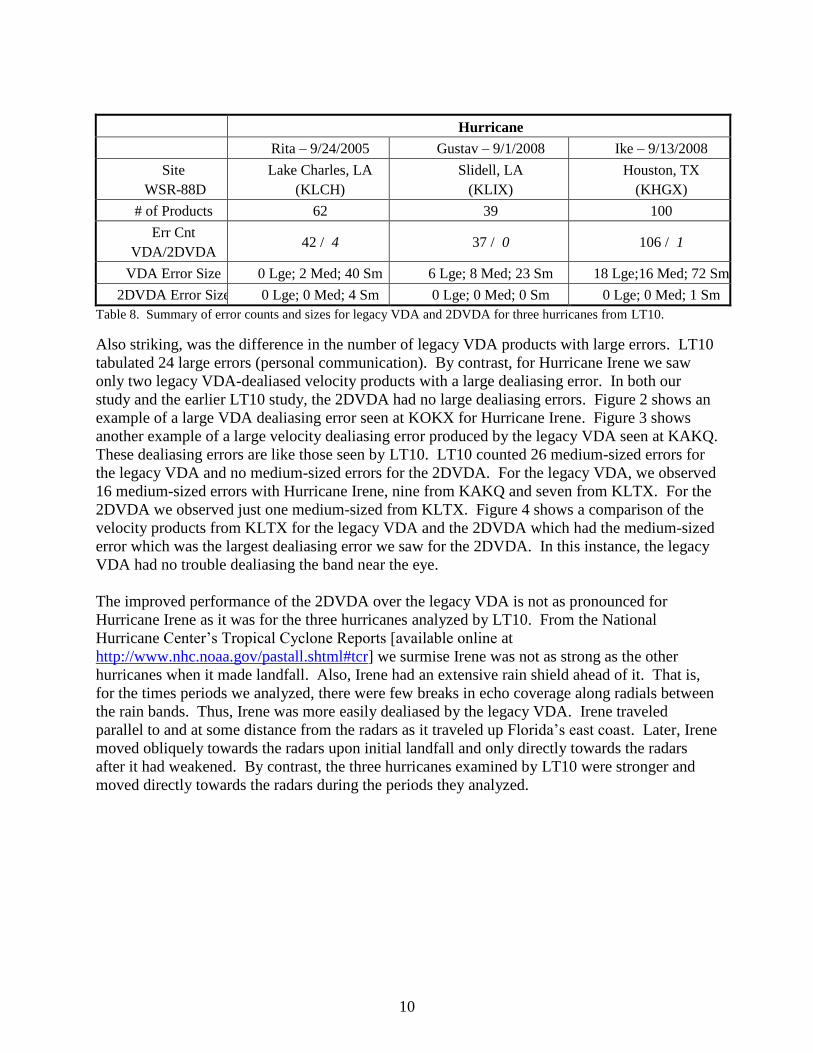
LT10. LT10 analyzed 201 velocity products with 1° azimuthal resolution at 0.5° elevation for
hurricanes Rita (2005), Gustav (2008), and Ike (2008). They found the legacy VDA had 185
dealiasing errors while the 2DVDA had only five dealiasing errors. (Their results are
summarized in Table 8.) Note that in their analysis a velocity product could have more than one
error if the errors were non-contiguous. The corresponding number of errors for each technique
for Hurricane Irene from Table 4 shows that the legacy VDA had 286 products with dealiasing
errors while the 2DVDA had only 26 products with dealiasing errors.
10
Hurricane
Rita – 9/24/2005 Gustav – 9/1/2008 Ike – 9/13/2008
Site
WSR-88D
Lake Charles, LA
(KLCH)
Slidell, LA
(KLIX)
Houston, TX
(KHGX)
# of Products 62 39 100
Err Cnt
VDA/2DVDA 42 / 4 37 / 0 106 / 1
VDA Error Size 0 Lge; 2 Med; 40 Sm 6 Lge; 8 Med; 23 Sm 18 Lge;16 Med; 72 Sm
2DVDA Error Size 0 Lge; 0 Med; 4 Sm 0 Lge; 0 Med; 0 Sm 0 Lge; 0 Med; 1 Sm
Table 8. Summary of error counts and sizes for legacy VDA and 2DVDA for three hurricanes from LT10.
Also striking, was the difference in the number of legacy VDA products with large errors. LT10
tabulated 24 large errors (personal communication). By contrast, for Hurricane Irene we saw
only two legacy VDA-dealiased velocity products with a large dealiasing error. In both our
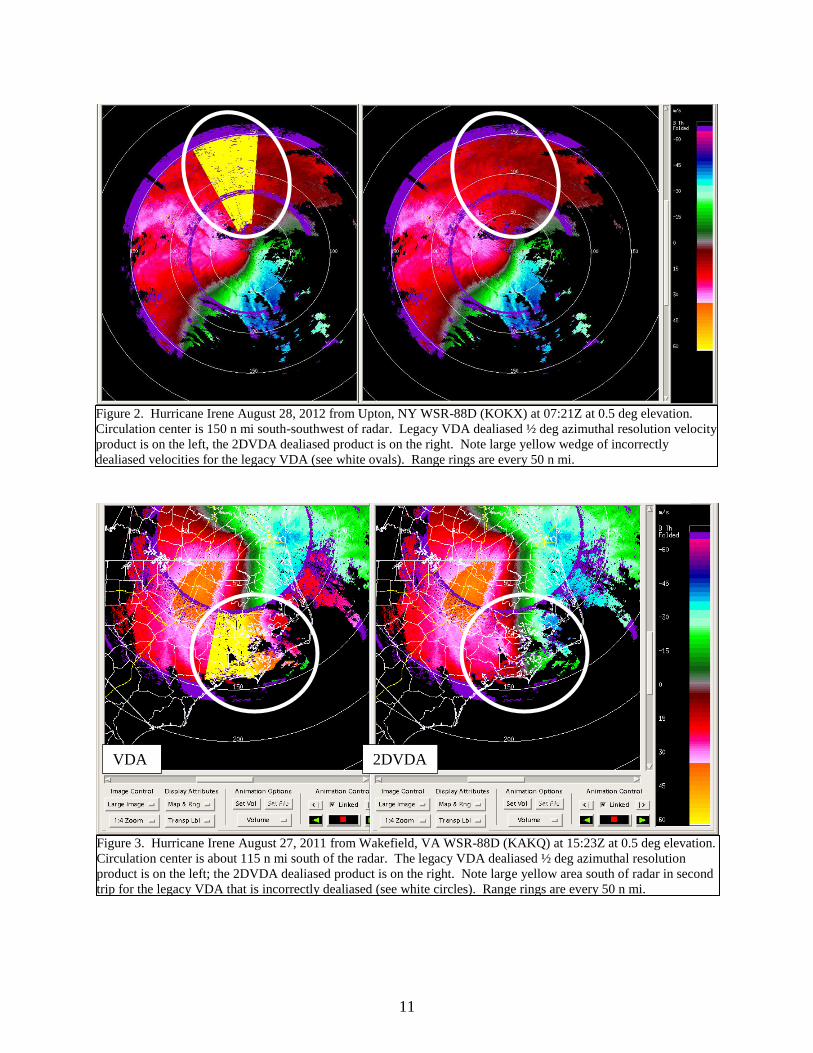
study and the earlier LT10 study, the 2DVDA had no large dealiasing errors. Figure 2 shows an
example of a large VDA dealiasing error seen at KOKX for Hurricane Irene. Figure 3 shows
another example of a large velocity dealiasing error produced by the legacy VDA seen at KAKQ.
These dealiasing errors are like those seen by LT10. LT10 counted 26 medium-sized errors for
the legacy VDA and no medium-sized errors for the 2DVDA. For the legacy VDA, we observed
16 medium-sized errors with Hurricane Irene, nine from KAKQ and seven from KLTX. For the
2DVDA we observed just one medium-sized from KLTX. Figure 4 shows a comparison of the
velocity products from KLTX for the legacy VDA and the 2DVDA which had the medium-sized
error which was the largest dealiasing error we saw for the 2DVDA. In this instance, the legacy
VDA had no trouble dealiasing the band near the eye.
The improved performance of the 2DVDA over the legacy VDA is not as pronounced for
Hurricane Irene as it was for the three hurricanes analyzed by LT10. From the National
Hurricane Center’s Tropical Cyclone Reports [available online at
http://www.nhc.noaa.gov/pastall.shtml#tcr] we surmise Irene was not as strong as the other
hurricanes when it made landfall. Also, Irene had an extensive rain shield ahead of it. That is,
for the times periods we analyzed, there were few breaks in echo coverage along radials between
the rain bands. Thus, Irene was more easily dealiased by the legacy VDA. Irene traveled
parallel to and at some distance from the radars as it traveled up Florida’s east coast. Later, Irene
moved obliquely towards the radars upon initial landfall and only directly towards the radars
after it had weakened. By contrast, the three hurricanes examined by LT10 were stronger and
moved directly towards the radars during the periods they analyzed.
11
VDA 2DVDA
Figure 3. Hurricane Irene August 27, 2011 from Wakefield, VA WSR-88D (KAKQ) at 15:23Z at 0.5 deg elevation.
Circulation center is about 115 n mi south of the radar. The legacy VDA dealiased ½ deg azimuthal resolution
product is on the left; the 2DVDA dealiased product is on the right. Note large yellow area south of radar in second
trip for the legacy VDA that is incorrectly dealiased (see white circles). Range rings are every 50 n mi.
Figure 2. Hurricane Irene August 28, 2012 from Upton, NY WSR-88D (KOKX) at 07:21Z at 0.5 deg elevation.
Circulation center is 150 n mi south-southwest of radar. Legacy VDA dealiased ½ deg azimuthal resolution velocity
product is on the left, the 2DVDA dealiased product is on the right. Note large yellow wedge of incorrectly
dealiased velocities for the legacy VDA (see white ovals). Range rings are every 50 n mi.

12
5. KINEMATIC ALGORITHM EVALUATIONS
Data from Hurricane Irene were used to compare velocity dealiasing effects on Enhanced
Velocity Azimuth Display (VAD) Wind Profile (EVWP) Algorithm (being fielded in the RPG
Build 13.0 software), the Mesocyclone Detection Algorithm (MDA), and Tornado Detection
Algorithm (TDA). For the EVWP, data from KLTX (Wilmington, NC) and KAKQ (Wakefield,
VA) were analyzed. For the MDA and TDA algorithms, data from KLTX, KAKQ, and KOKX
were analyzed.
5.1 Enhanced VAD Wind Profile Algorithm
About 6.5 hours of data (15:23Z to 22:05Z) from August 27, 2011 from KAKQ were examined
for differences between EVWP products generated from velocity data dealiased by the VDA and
velocity products dealiased by the 2DVDA. Over this time period, the only differences noted
occurred at 21:56Z with the winds reported at 25 kft. The VAD algorithm, using 2DVDA
dealiased velocity data, computed a wind speed of 47 kts and using the legacy VDA dealiased
velocity data, computed a wind speed 50 kts. The corresponding directions were 48° and 47°,
respectively while the RMS values were 4.2 kts and 4.4 kts, respectively. For this observation,
the legacy VDA wind speed fit the vertical profile slightly better than the 2DVDA wind speed.
The differences in the wind direction and RMS values were trivial. None of the differences were
deemed operationally significant.
VDA 2DVDA
Figure 4. Hurricane Irene August 27, 2011 from Wilmington, NC WSR-88D (KLTX) at 04:05Z at 1.3 deg
elevation. Circulation center is about 125 n mi southeast of the radar. The legacy VDA dealiased 1 deg resolution
product is on the left; the 2DVDA dealiased product is on the right. Note the blue inbound incorrectly dealiased
fragmented eye wall in the 2DVDA panel (see white ovals). Range rings are every 50 n mi.
13
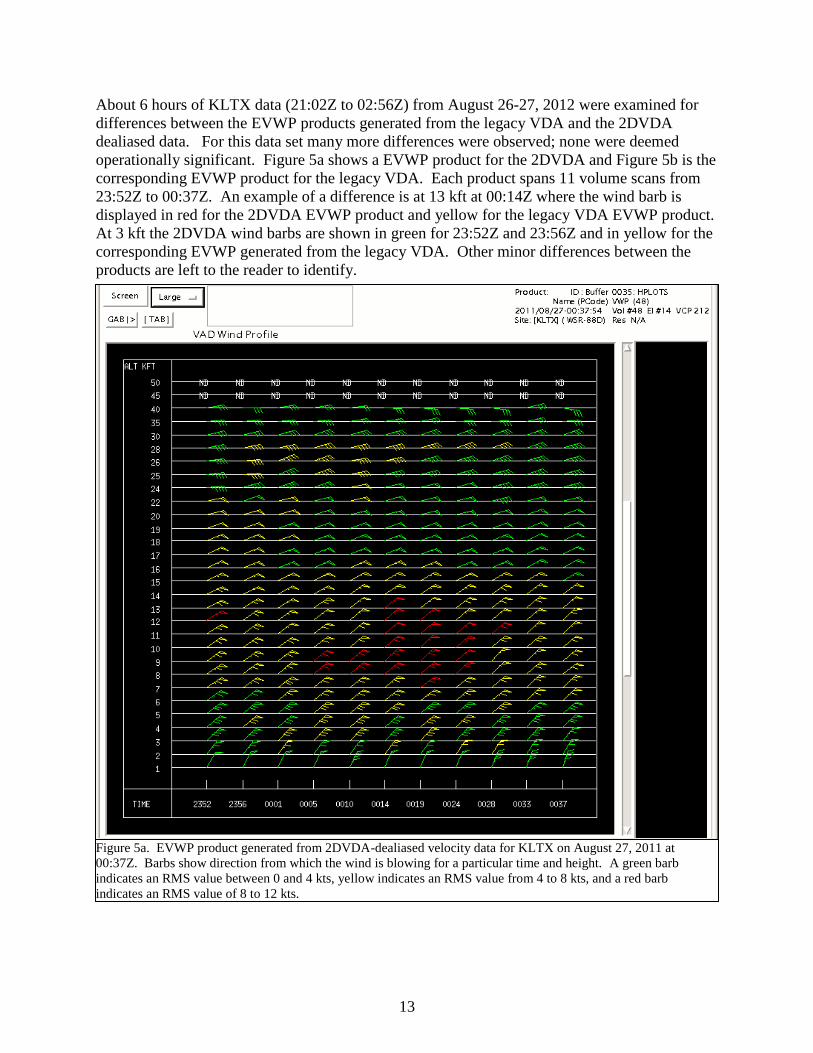
About 6 hours of KLTX data (21:02Z to 02:56Z) from August 26-27, 2012 were examined for
differences between the EVWP products generated from the legacy VDA and the 2DVDA
dealiased data. For this data set many more differences were observed; none were deemed
operationally significant. Figure 5a shows a EVWP product for the 2DVDA and Figure 5b is the
corresponding EVWP product for the legacy VDA. Each product spans 11 volume scans from
23:52Z to 00:37Z. An example of a difference is at 13 kft at 00:14Z where the wind barb is
displayed in red for the 2DVDA EVWP product and yellow for the legacy VDA EVWP product.
At 3 kft the 2DVDA wind barbs are shown in green for 23:52Z and 23:56Z and in yellow for the
corresponding EVWP generated from the legacy VDA. Other minor differences between the
products are left to the reader to identify.
Figure 3 blah, blah, blah
Figure 5a. EVWP product generated from 2DVDA-dealiased velocity data for KLTX on August 27, 2011 at
00:37Z. Barbs show direction from which the wind is blowing for a particular time and height. A green barb
indicates an RMS value between 0 and 4 kts, yellow indicates an RMS value from 4 to 8 kts, and a red barb
indicates an RMS value of 8 to 12 kts.
14
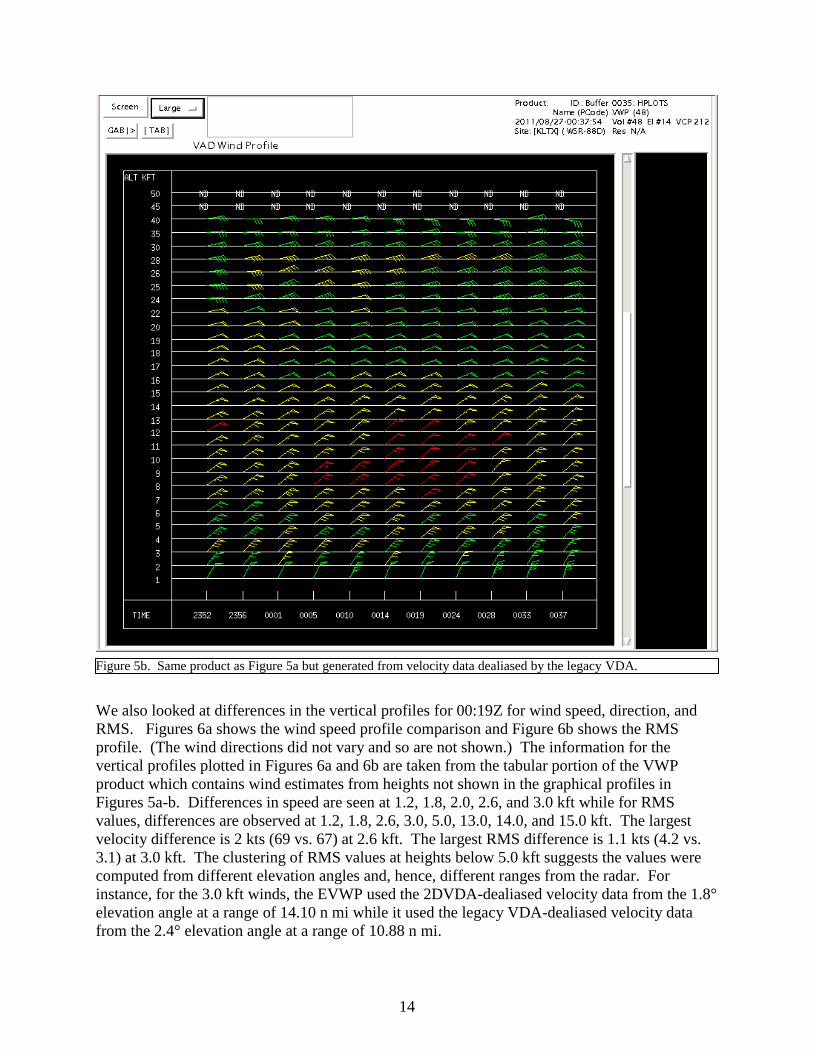
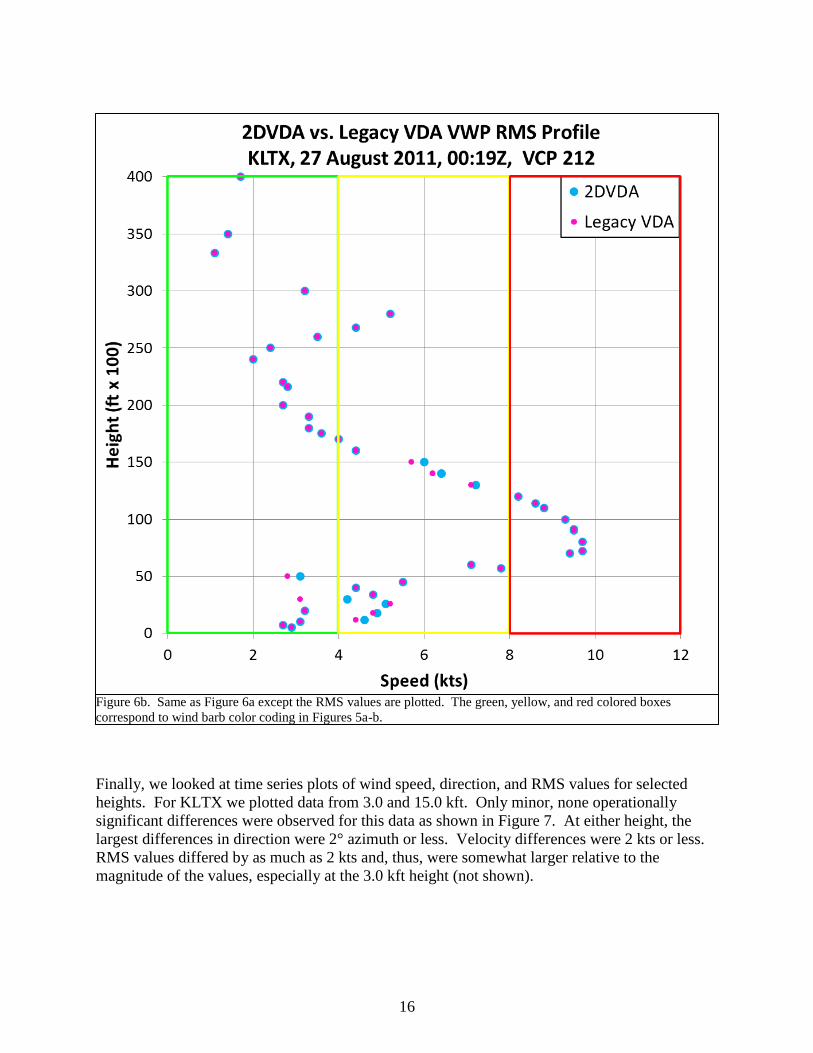
We also looked at differences in the vertical profiles for 00:19Z for wind speed, direction, and
RMS. Figures 6a shows the wind speed profile comparison and Figure 6b shows the RMS
profile. (The wind directions did not vary and so are not shown.) The information for the
vertical profiles plotted in Figures 6a and 6b are taken from the tabular portion of the VWP
product which contains wind estimates from heights not shown in the graphical profiles in
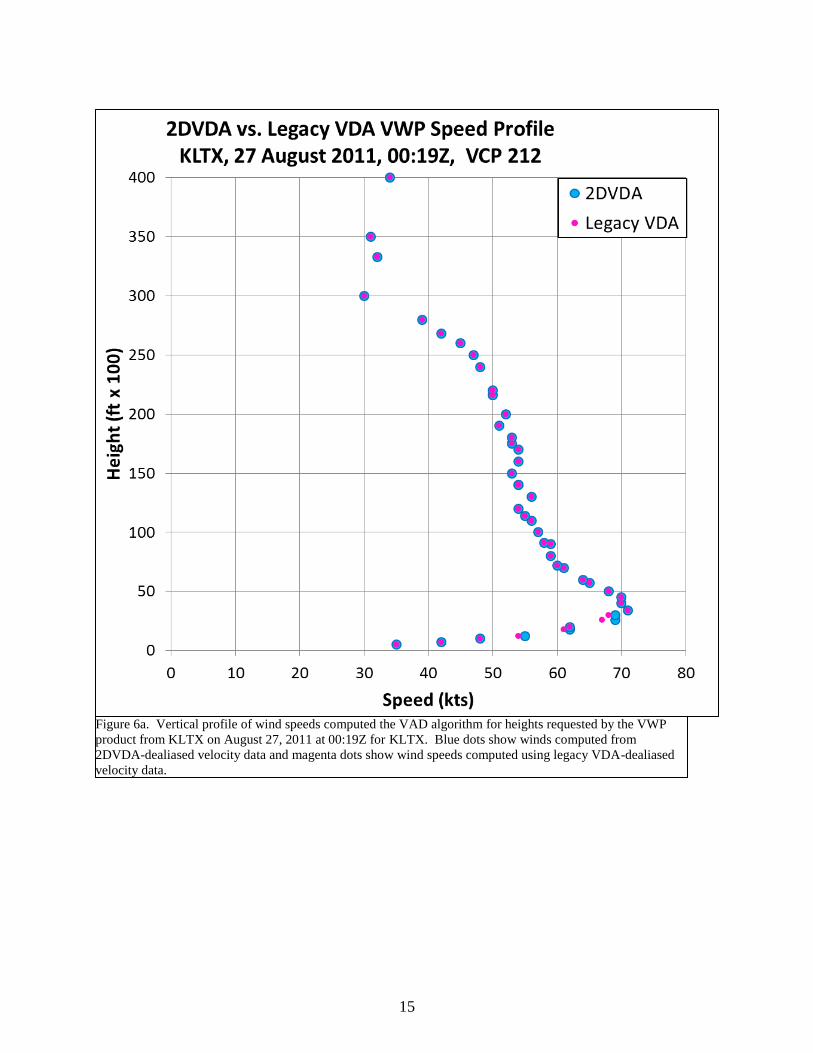
Figures 5a-b. Differences in speed are seen at 1.2, 1.8, 2.0, 2.6, and 3.0 kft while for RMS
values, differences are observed at 1.2, 1.8, 2.6, 3.0, 5.0, 13.0, 14.0, and 15.0 kft. The largest
velocity difference is 2 kts (69 vs. 67) at 2.6 kft. The largest RMS difference is 1.1 kts (4.2 vs.
3.1) at 3.0 kft. The clustering of RMS values at heights below 5.0 kft suggests the values were
computed from different elevation angles and, hence, different ranges from the radar. For
instance, for the 3.0 kft winds, the EVWP used the 2DVDA-dealiased velocity data from the 1.8°
elevation angle at a range of 14.10 n mi while it used the legacy VDA-dealiased velocity data
from the 2.4° elevation angle at a range of 10.88 n mi.
Figure 5b. Same product as Figure 5a but generated from velocity data dealiased by the legacy VDA.
15
Figure 6a. Vertical profile of wind speeds computed the VAD algorithm for heights requested by the VWP
product from KLTX on August 27, 2011 at 00:19Z for KLTX. Blue dots show winds computed from
2DVDA-dealiased velocity data and magenta dots show wind speeds computed using legacy VDA-dealiased
velocity data.
16
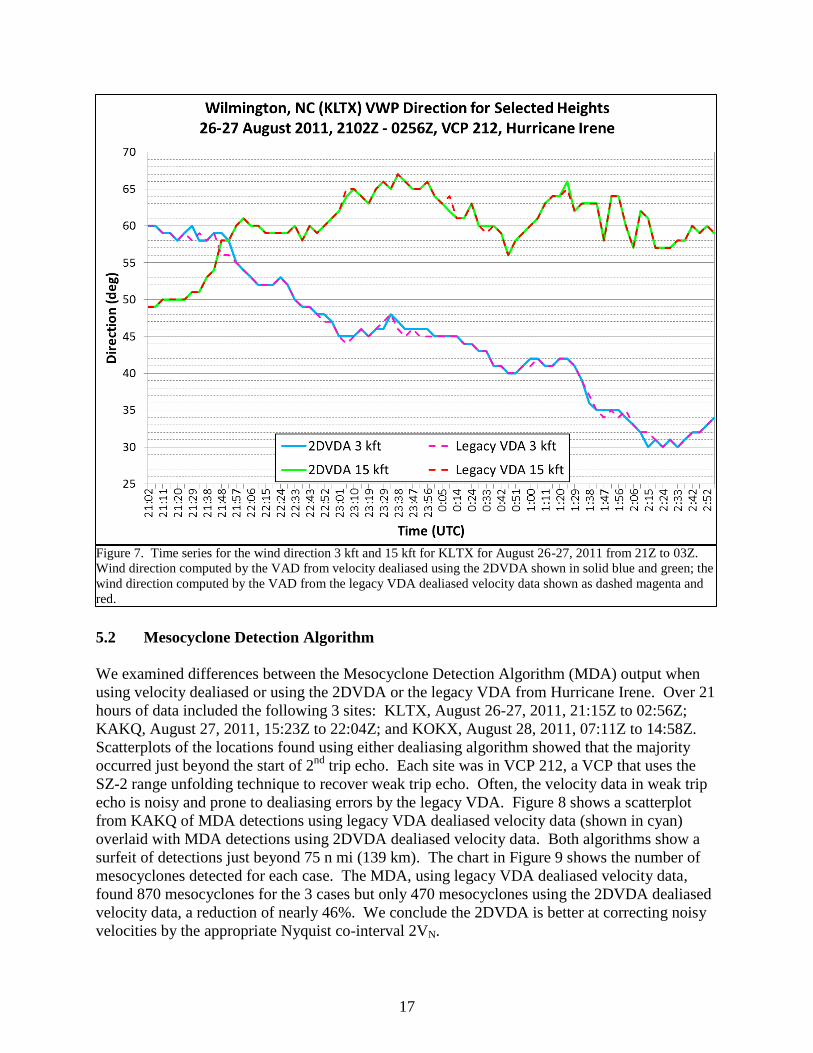
Finally, we looked at time series plots of wind speed, direction, and RMS values for selected
heights. For KLTX we plotted data from 3.0 and 15.0 kft. Only minor, none operationally
significant differences were observed for this data as shown in Figure 7. At either height, the
largest differences in direction were 2° azimuth or less. Velocity differences were 2 kts or less.
RMS values differed by as much as 2 kts and, thus, were somewhat larger relative to the
magnitude of the values, especially at the 3.0 kft height (not shown).
Figure 6b. Same as Figure 6a except the RMS values are plotted. The green, yellow, and red colored boxes
correspond to wind barb color coding in Figures 5a-b.
17
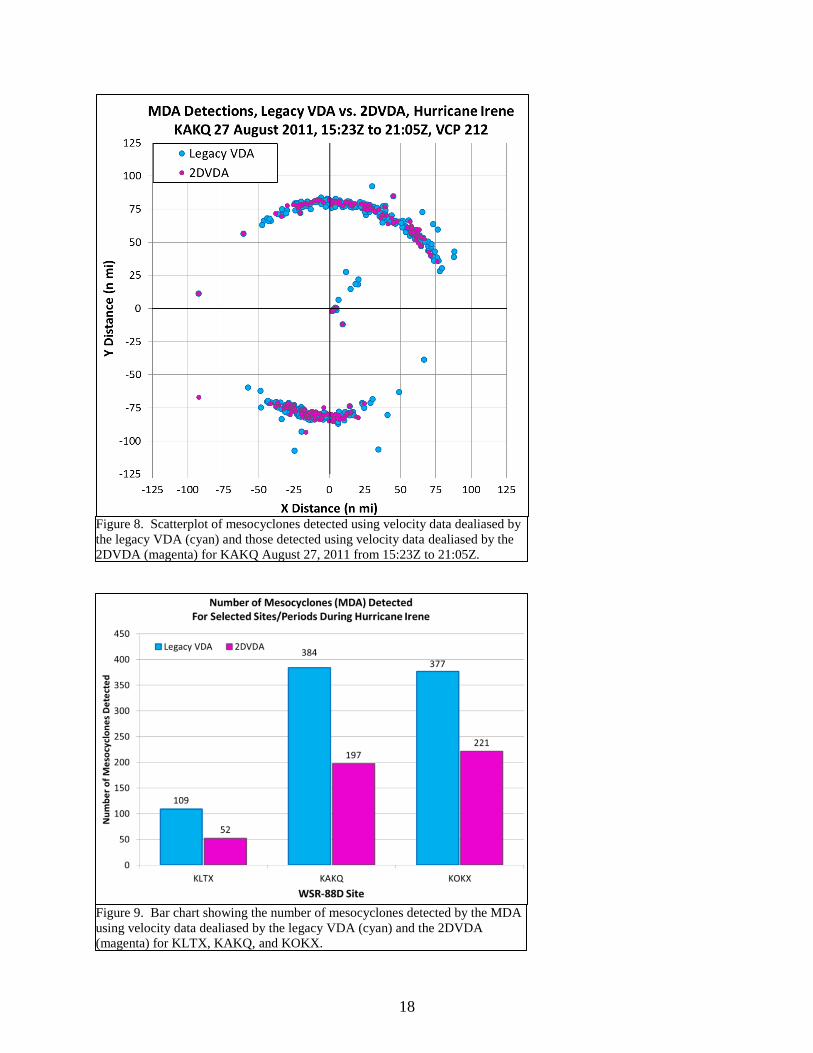
5.2 Mesocyclone Detection Algorithm
We examined differences between the Mesocyclone Detection Algorithm (MDA) output when
using velocity dealiased or using the 2DVDA or the legacy VDA from Hurricane Irene. Over 21
hours of data included the following 3 sites: KLTX, August 26-27, 2011, 21:15Z to 02:56Z;
KAKQ, August 27, 2011, 15:23Z to 22:04Z; and KOKX, August 28, 2011, 07:11Z to 14:58Z.
Scatterplots of the locations found using either dealiasing algorithm showed that the majority
occurred just beyond the start of 2nd
trip echo. Each site was in VCP 212, a VCP that uses the
SZ-2 range unfolding technique to recover weak trip echo. Often, the velocity data in weak trip
echo is noisy and prone to dealiasing errors by the legacy VDA. Figure 8 shows a scatterplot
from KAKQ of MDA detections using legacy VDA dealiased velocity data (shown in cyan)
overlaid with MDA detections using 2DVDA dealiased velocity data. Both algorithms show a
surfeit of detections just beyond 75 n mi (139 km). The chart in Figure 9 shows the number of
mesocyclones detected for each case. The MDA, using legacy VDA dealiased velocity data,
found 870 mesocyclones for the 3 cases but only 470 mesocyclones using the 2DVDA dealiased
velocity data, a reduction of nearly 46%. We conclude the 2DVDA is better at correcting noisy
velocities by the appropriate Nyquist co-interval 2VN.
Figure 7. Time series for the wind direction 3 kft and 15 kft for KLTX for August 26-27, 2011 from 21Z to 03Z.
Wind direction computed by the VAD from velocity dealiased using the 2DVDA shown in solid blue and green; the
wind direction computed by the VAD from the legacy VDA dealiased velocity data shown as dashed magenta and
red.
18
Figure 8. Scatterplot of mesocyclones detected using velocity data dealiased by
the legacy VDA (cyan) and those detected using velocity data dealiased by the
2DVDA (magenta) for KAKQ August 27, 2011 from 15:23Z to 21:05Z.
Figure 9. Bar chart showing the number of mesocyclones detected by the MDA
using velocity data dealiased by the legacy VDA (cyan) and the 2DVDA
(magenta) for KLTX, KAKQ, and KOKX.
19
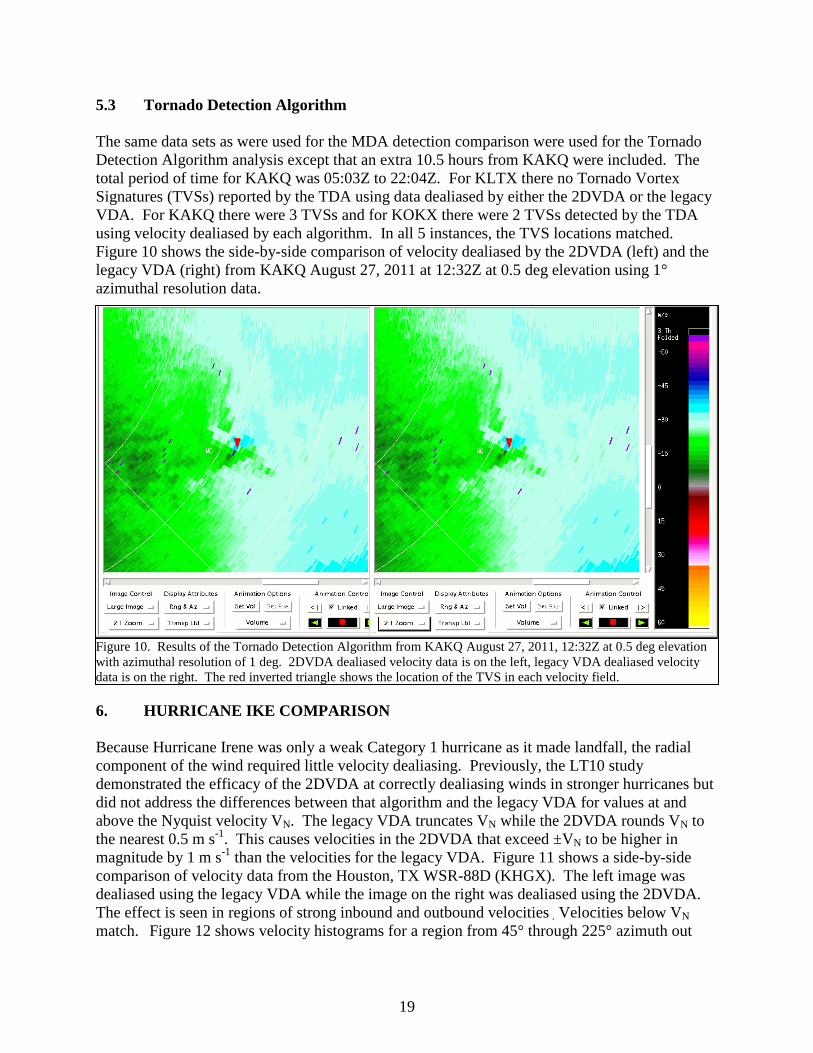
5.3 Tornado Detection Algorithm
The same data sets as were used for the MDA detection comparison were used for the Tornado
Detection Algorithm analysis except that an extra 10.5 hours from KAKQ were included. The
total period of time for KAKQ was 05:03Z to 22:04Z. For KLTX there no Tornado Vortex
Signatures (TVSs) reported by the TDA using data dealiased by either the 2DVDA or the legacy
VDA. For KAKQ there were 3 TVSs and for KOKX there were 2 TVSs detected by the TDA
using velocity dealiased by each algorithm. In all 5 instances, the TVS locations matched.
Figure 10 shows the side-by-side comparison of velocity dealiased by the 2DVDA (left) and the
legacy VDA (right) from KAKQ August 27, 2011 at 12:32Z at 0.5 deg elevation using 1°
azimuthal resolution data.
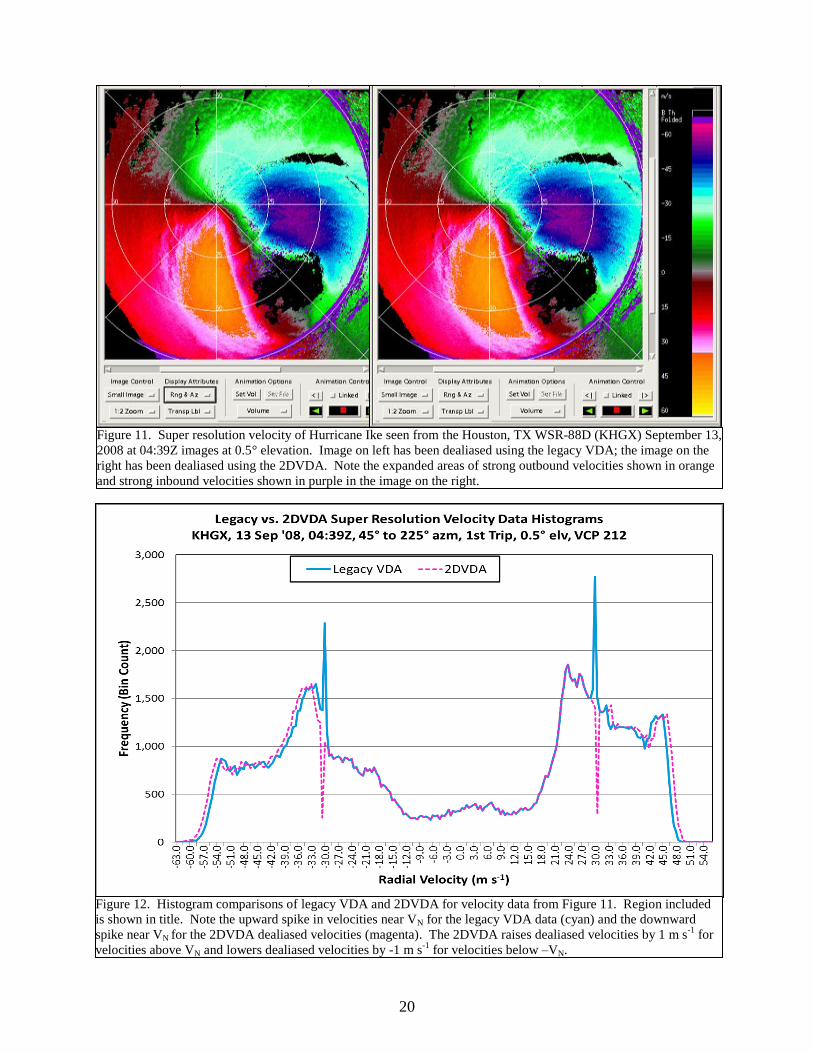
6. HURRICANE IKE COMPARISON
Because Hurricane Irene was only a weak Category 1 hurricane as it made landfall, the radial
component of the wind required little velocity dealiasing. Previously, the LT10 study
demonstrated the efficacy of the 2DVDA at correctly dealiasing winds in stronger hurricanes but
did not address the differences between that algorithm and the legacy VDA for values at and
above the Nyquist velocity VN. The legacy VDA truncates VN while the 2DVDA rounds VN to
the nearest 0.5 m s-1
. This causes velocities in the 2DVDA that exceed ±VN to be higher in
magnitude by 1 m s-1
than the velocities for the legacy VDA. Figure 11 shows a side-by-side
comparison of velocity data from the Houston, TX WSR-88D (KHGX). The left image was
dealiased using the legacy VDA while the image on the right was dealiased using the 2DVDA.
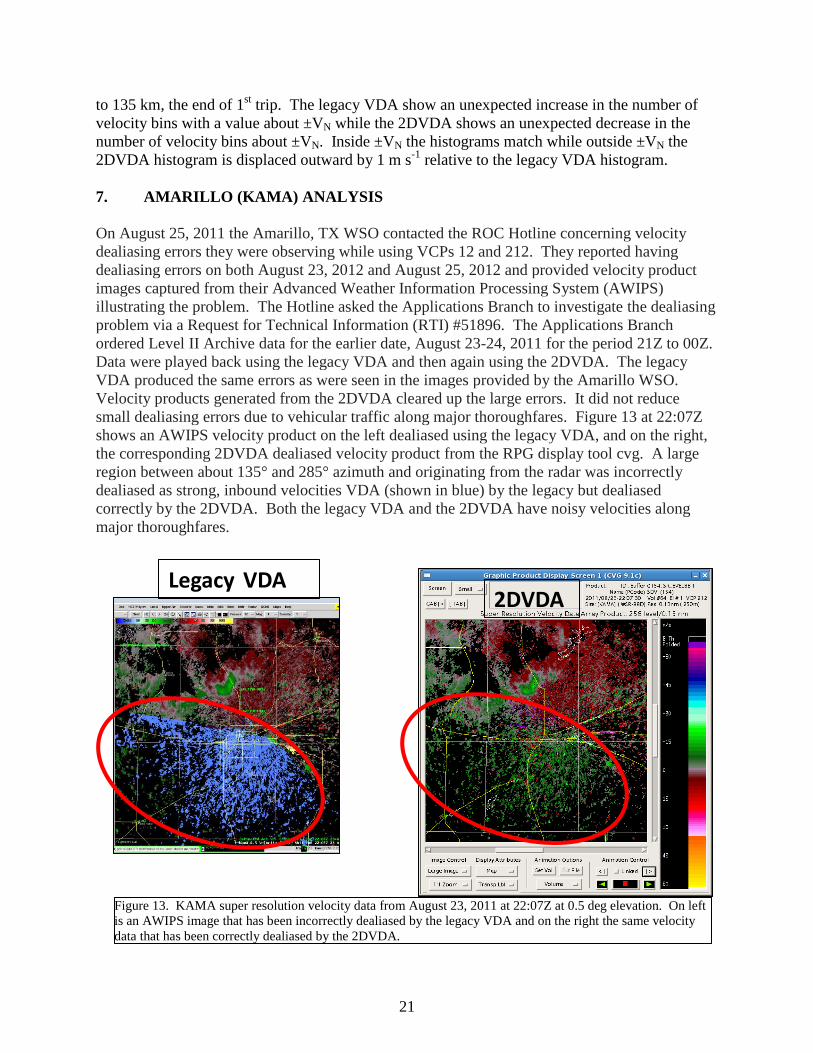
The effect is seen in regions of strong inbound and outbound velocities . Velocities below VN
match. Figure 12 shows velocity histograms for a region from 45° through 225° azimuth out
Figure 10. Results of the Tornado Detection Algorithm from KAKQ August 27, 2011, 12:32Z at 0.5 deg elevation
with azimuthal resolution of 1 deg. 2DVDA dealiased velocity data is on the left, legacy VDA dealiased velocity
data is on the right. The red inverted triangle shows the location of the TVS in each velocity field.
20
to 135 km
Figure 11. Super resolution velocity of Hurricane Ike seen from the Houston, TX WSR-88D (KHGX) September 13,
2008 at 04:39Z images at 0.5° elevation. Image on left has been dealiased using the legacy VDA; the image on the
right has been dealiased using the 2DVDA. Note the expanded areas of strong outbound velocities shown in orange
and strong inbound velocities shown in purple in the image on the right.
Figure 12. Histogram comparisons of legacy VDA and 2DVDA for velocity data from Figure 11. Region included
is shown in title. Note the upward spike in velocities near VN for the legacy VDA data (cyan) and the downward
spike near VN for the 2DVDA dealiased velocities (magenta). The 2DVDA raises dealiased velocities by 1 m s-1
for
velocities above VN and lowers dealiased velocities by -1 m s-1
for velocities below –VN.
21
to 135 km, the end of 1st trip. The legacy VDA show an unexpected increase in the number of
velocity bins with a value about ±VN while the 2DVDA shows an unexpected decrease in the
number of velocity bins about ±VN. Inside ±VN the histograms match while outside ±VN the
2DVDA histogram is displaced outward by 1 m s-1
relative to the legacy VDA histogram.
7. AMARILLO (KAMA) ANALYSIS
On August 25, 2011 the Amarillo, TX WSO contacted the ROC Hotline concerning velocity
dealiasing errors they were observing while using VCPs 12 and 212. They reported having
dealiasing errors on both August 23, 2012 and August 25, 2012 and provided velocity product
images captured from their Advanced Weather Information Processing System (AWIPS)
illustrating the problem. The Hotline asked the Applications Branch to investigate the dealiasing
problem via a Request for Technical Information (RTI) #51896. The Applications Branch
ordered Level II Archive data for the earlier date, August 23-24, 2011 for the period 21Z to 00Z.
Data were played back using the legacy VDA and then again using the 2DVDA. The legacy
VDA produced the same errors as were seen in the images provided by the Amarillo WSO.
Velocity products generated from the 2DVDA cleared up the large errors. It did not reduce
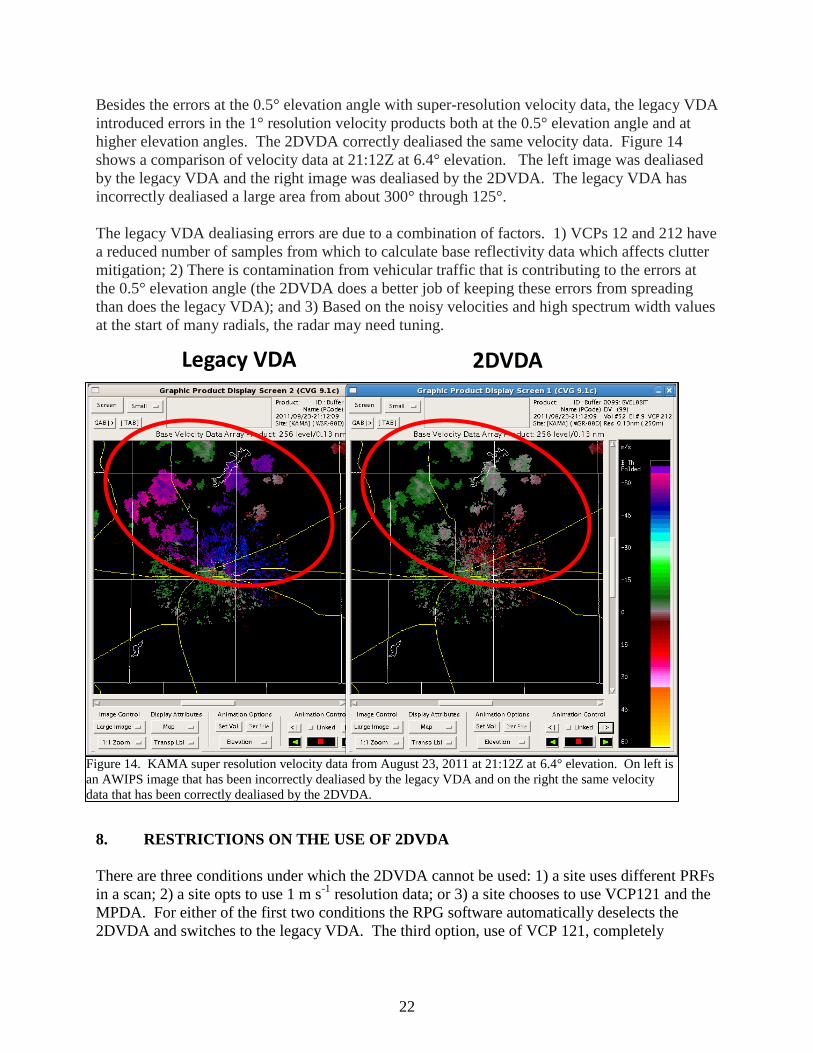
small dealiasing errors due to vehicular traffic along major thoroughfares. Figure 13 at 22:07Z
shows an AWIPS velocity product on the left dealiased using the legacy VDA, and on the right,
the corresponding 2DVDA dealiased velocity product from the RPG display tool cvg. A large
region between about 135° and 285° azimuth and originating from the radar was incorrectly
dealiased as strong, inbound velocities VDA (shown in blue) by the legacy but dealiased
correctly by the 2DVDA. Both the legacy VDA and the 2DVDA have noisy velocities along
major thoroughfares.
Figure 13. KAMA super resolution velocity data from August 23, 2011 at 22:07Z at 0.5 deg elevation. On left
is an AWIPS image that has been incorrectly dealiased by the legacy VDA and on the right the same velocity
data that has been correctly dealiased by the 2DVDA.
Legacy VDA 2DVDA
22
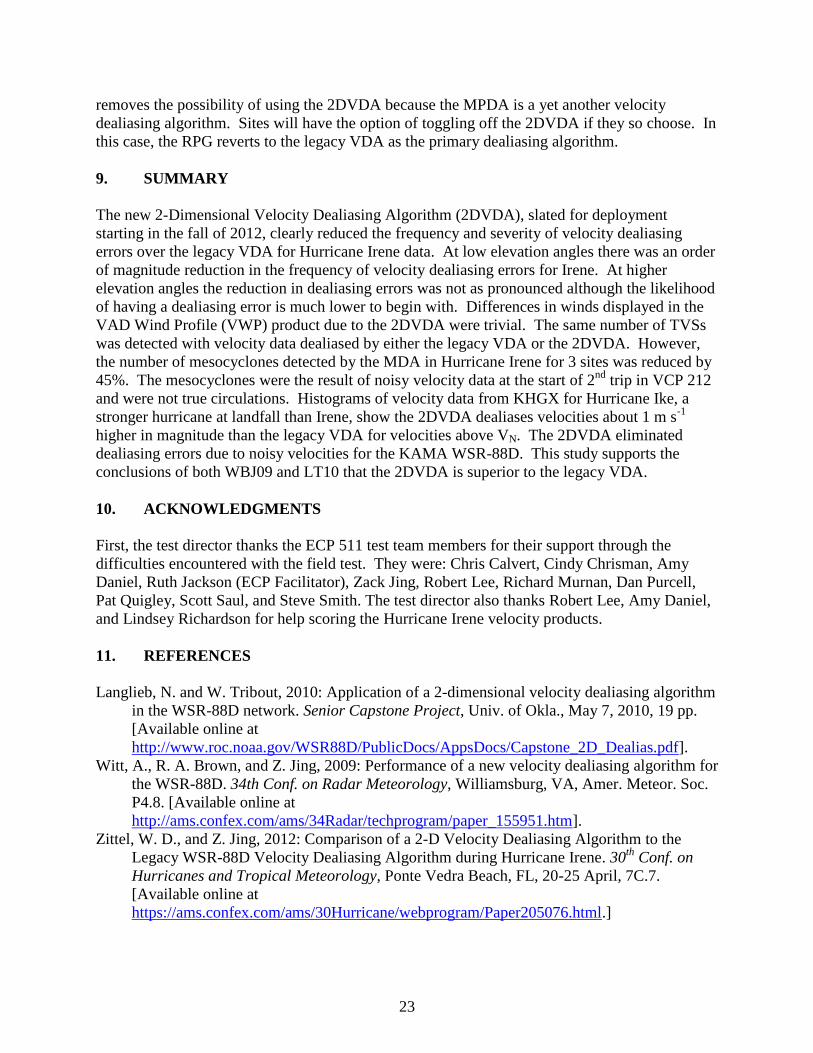
Besides the errors at the 0.5° elevation angle with super-resolution velocity data, the legacy VDA
introduced errors in the 1° resolution velocity products both at the 0.5° elevation angle and at
higher elevation angles. The 2DVDA correctly dealiased the same velocity data. Figure 14
shows a comparison of velocity data at 21:12Z at 6.4° elevation. The left image was dealiased
by the legacy VDA and the right image was dealiased by the 2DVDA. The legacy VDA has
incorrectly dealiased a large area from about 300° through 125°.
The legacy VDA dealiasing errors are due to a combination of factors. 1) VCPs 12 and 212 have
a reduced number of samples from which to calculate base reflectivity data which affects clutter
mitigation; 2) There is contamination from vehicular traffic that is contributing to the errors at
the 0.5° elevation angle (the 2DVDA does a better job of keeping these errors from spreading
than does the legacy VDA); and 3) Based on the noisy velocities and high spectrum width values
at the start of many radials, the radar may need tuning.
8. RESTRICTIONS ON THE USE OF 2DVDA
There are three conditions under which the 2DVDA cannot be used: 1) a site uses different PRFs
in a scan; 2) a site opts to use 1 m s-1
resolution data; or 3) a site chooses to use VCP121 and the
MPDA. For either of the first two conditions the RPG software automatically deselects the
2DVDA and switches to the legacy VDA. The third option, use of VCP 121, completely
Legacy VDA 2DVDA
Figure 14. KAMA super resolution velocity data from August 23, 2011 at 21:12Z at 6.4° elevation. On left is
an AWIPS image that has been incorrectly dealiased by the legacy VDA and on the right the same velocity
data that has been correctly dealiased by the 2DVDA.
23
removes the possibility of using the 2DVDA because the MPDA is a yet another velocity
dealiasing algorithm. Sites will have the option of toggling off the 2DVDA if they so choose. In
this case, the RPG reverts to the legacy VDA as the primary dealiasing algorithm.
9. SUMMARY
The new 2-Dimensional Velocity Dealiasing Algorithm (2DVDA), slated for deployment
starting in the fall of 2012, clearly reduced the frequency and severity of velocity dealiasing
errors over the legacy VDA for Hurricane Irene data. At low elevation angles there was an order
of magnitude reduction in the frequency of velocity dealiasing errors for Irene. At higher
elevation angles the reduction in dealiasing errors was not as pronounced although the likelihood
of having a dealiasing error is much lower to begin with. Differences in winds displayed in the
VAD Wind Profile (VWP) product due to the 2DVDA were trivial. The same number of TVSs
was detected with velocity data dealiased by either the legacy VDA or the 2DVDA. However,
the number of mesocyclones detected by the MDA in Hurricane Irene for 3 sites was reduced by
45%. The mesocyclones were the result of noisy velocity data at the start of 2nd
trip in VCP 212
and were not true circulations. Histograms of velocity data from KHGX for Hurricane Ike, a
stronger hurricane at landfall than Irene, show the 2DVDA dealiases velocities about 1 m s-1
higher in magnitude than the legacy VDA for velocities above VN. The 2DVDA eliminated
dealiasing errors due to noisy velocities for the KAMA WSR-88D. This study supports the
conclusions of both WBJ09 and LT10 that the 2DVDA is superior to the legacy VDA.
10. ACKNOWLEDGMENTS
First, the test director thanks the ECP 511 test team members for their support through the
difficulties encountered with the field test. They were: Chris Calvert, Cindy Chrisman, Amy
Daniel, Ruth Jackson (ECP Facilitator), Zack Jing, Robert Lee, Richard Murnan, Dan Purcell,
Pat Quigley, Scott Saul, and Steve Smith. The test director also thanks Robert Lee, Amy Daniel,
and Lindsey Richardson for help scoring the Hurricane Irene velocity products.
11. REFERENCES
Langlieb, N. and W. Tribout, 2010: Application of a 2-dimensional velocity dealiasing algorithm
in the WSR-88D network. Senior Capstone Project, Univ. of Okla., May 7, 2010, 19 pp.
[Available online at
http://www.roc.noaa.gov/WSR88D/PublicDocs/AppsDocs/Capstone_2D_Dealias.pdf].
Witt, A., R. A. Brown, and Z. Jing, 2009: Performance of a new velocity dealiasing algorithm for
the WSR-88D. 34th Conf. on Radar Meteorology, Williamsburg, VA, Amer. Meteor. Soc.
P4.8. [Available online at
http://ams.confex.com/ams/34Radar/techprogram/paper_155951.htm].
Zittel, W. D., and Z. Jing, 2012: Comparison of a 2-D Velocity Dealiasing Algorithm to the
Legacy WSR-88D Velocity Dealiasing Algorithm during Hurricane Irene. 30th
Conf. on
Hurricanes and Tropical Meteorology, Ponte Vedra Beach, FL, 20-25 April, 7C.7.
[Available online at
https://ams.confex.com/ams/30Hurricane/webprogram/Paper205076.html.]