Ecosystems and the Physical Environment. Cycling of Materials.
Upload
doris-jenningsCategory
view
214download
0
EcosystemsEcosystems
Chapter 48Chapter 48

EcosystemsEcosystems
Open systems through which energy flows and Open systems through which energy flows and materials are recycledmaterials are recycled
Require energy and nutrient input and generate Require energy and nutrient input and generate energy and nutrient outputenergy and nutrient output
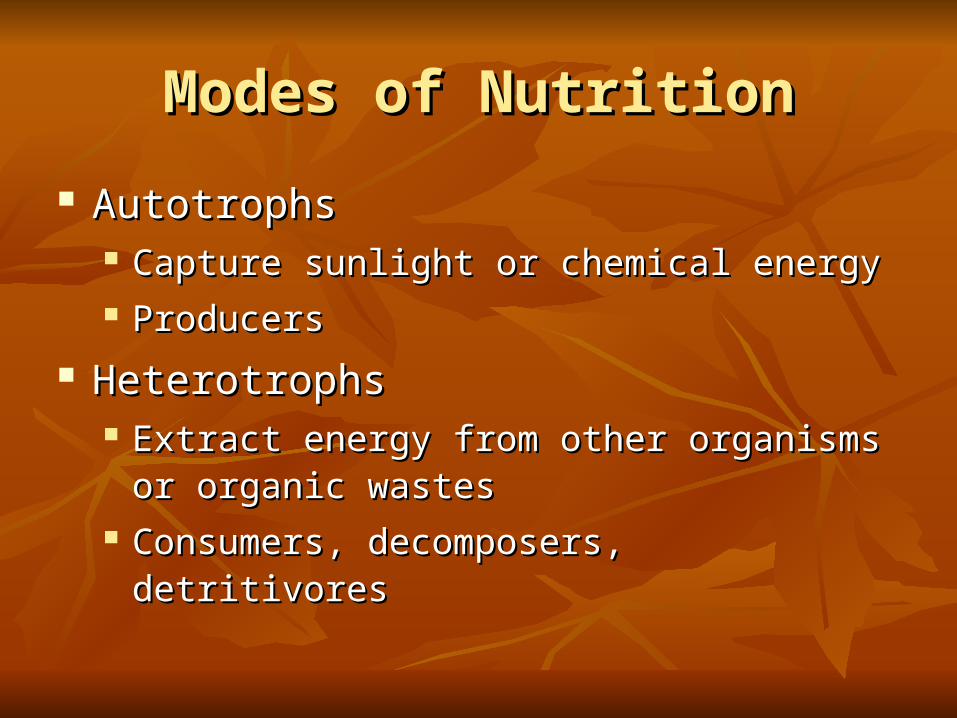
Modes of NutritionModes of Nutrition
AutotrophsAutotrophs Capture sunlight or chemical energyCapture sunlight or chemical energy ProducersProducers
HeterotrophsHeterotrophs Extract energy from other organisms or organic Extract energy from other organisms or organic
wasteswastes Consumers, decomposers, detritivoresConsumers, decomposers, detritivores
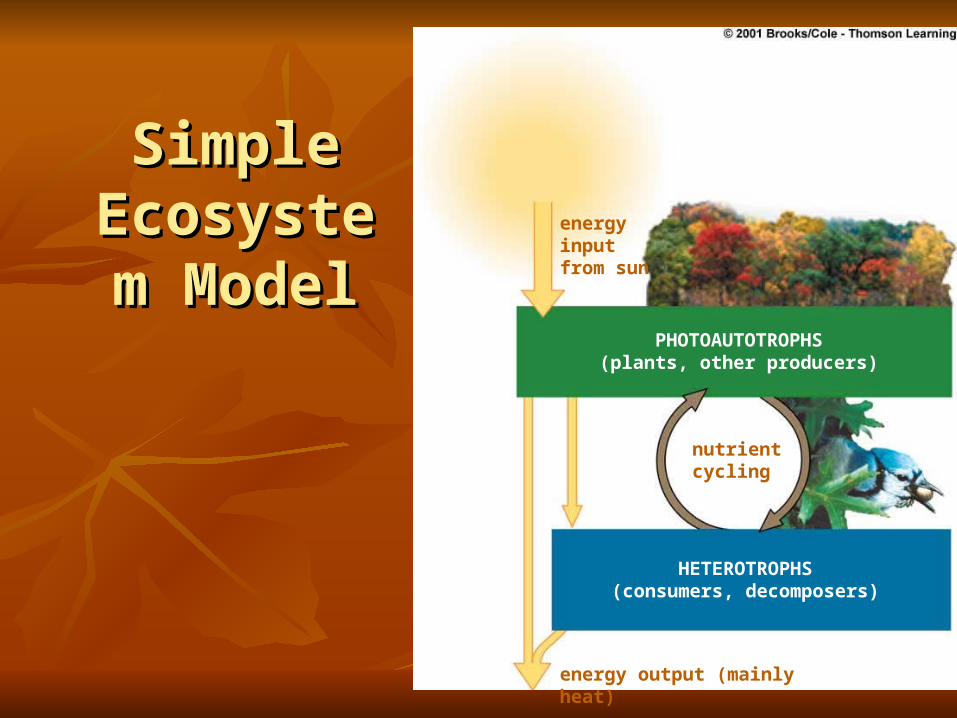
Simple Simple Ecosystem Ecosystem
ModelModelenergy input from sun
nutrientcycling
PHOTOAUTOTROPHS(plants, other producers)
HETEROTROPHS(consumers, decomposers)
energy output (mainly heat)
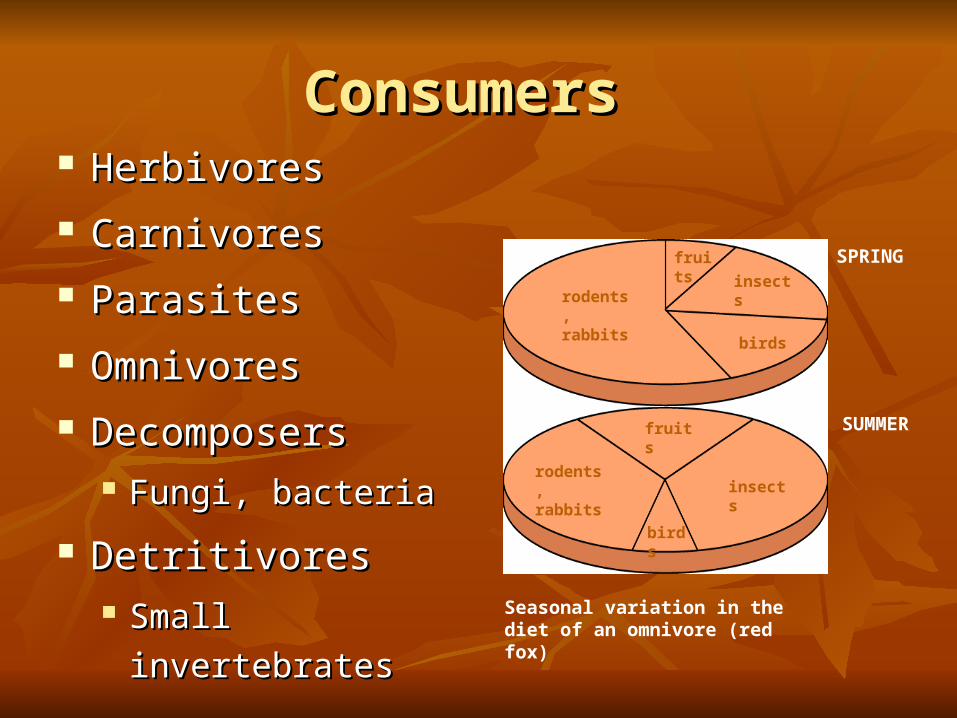
Consumers Consumers Herbivores Herbivores
Carnivores Carnivores
ParasitesParasites
Omnivores Omnivores
DecomposersDecomposers Fungi, bacteriaFungi, bacteria
Detritivores Detritivores Small invertebratesSmall invertebrates
SPRING
rodents, rabbits
fruits
insects
birds
SUMMER
rodents, rabbits
fruits
insects
birds
Seasonal variation in the diet of an omnivore (red fox)

Trophic LevelsTrophic LevelsWho Eats Whom?Who Eats Whom?
All the organisms at a trophic level are the All the organisms at a trophic level are the
same number of steps away from the energy same number of steps away from the energy
input into the systeminput into the system
Producers are closest to the energy input and Producers are closest to the energy input and
are the first trophic levelare the first trophic level
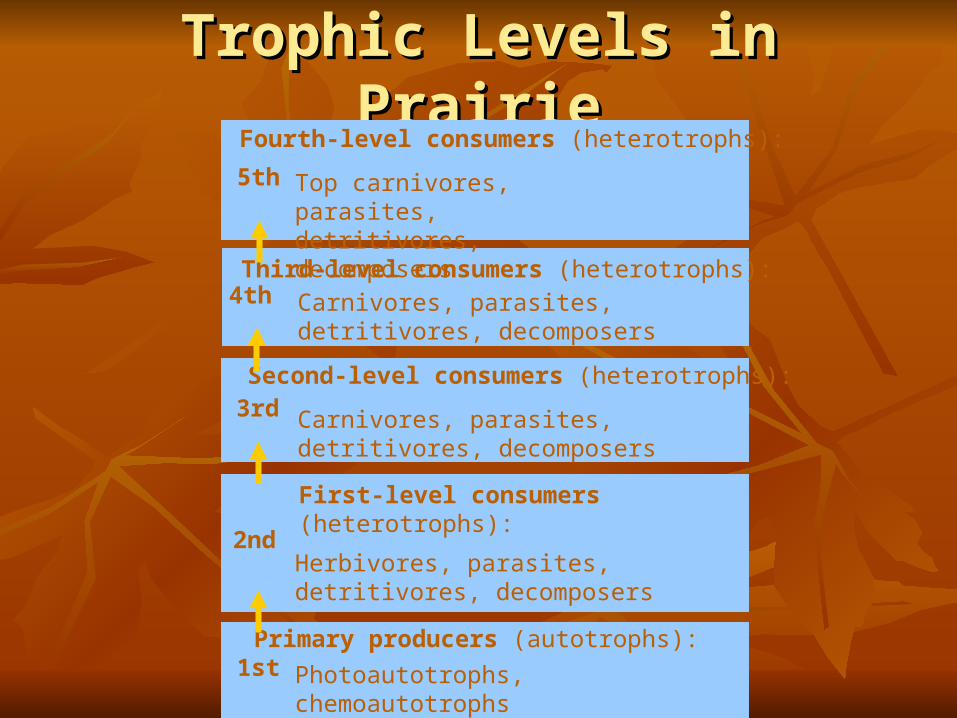
Trophic Levels in PrairieTrophic Levels in Prairie
5th
4th
3rd
2nd
1st
Fourth-level consumers (heterotrophs):
Top carnivores, parasites, detritivores, decomposers
Third-level consumers (heterotrophs):
Carnivores, parasites, detritivores, decomposers
Second-level consumers (heterotrophs):
Carnivores, parasites, detritivores, decomposers
First-level consumers (heterotrophs):
Herbivores, parasites, detritivores, decomposers
Primary producers (autotrophs):
Photoautotrophs, chemoautotrophs

Food ChainFood Chain
A straight-line sequence A straight-line sequence
of who eats whom of who eats whom
Simple food chains are Simple food chains are
rare in naturerare in nature
marsh hawk
upland sandpiper
garter snake
cutworm
plants
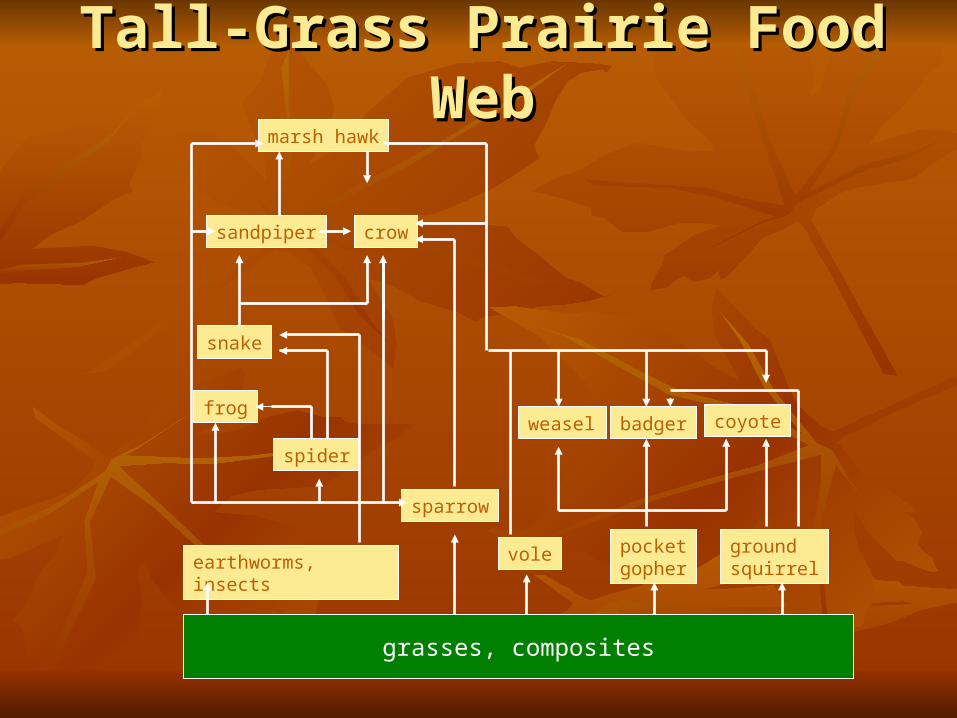
Tall-Grass Prairie Food WebTall-Grass Prairie Food Web
earthworms, insects
sparrow
vole pocketgopher
groundsquirrel
coyotebadgerweasel
spider
frog
snake
sandpiper crow
marsh hawk
grasses, composites

Energy Losses Energy Losses
Energy transfers are never 100 percent efficientEnergy transfers are never 100 percent efficient
Some energy is lost at each stepSome energy is lost at each step
How?How?
HeatHeat
Limits the number of trophic levels in an ecosystem Limits the number of trophic levels in an ecosystem
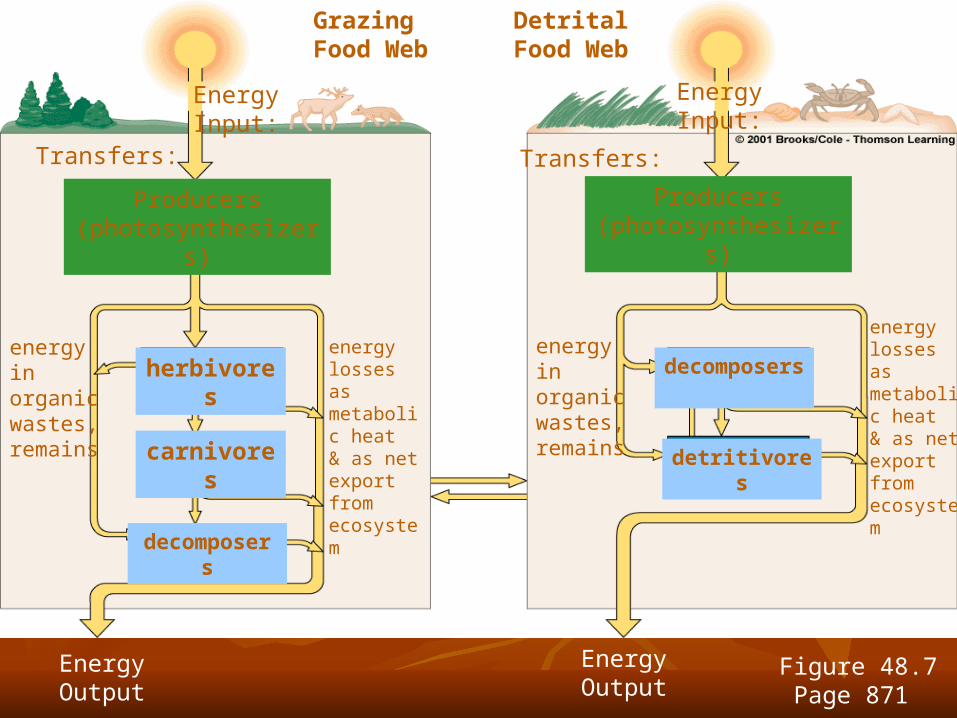
Two Types of Food WebsTwo Types of Food Webs
Producers (photosynthesizers)
Energy Input: Energy Input:
herbivores
carnivores
decomposers
decomposers
detritivores
energy in organic wastes, remains
Energy Output
Energy Output
energy lossesas metabolic heat & as net export from ecosystem
Producers (photosynthesizers)
decomposers
detritivores
Transfers: Transfers:
Grazing Food Web
Detrital Food Web
energy in organic wastes, remains
energy lossesas metabolic heat & as net export from ecosystem
Figure 48.7Page 871
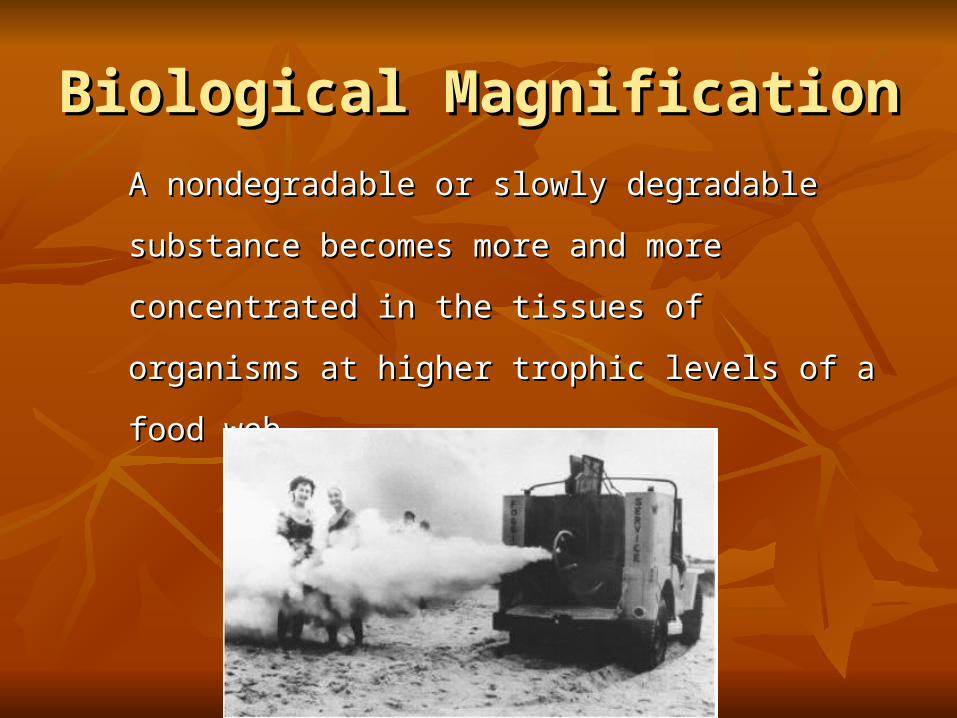
Biological MagnificationBiological Magnification
A nondegradable or slowly degradable A nondegradable or slowly degradable
substance becomes more and more substance becomes more and more
concentrated in the tissues of organisms at concentrated in the tissues of organisms at
higher trophic levels of a food webhigher trophic levels of a food web

DDT in Food WebsDDT in Food Webs
Effective chemical for killing mosquitoesEffective chemical for killing mosquitoes Accumulates in fatty tissuesAccumulates in fatty tissues Synthetic pesticide banned in United States since Synthetic pesticide banned in United States since
the 1970sthe 1970s Still persist in sedimentsStill persist in sediments
Birds that are carnivores accumulate DDT in their Birds that are carnivores accumulate DDT in their tissues, produce brittle egg shellstissues, produce brittle egg shells


DDT in an Estuary (1967)DDT in an Estuary (1967)DDT Residues (ppm wet weight of whole live organism)
Ring-billed gull fledgling (Larus delawarensis)Herring gull (Larus argentatus)Osprey (Pandion haliaetus)Green heron (Butorides virescens)Atlantic needlefish (Strongylira marina)Summer flounder (Paralychthys dentatus)Sheepshead minnow (Cyprinodon variegatus)Hard clam (Mercenaria mercenaria)Marsh grass shoots (Spartina patens)Flying insects (mostly flies)Mud snail (Nassarius obsoletus)Shrimps (composite of several samples)Green alga (Cladophora gracilis)Plankton (mostly zooplankton)Water
75.5 18.5 13.8 3.57 2.07 1.28 0.940.420.33 0.30 0.26 0.16 0.083 0.040 0.00005

Primary ProductivityPrimary Productivity GrossGross primary productivity is ecosystem’s total rate of primary productivity is ecosystem’s total rate of
photosynthesis for the ecosystem during an intervalphotosynthesis for the ecosystem during an interval
NetNet primary productivity is rate at which producers store energy primary productivity is rate at which producers store energy
in tissues in excess of their aerobic respirationin tissues in excess of their aerobic respiration
NPP accounts for the organic mass of plants (growth) and represents storage of NPP accounts for the organic mass of plants (growth) and represents storage of
chemical energy available to consumers. chemical energy available to consumers.
NPP = GPP - RespirationNPP = GPP - Respiration

Primary Productivity VariesPrimary Productivity Varies
Seasonal variationSeasonal variation
Variation by habitatVariation by habitat
The harsher the environment, the The harsher the environment, the
slower plant growth, the lower the slower plant growth, the lower the
primary productivity primary productivity

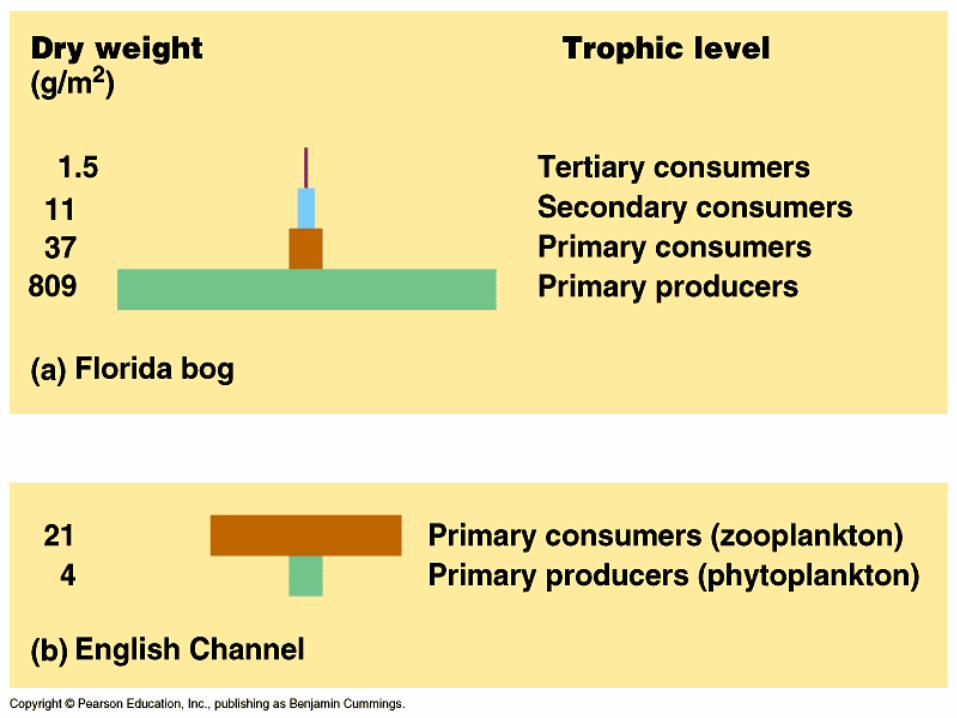
Ecological PyramidsEcological Pyramids Biomass PyramidBiomass Pyramid has tiers symbolizing the total dry weight of all has tiers symbolizing the total dry weight of all
organisms in an ecosystem's levels at any given organisms in an ecosystem's levels at any given time.time.
Biomass represents chemical energy stored in the Biomass represents chemical energy stored in the organic matter of a trophic level. organic matter of a trophic level.
Most narrow sharply from producers at the base to Most narrow sharply from producers at the base to top-level carnivores at the top. top-level carnivores at the top.

Silver Springs StudySilver Springs Study
Aquatic ecosystem in FloridaAquatic ecosystem in Florida Site of a long-term study of a grazing food webSite of a long-term study of a grazing food web
5
decomposers, detritivores(bacteria, crayfish)
1.5
1.1
37
third-level carnivores(gar, large-mouth bass)
second-level consumers(fishes, invertebrates)
first-level consumers(herbivorous fishes,turtles, invertebrates)
primary producers (algae,eelgrass, rooted plants)
809
g/m2


Energy PyramidEnergy Pyramid Reflects trophic structure most accurately because it Reflects trophic structure most accurately because it
is based on energy looses at each levelis based on energy looses at each level

Pyramid of Energy FlowPyramid of Energy Flow
Primary producers trapped about 1.2 percent of Primary producers trapped about 1.2 percent of the solar energy that entered the ecosystemthe solar energy that entered the ecosystem
6-16% passed on to next level6-16% passed on to next level (10%) (10%)
21
383
3,368
20,810 kilocalories/square meter/year
top carnivores
carnivores
herbivores
producers
decomposers + detritivores = 5,080
Figure 48.11Page 874
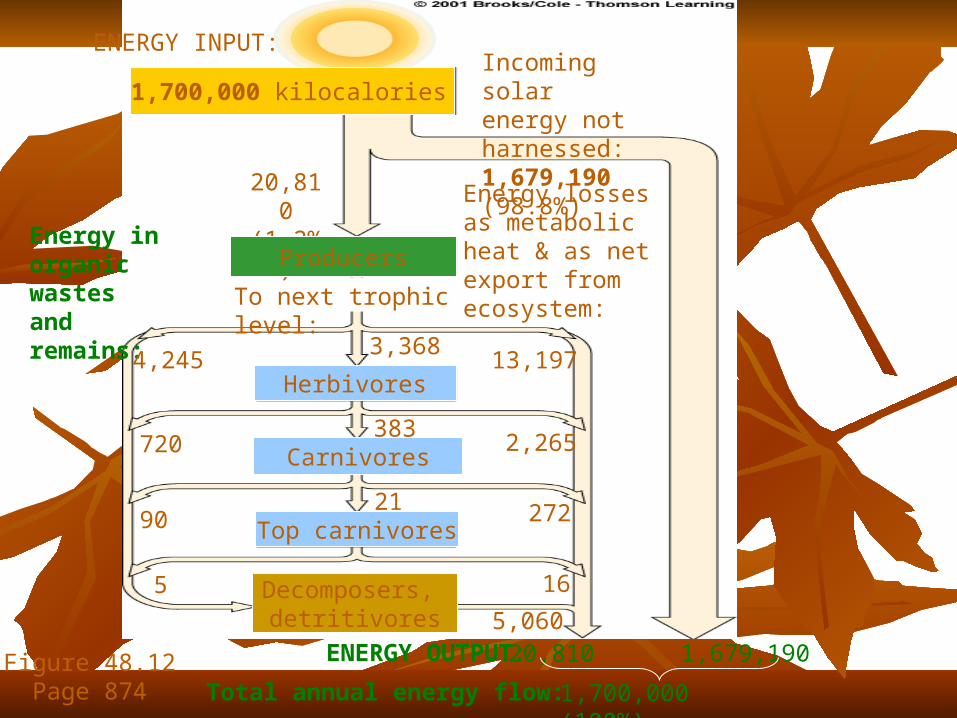
Energy Flow In Energy Flow In Silver SpringsSilver Springs
20,810 1,679,190
Incoming solar energy not harnessed: 1,679,190 (98.8%)
ENERGY INPUT:
1,700,000 kilocalories
20,810 (1.2%)
Producers
To next trophic level:
Energy in organic wastes and remains:
Energy losses as metabolic heat & as net export from ecosystem:
Herbivores
Carnivores
Top carnivores
Decomposers, detritivores
4,245
720
5
90
3,368
383
21
13,197
2,265
272
16
5,060ENERGY OUTPUT:
Total annual energy flow: 1,700,000 (100%)Figure 48.12
Page 874
All Heat in the EndAll Heat in the End
At each trophic level, the bulk of the energy At each trophic level, the bulk of the energy received from the previous level is used in received from the previous level is used in metabolismmetabolism
This energy is released as heat energy and lost This energy is released as heat energy and lost to the ecosystemto the ecosystem
Eventually all energy is released as heatEventually all energy is released as heat

Biogeochemical CycleBiogeochemical Cycle
Influence the availability of essential elements Influence the availability of essential elements
in ecosystemsin ecosystems
The amount of nutrients cycling is greater The amount of nutrients cycling is greater
than those entering or leavingthan those entering or leaving
Main reservoir for the nutrient is in the Main reservoir for the nutrient is in the
environmentenvironment
Environmental Inputs Environmental Inputs of Nutrientsof Nutrients
PrecipitationPrecipitation MetabolismMetabolism WeatheringWeathering
Environmental Outputs Environmental Outputs of Nutrientsof Nutrients
RunoffRunoff EvaporationEvaporation

Three CategoriesThree Categories
Hydrologic cycleHydrologic cycle WaterWater
Atmospheric cycles Atmospheric cycles Nitrogen and carbonNitrogen and carbon
Sedimentary cycles Sedimentary cycles Phosphorus and sulfurPhosphorus and sulfur
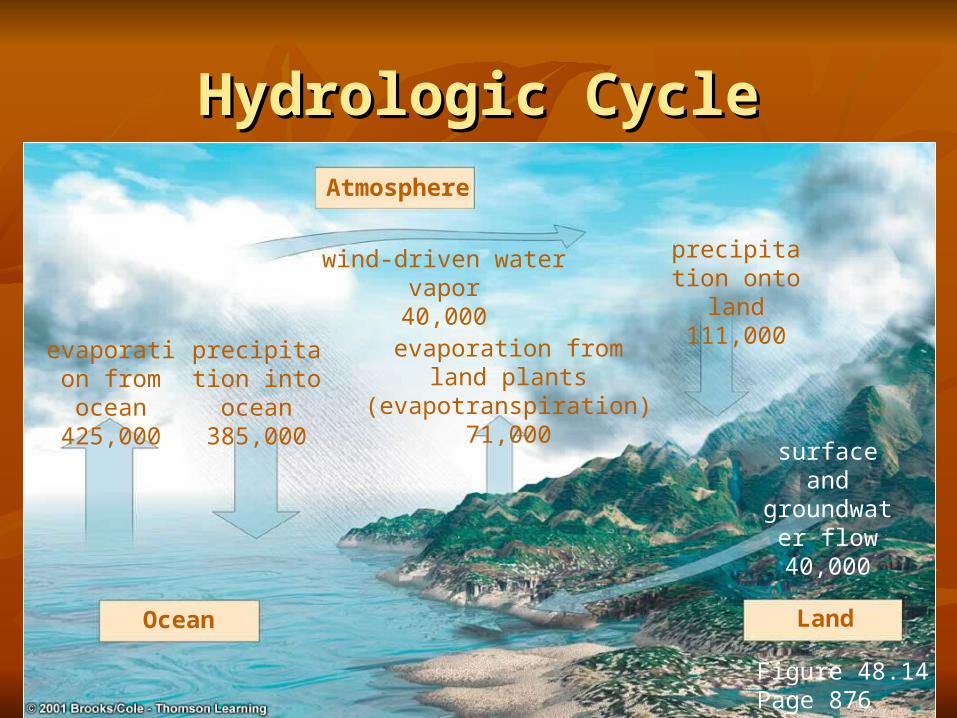
Hydrologic CycleHydrologic CycleAtmosphere
Ocean Land
evaporation from ocean
425,000
precipitation into ocean 385,000
evaporation from land plants (evapotranspiration)
71,000
precipitation onto land 111,000
wind-driven water vapor40,000
surface and groundwater flow 40,000
Figure 48.14Page 876

Hubbard Brook ExperimentHubbard Brook Experiment
A watershed was experimentally stripped of A watershed was experimentally stripped of
vegetationvegetation
All surface water draining from watershed was All surface water draining from watershed was
measuredmeasured
Removal of vegetation caused a six-fold Removal of vegetation caused a six-fold
increase in the calcium content of the runoff increase in the calcium content of the runoff
waterwater

Hubbard Brook ExperimentHubbard Brook Experiment
losses fromdisturbed watershed
time ofdeforestation
losses fromundisturbed watershed
Figure 48.15Page 877
Carbon CycleCarbon Cycle
Carbon moves through the atmosphere Carbon moves through the atmosphere
and food webs on its way to and from and food webs on its way to and from
the ocean, sediments, and rocksthe ocean, sediments, and rocks
Sediments and rocks are the main Sediments and rocks are the main
reservoirreservoir

Figure 48.16 Page 878
diffusion between atmosphere and ocean
bicarbonate and carbonate in ocean water
marine food webs
marine sediments
combustion of fossil fuels
incorporation into sediments
death, sedimentation uplifting
sedimentation
photosynthesis aerobic respiration
Carbon Cycle - MarineCarbon Cycle - Marine
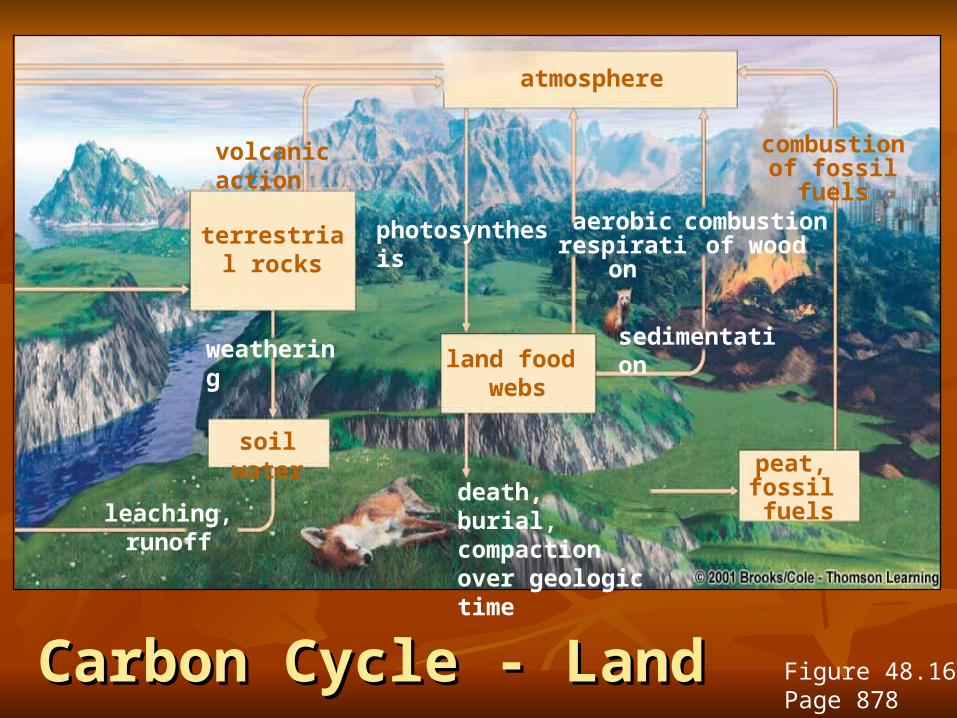
Carbon Cycle - LandCarbon Cycle - Land
photosynthesis aerobic respirationterrestrial
rocks
soil water
land food webs
atmosphere
peat, fossil fuels
combustion of wood
sedimentation
volcanic action
death, burial, compaction over geologic time
leaching, runoff
weathering
combustion of fossil fuels
Figure 48.16 Page 878

Carbon in the OceansCarbon in the Oceans
Most carbon in the ocean is dissolved Most carbon in the ocean is dissolved carbonate and bicarbonatecarbonate and bicarbonate
Ocean currents carry dissolved carbon Ocean currents carry dissolved carbon

Carbon in AtmosphereCarbon in Atmosphere
Atmospheric carbon is mainly carbon Atmospheric carbon is mainly carbon dioxidedioxide
Carbon dioxide is added to atmosphereCarbon dioxide is added to atmosphere Aerobic respiration, volcanic action, burning Aerobic respiration, volcanic action, burning
fossil fuels fossil fuels
Removed by photosynthesisRemoved by photosynthesis
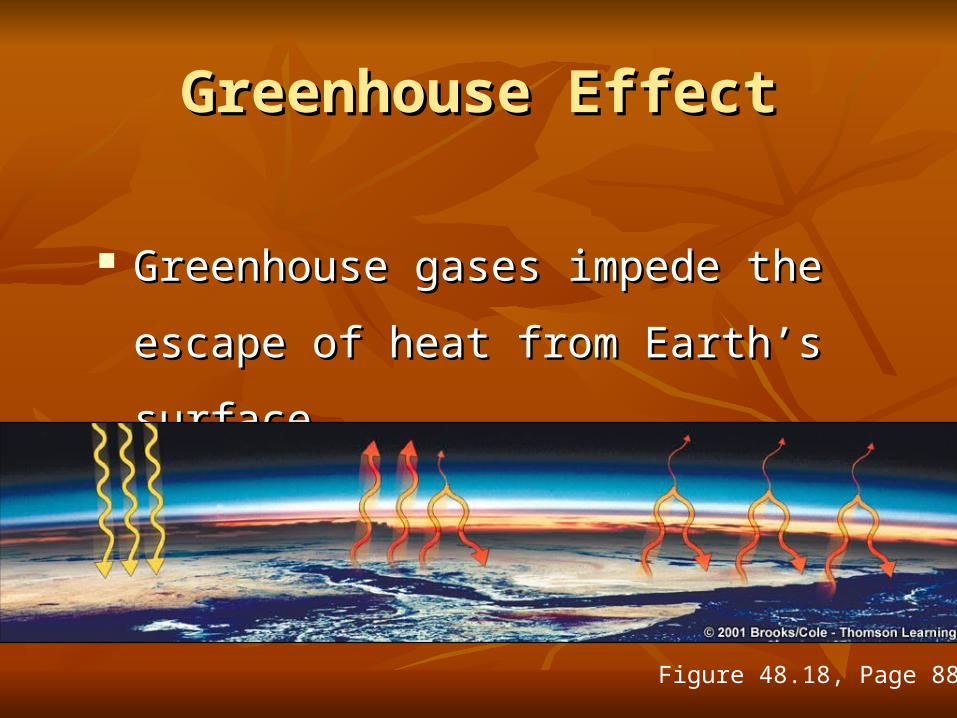
Greenhouse EffectGreenhouse Effect
Greenhouse gases impede the escape Greenhouse gases impede the escape
of heat from Earth’s surfaceof heat from Earth’s surface
Figure 48.18, Page 880
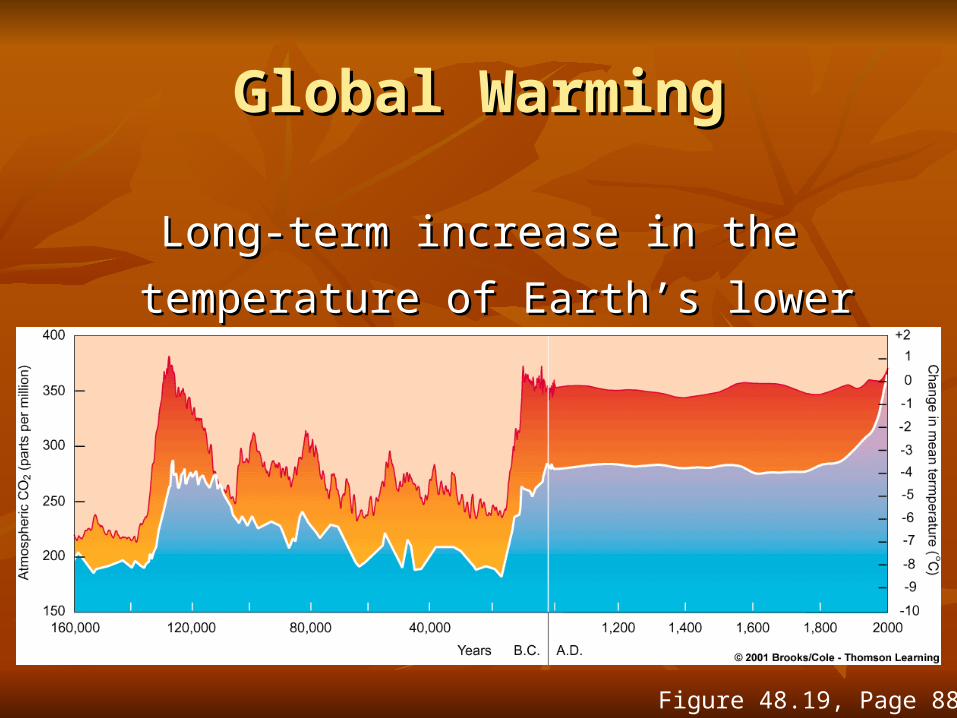
Global WarmingGlobal Warming
Long-term increase in the temperature of Long-term increase in the temperature of
Earth’s lower atmosphereEarth’s lower atmosphere
Figure 48.19, Page 881

Carbon Dioxide IncreaseCarbon Dioxide Increase
Carbon dioxide levels fluctuate seasonally Carbon dioxide levels fluctuate seasonally
The average level is steadily increasingThe average level is steadily increasing
Burning of fossil fuels and deforestation are Burning of fossil fuels and deforestation are
contributing to the increasecontributing to the increase

Other Greenhouse GasesOther Greenhouse Gases
CFCs - synthetic gases used in plastics and in CFCs - synthetic gases used in plastics and in
refrigerationrefrigeration
Methane - produced by termites and bacteriaMethane - produced by termites and bacteria
Nitrous oxide - released by bacteria, fertilizers, Nitrous oxide - released by bacteria, fertilizers,
and animal wastesand animal wastes

Nitrogen CycleNitrogen Cycle
Nitrogen is used in amino acids and nucleic Nitrogen is used in amino acids and nucleic
acidsacids
Main reservoir is nitrogen gas in the Main reservoir is nitrogen gas in the
atmosphereatmosphere

Nitrogen CycleNitrogen Cyclegaseous nitrogen (N2)
in atmosphere
NO3-
in soil
nitrogen fixationby industry
fertilizers
NH3-,NH4
+
in soil
1. Nitrification leaching
uptake by autotrophs
excretion, death, decomposition
uptake by autotrophs
nitrogen fixation
leaching
ammonification 2. Nitrification
dentrification nitrogenous
wastes, remains
NO2-
in soil
food webs on land
Figure 48.21Page 882
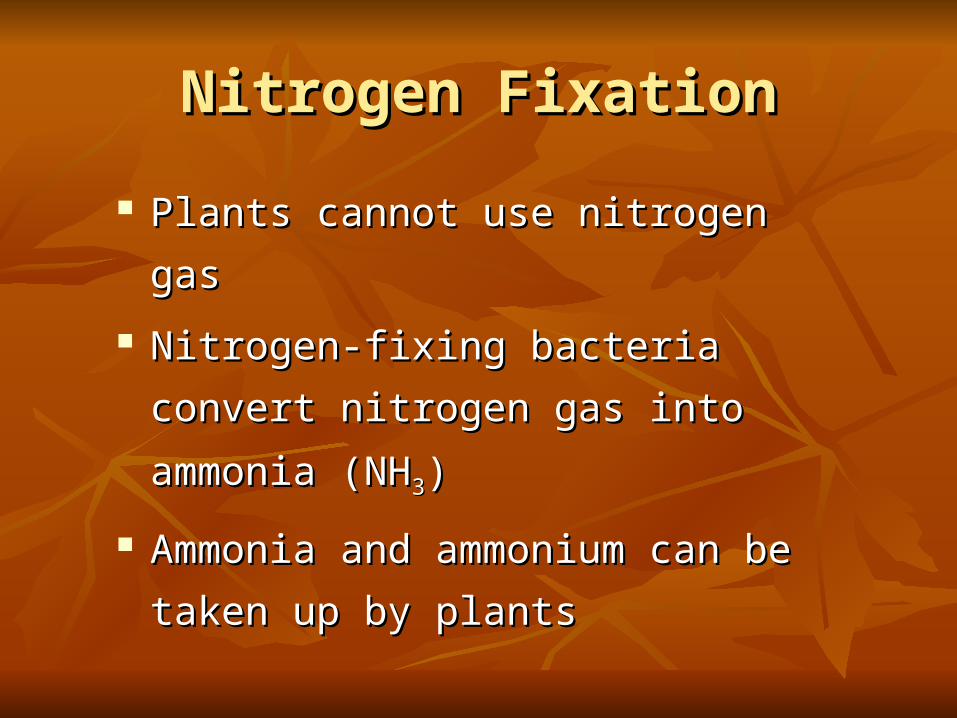
Nitrogen FixationNitrogen Fixation
Plants cannot use nitrogen gasPlants cannot use nitrogen gas
Nitrogen-fixing bacteria convert Nitrogen-fixing bacteria convert
nitrogen gas into ammonia (NHnitrogen gas into ammonia (NH33))
Ammonia and ammonium can be taken Ammonia and ammonium can be taken
up by plantsup by plants

Ammonification & NitrificationAmmonification & Nitrification
Bacteria and fungi carry out ammonificationBacteria and fungi carry out ammonification
conversion of nitrogenous wastes to ammoniaconversion of nitrogenous wastes to ammonia
Nitrifying bacteria convert ammonium to Nitrifying bacteria convert ammonium to
nitrites and nitratesnitrites and nitrates

Nitrogen LossNitrogen Loss
Nitrogen is often a limiting factor in Nitrogen is often a limiting factor in
ecosystemsecosystems
Nitrogen is lost from soils via leaching and Nitrogen is lost from soils via leaching and
runoff runoff
Denitrifying bacteria convert nitrates and Denitrifying bacteria convert nitrates and
nitrites to nitrogen gasnitrites to nitrogen gas

Human EffectsHuman Effects
Humans increase rate of nitrogen loss by Humans increase rate of nitrogen loss by clearing forests and grasslandsclearing forests and grasslands
Humans increase nitrogen in water and air by Humans increase nitrogen in water and air by using fertilizers and by burning fossil fuelsusing fertilizers and by burning fossil fuels
Too much or too little nitrogen can Too much or too little nitrogen can compromise plant healthcompromise plant health
Phosphorus CyclePhosphorus Cycle
Phosphorus is part of phospholipids and Phosphorus is part of phospholipids and
all nucleotidesall nucleotides
It is the most prevalent limiting factor in It is the most prevalent limiting factor in
ecosystems ecosystems
Main reservoir is Earth’s crust; no Main reservoir is Earth’s crust; no
gaseous phasegaseous phase
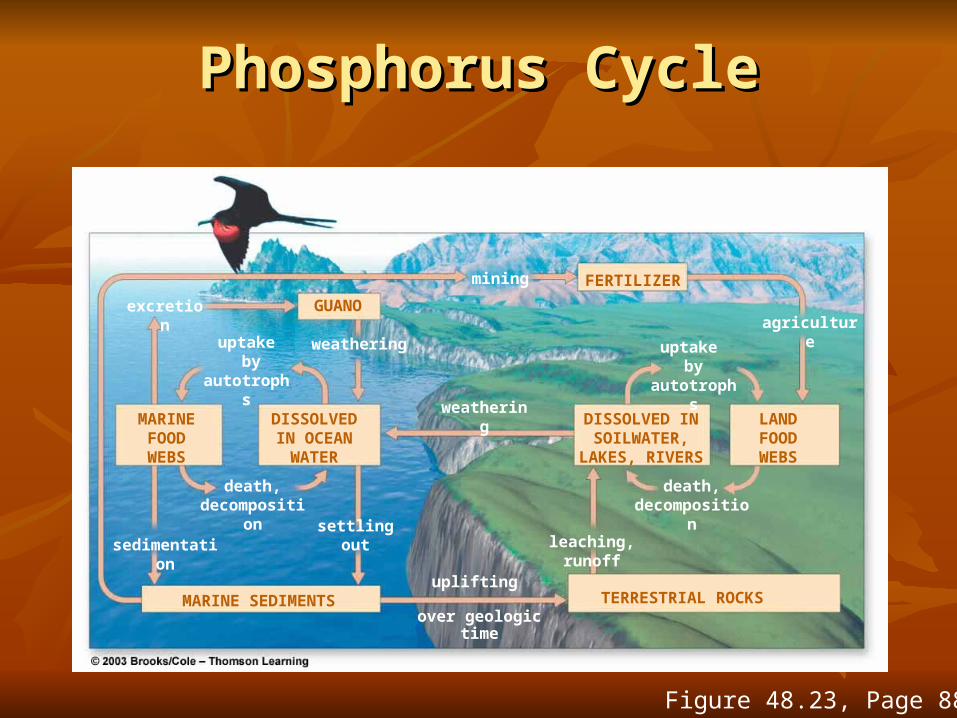
Phosphorus CyclePhosphorus Cycle
GUANO
FERTILIZER
TERRESTRIAL ROCKS
LAND FOOD WEBS
DISSOLVED IN OCEAN
WATER
MARINE FOOD WEBS
MARINE SEDIMENTS
excretion
weathering
mining
agricultureuptake
by autotrophs
death, decomposition
sedimentationsettling
out leaching, runoff
weathering
uplifting
over geologic time
DISSOLVED IN SOILWATER,
LAKES, RIVERS
uptake by
autotrophs
death, decomposition
Figure 48.23, Page 884

Human EffectsHuman Effects
In tropical countries, clearing lands for In tropical countries, clearing lands for
agriculture may deplete phosphorus-poor agriculture may deplete phosphorus-poor
soilssoils
In developed countries, phosphorus runoff is In developed countries, phosphorus runoff is
causing eutrophication of waterwayscausing eutrophication of waterways