Economic Systems and the Role of Government p. 36 ...
50
Copyright © 2020 Pearson Education, Inc. 14 by Tony Lima, California State University, East Bay, Hayward, CA CHAPTER OUTLINE AND LEARNING OBJECTIVES Scarcity, Choice, and Opportunity Cost p. 24 Understand why even in a society in which one person is better than a second at all tasks, it is still beneficial for the two to specialize and trade. Economic Systems and the Role of Government p. 36 Understand the central difference in the way command economies and market economies decide what is produced. Looking Ahead p. 38 Visit www.MyLabEconomics.com for current examples, news articles, and teaching tips.
Transcript of Economic Systems and the Role of Government p. 36 ...

Copyright © 2020 Pearson Education, Inc. 14
by Tony Lima, California State University, East Bay, Hayward, CA CHAPTER OUTLINE AND LEARNING OBJECTIVES
Scarcity, Choice, and Opportunity Cost p. 24 Understand why even in a society in which one person is better than a second at all tasks, it is still beneficial for the two to specialize and trade. Economic Systems and the Role of Government p. 36 Understand the central difference in the way command economies and market economies decide what is produced. Looking Ahead p. 38
Visit www.MyLabEconomics.com for current examples, news articles, and teaching tips.

Principles of Microeconomics 15
Copyright © 2020 Pearson Education, Inc.
Detailed Chapter Outline
I. Introduction, pages 22–23
This chapter explores the questions of what, how, and for whom to produce. Human wants are unlimited, but resources are not. This creates scarcity. Scarcity, in turn, forces us to make choices. The chapter stresses positive and descriptive economics, postponing normative questions until the students have acquired analytical tools.
TEACHING TIP: Stress the idea that any society must answer the three fundamental questions regardless of its political organization. One reason command economies don’t work well is the immense number of calculations that would be required to answer these questions correctly.
A. Resources, used in its broadest sense, includes everything from natural resources (timber, minerals, energy), capital (buildings, machines), labor (human capital), and entrepreneurship. Resources are also called factors of production, inputs, or simply factors. Output is what is produced, goods and services of value to households.
B. Key definitions:
1. Capital includes things that are produced and then used in the production of other goods and services. As used by economists, capital means physical capital, including buildings and machines.
2. Factors of production (factors) are the inputs into the process of production. Another term for resources.
3. Production is the process that transforms scarce resources into useful goods and services.
4. Inputs or resources include anything provided by nature or previous generations that can be used directly or indirectly to satisfy human wants.
TEACHING TIP: Many goods are used to produce other goods. Some of these goods are counted as intermediate goods (“parts”) while others are counted as capital. In the national income accounts, the distinction is simple: Anything that firms expect to use for more than 1 year is capital. Examples include a computer, office furniture, or an assembly line. If firms expect to use something for less than 1 year, it is an intermediate good. For example, quick-release bolts are common in bicycles. Because the bicycle maker expects to use many of these bolts within a year they are intermediate goods, not capital goods. Even though they are goods used to make another good, they are not capital. Think of them as parts instead. This is especially useful for those teaching macroeconomics.
5. Producers are those who transform resources into outputs (final goods and services).
6. Outputs are goods and services of value to households.
7. Households are the consumers in the economy. They purchase output.
II. Scarcity, Choice, and Opportunity Cost, pages 24–35
Learning Objective: Understand why even in a society in which one person is better than a second at all tasks, it is still beneficial for the two to specialize and trade.
A. Scarcity and Choice in a One-Person Economy
1. Bill must make choices about how to allocate resources, what to produce, and how to produce it. Bill’s situation is “constrained choice.” His main constraint is available time. Other constraints are his physical condition, his knowledge and skills, and the resources and climate of the island. Bill must decide what goods and services he wants to produce, what he is able to produce, and how to use the resources to produce what he wants.

Principles of Microeconomics
Copyright © 2020 Pearson Education, Inc.
16
TEACHING TIP: The text correctly notes that Bill has wants, not needs. Discourage your students from using the word “needs.” There are two reasons for this. First, “needs” is value-loaded, implying that the product in question is a necessity, possibly with a vertical demand curve. Second, “needs” may encourage students to ignore price rationing.
TOPIC FOR CLASS DISCUSSION:
What are some of the more useful skills Bill might want? Students will come up with things like building a fire, primitive construction, and being able to tell which berries are not poisonous. More subtle answers might include weather forecasting and knowledge of airline and shipping routes.
TEACHING TIP: This is a good place to follow the text’s lead and discuss the cost of leisure time. As the text notes, Bill can use as much time as he wants to lie on the beach. However, the cost of that leisure time is lost production.
2. Opportunity cost is the best alternative that we give up, or forgo, when we make a choice or decision. If Bill spends more time hunting he will have less time to build shelter. Similarly, time he spends on the beach also has an opportunity cost.
TEACHING TIP: Instructors sometimes rush through their discussion of individual versus societal opportunity cost because the point seems obvious. But the idea of opportunity cost makes a deep impression on students. They often find it valuable in their personal lives and remember it long after class is over.
Remind students that opportunity cost is relevant to societal as well as individual choices. A good way to drive the concept home is to find some social goal that virtually everyone in the class thinks is “good.” National health insurance for all? A pristine environment? Completely safe streets? Point out that achieving the goal requires resources, which must be pulled out of producing something else. How much “other production” would class members be willing to sacrifice to accomplish the goal? A cut in their material standard of living of 10 percent? How about 50 percent? Or 90 percent?
Public policy debates suffer when opportunity cost is ignored or calculated incorrectly. A major contribution of economists is to keep opportunity cost—correctly measured—part of policy debates.
B. Scarcity and Choice in an Economy of Two or More
1. Now there are two decision makers—Bill and Colleen. Their preferences, skills, and abilities probably differ. They will have to decide how much of each product each person should produce. They will probably benefit from specialization and trade.
TEACHING TIP: Students often have difficulty remembering that opportunity cost and comparative advantage are intertwined. Try using the term comparative opportunity cost advantage when calculating who should specialize in what. It helps students to remember that comparative advantage is what matters when calculating who should produce which good to maximize the gains from trade.
Economics in Practice: Frozen Foods and Opportunity Costs, page 26
Over the last 60 years, the frozen food market has boomed. In 2012, sales were $44 billion, about 44 times what they were in the mid-1950s. Increased labor force participation by women has increased the opportunity cost of their time. In other words the cost of preparing meals “from scratch” has risen. A second factor complementing this is a technological improvement, the introduction of the microwave oven. In fact, the widespread acceptance of microwave ovens occurred because of the increasing opportunity cost of time for housework. Entrepreneurs look for areas in which opportunity cost is rising to get some ideas about new technology.

Chapter 2: The Economic Problem: Scarcity and Choice
Copyright © 2020 Pearson Education, Inc.
17
TOPIC FOR CLASS DISCUSSION:
Related to Economics in Practice, page 26. Ask the class to list other devices that were developed in response to higher opportunity costs of time. One example is iRobot, a company that makes a line of home cleaning robots (http://www.irobot.com). The company has recently broadened their product line to include robotic mops and swimming pool cleaners.
2. Specialization, Exchange, and Comparative Advantage:
a. David Ricardo formulated the theory of comparative advantage, the idea that specialization and free trade will benefit all trading partners, even those that may be “absolutely” more efficient producers. (As we know today, this must be true of any voluntary exchange.) Ricardo’s most important point is that everyone—every individual, firm, and country—has a comparative advantage at something even if another has an absolute advantage at producing all goods and services. Trade and specialization allow the most efficient producer to produce each good. This increases productivity and aggregate output.
b. A producer has an absolute advantage over another in the production of a good or service if he or she can produce that product using fewer resources (a lower absolute cost per unit). In the text’s example, Colleen has an absolute advantage at both cutting logs and gathering food.
c. Comparative advantage is the advantage in the production of a good enjoyed by one country over another when that good can be produced at lower cost (in terms of other goods that must be foregone) than it could be in the other country.
d. Trade means both parties can consume at points outside their individual PPFs. This demonstrates the gains from specialization and trade.
TEACHING TIP: Comparative advantage is extremely important. It is the economic motivation for exchange between individuals (roommates, workers within an office, etc.); groups of individuals (divisions within a company, firms that specialize in productive tasks within an economy); and nations (international trade). Ask students to give examples from their own experiences. For example, who does which chores in their families and why?
TEACHING TIP: The data and graphs for Figure 2.3 are in the Excel workbook for this chapter.
TEACHING TIP: The numbers in Figure 2.2.a can be confusing. Remember each person is producing equal quantities of each good. For Colleen the solution is simple because her opportunity cost of 1 more log is 1 more bushel of food. But Bill's PPF has a slope of −0.5. In fact, the equation of Bill’s PPF is L = 4 – 0.5F. Setting L = F gives L = F = 2–2/3. Bill will spend 2/3 of a day producing logs and 1/3 of a day producing food.
TEACHING TIP: Walk through the example on pages 25–27 in the text in class. Do the calculations of opportunity costs. Show how Figure 2.3 on page 27 is constructed. It’s worth the time. If you don’t like the example in the text, try the following alternative example. Suppose Colleen and Bill subsist on fish and coconuts. Catching fish requires patience and good vision. Picking coconuts requires climbing ability and manual dexterity. Colleen can catch 18 fish per day or pick 36 coconuts. It costs her 36/18 = 2 coconuts per fish or 18/36 = 0.5 fish per coconut. Bill can catch 9 fish per day or pick 27 coconuts. It costs him 27/9 = 3 coconuts to catch a fish or 9/27 = 0.33 fish to pick a coconut. Colleen has a comparative advantage at fishing since one fish costs her only 2 coconuts compared to 3 for Bill. Bill has a comparative advantage at picking coconuts since it costs him 0.33 fish per coconut while it costs Colleen 0.5 fish per coconut. Colleen should specialize in fishing while Bill specializes in picking coconuts. Be sure the students understand how these calculations are done and why the numbers are opportunity costs.
Principles of Microeconomics
Copyright © 2020 Pearson Education, Inc.
18
3. Weighing Present and Expected Future Costs and Benefits: There is a trade-off between present and future benefits and costs. The simplest example of trading present for future benefits is saving part of our income, which allows us to consume more in the future. Even Bill, alone on his island, must choose between gathering food for immediate consumption and constructing tools that he can use to produce more in the future.
TEACHING TIP: This is a good place to introduce the time value of money. Make the point that the interest rate is the marginal opportunity cost of consumption today and the marginal benefit for saving.
4. Capital Goods and Consumer Goods: Consumer goods are goods produced for present consumption. When a society devotes a portion of its resources to investment in capital, it is trading present benefits for future benefits. Investment is new capital additions to a firm’s capital stock. Although capital is measured at a given point in time (a stock), investment is measured over a period of time (a flow). The flow of investment increases the capital stock.
TEACHING TIP: Emphasize that economists are quite specific when defining investment and capital. Capital means physical capital—buildings and machines. Investment is the process of creating new capital, often involving the construction industry. This is especially important when teaching macroeconomics.
TOPIC FOR CLASS DISCUSSION: Introduce the idea of human capital. Explain that education is an investment in human capital. Draw on the analysis of the cost of going to college (from Chapter 1) to consider it as investment. Is it a trade-off of current benefits for future benefits? What are those benefits?
C The Production Possibility Frontier (PPF)
1. The PPF can be used to show the principles of constrained choice and scarcity.
a. A production possibility frontier (ppf) is a graph that shows all the combinations of goods and services that can be produced if all of society’s resources are used efficiently.
b. All points on the curve are combinations of output produced using full resource employment and production efficiency.
c. Production efficiency means producing a given mix of outputs at least cost. This implies producing the maximum quantities of both goods given society’s resources and technology.
d. Points inside the curve are achievable but are not efficient. Points outside the curve are unattainable unless the quantities of resources increase or there is a technological improvement.
e. Different points on the PPF show the quantities of each of the two goods. At point F in Figure 2.4 the economy is producing more capital goods and less consumer goods than at point E. In subsequent years, the PPF will shift out further from point F than E.

Chapter 2: The Economic Problem: Scarcity and Choice
Copyright © 2020 Pearson Education, Inc.
19
Unique Economics in Practice
One measure of inefficiency is the unemployment rate, the percentage of the labor force that can’t find work. The unemployment rate fluctuates.
During recessions output falls and the unemployment rate rises. When the economy is expanding, output rises and the unemployment rate fall. This process is usually called a business cycle. (The data and graph for this example are in the Excel workbook for this chapter.)
Question: The unemployment rate is often called a countercyclical variable. Can you figure out why?
Answer: A countercyclical variable moves in the opposite direction from the economy. During an expansion output rises and the unemployment rate falls. During a recession, output falls and the unemployment rate rises. The two variables generally change in opposite directions.
TEACHING TIP: The presentation of the PPF is an excellent time to reinforce the way in which one should detail and use an economic model. Lay out the assumptions, being sure all variables are clearly defined, and use the model to explain what it is designed to explain (or predict). Advise students who are hesitant to work with graphs that the appendix to Chapter 1 provides a good review.
2. Negative Slope and Opportunity Cost
a. When resources are used efficiently the only way to produce more of one good is to produce less of the other. The opportunity cost of increasing production of good X by one unit is the number of units of good Y that must be sacrificed.
b. The marginal rate of transformation (MRT) is the slope of the production possibility frontier (ppf).
3. The Law of Increasing Opportunity Cost
a. The “bowed out” shape of the PPF tells us that the more society tries to increase production of one good, the more costly it becomes (in terms of the number of units of the other good that must be given up).
b. In effect, the law of increasing opportunity cost says the absolute value of the slope of the PPF will increase as the quantity on the x-axis increases.
TEACHING TIP: The text discusses climate differences between Ohio and Kansas as well as the impact of a law forcing farmers to plant more wheat in Ohio and more corn in Kansas (p. 32). You may want to bring up the corn ethanol mandate. The government has, in effect, told farmers to grow more corn. The inefficiency is identical to that described in the text. See the Unique Economics in Practice below.

Principles of Microeconomics
Copyright © 2020 Pearson Education, Inc.
20
TEACHING TIP: Suppose LeBron James, a well-known professional basketball player, was forced to teach economics. Presumably that would not be his most productive activity. Similarly, if you (or I) was assigned the job of playing center in the NBA, our productivity would be low. We know that because of revealed preference and comparative advantage.
4. The Efficient Mix of Output
a. To be efficient, an economy must produce what people want.
b. All points on the PPF are efficient in production. But the economy must also be at the correct point on the PPF (output efficiency).
TEACHING TIP: Figure 2.5 on page 34 shows a PPF for corn and wheat production. The specialized resource is climate. Ohio has a wetter climate, better suited to growing corn. Kansas is drier, better for growing wheat. Growing corn in Kansas or wheat in Ohio will be more costly because of the specialized resource (climate).
You may find the table below helpful. It expands Table 2.1 to include the MRT. With wheat on the horizontal axis, the correct measure of MRT is ΔC/ΔW. Again, do some examples in class showing how the slopes are calculated. (Technically you are calculating the slope of a secant, the straight line connecting two points on a curve.)
TEACHING TIP: Figure 2.5 and Table 2.1 are included in the Excel workbook for this chapter.
5. Economic growth is an increase in the total output of an economy. Growth occurs when a society acquires new resources or when it learns to produce more using existing resources. Growth causes an outward shift of the PPF. Growth is an increase in the total output of an economy.
TOPIC FOR CLASS DISCUSSION:
Growth is what happens when you relax the restrictive assumptions (fixed resources and technology) used to draw the first PPF. Have students consider what happens if a change in resources or technology affects society’s ability to produce one product but not the other. This can lead into a discussion of how the Internet has changed productivity in different industries.
Unique Economics in Practice
Sometimes, government contributes to allocative inefficiency. Under current U.S. law, ethanol intended for use as vehicle fuel must be made from corn. Part of this law imposes a tariff of $0.54 on every gallon of ethanol imported into the United States. This tariff is aimed squarely at Brazil, which produces ethanol from cane sugar at about 20 percent of the cost of producing ethanol from corn. Technologically, producing ethanol from sugar needs only water and yeast, while corn needs to be cooked before fermentation. The result has been high corn prices leading to high prices of many other foods, such as beef and chicken because those animals feed on corn. Producing ethanol from sugar in the United States is economically unattractive because the government restricts sugar imports. The price of sugar in the United States is about twice the world price due to these import restrictions. While the U.S. economy may be productively efficient, it is not allocatively efficient, largely because of these policies. Figure 2.6 on page 34 in

Chapter 2: The Economic Problem: Scarcity and Choice
Copyright © 2020 Pearson Education, Inc.
21
the text can be used as an example of this with very few changes. In fact, the ongoing example of increasing opportunity cost as the quantity of corn increases fits this example perfectly.
Question: Why does the government impose tariffs on ethanol and sugar imports?
Answer: Special interest groups seek ways to increase their incomes. One method they use is lobbying Congress to restrict imports and other forms of competition. In this case, those groups have been quite successful.
TEACHING TIP: Extreme examples can help students see the difference between allocative efficiency and productive efficiency. Suppose all of the land, labor, and capital in the country were used to produce something students might find undesirable, say Brussels sprouts or turnips. As long as the economy is producing the maximum amount possible of that good, then productive efficiency is achieved. However, the economy is not producing the best mix of outputs because it is not producing the goods people want. That means the mix of goods is not allocatively efficient. Make it clear to students that points on the curve represent a productively efficient combination of resources, but not necessarily an allocatively efficient combination of resources. Productive efficiency means all resources are being fully used. Allocative efficiency means the economy is producing the combination of goods and services consumers want to buy.
6. Sources of Growth and the Dilemma of the Poor Countries
a. Historically, the two most important sources of growth have been the accumulation of capital and technological advance.
b. For poor countries, taking resources out of the production of consumer goods is very difficult because they are living so close to subsistence levels. This lack of saving can make it difficult for them to accumulate capital, pay for research and development, and grow.
c. The paper by Robert Jensen cited in the footnote on p. 34 is an excellent example of how a seemingly minor technological improvement can lead to large welfare gains.
TEACHING TIP: There are several directions you can go from here. It appears that poor countries are destined to remain poor based on this analysis. However, recent research by Lucas and Romer seems to show that accumulation of human capital is more important than either physical capital or technology. And Lawrence Summers has estimated the rate of return on educating women in less developed countries is more than 20 percent.
D. The Economic Problem: How do different economic systems answer the three basic questions?
Economics in Practice: Trade-Offs among the Rich and Poor, p. 36
Poor countries are very poor. Consumers spend well over half their income on food. But they still make choices. About 10 percent of income is spent on sugar. About the same amount is spent on weddings, funerals, and other festivals. Even poor economies find the time and income for entertainment.

Principles of Microeconomics
Copyright © 2020 Pearson Education, Inc.
22
Unique Economics in Practice
This example shows how an increase in productivity in one sector of the economy can actually raise the opportunity cost of production in other sectors. During the mid-1980s, the lumber industry announced that a cord of wood (a 4-by-4-by-8 foot pile) could be converted into 942 one-pound books, 2,000 pounds of paper, 61,370 number 10 envelopes, or 7,500,000 toothpicks.
Measure the opportunity cost of books in terms of “toothpicks forgone.” Given the data above, the opportunity cost of a book is 7,500,000/942 = 7,961 toothpicks per book. Suppose that a technological advance in the toothpick industry (perhaps a waste-reducing technique) enables more toothpicks, say 9,000,000, to be created from a cord of wood.
Question: What happens to the opportunity cost of producing a book when productivity increases in the toothpick manufacturing industry?
Answer: The opportunity cost of producing a book increases! Now, one book “costs” 9,000,000/942 = 9,554 toothpicks, even though there has been no change in book-producing technology.
III. Economic Systems and the Role of Government, pages 36–37
Learning Objectives: Understand the central difference in the way command economies and market economies decide what is produced.
There are different types of economic systems:
A. Command Economies are those in which a central government either directly or indirectly sets output targets, incomes, and prices. There are few true command economies left in the world. Even China has become a “magnet for private capital and entrepreneurship.”
TOPIC FOR CLASS DISCUSSION:
Ask the class if they can name any countries that are pure (or almost pure) command economies. Three examples are Venezuela, Cuba, and North Korea. You can get a cheap laugh by referring to the People’s Republic of Santa Monica (California) as a third example.
Unique Economics in Practice
Venezuela is the latest country to try to control inflation with price ceilings. And the results are as predictable as the long lines and empty shelves in Caracas.
Prof. Steven Hanke has become the de facto monitor of hyperinflation (the Troubled Currencies Project at the Cato Institute, https://www.cato.org/research/troubled-currencies). As of September 23, 2018, Prof. Hanke estimates the annual inflation rate for Venezuela at 48,072 percent.
Question: Why are there long lines and empty shelves? And, more important, how can inflation be so high if prices are fixed by the government?
Answer: This is a great opportunity to introduce the idea of price rationing. Point out that when a price is set too low, people will want to buy more of that product than sellers are willing to sell. That simple fact creates long lines and empty shelves.
The second question is a bit more complicated. Just point out that high inflation rates are always caused by excessive growth in the quantity of money in circulation.
B. Laissez-Faire Economies: The Free Market
1. A laissez-faire economy is an economy in which individuals and firms are free to pursue their own self-interest without any government direction or regulation.

Chapter 2: The Economic Problem: Scarcity and Choice
Copyright © 2020 Pearson Education, Inc.
23
(“Laissez-faire” is from the French: “allow [them] to do.”) Laissez-faire economies rely on markets, institutions through which buyers and sellers interact and engage in exchange. Its characteristics include:
2. Consumer sovereignty is the idea that consumers ultimately dictate what will be produced (or not produced) by choosing what to purchase (and what not to purchase). The mix of output produced is dictated by the tastes, preferences, and incomes of consumers.
3. Individual Production Decisions: Free Enterprise:
a. Free enterprise is the freedom of individuals to start and operate businesses in search of profits. This increases output and develops new production techniques.
b. In market systems, prices are signals of relative scarcity. These price signals to consumers and producers guide them in making decisions. This is Adam Smith’s “invisible hand.”
c. Markets promote competition and efficiency.
4. Distribution of Output: Also determined in a decentralized way, the distribution depends on a household’s income and wealth.
TEACHING TIP: Income is the amount the household earns in a year. Wealth is the households accumulated saving (assets) out of income.
5. Price Theory: Prices are the basic coordinating and signaling mechanism. Wage rates are the prices of various kinds of labor. From page 38:
C. Mixed Systems, Markets, and Governments
1. All real-world economies are mixed, with differing degrees of government intervention. Market systems have advantages, but are not perfect.
2. In the United States, governments at all levels accounted for about 20 percent of total output. They directly employ about 14 percent of all workers. Governments redistribute income via taxes and social welfare spending. Finally, they regulate many aspects of economic activity.
3. Remember the “law of unintended consequences.” Government intervention may make things worse instead of better. Government sets and enforces the rules for an economy. Two important rules are the protection of private property and the enforcement of laws governing intellectual property.
TOPIC FOR CLASS DISCUSSION: Have students research countries in transition and consider the problems and challenges faced in the process.

Principles of Microeconomics
Copyright © 2020 Pearson Education, Inc.
24
IV. Looking Ahead, page 38
The next chapter discusses how markets work.
EXTENDED APPLICATION
Application 1: The Rising Cost of Services
Consider how the cost of services tends to rise over time. Why do items like haircuts, medical care, and education keep getting more and more expensive, both absolutely (they cost more dollars) and relatively (they require a larger and larger portion of our incomes)? Using the concept of opportunity cost, the production possibilities frontier, and a little common sense, we can come up with a realistic answer.
The three items mentioned above are examples of services. A service is, by definition, provided by workers directly to consumers. (One of the fastest-growing service sectors in the United States is meals eaten away from home.) A service is always consumed the moment it is produced. It cannot be brought home in a shopping bag or resold to someone else. Services can’t be inventoried. To keep the analysis simple, let us assume that a nation can produce only one good (T-shirts) and one service (haircuts). The nation’s production possibilities frontier is shown in the following graph:
Initially, at Point A, the economy is producing 100 haircuts and 300 T-shirts per day. Between points A and B the opportunity of producing 50 more T-shirts (increasing from 300 to 350) requires the sacrifice of 25 haircuts (decreasing from 100 to 75). The marginal rate of transformation is thus 50/25 = 2.00. Now (as students who are taking microeconomics will see later on) relative prices in a market economy usually correspond quite closely to opportunity costs. That is, if producing 50 more T-shirts uses resources that could otherwise produce 25 haircuts, then a haircut should cost about two times the cost of a T-shirt. Let us suppose that for this economy at Point A, each T-shirt costs $5 and each haircut costs $10.
Many economists believe that the growth of productivity (output per hour) is much slower for services than for goods. This is easy to see in the case of T-shirts versus haircuts. Over the past 50 years, the number of T-shirts a worker can produce in an hour has increased dramatically due to technological advances in cotton-picking, weaving, and assembly-line production techniques. Over the same period, however, the number of haircuts a barber could perform in an hour has probably increased very little, if at all.
The effect of this asymmetrical change in productivity is illustrated in the diagram. Note that the vertical (T-shirt) intercept of the production possibilities frontier has increased, reflecting an increase in the maximum quantity of T-shirts that could be produced—after the productivity

Chapter 2: The Economic Problem: Scarcity and Choice
Copyright © 2020 Pearson Education, Inc.
25
change—if all resources were devoted to T-shirt production. But the horizontal (haircut) intercept remains the same, as there has been no productivity change in this industry.
Suppose that the economy ends up at Point C on the new PPF. The economy is producing more T-shirts (160) and more haircuts (400). In addition, the opportunity cost has increased. As the economy moves from Point C to Point D (after the productivity change) it could produce 100 additional T-shirts with a sacrifice of 25 haircuts. The opportunity cost is now 4.00 instead of 2.00. In other words, even though there has been no change in haircut technology or productivity, the opportunity cost of haircuts has risen! One haircut should now cost the same as 10 T-shirts. If T-shirts continue to cost $5 each, then haircuts should rise in price to $50. Alternatively, if T-shirts fall to $1.50 each, haircuts should remain priced at $15. Either way, the relative price of haircuts will rise, as the opportunity cost of haircuts has risen.
This simple analysis has far-reaching implications. It explains why college tuition rises faster than the general price level, as providing an education relies heavily on services (teaching, building maintenance, administrative services) rather than goods. Similarly, it suggests that ongoing efforts to reform health care may be only partially successful. We can certainly choose, as a nation, to provide better health care to more of our population. But if manufacturing productivity continues to increase faster than productivity in medical services, then the relative price of health care like the relative price of haircuts, will rise.
If your class seems to enjoy this material, point out that global competition mostly has no effect on services such as haircuts because they are nontraded goods. Then note that technology is moving more and more goods from the “nontraded” category into “traded.” Education is a good example. There are several consortiums 0f universities and a number of private companies hoping to exploit the trend toward online education.

Principles of Microeconomics
Thirteenth Edition
Chapter 2
The Economic Problem: Scarcity and Choice
Copyright © 2020, 2016, 2011 Pearson Education, Inc. All Rights Reserved

Copyright © 2020, 2016, 2011 Pearson Education, Inc. All Rights Reserved
Chapter Outline and Learning Objectives
2.1 Scarcity, Choice, and Opportunity Cost
• Understand why even in a society in which one person is better than a second at all tasks, it is still beneficial for the two to specialize and trade.
2.2 Economic Systems and the Role of Government
• Understand the central difference in the way command economies and market economies decide what is produced.
Looking Ahead

Copyright © 2020, 2016, 2011 Pearson Education, Inc. All Rights Reserved
Chapter 2 The Economic Problem: Scarcity and Choice (1 of 2)
• On the surface, economic issues seem quite different from one another.
• But the fundamental concern is choice in a world of scarcity.
• Individuals’ choices determine three key features of society:
– What gets produced?
– How is it produced?
– Who gets what is produced?

Copyright © 2020, 2016, 2011 Pearson Education, Inc. All Rights Reserved
Chapter 2 The Economic Problem: Scarcity and Choice (2 of 2)
• capital Things that are produced and then used in the production of other goods and services.
• factors of production (or factors) The inputs into the process of production. Another term for resources.
• production The process that transforms scarce resources into useful goods and services.
• inputs or resources Anything provided by nature or previous generations that can be used directly or indirectly to satisfy human wants.
• outputs Goods and services of value to households.

Copyright © 2020, 2016, 2011 Pearson Education, Inc. All Rights Reserved
Figure 2.1 The Three Basic Questions
• Every society has some system or process that transforms its scarce resources into useful goods and services.
• In doing so, it must decide what gets produced, how it is produced, and to whom it is distributed.
• The primary resources that must be allocated are land, labor, and capital.

Copyright © 2020, 2016, 2011 Pearson Education, Inc. All Rights Reserved
Scarcity, Choice, and Opportunity Cost
Scarcity and Choice in a One-Person Economy
• Nearly all the same basic decisions that characterize complex economies must also be made in a simple economy.
• A person must decide what to produce and how and when to produce it.

Copyright © 2020, 2016, 2011 Pearson Education, Inc. All Rights Reserved
Scarcity and Choice in a One-Person Economy
Opportunity Cost
• The concepts of constrained choice and scarcity are central to the discipline of economics.
• opportunity cost The best alternative that we give up, or forgo, when we make a choice or decision.

Copyright © 2020, 2016, 2011 Pearson Education, Inc. All Rights Reserved
Economics In Practice (1 of 2)
Frozen Foods and Opportunity Costs
The growth of the frozen dinner entrée market in the last 50 years is a good example of the role of opportunity costs in our lives.
Many entrepreneurs find that the simple tools of economics—like the idea of opportunity costs—help them anticipate what products will be profitable for them to produce in the future.
CRITICAL THINKING
1. Many people think that soda consumption also leads to increased obesity. Many schools have banned the sale of soda in vending machines. Use the idea of opportunity costs to explain why some people think these bans will reduce consumption. Do you agree?

Copyright © 2020, 2016, 2011 Pearson Education, Inc. All Rights Reserved
Scarcity and Choice in an Economy of Two or More (1 of 2)
Specialization, Exchange, and Comparative Advantage
• theory of comparative advantage Ricardo’s theory that specialization and free trade will benefit all trading parties, even those that may be “absolutely” more efficient producers.
• absolute advantage A producer has an absolute advantage over another in the production of a good or service if he or she can produce that product using fewer resources (a lower absolute cost per unit).
• comparative advantage A producer has a comparative advantage over another in the production of a good or service if he or she can produce that product at a lower opportunity cost.

Copyright © 2020, 2016, 2011 Pearson Education, Inc. All Rights Reserved
Figure 2.2 Comparative Advantage and the Gains from Trade
Panel (a) shows the best Colleen and Bill can do each day, given their talents and assuming they each wish to consume an equal amount of food and wood.
Notice that Colleen produces by splitting her time equally during the day, while Bill must devote two-thirds of his time to wood production if he wishes to equalize his amount produced of the two goods.
Panel (b) shows what happens when both parties specialize. Notice that more units of each good are produced.
Copyright © 2020, 2016, 2011 Pearson Education, Inc. All Rights Reserved
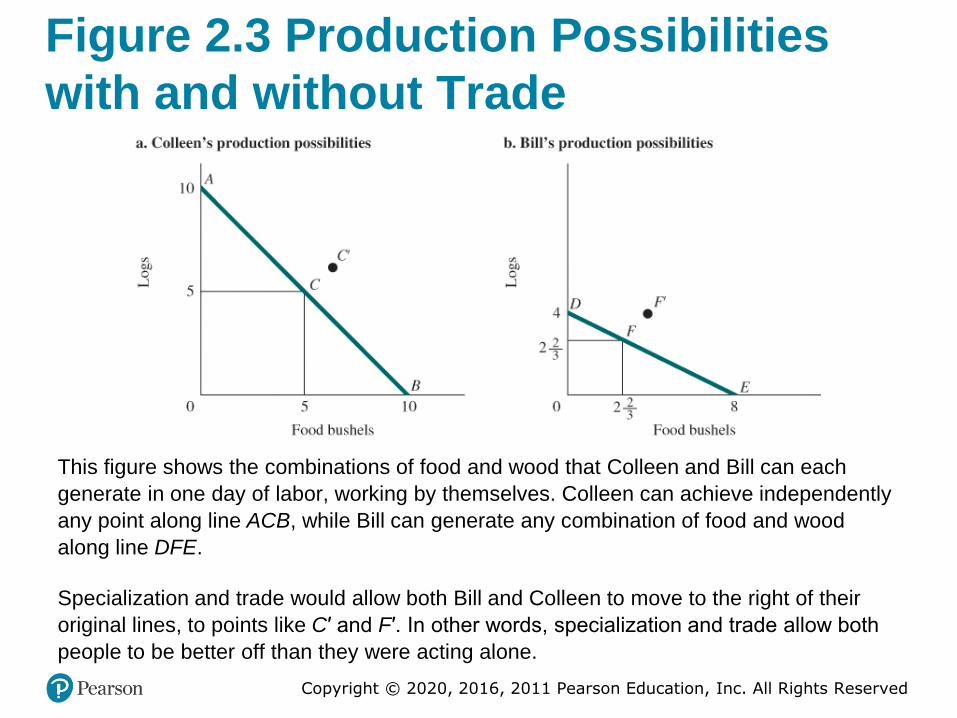
Figure 2.3 Production Possibilities with and without Trade
This figure shows the combinations of food and wood that Colleen and Bill can each
generate in one day of labor, working by themselves. Colleen can achieve independently
any point along line ACB, while Bill can generate any combination of food and wood
along line DFE.
Specialization and trade would allow both Bill and Colleen to move to the right of their
original lines, to points like C′ and F′. In other words, specialization and trade allow both
people to be better off than they were acting alone.

Copyright © 2020, 2016, 2011 Pearson Education, Inc. All Rights Reserved
Scarcity and Choice in an Economy of Two or More (2 of 2)
Weighing Present and Expected Future Costs and Benefits
• We trade off present and future benefits in small ways all the time.
Capital Goods and Consumer Goods
• consumer goods Goods produced for present consumption.
• investment The process of using resources to produce new capital.

Copyright © 2020, 2016, 2011 Pearson Education, Inc. All Rights Reserved
The Production Possibility Frontier (1 of 7)
• production possibility frontier (ppf) A graph that shows all the combinations of goods and services that can be produced if all of society’s resources are used efficiently.

Copyright © 2020, 2016, 2011 Pearson Education, Inc. All Rights Reserved
Figure 2.4 Production Possibility Frontier
• The ppf illustrates a number of economic concepts. One of the most important is opportunity cost.
• The opportunity cost of producing more capital goods is fewer consumer goods.
• Moving from E to F, the number of capital goods increases from 550 to 800, but the number of consumer goods decreases from 1,300 to 1,100.

Copyright © 2020, 2016, 2011 Pearson Education, Inc. All Rights Reserved
The Production Possibility Frontier (2 of 7)
Negative Slope and Opportunity Cost
• marginal rate of transformation (MRT) The slope of the production possibility frontier (ppf).
• The negative slope tells us how much society has to give up of one output to get a unit of another output.

Copyright © 2020, 2016, 2011 Pearson Education, Inc. All Rights Reserved
The Production Possibility Frontier (3 of 7)
The Law of Increasing Opportunity Cost
FIGURE 2.5 Corn and Wheat Production in Ohio and Kansas
• The ppf illustrates that the
opportunity cost of corn production
increases as we shift resources from
wheat production to corn production.
Moving from point E to D, we get an
additional 100 million bushels of corn
at a cost of 50 million bushels of
wheat.
• Moving from point B to A, we get only
50 million bushels of corn at a cost of
100 million bushels of wheat. The
cost per bushel of corn—measured
in lost wheat—has increased.

Copyright © 2020, 2016, 2011 Pearson Education, Inc. All Rights Reserved
Table 2.1 Production Possibility Schedule for Total Corn and Wheat Production in Ohio and Kansas
Point on ppfTotal Corn Production (Millions
of Bushels Per Year)Total Wheat Production
(Millions of Bushels Per Year)
A 700 100
B 650 200C 510 380D 400 500E 300 550
• The ppf illustrates that the opportunity cost of corn production increases as we shift resources from wheat production to corn production. Moving from point E to D, we get an additional 100 million bushels of corn at a cost of 50 million bushels of wheat.
• Moving from point B to A, we get only 50 million bushels of corn at a cost of 100 million bushels of wheat. The cost per bushel of corn—measured in lost wheat—has increased.

Copyright © 2020, 2016, 2011 Pearson Education, Inc. All Rights Reserved
The Production Possibility Frontier (4 of 7)
Unemployment
• During economic downturns or recessions, industrial plants run at less than their total capacity.
• When there is unemployment of labor, we are not producing all that we can.

Copyright © 2020, 2016, 2011 Pearson Education, Inc. All Rights Reserved
The Production Possibility Frontier (5 of 7)
Inefficiency
• Waste and mismanagement are the results of a firm operating below its potential.
• Sometimes inefficiency results from mismanagement of the economy instead of mismanagement of individual private firms.

Copyright © 2020, 2016, 2011 Pearson Education, Inc. All Rights Reserved
Figure 2.6 Inefficiency from Misallocation of Land in Farming
Inefficiency always results in a combination of production shown by a point inside the ppf, like point A.
Increasing efficiency will move production possibilities toward a point on the ppf, such as point B.

Copyright © 2020, 2016, 2011 Pearson Education, Inc. All Rights Reserved
The Production Possibility Frontier (6 of 7)
The Efficient Mix of Output
• To be efficient, an economy must produce what people want.
• Output efficiency occurs when the economy is operating at the “right” point on the ppf.

Copyright © 2020, 2016, 2011 Pearson Education, Inc. All Rights Reserved
The Production Possibility Frontier(7 of 7)
Economic Growth
• economic growth An increase in the total output of an economy. Growth occurs when a society acquires new resources or when it learns to produce more using existing resources.
• Growth shifts the ppf up and to the right.

Copyright © 2020, 2016, 2011 Pearson Education, Inc. All Rights Reserved
Table 2.2 Increasing Productivity in Corn and Wheat Production in the United States, 1935–2017
Blank Corn Wheat
Blank Yield per Acre (Bushels) Yield per Acre (Bushels)
1935–1939 26.1 13.2
1945–1949 36.1 16.9
1955–1959 48.7 22.3
1965–1969 78.5 27.5
1975–1979 95.3 31.3
1981–1985 107.2 36.9
1985–1990 112.8 38.9
1990–1995 120.6 38.1
1998 134.4 43.2
2001 138.2 43.5
2006 145.6 42.3
2007 152.8 40.6
2008 153.9 44.9
2009 164.9 44.3
2010 152.8 46.4
2011 147.2 43.7
2012 123.4 46.3
2013 158.8 47.2
2014 171.0 43.7
2015 168.4 43.6
2016 174.6 52.7
2017 176.6 46.3
Source: U.S. Department of Agriculture, Economic Research Service, Agricultural Statistics, Crop Summary.
Copyright © 2020, 2016, 2011 Pearson Education, Inc. All Rights Reserved
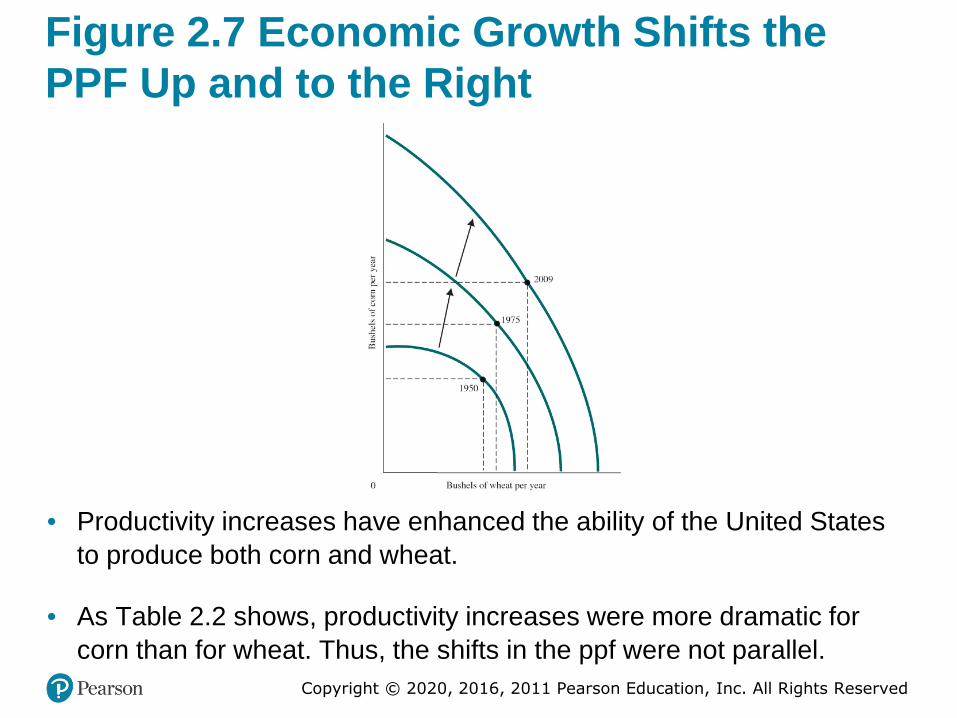
Figure 2.7 Economic Growth Shifts the PPF Up and to the Right
• Productivity increases have enhanced the ability of the United States
to produce both corn and wheat.
• As Table 2.2 shows, productivity increases were more dramatic for
corn than for wheat. Thus, the shifts in the ppf were not parallel.

Copyright © 2020, 2016, 2011 Pearson Education, Inc. All Rights Reserved
Figure 2.8 Capital Goods and Growth in Poor and Rich Countries
• Rich countries find it easier than poor countries to devote resources to the production of capital, and the more resources that flow into capital production, the faster the rate of economic growth.
• Thus, the gap between poor and rich countries has grown over time.

Copyright © 2020, 2016, 2011 Pearson Education, Inc. All Rights Reserved
Economics In Practice (2 of 2)
Trade-Offs among the Rich and Poor
In all societies, for all people, resources are limited relative to people’s demands.
In 1990, the World Bank defined the extremely poor people of the world as those earning less than $1 a day.
Even for the poorest consumers, biological need is not all determining. So even in extremely poor societies, household choice plays a role.
CRITICAL THINKING
1. Why might we see a greater demand for festivals in poor countries than in rich ones? How might this be affected by choices available?

Copyright © 2020, 2016, 2011 Pearson Education, Inc. All Rights Reserved
The Economic Problem
• Recall the three basic questions facing all economic systems:
– What gets produced?
– How is it produced?
– Who gets it?
• Given scarce resources, how do large, complex societies go about answering the three basic economic questions?

Copyright © 2020, 2016, 2011 Pearson Education, Inc. All Rights Reserved
Economic Systems and the Role of Government (1 of 7)
Command Economies
• command economy An economy in which a central government either directly or indirectly sets output targets, incomes, and prices.
Laissez-Faire Economies: The Free Market
• laissez-faire economy Literally from the French: “allow [them] to do.” An economy in which individual people and firms pursue their own self-interest without any central direction or regulation.

Copyright © 2020, 2016, 2011 Pearson Education, Inc. All Rights Reserved
Economic Systems and the Role of Government (2 of 7)
• market The institution through which buyers and sellers interact and engage in exchange.
• Some markets are simple and others are complex, but they all involve buyers and sellers engaging in exchange.
• The behavior of buyers and sellers in a laissez-faire economy determines what gets produced, how it is produced, and who gets it.

Copyright © 2020, 2016, 2011 Pearson Education, Inc. All Rights Reserved
Economic Systems and the Role of Government (3 of 7)
Consumer Sovereignty
• consumer sovereignty The idea that consumers ultimately dictate what will be produced (or not produced) by choosing what to purchase (and what not to purchase).
• The mix of output is dictated by consumers who “vote” by buying or not buying.

Copyright © 2020, 2016, 2011 Pearson Education, Inc. All Rights Reserved
Economic Systems and the Role of Government (4 of 7)
Individual Production Decisions: Free Enterprise
• Under a free market system, individual producers must determine how to organize and coordinate their production.
• In a free market economy, production decisions are made by private organizations acting in their own interest.

Copyright © 2020, 2016, 2011 Pearson Education, Inc. All Rights Reserved
Economic Systems and the Role of Government (5 of 7)
Distribution of Output
• A household’s income affects the amount of output it can get.
• Income is the amount that a household earns each year. It comes in a number of forms, such as wages, salaries, and interest.
• You may be able to increase your income by getting more education or training.
Copyright © 2020, 2016, 2011 Pearson Education, Inc. All Rights Reserved
Economic Systems and the Role of Government (6 of 7)
Price Theory
• In a free market system, the basic economic questions are answered without the help of a central government plan or directives.
• This is what the “free” in free market means—the system is left to operate on its own, with no outside interference. Individuals pursuing their own self-interest will go into business and produce the products and services that people want.

Copyright © 2020, 2016, 2011 Pearson Education, Inc. All Rights Reserved
Economic Systems and the Role of Government (7 of 7)
Price Theory
• Other individuals will decide whether to acquire skills; whether to work; and whether to buy, sell, invest, or save the income that they earn.
• The basic coordinating mechanism is price.

Copyright © 2020, 2016, 2011 Pearson Education, Inc. All Rights Reserved
Mixed Systems, Markets, and Governments
• The differences between command economies and laissez-faire economies in their pure forms are enormous.
• In fact, these pure forms do not exist in the world.
• All real systems are in some sense “mixed.”

Copyright © 2020, 2016, 2011 Pearson Education, Inc. All Rights Reserved
Looking Ahead
• This chapter described the economic problem in broad terms.
• We outlined the questions that all economic systems must answer.
• We also discussed broadly the two kinds of economic systems.
• In the next chapter, we analyze the way market systems work.

Copyright © 2020, 2016, 2011 Pearson Education, Inc. All Rights Reserved
Review Terms and Concepts
• absolute advantage
• capital
• command economy
• comparative advantage
• consumer goods
• consumer sovereignty
• economic growth
• factors of production (or factors)
• inputs or resources
• investment
• laissez-faire economy
• marginal rate of transformation (MRT)
• market
• opportunity cost
• outputs
• production
• production possibility frontier (ppf)
• theory of comparative advantage

Copyright © 2020, 2016, 2011 Pearson Education, Inc. All Rights Reserved
Copyright
This work is protected by United States copyright laws and isprovided solely for the use of instructors in teaching their courses and assessing student learning. Dissemination or sale of any part of this work (including on the World Wide Web) will destroy the integrity of the work and is not permitted. The work and materials from it should never be made available to students except by instructors using the accompanying text in their classes. All recipients of this work are expected to abide by these restrictions and to honor the intended pedagogical purposes and the needs of other instructors who rely on these materials.