Economic Outlook William Strauss Senior Economist and Economic Advisor Federal Reserve Bank of...
36
Economic Outlook William Strauss Senior Economist and Economic Advisor Federal Reserve Bank of Chicago Multi-Chamber Economic Outlook Luncheon Westmont, IL February 27, 2014
-
Upload
johnny-eakins -
Category
Documents
-
view
214 -
download
0
Transcript of Economic Outlook William Strauss Senior Economist and Economic Advisor Federal Reserve Bank of...

Economic Outlook
William Strauss Senior Economist and Economic Advisor Federal Reserve Bank of
Chicago
Multi-Chamber Economic Outlook LuncheonWestmont, ILFebruary 27, 2014

• The outlook is for the U.S. economy to expand at a
pace around trend in 2013
What I said last year about 2013
• Employment is expected to rise moderately with the
unemployment rate edging lower
• Slackness in the economy will lead to a relatively
contained inflation rate
• Growth in manufacturing output should be around trend in 2013

The “Great Recession” ended in June 2009 and GDP expanded by 2.7% in 2013
-10
-8
-6
-4
-2
0
2
4
6
8
1990 '91 '92 '93 '94 '95 '96 '97 '98 '99 '00 '01 '02 '03 '04 '05 '06 '07 '08 '09 '10 '11 '12 '13
Real gross domestic productpercent
Quarterly change (saar)
Percent change from a year earlier

A large share of the growth in Real GDPcame from an increase in inventories
2.7
1.6
0.3 0.2
0.9
-0.4
0.3
-1
0
1
2
3
GDP Consumption BusinessFixed
Investment
ResidentialInvestment
Change inInventories
Government Net Exports
Contributions to real GDP growth in 2013percentage points

However, real final sales(GDP less change in private inventories)
growth was far more restrained
-8
-6
-4
-2
0
2
4
6
8
1990 '91 '92 '93 '94 '95 '96 '97 '98 '99 '00 '01 '02 '03 '04 '05 '06 '07 '08 '09 '10 '11 '12 '13
Real final salespercent
Quarterly change (saar)
Percent change from a year earlier

0
500
1,000
1,500
2,000
2,500
3,000
3,500
4,000
Liabilities of the Federal ReserveBi l lions of dollars
Treasury Balance
Currency in Circulation
2007 2008 2009 2010
Deposits of Depository Institutions
2011 2012 2013
The liabilities side of the Fed’s balance sheetshows large amount of excess reserves

$150,000
$175,000
$200,000
$225,000
$250,000
$275,000
1990'91 '92 '93 '94 '95 '96 '97 '98 '99 '00 '01 '02 '03 '04 '05 '06 '07 '08 '09 '10 '11 '12 '13 '14
Real Median sales price - existing single family home3-month smoothed (2013 dollars)
Real existing home prices fell by 40%, but have begun to rise

62
64
66
68
70
72
74
76
1965 '70 '75 '80 '85 '90 '95 '00 '05 '10
United States
Homeownership ratepercent
Midwest
The forecast calls for a very gradual recovery in housing
0
500
1,000
1,500
2,000
2,500
1980 '85 '90 '95 '00 '05 '10 '15
Housing startsthousands
Blue Chip Housing StartsForecast (thousands)
Actual Forecast 2013 2014 2015928 1,106 1,311

The stock market has improved since March 2009,and has exceeded its previous peak
50
100
150
200
250
300
350
1990 '91 '92 '93 '94 '95 '96 '97 '98 '99 '00 '01 '02 '03 '04 '05 '06 '07 '08 '09 '10 '11 '12 '13 '14
Real S&P 500 stock indexIndex: 1990 = 100

-10
-8
-6
-4
-2
0
2
4
6
8
2000 '01 '02 '03 '04 '05 '06 '07 '08 '09 '10 '11 '12 '13 '14 '15
Real gross domestic productpercent
Quarterly change (saar)
Percent change from a year earlierQ4-2013
Blue Chip GDP Forecast
Actual Forecast 2013 2014 2015
2.7 2.7 3.0
GDP is forecast to grow somewhatabove trend in 2014 and 2015

The FOMC expects GDP to grow somewhatabove trend over the next three years
-5-4-3-2-10123456
1990 '91 '92 '93 '94 '95 '96 '97 '98 '99 '00 '01 '02 '03 '04 '05 '06 '07 '08 '09 '10 '11 '12 '13 '14 '15 '16
Real gross domestic productpercent change from a year earlier
FOMC
FOMC Central Tendency (December 2013)
2014 2.8 – 3.22015 3.0 – 3.42016 2.5 – 3.2
Longer run 2.2 – 2.4

98100102104106108110112114116118120122124126
98100102104106108110112114116118120122124126
-8 -7 -6 -5 -4 -3 -2 -1 0 1 2 3 4 5 6 7 8 9 10 11 12 13 14 15 16 17 18
Business cycle recovery pathindex - business cycle trough = 100
1981-82
2008-09
1974-75
quarters before trough quarters after trough
The path of the current recovery is restrainedcompared with past deep recession recovery cycles
average annualized growth: 5.0%
average annualized growth: 4.6%
average annualized growth: 2.4%

-8
-6
-4
-2
0
2
4
6
1990'91 '92 '93 '94 '95 '96 '97 '98 '99 '00 '01 '02 '03 '04 '05 '06 '07 '08 '09 '10 '11 '12 '13 '14
Total employmentpercent
Monthly change (saar)
Percent change from a year earlier
Employment fell by over 8.7 million jobsbetween December 2007 and February 2010,since then it has added over 7.8 million jobs,
with just over 2.2 million jobs added over the past 12 months

3
4
5
6
7
8
9
10
11
1990'91 '92 '93 '94 '95 '96 '97 '98 '99 '00 '01 '02 '03 '04 '05 '06 '07 '08 '09 '10 '11 '12 '13 '14
Unemployment ratepercent
After peaking in October 2009,the unemployment rate has fallen by
3.4 percentage points

0
2
4
6
8
10
2000 '01 '02 '03 '04 '05 '06 '07 '08 '09 '10 '11 '12 '13 '14 '15
Unemployment ratepercent
Unemployment ratepercent
Q4-2013
Blue Chip Forecast
The unemployment rate is forecast to edge lower

3
4
5
6
7
8
9
10
11
1990 '91 '92 '93 '94 '95 '96 '97 '98 '99 '00 '01 '02 '03 '04 '05 '06 '07 '08 '09 '10 '11 '12 '13 '14 '15 '16
Unemployment ratepercent
FOMC
The FOMC forecasts that the unemployment ratewill approach the natural rate towards the end of 2016
FOMC Central Tendency (December 2013)
2014 6.3 – 6.62015 5.8 – 6.12016 5.3 – 5.8
Longer run 5.2 – 5.8

-1
0
1
2
3
4
5
6
1990'91 '92 '93 '94 '95 '96 '97 '98 '99 '00 '01 '02 '03 '04 '05 '06 '07 '08 '09 '10 '11 '12 '13 '14
Personal consumption expenditure - chain price indexpercent change from a year earlier
Inflation has moderated
0
20
40
60
80
100
120
140
160
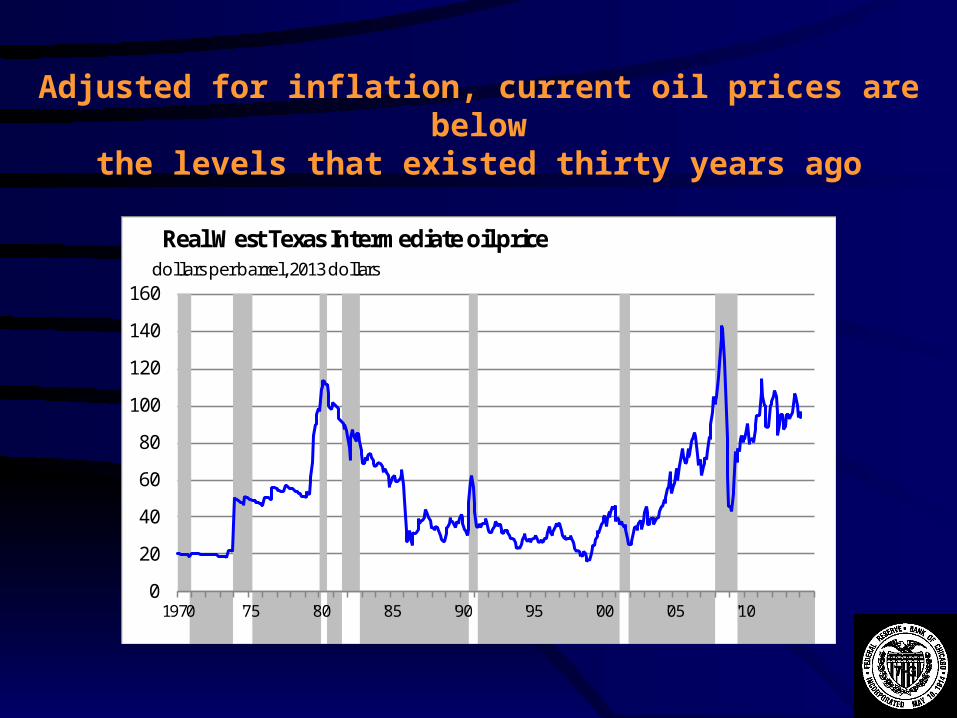
1970 '75 '80 '85 '90 '95 '00 '05 '10
Real West Texas Intermediate oil pricedol lars per barrel, 2013 dollars
Adjusted for inflation, current oil prices are belowthe levels that existed thirty years ago

Natural gas prices remain low
0
2
4
6
8
10
12
14
16
1994 '95 '96 '97 '98 '99 '00 '01 '02 '03 '04 '05 '06 '07 '08 '09 '10 '11 '12 '13 '14
Real natural gas pricedol lars per mmbtu, 2013 dollars

Between 1994 and 2005 the natural gas to oil price ratio averaged 13.4% - it fell to average 3.8% in 2013
0
5
10
15
20
25
30
35
1994 '95 '96 '97 '98 '99 '00 '01 '02 '03 '04 '05 '06 '07 '08 '09 '10 '11 '12 '13 '14
Natural gas price to oil price ratiopercent (dollars per mmbtu/dollars per barrel West Texas intermediate)

0
1
2
3
4
5
1990'91 '92 '93 '94 '95 '96 '97 '98 '99 '00 '01 '02 '03 '04 '05 '06 '07 '08 '09 '10 '11 '12 '13 '14
Personal consumption expenditure - less food and energy -chain price indexpercent change from a year earlier
Removing the volatile food and energy components from the PCE, “core” inflation remains low

-10
-8
-6
-4
-2
0
2
4
6
8
2000 '01 '02 '03 '04 '05 '06 '07 '08 '09 '10 '11 '12 '13 '14 '15
Consumer price indexpercent
Quarterly change (saar)
Percent change from a year earlier
Q4-2013
Blue Chip CPI Forecast
Actual Forecast 2013 2014 20151.2 1.9 2.1
Inflation is forecast to rise 1.9 percent in 2014and 2.1 percent in 2015

The FOMC anticipates that PCE inflationwill remain below two percent through 2016
-1
0
1
2
3
4
5
6
1990 '92 '94 '96 '98 '00 '02 '04 '06 '08 '10 '12 '14 '16
Personal consumption expenditure - chain price indexpercent change from a year earlier
FOMC
FOMC Central Tendency (December 2013)
2014 1.4 – 1.62015 1.5 – 2.02016 1.7 – 2.0
Longer run 2.0
0
1
2
3
4
5
1990 '92 '94 '96 '98 '00 '02 '04 '06 '08 '10 '12 '14 '16
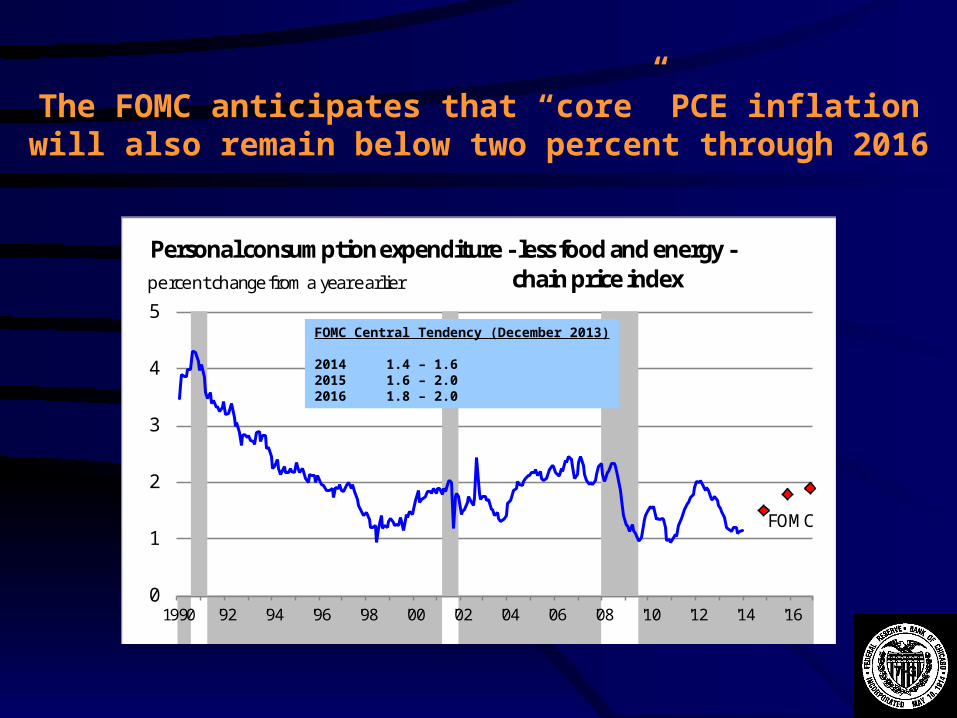
Personal consumption expenditure - less food and energy -chain price indexpercent change from a year earlier
FOMC
The FOMC anticipates that “core” PCE inflationwill also remain below two percent through 2016
FOMC Central Tendency (December 2013)
2014 1.4 – 1.62015 1.6 – 2.02016 1.8 – 2.0

-40
-30
-20
-10
0
10
20
30
40
1990'91 '92 '93 '94 '95 '96 '97 '98 '99 '00 '01 '02 '03 '04 '05 '06 '07 '08 '09 '10 '11 '12 '13 '14
Industrial production - manufacturingpercent
Monthly change (saar)
Percent change from a year earlier
Industrial output in manufacturing fell quite sharplyduring the recession, but has risen strongly over
the past fifty-four months, averaging 4.4% and hasrecovered 85.1% of the loss during the recession

While manufacturing jobs have been rising,they have only recovered 27.1% of the jobs
lost during the downturn
-25
-20
-15
-10
-5
0
5
10
15
1990'91 '92 '93 '94 '95 '96 '97 '98 '99 '00 '01 '02 '03 '04 '05 '06 '07 '08 '09 '10 '11 '12 '13 '14
Manufacturing employmentpercent
Monthly change (saar)
Percent change from a year earlier

Industrial production is forecast to riseat a pace slightly above trend in 2014 and 2015
-20
-15
-10
-5
0
5
10
2000 '01 '02 '03 '04 '05 '06 '07 '08 '09 '10 '11 '12 '13 '14 '15
Total industrial productionpercent
Quarterly change (saar)
Percent change from a year earlier
Q4-2013
Blue Chip IP Forecast
Actual Forecast 2013 2014 20153.6 3.4 3.5

After rising by 13% in 2012, vehicle sales rose 7% in 2013and are forecast to rise around 3% this year and next year
10
11
12
13
14
15
16
17
18
1980 '85 '90 '95 '00 '05 '10
Vehicle salesmil lions of units
Blue Chip Light-VehicleSales Forecast
Actual Forecast 2013 2014 201515.5 16.0 16.4

0
2
4
6
8
10
12
14
16
18
2007 2008 2009 2010 2011 2012 2013 2014
Credit spreads between Corporate High Yield and Corporate Aaapercent
Credit spread between Corporate High Yield securitiesand Corporate Aaa securities has remained low

0
1
2
3
4
5
6
7
8
9
1990'91 '92 '93 '94 '95 '96 '97 '98 '99 '00 '01 '02 '03 '04 '05 '06 '07 '08 '09 '10 '11 '12 '13 '14
Fed Funds ratepercent
Monetary policy has been very aggressive,keeping the Fed Funds near zero since December 2008

The Federal Funds Rate is anticipated to remainlow over the forecast horizon
0
1
2
3
4
5
6
7
8
9
1990 '91 '92 '93 '94 '95 '96 '97 '98 '99 '00 '01 '02 '03 '04 '05 '06 '07 '08 '09 '10 '11 '12 '13 '14 '15 '16
Target Federal Funds Ratepercent
FOMC
FOMC Midpoint Value(December 2013)

0
500
1,000
1,500
2,000
2,500
3,000
3,500
4,000
Assets of the Federal ReserveBi l lions of dollars
Term Auction CreditSecurities Held Outright
Central Bank Swaps
Maiden Lane II & III
Commercial Paper Facility
2007 2008 2009
Term Asset-Backed SecuritiesLoan Facility
AIG Support
Maiden Lane
2010 2011 2012 2013
The asset side of the Fed’s balance sheethas expanded in size and in composition

The money supply (M2) is nearly 4 timesbigger than the monetary base
0
2,000
4,000
6,000
8,000
10,000
12,000
2007 '08 '09 '10 '11 '12 '13 '14
Monetary expansion 2007-current periodbi l lions of dollars
monetary base
M2

50
100
150
200
250
300
350
400
450
1929 '30 '31 '32 '33 '34 '35 '36
Monetary expansion 2007-current periodindex: Jan 2007 = 100
monetary base
M2
CPI
50
100
150
200
250
300
350
400
450
1929 '30 '31 '32 '33 '34 '35 '36
Monetary expansion 1929-1936index: Jan 1929 = 100
monetary base
M2 CPI
The Fed’s expansion of the monetary base has allowed the money supply to continue rising,compared with what took place during the 1930s

• The outlook is for the U.S. economy to expand at a
pace somewhat above trend in 2014
Summary
• Employment is expected to rise moderately with the
unemployment rate edging lower
• Slackness in the economy will lead to a relatively
contained inflation rate
• Growth in manufacturing output should be somewhat above
trend this year

www.chicagofed.org www.federalreserve.gov