Economic Outlook - CFA Institute Event Presentations... · Economic Outlook C.F.A. West Michigan...
74
Paul Traub Economic Outlook C.F.A. West Michigan Society Luncheon Federal Reserve Bank of Chicago Detroit Branch May 22, 2012
Transcript of Economic Outlook - CFA Institute Event Presentations... · Economic Outlook C.F.A. West Michigan...

Paul Traub
Economic Outlook C.F.A. West Michigan Society Luncheon
Federal Reserve Bank of Chicago
Detroit Branch May 22, 2012
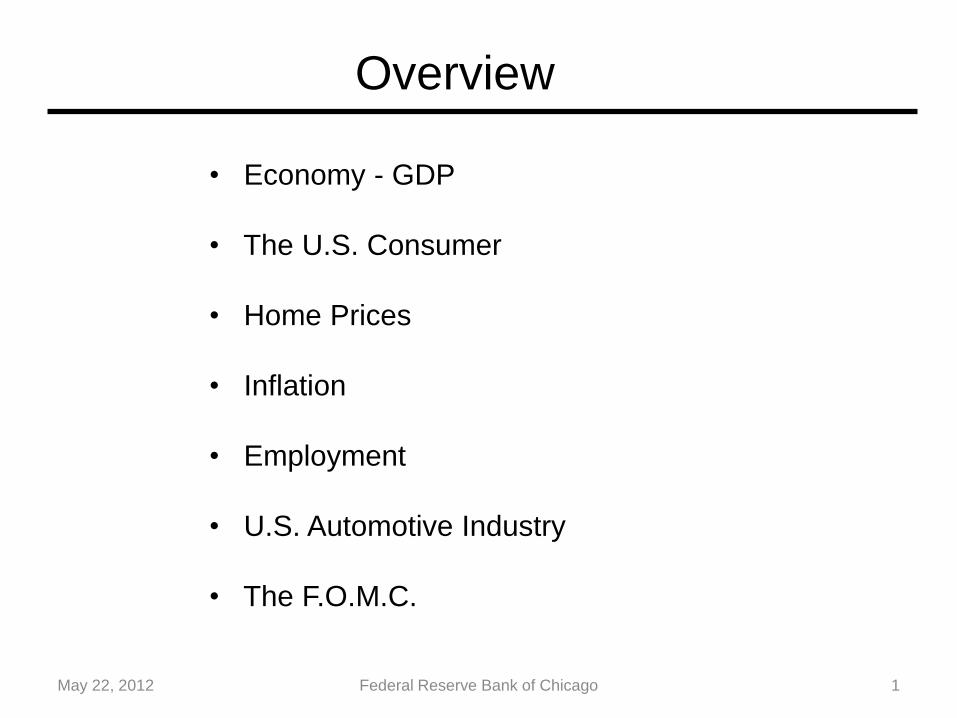
Overview
May 22, 2012 1 Federal Reserve Bank of Chicago
• Economy - GDP
• The U.S. Consumer
• Home Prices
• Inflation
• Employment
• U.S. Automotive Industry
• The F.O.M.C.

May 22, 2012 2 Federal Reserve Bank of Chicago
Source: IMF World Economic Outlook – April, 2012
Global Economic Data Real GDP – Annual Percent Change
2010 2011 2012 2013 2012 2013
World Output 5.3 3.9 3.5 4.1 -1.0 -0.5
Advanced Economies 3.2 1.6 1.4 2.0 -1.2 -0.5
U.S. 3.0 1.7 2.1 2.4 -0.8 -0.4
European Union 1.9 1.4 0.0 1.3 -2.0 -0.9
Japan 4.4 -0.7 2.0 1.7 0.0 0.0
United Kingdom 2.1 0.7 0.8 2.0 -1.5 -0.5
Canada 3.2 2.5 2.1 2.2 -0.6 -0.3
Emerging Economies 7.5 6.2 5.7 6.0 -0.8 -0.5
Russia 4.3 4.3 4.0 3.9 -0.5 -0.4
China 10.4 9.2 8.2 8.8 -1.3 -0.7
India 10.6 7.2 6.9 7.3 -1.0 -0.9
Brazil 7.5 2.7 3.0 4.2 -1.1 0.0
Mexico 5.5 4.0 3.6 3.7 -0.4 0.3
Year over Year Difference from April '11
April '12 Projections WEO Projections

Billions Chained $2005, % Change Q/Q at SAAR
-10.0
-5.0
0.0
5.0
10.0
15.0
20.0
11,000
11,500
12,000
12,500
13,000
13,500
14,000
'00 '01 '02 '03 '04 '05 '06 '07 '08 '09 '10 '11 '12
$ Billions
Q4 ‘07 $13,326
Q1 ‘12 $13,502
Q2 ‘09 $12,663
Declined $685B (Peak to Trough, -5.1%)
May 22, 2012 3 Federal Reserve Bank of Chicago
Q1 ‘12 2.2%
U.S. Real GDP
Q4 ‘08 -8.9%
Percent
May 22, 2012 4 Federal Reserve Bank of Chicago
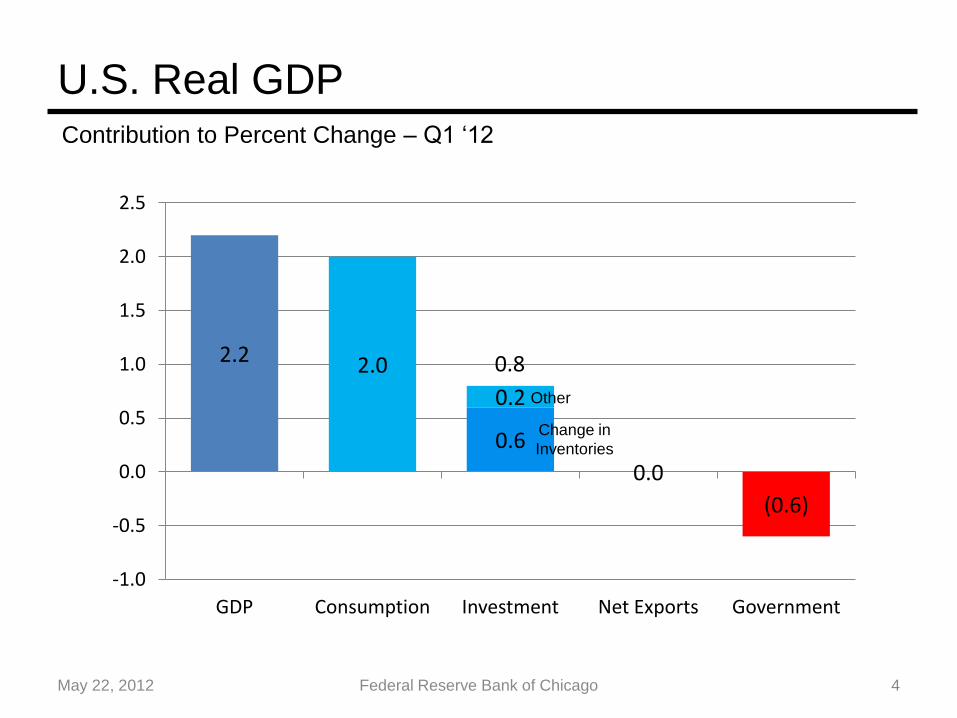
U.S. Real GDP Contribution to Percent Change – Q1 ‘12
0.6
2.2 2.0
0.2
0.0
(0.6)
-1.0
-0.5
0.0
0.5
1.0
1.5
2.0
2.5
GDP Consumption Investment Net Exports Government
0.8
Change in
Inventories
Other

-6.0
-3.0
0.0
3.0
6.0
9.0
12.0
7,000
7,500
8,000
8,500
9,000
9,500
10,000
'00 '01 '02 '03 '04 '05 '06 '07 '08 '09 '10 '11 '12
$ Billions
May 22, 2012 5 Federal Reserve Bank of Chicago
Personal Consumption Private Domestic Investment
-8.0
-4.0
0.0
4.0
8.0
12.0
16.0
2,000
2,100
2,200
2,300
2,400
2,500
2,600
'00 '01 '02 '03 '04 '05 '06 '07 '08 '09 '10 '11 '12
$ Billions Government Consumption
Q1 ‘12 9,550
Q1 ‘12 2,462
U.S. Real GDP by Sector
2.9%
800
1,100
1,400
1,700
2,000
2,300
2,600
'00 '01 '02 '03 '04 '05 '06 '07 '08 '09 '10 '11 '12
$ Billions Imports and Exports
Q1 ‘12 2,231
Q1 ‘12 1,821
Imports
Exports
-3.0%
Percent
-60.0
-40.0
-20.0
0.0
20.0
40.0
60.0
1,200
1,400
1,600
1,800
2,000
2,200
2,400
'00 '01 '02 '03 '04 '05 '06 '07 '08 '09 '10 '11 '12
$ Billions
Q1 ‘12 1,903
6.0%
Percent Q1 ‘06 2,266
Percent
Billions Chained $2005, % Change Q/Q at SAAR
Declined $ 869 Billion Declined $ 314 Billion

Billions Chained $2005, % Change Q/Q at SAAR
-60.0
-40.0
-20.0
0.0
20.0
40.0
60.0
80.0
200
300
400
500
600
700
800
900
'00 '01 '02 '03 '04 '05 '06 '07 '08 '09 '10 '11 '12
$ Billions
Q3 ‘05 $783.3
Q1 ‘12 $349.4
Percent Change (Peak to Trough) -59.0%
May 22, 2012 6 Federal Reserve Bank of Chicago
Q1 ‘12 19.1%
U.S. Gross Private Domestic Investment - Residential
Q1 ‘09 -35.4%
Percent
May 22, 2012 7 Federal Reserve Bank of Chicago
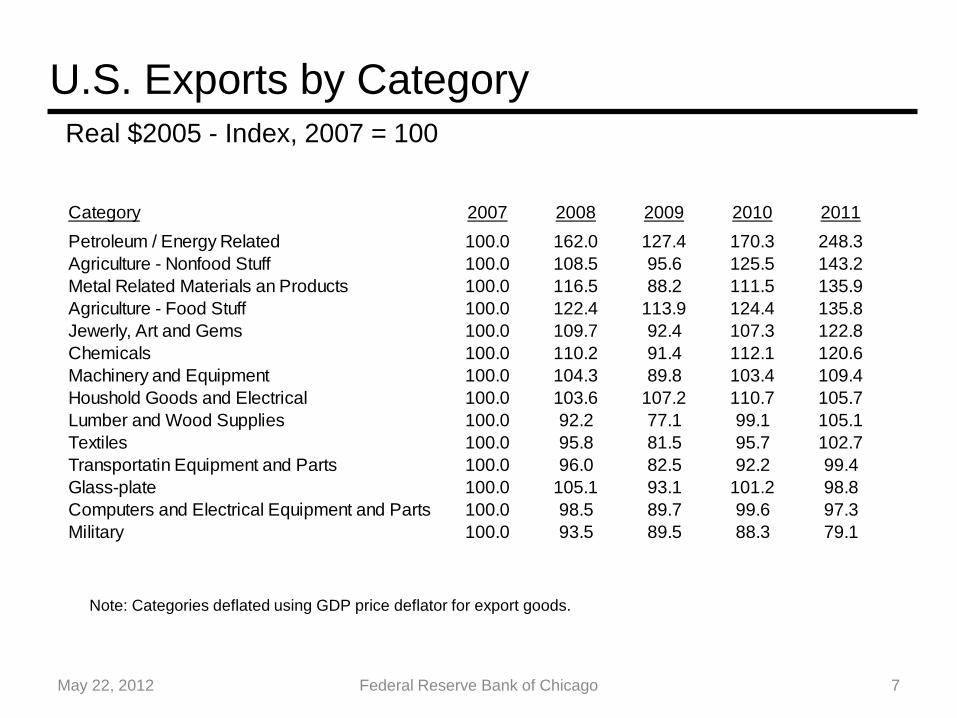
Category 2007 2008 2009 2010 2011
Petroleum / Energy Related 100.0 162.0 127.4 170.3 248.3
Agriculture - Nonfood Stuff 100.0 108.5 95.6 125.5 143.2
Metal Related Materials an Products 100.0 116.5 88.2 111.5 135.9
Agriculture - Food Stuff 100.0 122.4 113.9 124.4 135.8
Jewerly, Art and Gems 100.0 109.7 92.4 107.3 122.8
Chemicals 100.0 110.2 91.4 112.1 120.6
Machinery and Equipment 100.0 104.3 89.8 103.4 109.4
Houshold Goods and Electrical 100.0 103.6 107.2 110.7 105.7
Lumber and Wood Supplies 100.0 92.2 77.1 99.1 105.1
Textiles 100.0 95.8 81.5 95.7 102.7
Transportatin Equipment and Parts 100.0 96.0 82.5 92.2 99.4
Glass-plate 100.0 105.1 93.1 101.2 98.8
Computers and Electrical Equipment and Parts 100.0 98.5 89.7 99.6 97.3
Military 100.0 93.5 89.5 88.3 79.1
U.S. Exports by Category Real $2005 - Index, 2007 = 100
Note: Categories deflated using GDP price deflator for export goods.

May 22, 2012 8 Federal Reserve Bank of Chicago
1.0
1.5
2.0
2.5
3.0
3.5
Mar '11
Apr May Jun Jul Aug Sep Oct Nov Dec Jan '12 Feb Mar Apr May
2012 2013
Percent Change Yr / Yr
Consensus of the Blue Chip by Month
U.S. Real GDP
2.5
2.3
2.0
3.3

May 22, 2012 9 Federal Reserve Bank of Chicago
Actual / Forecast GDP and Potential GDP
Closing the Output Gap
10,500
11,500
12,500
13,500
14,500
15,500
'00 '01 '02 '03 '04 '05 '06 '07 '08 '09 '10 '11 '12 '13 '14 '15
Potential Actual 2% Growth
3% Growth 4% Growth 5% Growth
$ Billions
Q1 ‘15
Q1 ‘14
Q1 ‘20

The U.S. Consumer
May 22, 2012 Federal Reserve Bank of Chicago 10
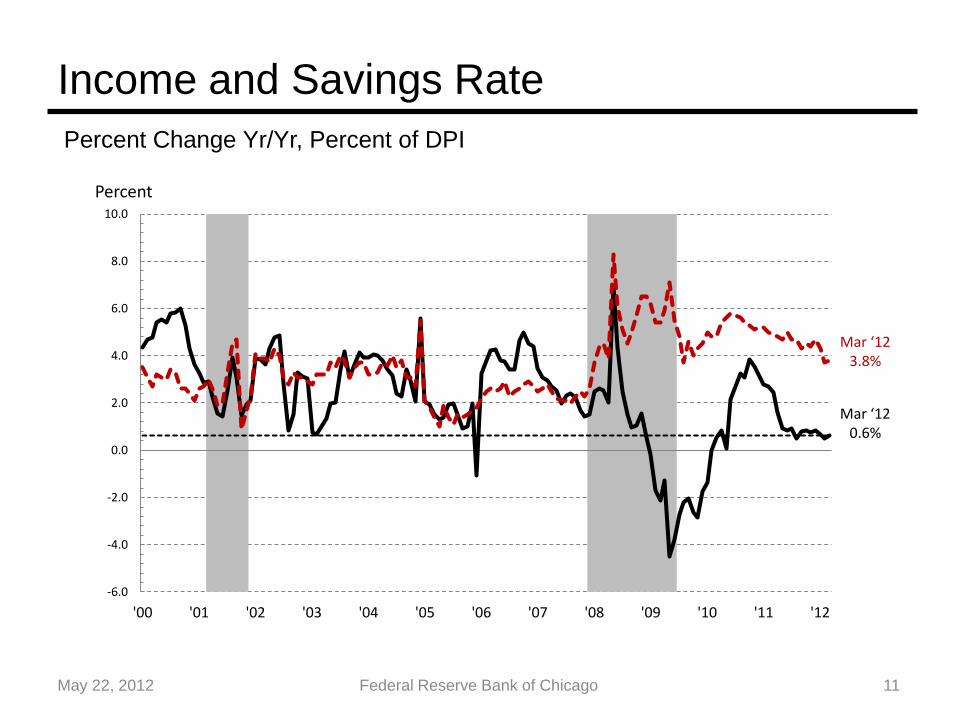
Income and Savings Rate
-6.0
-4.0
-2.0
0.0
2.0
4.0
6.0
8.0
10.0
'00 '01 '02 '03 '04 '05 '06 '07 '08 '09 '10 '11 '12
Mar ‘12 0.6%
11 Federal Reserve Bank of Chicago
Percent
Percent Change Yr/Yr, Percent of DPI
May 22, 2012
Mar ‘12 3.8%

12.0
14.0
16.0
18.0
20.0
22.0
24.0
26.0
'80 '82 '84 '86 '88 '90 '92 '94 '96 '98 '00 '02 '04 '06 '08 '10 '12
Consumer Credit
12 Federal Reserve Bank of Chicago
Apr ‘12 21.5
Percent
Mar ‘03 24.1
May 22, 2012
Percent of Disposable Personal Income
Note: Includes Revolving and Nonrevolving Credit.
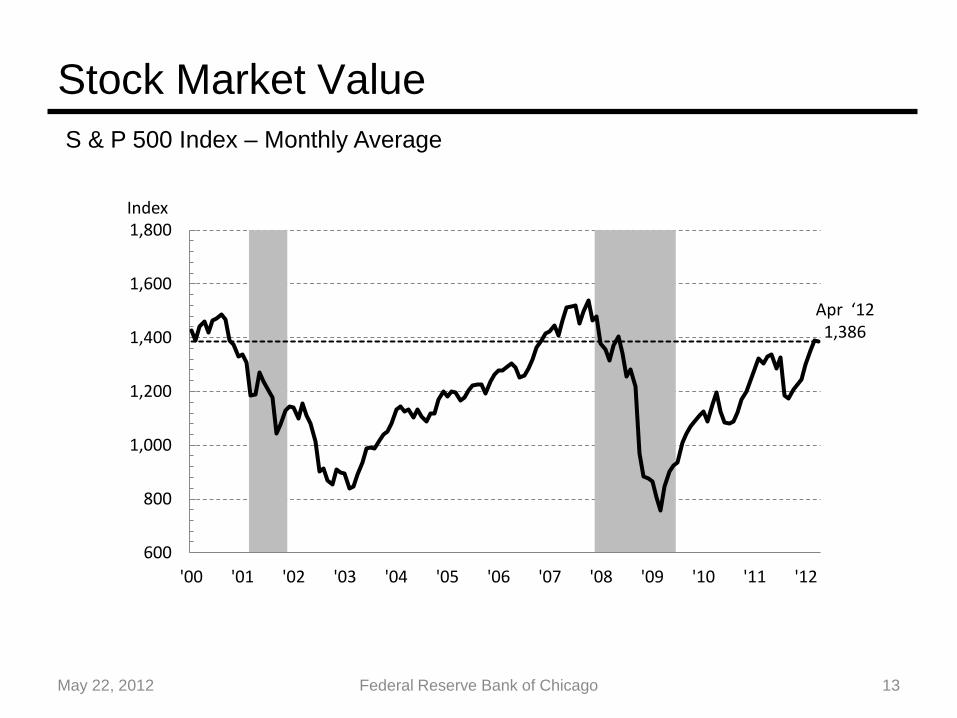
Stock Market Value
13 Federal Reserve Bank of Chicago May 22, 2012
600
800
1,000
1,200
1,400
1,600
1,800
'00 '01 '02 '03 '04 '05 '06 '07 '08 '09 '10 '11 '12
Index
S & P 500 Index – Monthly Average
Apr ‘12 1,386
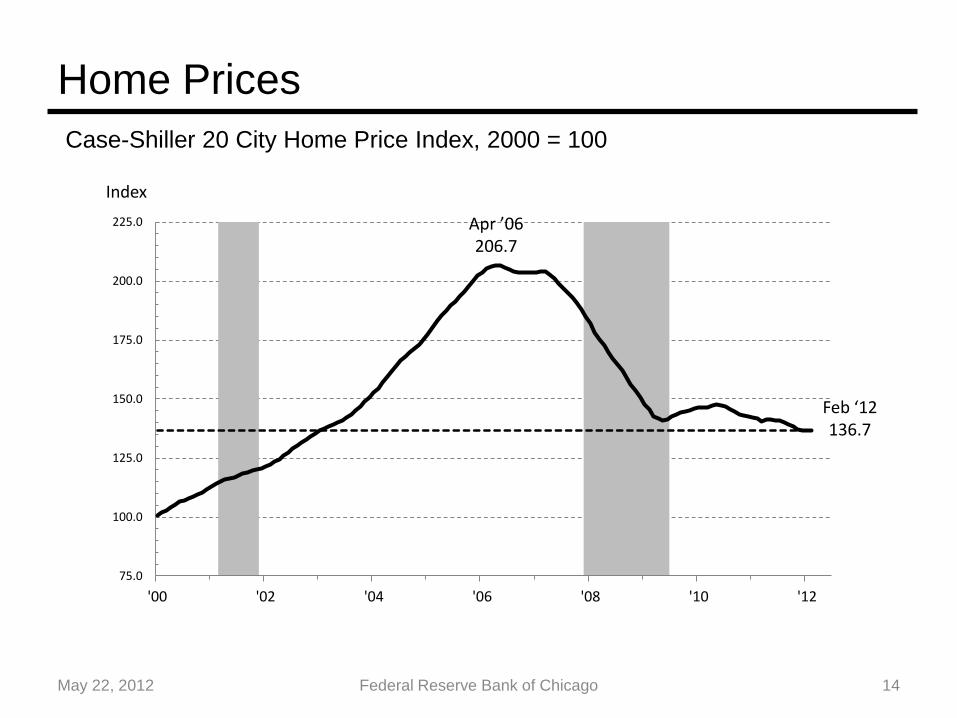
Home Prices
14 Federal Reserve Bank of Chicago May 22, 2012
Case-Shiller 20 City Home Price Index, 2000 = 100
Index
75.0
100.0
125.0
150.0
175.0
200.0
225.0
'00 '02 '04 '06 '08 '10 '12
Feb ‘12 136.7
Apr ’06 206.7

May 22, 2012 15 Federal Reserve Bank of Chicago
Household Net Worth
0
10,000
20,000
30,000
40,000
50,000
60,000
70,000
80,000
'80 '82 '84 '86 '88 '90 '92 '94 '96 '98 '00 '02 '04 '06 '08 '10
Home Equity Financial and Other
-$8.4
Trillion
Billions of Dollars, Q1 ‘80 to Q4 ‘11
Total Decline
Q4 ‘07 – Q1 ‘09 -$16.4 Trillion

Consumer Sentiment
16 Federal Reserve Bank of Chicago May 22, 2012
University of Michigan
Index
20
40
60
80
100
120
140
'82 '86 '90 '94 '98 '02 '06 '10
Apr ‘12 76.4
January ‘00 112.0

Home Prices
May 22, 2012 Federal Reserve Bank of Chicago 17

Home Prices
18 Federal Reserve Bank of Chicago May 22, 2012
Home Price Index - Q1, 2000 = 100
Index
75.0
100.0
125.0
150.0
175.0
200.0
'00 '01 '02 '03 '04 '05 '06 '07 '08 '09 '10 '11 '12
U.S. Case-Shiller MI FHFA U.S. FHFA
Q4 ‘11 140.1
Q1 ’06 190.9
Q1 ’07 165.7
Q3 ’05 126.7 125.7
96.3
Source: S&P Case-Shiller U.S. National Index, FHFA All Transactions Price Index U.S. & Michigan

Total Homeowner Real Estate Equity
Homeowner Equity
$Trillions
0.0
2.5
5.0
7.5
10.0
12.5
15.0
'52 '55 '58 '61 '64 '67 '70 '73 '76 '79 '82 '85 '88 '91 '94 '97 '00 '03 '06 '09
May 22, 2012 19 Federal Reserve Bank of
Chicago
Q1 ‘06 $13.5
Q4 ‘11 $6.1

Total Mortgage Liability
Household and Nonprofit Mortgage Liability
$Trillions
0.0
2.0
4.0
6.0
8.0
10.0
12.0
'52 '55 '58 '61 '64 '67 '70 '73 '76 '79 '82 '85 '88 '91 '94 '97 '00 '03 '06 '09
May 22, 2012 20 Federal Reserve Bank of
Chicago
Q1 ‘08 $10.6
Q4 ‘11 $9.8

Total Homeowner Real Estate Value
Homeowner Equity + Home Mortgages
$Trillions
0.0
5.0
10.0
15.0
20.0
25.0
'52 '55 '58 '61 '64 '67 '70 '73 '76 '79 '82 '85 '88 '91 '94 '97 '00 '03 '06 '09
May 22, 2012 21 Federal Reserve Bank of
Chicago
Q4 ‘06 $22.7
Q4 ‘11 $15.9

Value of Structures
May 22, 2012 Federal Reserve Bank of Chicago 22
Household structures replacement cost at current cost basis
$Trillions
0.0
2.0
4.0
6.0
8.0
10.0
12.0
14.0
16.0
'52 '55 '58 '61 '64 '67 '70 '73 '76 '79 '82 '85 '88 '91 '94 '97 '00 '03 '06 '09
Q4 ‘11 $14.1
Q4 ‘07 $14.5

Home Ownership Premium
Total Homeowner Value – Value of Structures
$Trillions
0.0
1.0
2.0
3.0
4.0
5.0
6.0
7.0
8.0
9.0
10.0
'52 '55 '58 '61 '64 '67 '70 '73 '76 '79 '82 '85 '88 '91 '94 '97 '00 '03 '06 '09
May 22, 2012 23 Federal Reserve Bank of
Chicago
Q4 ‘11 $1.8
Q1 ‘06 $9.1

Home Ownership Premium Ratio
Home Ownership Premium / Total Real Estate Value
Percent
0.0
10.0
20.0
30.0
40.0
50.0
'52 '55 '58 '61 '64 '67 '70 '73 '76 '79 '82 '85 '88 '91 '94 '97 '00 '03 '06 '09
May 22, 2012 24 Federal Reserve Bank of
Chicago
Q4 ‘11 11.5
Q1 ‘06 40.0

Home Ownership Premium Ratio
Home Ownership Premium / Total Real Estate Value
Percent
0.0
10.0
20.0
30.0
40.0
50.0
'52 '55 '58 '61 '64 '67 '70 '73 '76 '79 '82 '85 '88 '91 '94 '97 '00 '03 '06 '09
May 22, 2012 25 Federal Reserve Bank of
Chicago
Q4 ‘11 11.5
Q1 ‘06 40.0

Residential Construction
New Privately Owned Housing Units Under Construction
Thousands
0
200
400
600
800
1,000
1,200
1,400
1,600
'00 '01 '02 '03 '04 '05 '06 '07 '08 '09 '10 '11 '12
May 22, 2012 26 Federal Reserve Bank of
Chicago
Apr ‘12 457
Jan ‘06 1424

Inflation
May 22, 2012 Federal Reserve Bank of Chicago 27

Inflation – Price Indexes for PCE
28 Federal Reserve Bank of Chicago May 22, 2012
-4.0
-2.0
0.0
2.0
4.0
6.0
8.0
10.0
12.0
14.0
'80 '85 '90 '95 '00 '05 '10
Percent Change Yr / Yr
PCE - All Items Mar ‘12
2.3%
PCE – Core Mar ’12
2.0%
Percent

May 22, 2012 29 Federal Reserve Bank of Chicago
Inflation Expectation & CPI
Source: U of M , Expected Change in Prices During Next 12 Months and BLS
0.0
1.0
2.0
3.0
4.0
5.0
6.0
Jan '10 Jan '11 Jan '12
U of M Survey CPI - All Items
Percent Change Yr/Yr
U of M Survey Data
Current Expectation versus Actual
Percent
'During the next 12 months, do you think that prices in general will go up, or go down, or
stay where they are now?' and 'By what percent do you expect prices to go up, on the
average, during the next 12 months?'
Apr ‘12
3.8
Apr ‘12
2.3

Producer Price Index – Crude Materials
30 Federal Reserve Bank of Chicago May 22, 2012
-50.0
-40.0
-30.0
-20.0
-10.0
0.0
10.0
20.0
30.0
40.0
50.0
'80 '85 '90 '95 '00 '05 '10
Percent Change Yr / Yr
Apr ‘12 -7.8%
Percent

Producer Price Index – Intermediate Goods
31 Federal Reserve Bank of Chicago May 22, 2012
-18.0
-14.0
-10.0
-6.0
-2.0
2.0
6.0
10.0
14.0
18.0
'80 '85 '90 '95 '00 '05 '10
Percent Change Yr / Yr
Apr ‘12 1.1%
Percent

Producer Price Index – Finished Goods
32 Federal Reserve Bank of Chicago May 22, 2012
-7.0
-5.0
-3.0
-1.0
1.0
3.0
5.0
7.0
9.0
11.0
13.0
15.0
'80 '85 '90 '95 '00 '05 '10
Percent Change Yr / Yr
PPI – Finished Goods Apr ‘12
1.9%
PPI – Finished Goods - Less
Food & Energy Apr ’12
2.8%
Percent

Productivity & Utilization
33 Federal Reserve Bank of Chicago May 22, 2012
Total Industrial Utilization and Output Per Person – Mfg.
-10.0
-5.0
0.0
5.0
10.0
15.0
60
65
70
75
80
85
'00 '01 '02 '03 '04 '05 '06 '07 '08 '09 '10 '11 '12
Productivity Capacity Utilization
Percent Percent Chg. Y/Y
34 Federal Reserve Bank of Chicago
0.0
25.0
50.0
75.0
100.0
125.0
150.0
175.0
200.0
'00 '01 '02 '03 '04 '05 '06 '07 '08 '09 '10 '11 '12
Index
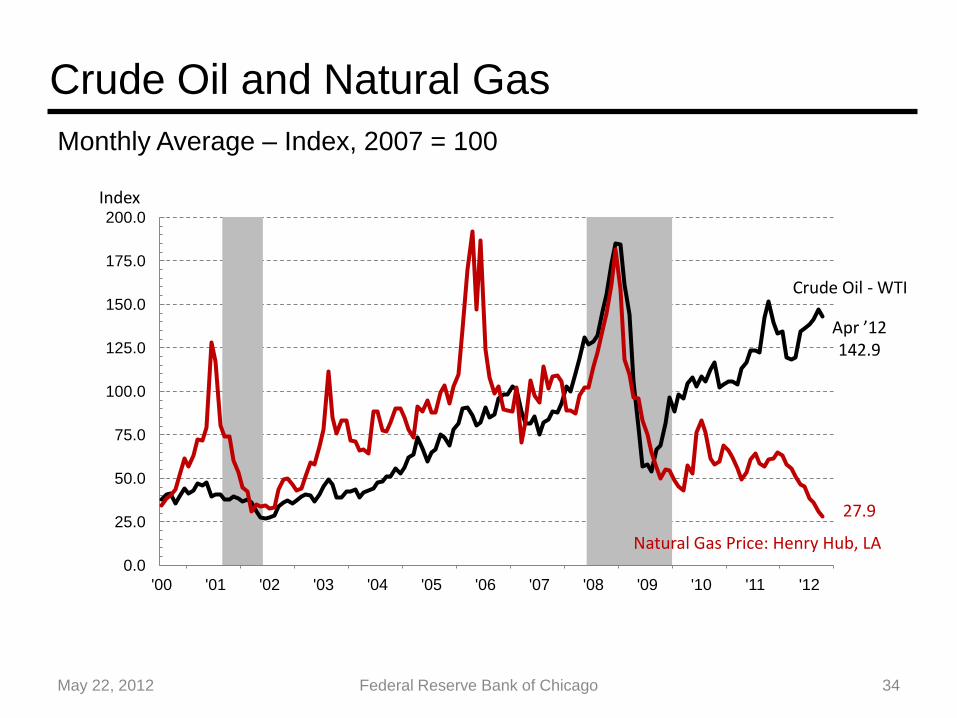
Monthly Average – Index, 2007 = 100
Apr ’12 142.9
May 22, 2012
Crude Oil and Natural Gas
27.9
Natural Gas Price: Henry Hub, LA
Crude Oil - WTI
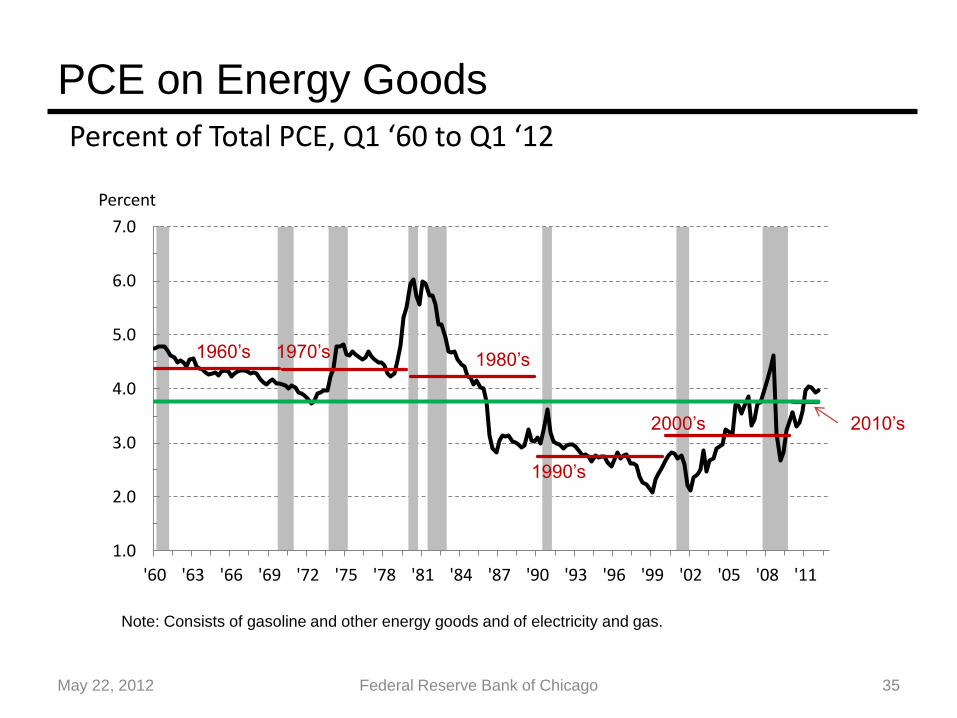
PCE on Energy Goods
35 Federal Reserve Bank of Chicago May 22, 2012
Percent of Total PCE, Q1 ‘60 to Q1 ‘12
Percent
1.0
2.0
3.0
4.0
5.0
6.0
7.0
'60 '63 '66 '69 '72 '75 '78 '81 '84 '87 '90 '93 '96 '99 '02 '05 '08 '11
Note: Consists of gasoline and other energy goods and of electricity and gas.
1960’s 1970’s 1980’s
1990’s
2000’s 2010’s

Inflation – Consumer Price Index
36 Federal Reserve Bank of Chicago May 22, 2012
-3.0
-2.0
-1.0
0.0
1.0
2.0
3.0
4.0
5.0
6.0
'00 '01 '02 '03 '04 '05 '06 '07 '08 '09 '10 '11 '12
Percent Change Yr / Yr
CPI - All Items Apr ‘12
2.3%
CPI – Core Apr ’12
2.3%
Percent

Employment
May 22, 2012 Federal Reserve Bank of Chicago 37

May 22, 2012 38 Federal Reserve Bank of Chicago
Employment Gains / Losses Nonfarm Payroll – In Thousands
(1,000.0)
(800.0)
(600.0)
(400.0)
(200.0)
0.0
200.0
400.0
600.0
'07 '08 '09 '10 '11 '12
Apr ‘12 115
Jan ‘09 818
-8,879
Thousands
+ 3,745 = -5,034
May 22, 2012 39 Federal Reserve Bank of Chicago
0.0
100.0
200.0
300.0
400.0
500.0
600.0
700.0
800.0
'82 '86 '90 '94 '98 '02 '06 '10
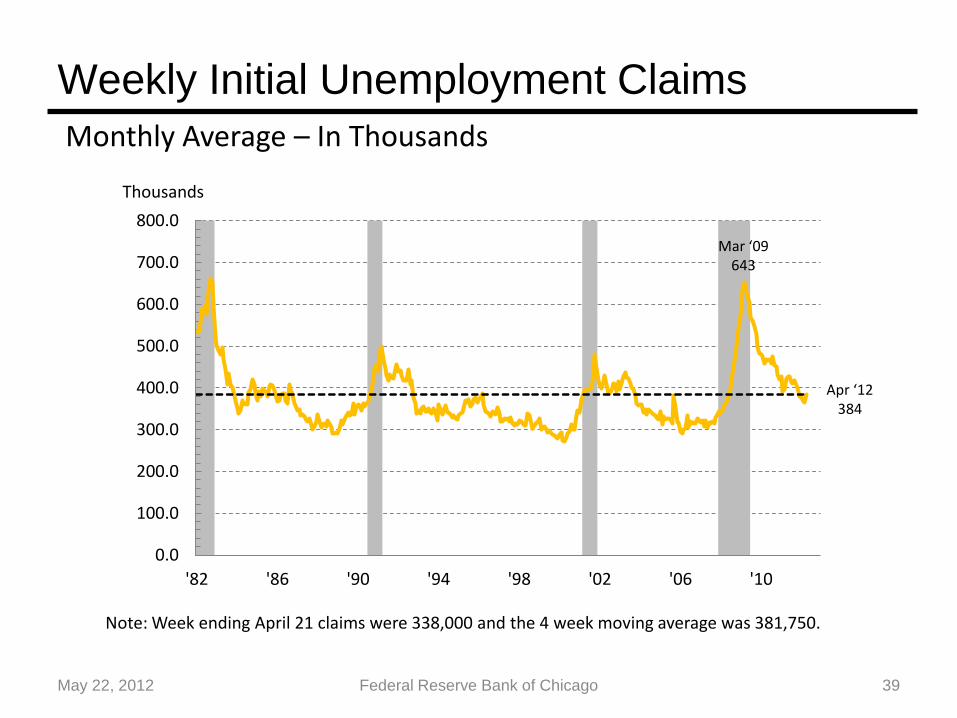
Apr ‘12 384
Mar ‘09 643
Weekly Initial Unemployment Claims
Monthly Average – In Thousands
Thousands
Note: Week ending April 21 claims were 338,000 and the 4 week moving average was 381,750.
May 22, 2012 40
Federal Reserve Bank of Chicago
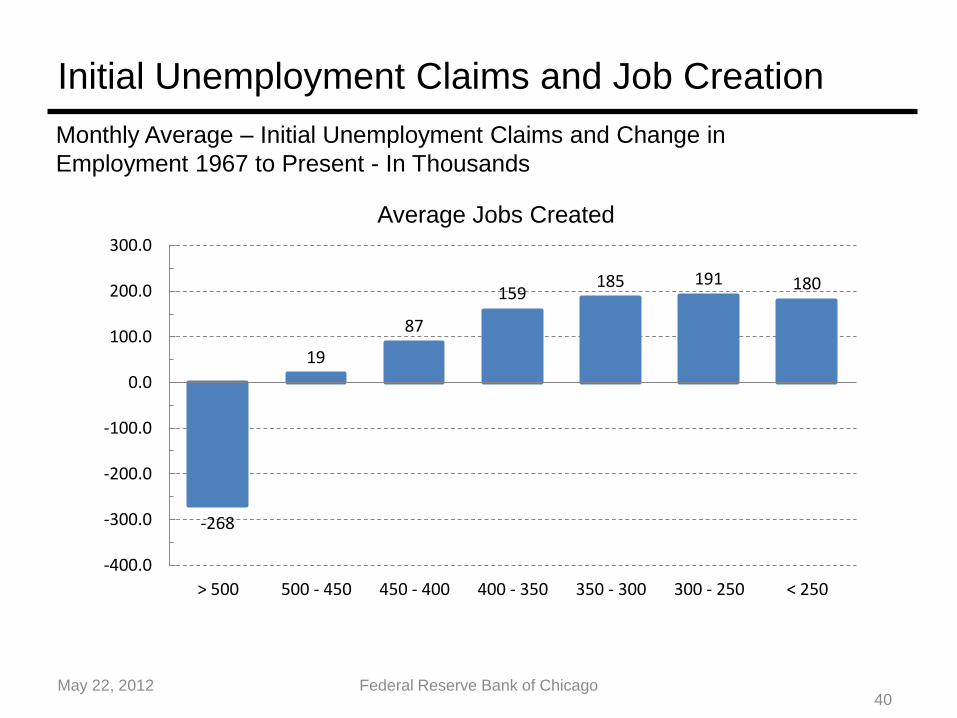
Initial Unemployment Claims and Job Creation
Monthly Average – Initial Unemployment Claims and Change in
Employment 1967 to Present - In Thousands
-268
19
87
159 185 191 180
-400.0
-300.0
-200.0
-100.0
0.0
100.0
200.0
300.0
> 500 500 - 450 450 - 400 400 - 350 350 - 300 300 - 250 < 250
Average Jobs Created

41 Federal Reserve Bank of Chicago
62.0
63.0
64.0
65.0
66.0
67.0
68.0
0.0
2.0
4.0
6.0
8.0
10.0
12.0
'90 '92 '94 '96 '98 '00 '02 '04 '06 '08 '10 '12
U.S. Participation Rate
Percent
Apr ‘12
8.1%
May 22, 2012
Unemployment & Participation Rates
Apr ‘12
63.6
United States - SA

May 22, 2012 42 Federal Reserve Bank of Chicago
Participation Rate by Age Bracket
80.0
85.0
90.0
95.0
100.0
105.0
110.0
'07 '08 '09 '10 '11 '12
Total 16-24 yrs. 25-34 yrs. 35-44 yrs. 45-54 yrs. 55+ yrs.
Total
16 - 24 yrs.
55+ yrs.
Percent
Index, January 2007 = 100

May 22, 2012 43 Federal Reserve Bank of Chicago
Expected Age at Retirement
Percent Age 66 or Older + Never Retire
0.0
5.0
10.0
15.0
20.0
25.0
30.0
35.0
40.0
45.0
50.0
'96 '97 '98 '99 '00 '01 '02 '03 '04 '05 '06 '07 '08 '09 '10 '11
Age 66 or Older Never Retire
19%
4%
36%
8%
Source: Employment Benefit Research Institute, The 2011 Retirement Confidence Survey
Percent
45%
13%

Job Creation and the Unemployment Rate
44 Federal Reserve Bank of Chicago May 22, 2012
135.0
140.0
145.0
150.0
155.0
160.0
'00 '02 '04 '06 '08 '10 '12 '14 '16 '18
5.5%
6.5%
7.5%
8.5% 9.5%
10.5%
Unem
plo
ym
ent R
ate
Millions
400K / Mo. 300K / Mo. 200K / Mo.
Total Household Employment
Sep ‘13
Sep ‘14
Nov ‘20
2012 2013 2014 2015 2016 2017 2018
200K Jobs Per Month 7.9 7.5 7.2 6.9 6.6 6.3 6.1
300K Jobs Per Month 7.4 6.3 5.5 5.5 5.5 5.5 5.5
400K Jobs Per Month 6.9 5.5 5.5 5.5 5.5 5.5 5.5
Year End Unemployment Rate at Different Levels of Job Growth

Automotive
May 22, 2012 Federal Reserve Bank of Chicago 45

May 22, 2012 46 Federal Reserve Bank of Chicago
8.0
10.0
12.0
14.0
16.0
18.0
1995 1997 1999 2001 2003 2005 2007 2009 2011
17.3
10.4
Source: Ward’s Automotive
12.7
U.S. Light Vehicle Sales
16.1
Millions of Units

May 22, 2012 47 Federal Reserve Bank of Chicago
6.0
8.0
10.0
12.0
14.0
16.0
18.0
Jan-06 Jul-06 Jan-07 Jul-07 Jan-08 Jul-08 Jan-09 Jul-09 Jan-10 Jul-10 Jan-11 Jul-11 Jan-12
Aug ’09
14.2
Apr ‘12
14.4
Apr ’09
9.4
Seasonally Adjusted Annual Rate
Millions
U.S. Light Vehicle Sales
12 MMA
13.2
Cash for Clunkers

48 Federal Reserve Bank of Chicago
0.00
0.50
1.00
1.50
2.00
2.50
3.00
3.50
4.00
4.50
5.00
'00 '01 '02 '03 '04 '05 '06 '07 '08 '09 '10 '11 '12
$/Gallon
Monthly Average – All Grades, All Formulations
Apr ’12 $3.90
May 22, 2012
Retail Gasoline Price

May 22, 2012 49 Federal Reserve Bank of Chicago
Gasoline Price Volatility
Monthly Seasonal Factors
0.850
0.875
0.900
0.925
0.950
0.975
1.000
1.025
1.050
1.075
1.100
1.125
1.150
'78 '80 '82 '84 '86 '88 '90 '92 '94 '96 '98 '00 '02 '04 '06 '08 '10
Peak to Trough – 20% swing in gasoline price.

May 22, 2012 50 Federal Reserve Bank of Chicago
Average Fuel Efficiency
U.S. Light Vehicles – Sales Weighted MPG
20.0
22.5
25.0
27.5
30.0
32.5
35.0
'00 '01 '02 '03 '04 '05 '06 '07 '08 '09 '10 '11
Car Light Truck Total
28.5
33.8
Improvement ‘00 to ’11 18.6% 15.0% 16.1%
21.3
24.5
24.9
28.9
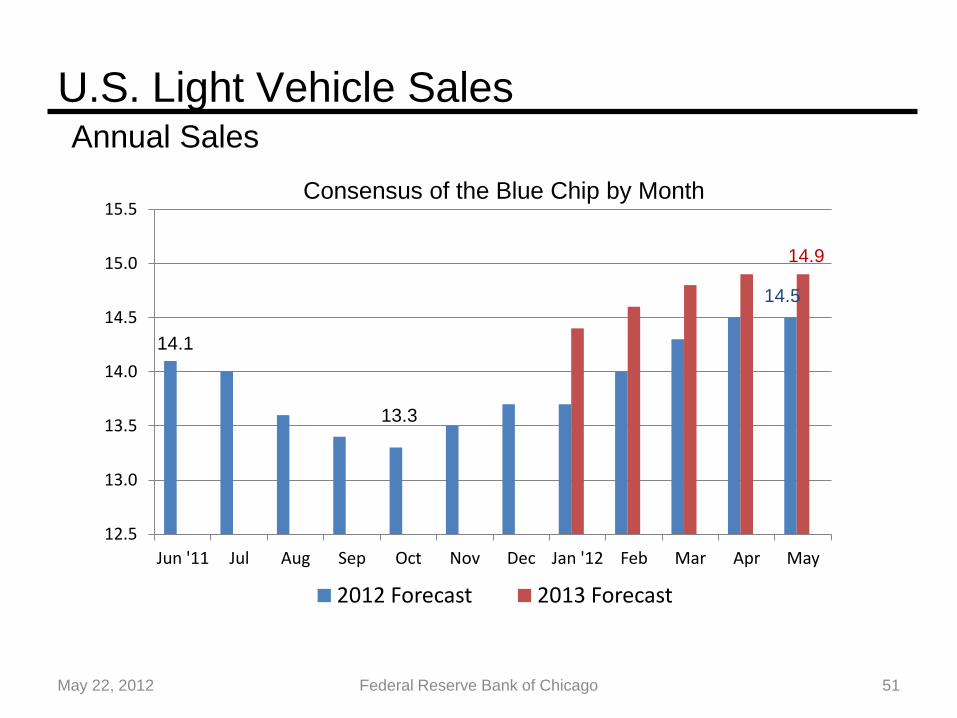
May 22, 2012 51 Federal Reserve Bank of Chicago
12.5
13.0
13.5
14.0
14.5
15.0
15.5
Jun '11 Jul Aug Sep Oct Nov Dec Jan '12 Feb Mar Apr May
2012 Forecast 2013 Forecast
U.S. Light Vehicle Sales Annual Sales
Consensus of the Blue Chip by Month
13.3
14.1
14.5
14.9
May 22, 2012 52 Federal Reserve Bank of Chicago
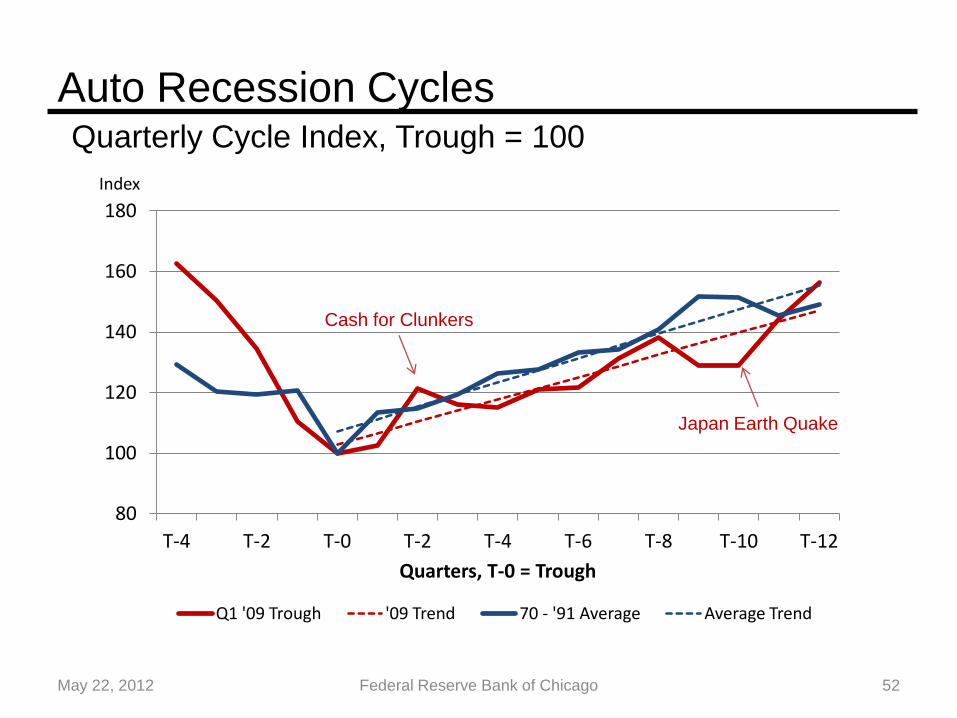
Auto Recession Cycles
80
100
120
140
160
180
T-4 T-2 T-0 T-2 T-4 T-6 T-8 T-10 T-12
Quarters, T-0 = Trough
Q1 '09 Trough '09 Trend 70 - '91 Average Average Trend
Quarterly Cycle Index, Trough = 100
Japan Earth Quake
Cash for Clunkers
Index

May 22, 2012 53 Federal Reserve Bank of Chicago
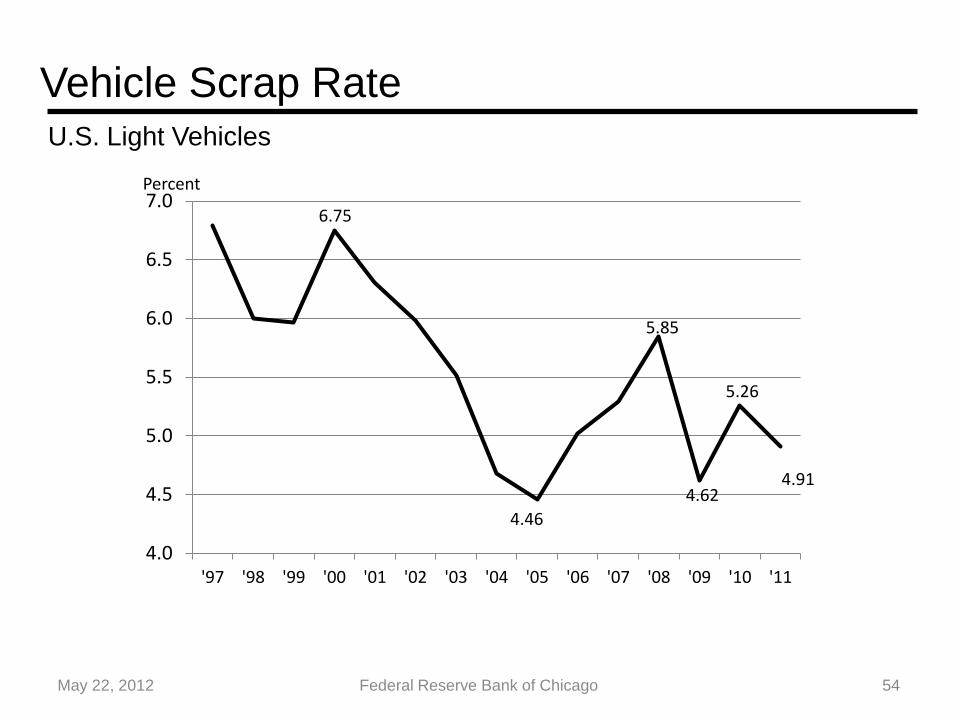
Three Determinants of a stock adjustment model
1. Replacement of scrapped vehicles
• Scrap Rates
2. Change in population
• Employment
3. Change in demand • Vehicles per Person
• Trade-in Cycles
• Miles Driven
Determinates of Trend Vehicle Demand
4.0
4.5
5.0
5.5
6.0
6.5
7.0
'97 '98 '99 '00 '01 '02 '03 '04 '05 '06 '07 '08 '09 '10 '11
May 22, 2012 54 Federal Reserve Bank of Chicago
U.S. Light Vehicles
Vehicle Scrap Rate
Percent
6.75
5.85
4.91 4.62
5.26
4.46
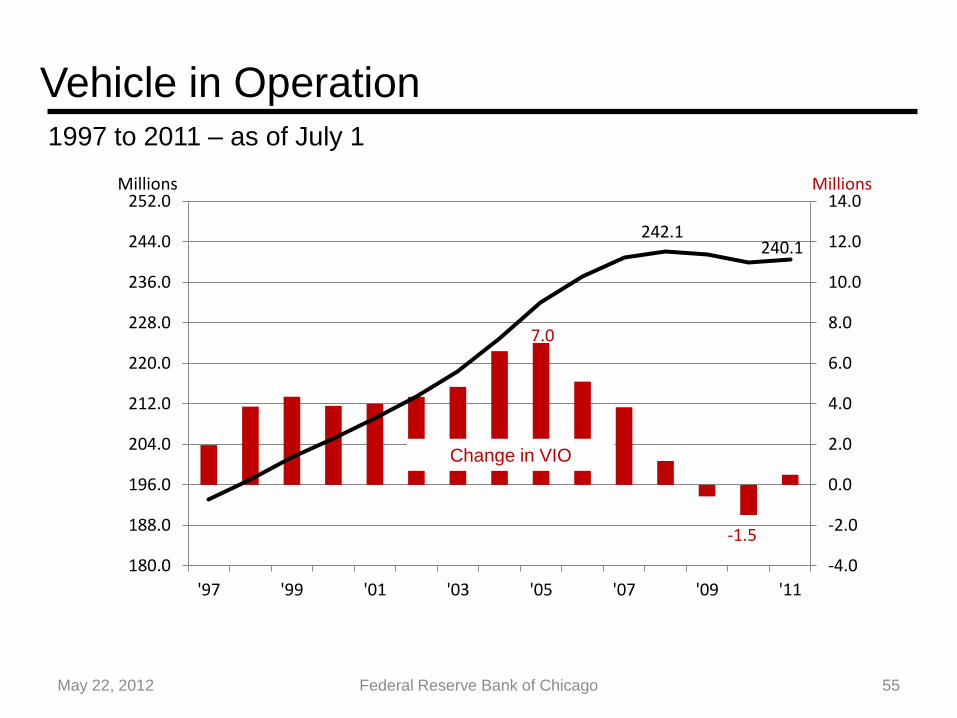
May 22, 2012 55 Federal Reserve Bank of Chicago
1997 to 2011 – as of July 1
-4.0
-2.0
0.0
2.0
4.0
6.0
8.0
10.0
12.0
14.0
180.0
188.0
196.0
204.0
212.0
220.0
228.0
236.0
244.0
252.0
'97 '99 '01 '03 '05 '07 '09 '11
Vehicle in Operation
Change in VIO
Millions Millions
7.0
-1.5
242.1 240.1

May 22, 2012 56 Federal Reserve Bank of Chicago
Average Vehicle Age From July 1 Each Year
Source: R. L. Polk
Total
Passenger Light Light
Year Cars Trucks Vehicle
2000 9.1 8.4 8.9
2001 9.3 8.4 8.9
2002 9.4 8.4 9.0
2003 9.6 8.5 9.1
2004 9.8 8.6 9.4
2005 10.1 8.7 9.5
2006 10.3 8.9 9.7
2007 10.4 9.0 9.8
2008 10.6 9.3 10.0
2009 10.8 9.8 10.3
2010 11.0 10.1 10.6
2011 11.1 10.4 10.8

10.0
10.5
11.0
11.5
12.0
12.5
13.0
13.5
'70 '72 '74 '76 '78 '80 '82 '84 '86 '88 '90 '92 '94 '96 '98 '00 '02 '04 '06 '08 '10
May 22, 2012 57 Federal Reserve Bank of Chicago
Total Miles Traveled / Vehicles in Operation, Annual Average
Miles Per Vehicle
Thousands
‘72 11.9
‘02 12.9
‘11 11.9
‘08 11.7
Source: R.L. Polk and Federal Highway Administration
‘80 10.9

May 22, 2012 58 Federal Reserve Bank of Chicago
U.S. L. V. Sales Per Nonfarm Employee
0.06
0.08
0.10
0.12
0.14
0.16
0.18
0.20
'68 '72 '76 '80 '84 '88 '92 '96 '00 '04 '08 '12
Seasonally Adjusted Annual Rate – 12 MMA
Light Vehicle Sales would be 15.9 Million at Current
Employment and Trend Nonfarm VPE
Trend

May 22, 2012 59 Federal Reserve Bank of Chicago
New and Used Vehicles Prices Percent Change Since January 2007
-15.0
-10.0
-5.0
0.0
5.0
10.0
15.0
20.0
'07 '08 '09 '10 '11 '12
New Used
Mar ‘12 10.2%
5.3%
Percent
Source: Bureau of Labor Statistics, CPI New Vehicles and Used Cars and Trucks

May 22, 2012 60 Federal Reserve Bank of Chicago
Comerica Auto Affordability Index Weeks of Median Family Income Needed to Buy a New Car
20.0
22.5
25.0
27.5
30.0
32.5
'79 '81 '83 '85 '87 '89 '91 '93 '95 '97 '99 '01 '03 '05 '07 '09 '11
Q1 ‘12 23.2
Weeks
Source: Comerica Bank

May 22, 2012 61 Federal Reserve Bank of Chicago
U.S. Light Vehicle Industry
Millions of Units
8,000
10,000
12,000
14,000
16,000
18,000
20,000
1980 1985 1990 1995 2000 2005 2010 2015 2020
17.3
10.4
16.0
12.3
2020 16.5 2012
16.0
Blue Chip
Consensus
2012 – 14.5
12.7
Trend 2013 – 14.9

May 22, 2012 62 Federal Reserve Bank of Chicago
Factors Supporting Light Vehicle Sales
1. Since 2007 light vehicle sales have been well below trend helping to
create a large amount of pent-up demand.
2. The vehicle fleet is older than it has been since WW II.
3. Employment levels are slowly returning.
4. CPI for new vehicles is growing more slowly than for used vehicles.
5. Higher used vehicle prices means that buyers actually have quite a bit
of equity in their used vehicle that they can use as a down payment.
6. Between 2007 and 2010 vehicles in operation (VIO) actually fell by 1.5
million units while the driving age population grew by 5.1 million people.
7. Higher fuel prices are being offset by more fuel efficient product
offerings.
May 22, 2012 Federal Reserve Bank of Chicago 63
Economic Projections of FOMC April 2012

May 22, 2012 64 Federal Reserve Bank of Chicago
April 25, 2012 F.O.M.C Meeting
1. Information received since the F.O.M.C. met in March suggests that the
economy has been expanding moderately.
2. Labor market conditions have improved in recent months; the
unemployment rate has declined in recent months but remains elevated.
3. Household spending and business fixed investment have continued to
advance but the housing sector remains depressed.
4. Inflation has picked up somewhat, mainly reflecting higher prices of
crude oil and gasoline. However, long-term inflation expectations have
remained stable.
5. The committee expects to maintain a highly accommodative stance for
monetary policy warranting exceptionally low federal funds rate at least
through late 2014.
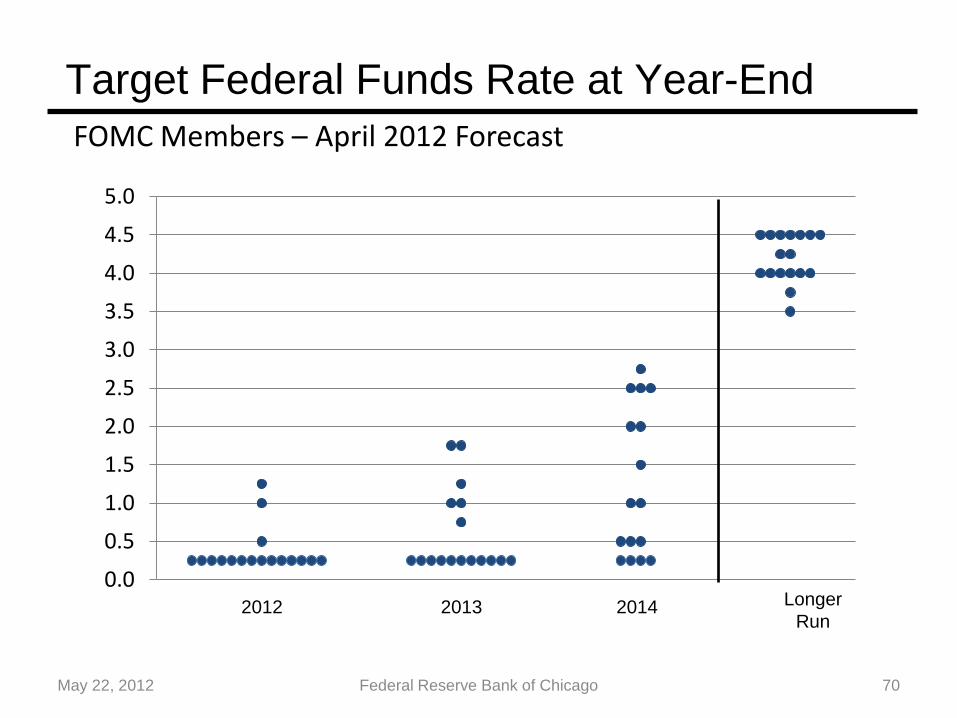
6. The Committee decided to keep the target range for the federal funds
rate at 0.0 to 0.025 percent.

May 22, 2012 65 Federal Reserve Bank of Chicago
-4.0
-3.0
-2.0
-1.0
0.0
1.0
2.0
3.0
4.0
5.0
'00 '01 '02 '03 '04 '05 '06 '07 '08 '09 '10 '11 '12 '13 '14
Real GDP Percent Change
FOMC Members – April 2012 Forecast
Percent
High Forecast
Low Forecast
Change in Real GDP 2012 2013 2014 L.R. 2012 2013 2014 L.R.
High 2.9 3.1 3.6 2.6 3.0 3.8 4.3 3.0
Low 2.4 2.7 3.1 2.3 2.1 2.4 2.9 2.2
Centeral Tendency Range

May 22, 2012 66 Federal Reserve Bank of Chicago
0.0
2.0
4.0
6.0
8.0
10.0
12.0
'00 '01 '02 '03 '04 '05 '06 '07 '08 '09 '10 '11 '12 '13 '14
Percent
Unemployment Rate
High Forecast
Low Forecast
FOMC Members – April 2012 Forecast
Unemployment Rate 2012 2013 2014 L.R. 2012 2013 2014 L.R.
High 8.0 7.7 7.4 6.0 8.2 8.1 7.7 6.0
Low 7.8 7.3 6.7 5.2 7.8 7.0 6.3 4.9
Centeral Tendency Range

May 22, 2012 67 Federal Reserve Bank of Chicago
0.0
0.5
1.0
1.5
2.0
2.5
3.0
3.5
'00 '01 '02 '03 '04 '05 '06 '07 '08 '09 '10 '11 '12 '13 '14
Percent
PCE Inflation
High Forecast
Low Forecast
FOMC Members – April 2012 Forecast
PCE Inflation 2012 2013 2014 L.R. 2012 2013 2014 L.R.
High 2.0 2.0 2.0 2.3 2.1 2.2
Low 1.9 1.6 1.7 1.8 1.5 1.52.0 2.0
Centeral Tendency Range

May 22, 2012 68 Federal Reserve Bank of Chicago
0.0
0.5
1.0
1.5
2.0
2.5
'00 '01 '02 '03 '04 '05 '06 '07 '08 '09 '10 '11 '12 '13 '14
Percent
Core PCE Inflation
High Forecast
Low Forecast
FOMC Members – April 2012 Forecast
Core PCE Inflation 2012 2013 2014 L.R. 2012 2013 2014 L.R.
High 2.0 2.0 2.0 2.0 2.1 2.2
Low 1.8 1.7 1.8 1.7 1.6 1.7
Centeral Tendency Range
N/A N/A

May 22, 2012 69 Federal Reserve Bank of Chicago
Appropriate Timing of Policy Firming
3 3
7
4
0
1
2
3
4
5
6
7
8
2012 2013 2014 2015
Nu
mb
er
of P
art
icip
an
ts
FOMC Members – April 2012 Forecast
May 22, 2012 70 Federal Reserve Bank of Chicago
Target Federal Funds Rate at Year-End
0.0
0.5
1.0
1.5
2.0
2.5
3.0
3.5
4.0
4.5
5.0
2012 2013 2014 Longer
Run
FOMC Members – April 2012 Forecast

Primary and Secondary Credit Rates
Discount Rates
0.0
1.0
2.0
3.0
4.0
5.0
6.0
7.0
'03 '04 '05 '06 '07 '08 '09 '10 '11 '12
Percent
Primary Credit Rate
Secondary Credit Rate
May 22, 2012 71 Federal Reserve Bank of
Chicago
Apr ’12 1.25
0.75
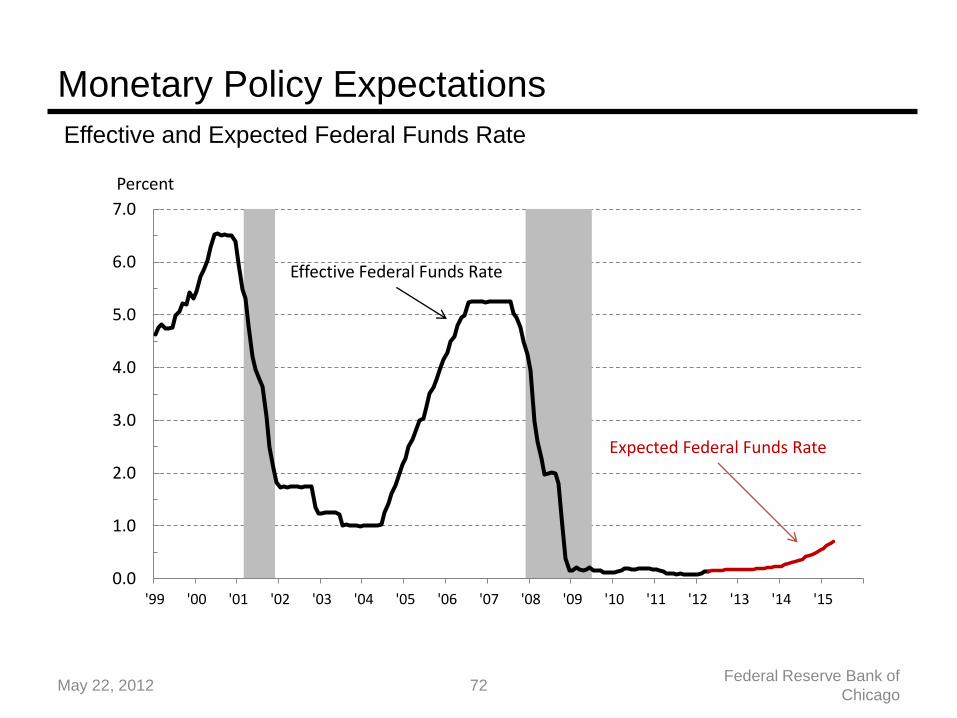
Effective and Expected Federal Funds Rate
Monetary Policy Expectations
0.0
1.0
2.0
3.0
4.0
5.0
6.0
7.0
'99 '00 '01 '02 '03 '04 '05 '06 '07 '08 '09 '10 '11 '12 '13 '14 '15
Percent
Effective Federal Funds Rate
Expected Federal Funds Rate
May 22, 2012 72 Federal Reserve Bank of
Chicago

Thank You!