Transisi Demografi, Bonus Demografi dan the Window of Oppoertunity

28 September 2017
Anton Hendranata
Chief Economist
+6221 80645208, ext. 8867
Dian Ayu Yustina
Economist
+6221 80645208, ext. 8875
Wisnu Wardana
Economist
+6221 80645208, ext. 8873
Economic Outlook 2018 N a v i g a t i n g T h r o u g h G l o b a l Q u a n t i t a t i v e T i g h t e n i n g

2
Rentetan krisis ekonomi dunia & pelonggaran
moneter yang agresif
Economic Crisis QE (USD) 2016 GDP Policy Rate Real IR
US 3Q08 - 4Q09 Nov 08-Oct 14 4.5 tn (24%) 18.5 tn 1.25 -0.45
Japan 2Q - 3Q11 Agt 11-Jul 17 3.5 tn (71%) 4.9 tn -0.10 -0.50
EU 1Q12 - 2Q13 Mar 15-Jul 17 2.1 tn (18%) 11.9 tn 0.0 -1.4
Japan 2Q14 - 1Q15
Russia 3Q15 - 4Q16 1.3 tn 9.0 4.6
China Slowing, 2Q11 11.1 tn 4.45 2.65
Brexit Jun-16 Mar 09-Agt16 0.7 tn (27%) 2.6 tn 0.25 -2.35

3
Wajah Perekonomian Global

4
Perekonomian dunia stagnan
China
US Japan
Euro
area

5
Demografi Menghambat Potensi Pertumbuhan
Ekonomi
Japan
Eropa
China
US
World
Indonesia
6
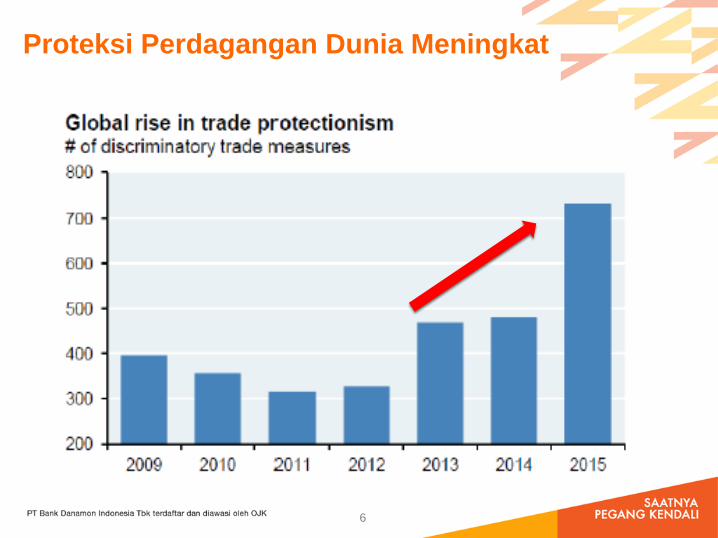
Proteksi Perdagangan Dunia Meningkat

7
Perdagangan Global Stagnan 10 Tahun
Terakhir

8
Ketidakpastian Tinggi: Ekspektasi > Aktual
Economic Surprise Indices
Source:Bloomberg
CNY
EUR
US
JPN

9
Kenaikan Suku Bunga di Des 2017?
Source:Bloomberg
0
10
20
30
40
50
60
70
80
Fed BoC BoE ECB
% 21-Jul 22-Aug 15-Sep

10
Source: WEO July 2017
Global Growth Forecast
Proyeksi Perekonomian Global 2018
2.6
1.62.1 2.1
2 1.81.9
1.7
1.1 11.3
0.6
6.9 6.7 6.76.4
8
7.1 7.27.7
4.9 4.9 5.1 5.2
2015 2016 2017F 2018F
India
China
ASEAN5
US
Euro Area
Japan
Global Trade Outlook
2015 2016 2017F 2018FWTV* 2.6 2.3 4 3.9
Adv. Econ 4 2.3 3.9 3.5
Emerging Econ 0.3 2.2 4.1 4.6
Commodity Price
Oil 42.8 51.9 52
Non Fuel** -17.5 -1.8 5.4 -1.4
*average growth rates of export and import volumes
**average growth based on exports weights

11
Trump: Konsisten Untuk Tidak Konsisten
Policy
Initial Stand
Post Presidency 1
Post Presidency 2
Current Position
Economic Impact
Health Care
Repeal and cover everybody
“I Like the Mandate”
Not everyone will be covered
Replace it with something
Core PCE Inflation thus Fed Fund Rate
trajectory
Low Interest Rate
Fed is keeping rates artificially low and
creates a false economy
“USD is too strong”
Prefers the Fed to keep rates low
Low interest rates are good
Market “risk-on” sentiment, IDR bond
yields dropped by 7bps on 13 Apr
+ other 32 policies(taxes, min wages, debt,
climate change, immigration, muslim ban, defeating ISIS, etc.)
Source: NBC News
http://www.nbcnews.com/politics/2016-election/full-list-donald-trump-s-rapidly-changing-policy-positions-n547801

12
Pemulihan Ekonomi US Relatif Terbatas
Source: Bloomberg
US GDP growth (%yoy)
US Leading Economic Indicator
(%yoy)

13
Pemulihan Ekonomi US Relatif Terbatas
Source: Bloomberg
US Unemployment Rate (%)US Labor Force (%)

14
Pemulihan Ekonomi US Relatif Terbatas
Source: Bloomberg
US Average Hourly Earning (%yoy) US Inflation (%yoy)
15
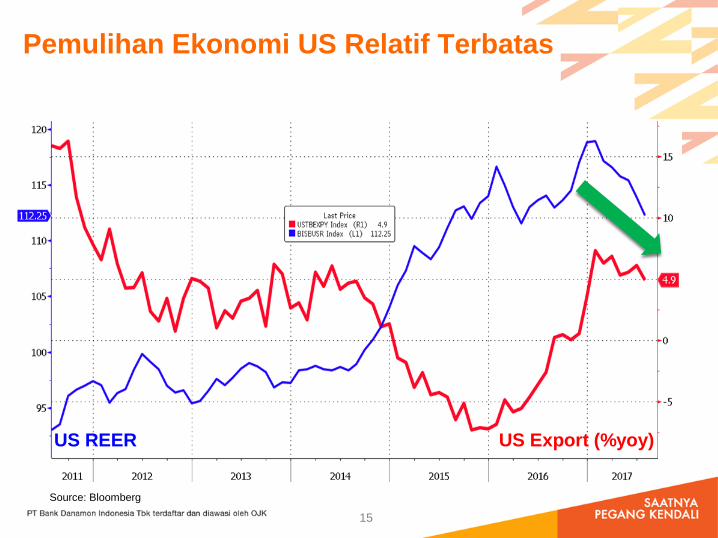
Pemulihan Ekonomi US Relatif Terbatas
Source: Bloomberg
US Export (%yoy) US REER

16
Pemulihan Ekonomi EU Agak Stagnan
Source: Bloomberg
EU GDP growth (%yoy)
EU Leading Economic Indicator
(%yoy)

17
Pemulihan Ekonomi Jepang Masih Lemah
Source: Bloomberg
Japan GDP growth (%yoy)
Japan Leading Economic Indicator
(%yoy)

18
Pemulihan Ekonomi China Melambat
Source: Bloomberg
China GDP growth (%yoy)
China Leading Economic Indicator
(%yoy)

19
Perekonomian Domestik – Driver Utamanya
Konsumsi RT, Tapi Stagnan
2.8 3.0 2.9 2.8 2.7 2.7 2.7 2.7
2.72.9
1.6 1.4 1.6 1.5 1.5 1.7
6.17 6.03 5.56
5.01 4.88
5.02 5.01 5.01
-2
-1
0
1
2
3
4
5
6
7
2011 2012 2013 2014 2015 2016 1Q17 2Q17
G Net X I C GDP
%yoy
Source: BPS, CEIC, Danamon calculation

20
Perekonomian Domestik – Kontribusi Industri
Manufaktur Menurun
Source: BPS, CEIC, Danamon calculation
1.4 1.2 1.0 1.0 0.9 0.9 0.9 0.8
0.5 0.60.6 0.6 0.5 0.4
0.90.5
1.30.8
0.7 0.70.4 0.5
0.7
0.5
0.8
0.60.6 0.7
0.6 0.5
0.6
0.7
0.4
0.50.4 0.4
0.4 0.4
0.4
0.5
0.3
0.30.3 0.3
0.3 0.3
0.3
0.3
0.2
0.30.3 0.2
0.3 0.3
0.2
0.2
6.17 6.03 5.56
5.01 4.88 5.02 5.01 5.01
0
1
2
3
4
5
6
7
2011 2012 2013 2014 2015 2016 1Q17 2Q17Accommodation, Food&Bev Financial, Insurance
Transportation, Storage Information, Communication
Construction Wholesales, Retail Trade
Agriculture, Forestry, Fisheries Manufacturing
GDP
%yoy

21
Daya Saing Makin Membaik
Peringkat 54 (2007) membaik menjadi 41 (2016)
Source: BI, World Economic Forum – The Global Competitiveness Report 2016 -2017

22
Kemudahan Berusaha (Ease of Doing Business)
Makin Membaik
Source: MOF, World Bank – Doing Business 2017 Report

23
Kepercayaan Rakyat Kepada Pemerintah
Tertinggi di Dunia
Source: BPS, CEIC, Danamon calculation
2007
2016
Source: OECD

24
Reformasi Struktural – Mendorong Daya Beli &
investasi
Source: MOF

25
Belanja Pemerintah Makin Produktif
Source: MOF

26
Indonesia Tempat Investasi Menarik
27
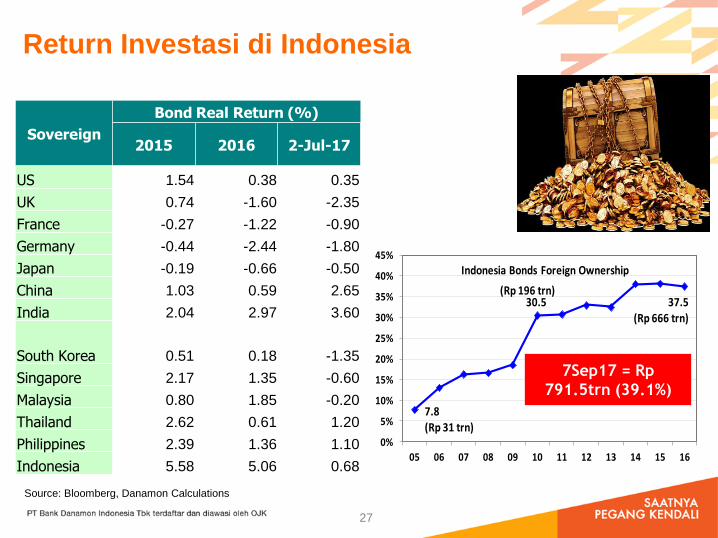
Return Investasi di Indonesia
0%
5%
10%
15%
20%
25%
30%
35%
40%
45%
05 06 07 08 09 10 11 12 13 14 15 16
7.8(Rp 31 trn)
37.530.5
Indonesia Bonds Foreign Ownership
(Rp 666 trn)
(Rp 196 trn)
7Sep17 = Rp
791.5trn (39.1%)
Sovereign
Bond Real Return (%)
2015 2016 2-Jul-17
US 1.54 0.38 0.35
UK 0.74 -1.60 -2.35
France -0.27 -1.22 -0.90
Germany -0.44 -2.44 -1.80
Japan -0.19 -0.66 -0.50
China 1.03 0.59 2.65
India 2.04 2.97 3.60
South Korea 0.51 0.18 -1.35
Singapore 2.17 1.35 -0.60
Malaysia 0.80 1.85 -0.20
Thailand 2.62 0.61 1.20
Philippines 2.39 1.36 1.10
Indonesia 5.58 5.06 0.68
Source: Bloomberg, Danamon Calculations
28
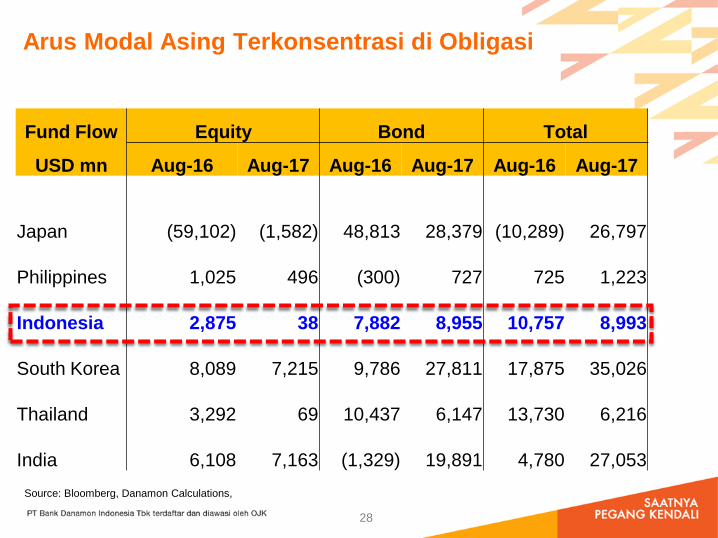
Arus Modal Asing Terkonsentrasi di Obligasi
Fund Flow Equity Bond Total
USD mn Aug-16 Aug-17 Aug-16 Aug-17 Aug-16 Aug-17
Japan
(59,102) (1,582) 48,813 28,379 (10,289) 26,797
Philippines
1,025
496
(300)
727
725
1,223
Indonesia
2,875
38
7,882
8,955 10,757
8,993
South Korea
8,089
7,215
9,786 27,811 17,875 35,026
Thailand
3,292
69 10,437
6,147 13,730
6,216
India
6,108
7,163 (1,329) 19,891
4,780 27,053
Source: Bloomberg, Danamon Calculations,

29
Rupiah Relatif Stabil

30
USD Menguat Sejak 2011, 2017 Melemah
Dollar Index IDR/USD

31
Bonds Yield Turun Signifikan, Waspada
Pembalikan
IDR/USD Bond 10yr

32
Harga Komoditas Ekspor Masih Lemah
85.6
79.5
74.9
65
70
75
80
85
90
4Q16 2017f 2018f
Coal Ric Bay $/MT
10,796
10,047 10,203
9,600
9,800
10,000
10,200
10,400
10,600
10,800
11,000
4Q16 2017f 2018f
Nickel $/MT
68.1
66.0
61.0
56
58
60
62
64
66
68
70
4Q16 2017f 2018f
Iron Ore $/MT
2,933
2,640 2,650
2400
2500
2600
2700
2800
2900
3000
4Q16 2017f 2018f
Palm Oil RM/metric ton

33
Harga Komoditas Impor Naik
51.151.4
52.5
50
51
51
52
52
53
53
4Q16 2017f 2018f
Oil - Brent $/BBl
1,217
1,253
1,268
1,180
1,200
1,220
1,240
1,260
1,280
4Q16 2017f 2018f
Gold $/t oz
525.9
622.8 628.5
450
500
550
600
650
4Q16 2017f 2018f
Steel $/ST

Pelemahan Ekonomi Mungkin Sudah di Titik Terendah
6.2% 6.0%
5.6%
5.0% 4.9%
5.0%
4%
5%
6%
7%
8%
9%
10%
4.5%
5.0%
5.5%
6.0%
6.5%
2011 2012 2013 2014 2015 2016
yoy yoy Real GDP (LHS)
Private Consumption Expenditures
Gross Fixed Capital Formation
• Ekonomi tumbuh terendah pada tahun 2015 di level 4.9%. Kemungkinan pemulihan
berbentuk U (U-shaped recovery).
• Pertumbuhan investasi diharapkan menjadi motor pendorong perekonomian, selain
konsumsi.
• Indikator Net Other Income (FDI + Exports) telah menunjukkan peningkatan (rebound),
yang dapat diikuti oleh pemulihan konsumsi (dampak memiliki lag 2 tahun).
Government’s Forecast Growth Drivers
1.8
2.2
2.6
3.0
0.2
0.6
1.0
1.4
1.8
2004 2006 2008 2010 2012 2014 2016
% bps Real Other Income
PCE Contribution 2Y Lag
34

Mendorong Investasi Bangkit
Poverty and Inequality Infrastructure Priorities Sectors Regional Funds
Rp 292.8 T Rp 409 T Rp 34.8 T Rp 761.1 T
Social Security Program
(increase from 6mn families
to 10 mn families
Health Services
Coverage of 92.4mn people
Education Program (around
20mn scholarships)
Roads (856 km)
Irrigations (781 km)
Electrification Ratio
(95.15%)
Housing
(7,062 unit)
Agriculture
Tourism
Fisheries
Share Allocation Fund
(Rp 87.7 T)
General Allocation Fund
Rp398 T
Specific Allocation Fund
Rp185.9 T
Village Funds Rp 60T
2017 2018
RAPBNP APBN
Private Consumption 5.1 5.1
Government Consumption 4.6 3.8
Investment 5.4 6.3
Exports 4.8 5.1
Imports 3.9 4.5
GDP 5.2 5.4
Component
Government’s Forecast
Focus of Government’s Budget
• Pemulihan ekonomi tahun-tahun ke depan
diharapkan lebih didorong oleh bangkitnya
investasi, namun perlu peranan dari pemerintah,
seperti :
Mempercepat distribusi Bansos, meningkatkan
belanja terutama pada infrastruktur
Paket kebijakan ke-16 yang diumumkan pada
31 Aug terfokus pada kemudahan dan
perampingan birokrasi untuk proses realisasi
investasi. Namun pemulihan investasi akan
bertahap dan butuh waktu, tidak secepat
perkiraan semula.
35

36
Source: BPS, BI, Danamon Calculation
Notes: Trend Aug-17 vs 3Q16
• Sebagian indikator ekonomi menunjukkan perbaikan di 2H17
Indicators Unit 1Q16 2Q16 3Q16 4Q16 1Q17 2Q17 Jul-17 Aug-17 Trend
Consumption
Domestic Car Sales yoy -5% 11% -1% 18% 9% -28% 37% 0%
Domestic Motorcycle Sales yoy 3% -10% -8% -16% -16% -27% 76% 5%
Retail Sales Index yoy 11% 16% 11% 10% 4% 7% -3% 5%
Consumer Confidence Index yoy -6% 2% 13% 7% 11% 8% 8% 8%
Real M2 yoy 3% 5% 2% 7% 6% 7% 5% N/A
Fixed Investment
PMI bps 50.6 51.9 50.9 49.0 50.5 49.5 48.6 50.7
Cement Sales yoy 2% 2% -3% -3% 4% -27% 56% 9%
Imported Capital Goods yoy -28% -8% -11% -1% 19% -27% 61% 8%
Government Spending yoy 6% 12% 5% 4% 18% 3% 20% N/A
Trade Volume yoy -6% 9% 6% 3% 9% -14% 12% -20%
1Q16 2Q16 3Q16 4Q16 1Q17 2Q17 3Q17
Gross Domestic Product yoy 4.9% 5.2% 5.0% 4.9% 5.0% 5.0% 5.1%
Leading Economic Ind icators - Indonesia

Proyeksi Perekonomian 2018
Ekonomi Global:
• Ketidakpastian pada kebijakan fiskal AS
dapat berdampak pada pertumbuhan
ekonomi yang lebih moderat.
• Fed kemungkinan akan melanjutkan
rencana pengurangan neraca moneternya,
diikuti oleh kebijakan pengetatan moneter
namun dengan skala yang lebih moderat.
• Ekonomi China mungkin akan terus
melambat
Ekonomi Domestik:
• Pertumbuhan ekonomi akan bergantung
pada pemulihan investasi dan belanja
pemerintah.
• Belanja pemerintah dapat meningkat akibat
penyelenggaraan Pilkada di 2017 dan
Pemilu di 2018 dan 2019.
• Inflasi terkendali dan respon suku bunga
minimal.
• Pemulihan ekonomi mungkin berimbas
tekanan pada defisit transaksi berjalan
(CAD) dan nilai tukar Rupiah.
37
Real GDP Growth (%) 2016 2017F 2018F
China 6.70 6.70 6.40
US 1.50 2.10 2.30
EU 1.90 2.00 1.80
Japan 1.00 1.40 1.00
Source: Bloomberg
US - O/N policy rate (% p.a.) 0.75 1.50 2.00
Indonesia
Real GDP Growth (% yoy) 5.02 5.04 5.27
Consumer Price Index (% yoy) 3.02 3.65 3.43
BI 7D RR (% p.a.) 4.75 4.25 4.00
O/N Deposit Facility rate 4.00 3.50 3.25
FX Rate (IDR/USD) – Average 13,309 13,349 13,514
FX Rate (IDR/USD) – Year End 13,417 13,430 13,536
LPS Rate 6.25 5.75 5.50
Loan Growth (% yoy) 7.90 9.71 11.07
Third Party Fund Growth (% yoy) 9.60 8.90 10.89
Tahun

APPENDIX
38

2018
APBNP Outlook RAPBN
I. Economic Infrastructure 390.3 377.8 395.1
through Ministries 157.1 146.9 161.2
1. Ministry of Public Works and Housing (toll roads, bridges ) 101.5 100 104.2
2. Ministry of Transportation (rail tracks, airports, seaports, LRT Jakarta, Palembang) 40.8 33.5 44.2
3. Ministry of Agriculture (irrigations and dams) 2.5 2.5 1.4
4. Ministry of Human Resource 3.1 2.3 2.8
through non Ministries 6 6 3
1. Viability Gap Fund 0.5 0.5 1.2
2. Grant 5.4 5.4 1.4
through transfers to regions and village funds 180.9 178.6 182.8
1. Specific Allocated Funds 32.3 30.6 33.9
2. Village Funds for Infrastructure 24 23.3 24
3. Regional Transfer Funds for Infrastructure 121.2 121.2 120.9
through Financing Scheme 46.2 46.2 48.1
1. Housing facility (i.e. one million house program/interest rate subsidy) 3.1 3.1 2.2
2. Capital Injection to SoE 9.6 9.6 6.1
3. Fund to Public Services Institutions (Hospitals, 32.1 32.1 35.4
II. Social Infrastructure 8.2 8.1 9
1. Ministry of Education and Cultural 5.6 5.6 5.8
2. Ministry of Religion 2.6 2.5 2.9
3. Ministry of Health 0.3
III. Infrastructure Support 2.6 2.4 4.9
1. Ministry of Land (BPN) 0.2 0.2 2.8
2. Ministry of Industry 0.4 0.4 0.2
Total 401.1 388.3 409
2017Items
Pembiayaan Infrastruktur
39

40

Referensi artikel – Anton Hendranata
41
1) Kompas, 21 Nov 13: “Suku Bunga”
2) Kompas, 26 Jun 14: “Rupiah dan Pertumbuhan”
3) Tempo, 14 Nov 14: “Relying on Invesment For Growth”
4) Kompas, 13 Dec 14: “Mewujudkan Pertumbuhan 7 Persen”
5) Kompas, 27 Dec 14: “Ancaman Utang Luar Negeri Swasta”
6) Kompas, 16 Jan 15: “Minyak dan Era Perekonomian Baru”
7) Kompas, 28 Feb 15: “Optimisme APBN Perubahan 2015”
8) Kompas, 13 Mar 15: “Psikologis Rupiah”
9) The Jakarta Post, 31 Mar 15: “Additional Oxygen from the FED Rate Policy”
10) Kompas, 30 May 15: “Mengapa Kita Pesimistis”
11) Kompas, 23 Jul 15: “Dilema Suku Bunga”
12) Kompas, 24 Aug 15: “Ancaman Tiongkok”
13) Tabloid Kontan Mingguan, 14 Sep 15: “Membalikkan Sentimen”
14) Kompas, 15 Sep 15: “Persepsi Negatif dan Kekuatan Komunikasi”
15) Kompas, 26 Nov 15: “Harapan Rupiah Stabil”

Referensi artikel – Anton Hendranata
42
16) Kompas, 2 Mei 16: “Embrio Suku Bunga Rendah”
17) Kompas, 13 Juni 16: ”Melarikan Diri dari S&P”
18) Kompas, 4 Juli 16: ”Pasca Brexit”
19) Kompas, 30 Juli 16: ”Pergantian Kabinet Jilid II”
20) Kompas, 13 Sep 16: ”Untungnya Pengampunan Pajak”
21) Kompas, 7 Okt 16: ”Amnesti Pajak vs Utang Swasta”
22) Kompas, 16 Nov 16: ”Meredam Ketidakpastian”
23) Kompas, 8 Mar 17: ”Proteksionisme Trump”
24) Kompas, 22 Mar 17: “Ketimpangan Perekonomian”
25) Kompas, 31 Mei17: ”Menata Perekonomian Indonesia”
26) Kompas, 27 Jul 17: ”Utang: Tabu vs Solusi”
27) Kompas, 9 Sep 17: ”Antibiotik Daya Beli”

43
Biodata Singkat
Kepala Ekonom Bank Danamon, 2014 - sekarang
Ekonom dan Ekonometrisi Bank Danamon, 2008 - 2014
Dosen Fakultas Ekonomi dan Bisnis, Universitas Indonesia, 1995 – sekarang. Beberapa kali sebagai
dosen terbaik di FEUI
Asisten Pimpinan Magister Perencanaan dan Kebijakan Publik, FEUI, 2004 – 2008
Peneliti di Lembaga Penyelidikan Ekonomi dan Masyarakat, FEUI, 1992 – 2008
Pengajar di diklat Bank Indonesia, Kementerian Keuangan, dan kursus profesi pasar finansial, seperti:
Certified Securities Analyst (CSA) dan Chartered Financial Analyst (CFA).
Penulis di koran: Kompas, Bisnis Indonesia, Kontan, Tempo, Investor Daily, The Jakarta Post dll.
Nara sumber di instansi pemerintah (BI, OJK, LPS, Kemenkeu, Menko Perekonomian), swasta, & TV
The top 3 of FX Forecaster, FocusEconomics Analyst Forecast Awards 2017
The best of FX Research and Market Coverage, Asiamoney FX Poll, 2014, bersama Tim Riset Ekonomi
Bank Danamon
Research - Commended by the Assets Magazine 2014, bersama Tim Riset Ekonomi Bank Danamon di
Indonesia
The Best Economist Forecasters bersama Tim Riset Ekonomi Bank Danamon di Indonesia, yang
dilakukan oleh Bloomberg Markets, 2012 – 2013
Sarjana Statistika dan Magister Ilmu Ekonomi Pertanian IPB, serta Doktor Ilmu Ekonomi FEUI

PT Bank Danamon Indonesia, Tbk.
Terdaftar dan diawasi oleh Otoritas Jasa
Keuangan
44
DISCLAIMER
The information contained in this report has been taken from sources which we deem reliable. However, none of P.T. Bank Danamon Indonesia Tbk. and/or its affiliated companies
and/or their respective employees and/or agents makes any representation or warranty (express or implied) or accepts any responsibility or liability as to, or in relation to, the
accuracy or completeness of the information and opinions contained in this report or as to any information contained in this report or any other such information or opinions
remaining unchanged after the issue thereof. We expressly disclaim any responsibility or liability (express or implied) of P.T. Bank Danamon Indonesia Tbk., its affiliated
companies and their respective employees and agents whatsoever and howsoever arising (including, without limitation for any claims, proceedings, action , suits, losses,
expenses, damages or costs) which may be brought against or suffered by any person as a result of acting in reliance upon the whole or any part of the contents of this report and
neither P.T. Bank Danamon Indonesia Tbk., its affiliated companies or their respective employees or agents accepts liability for any errors, omissions or mis-statements, negligent
or otherwise, in the report and any liability in respect of the report or any inaccuracy therein or omission there from which might otherwise arise is hereby expressly disclaimed. The
information contained in this report is not be taken as any recommendation made by P.T. Bank Danamon Indonesia Tbk. or any other person to enter into any agreement with
regard to any investment mentioned in this document. This report is prepared for general circulation. It does not have regards to the specific person who may receive this report. In
considering any investments you should make your own independent assessment and seek your own professional financial and legal advice.

THANK YOU