ECONOMIC IMPACT OF VISITORS IN NORTH CAROLINA
27
ECONOMIC IMPACT OF VISITORS IN NORTH CAROLINA 2019 WWW.TOURISMECONOMICS.COM Prepared for: Visit North Carolina
Transcript of ECONOMIC IMPACT OF VISITORS IN NORTH CAROLINA

ECONOMIC IMPACT OF
VISITORS IN NORTH CAROLINA2019
W W W . T O U R I S M E C O N O M I C S . C O M
Prepared for:
Visit North Carolina

2
The travel sector is an integral part of the North Carolina
economy. Visitors generate significant economic benefits to
households, businesses, and government alike and represent a
critical driver of North Carolina’s future.
By monitoring the visitor economy, policymakers can inform
decisions regarding the funding and prioritization of the
sector’s development. They can also carefully monitor its
successes and future needs. By establishing a baseline of
economic impacts, the industry can track its progress over
time.
To quantify the economic significance of the tourism sector in
North Carolina, Tourism Economics has prepared a
comprehensive model using multiple primary and secondary
data sources to quantify the economic impacts arising from all
travel-related economic activity using the Tourism Satellite
Account framework.
Impact modeling is based on an IMPLAN Input-Output (I-O)
model for North Carolina. The results of this study show the
scope of the travel sector in terms of direct visitor spending,
as well as total economic impacts, including employment,
household income, and tax impacts in the broader economy.
INTRODUCTION
The analysis draws on the following data sources:
• U.S. Travel Association Travel Economic Impact Model
(TEIM): survey and industry-based analysis of visitor
spending split by commodity and point of origin
(domestic/international)
• Bureau of Economic Analysis and Bureau of Labor
Statistics: employment and wage data, by industry
• STR: Lodging performance data, including room demand,
room rates, occupancy, and room revenue
• Tax collections: Lodging and restaurant tax receipts
(county and municipal)
• US Census: business sales by industry and seasonal second
homes inventory
• OAG: airport and passenger statistics
• Tourism Economics: international travel data for overseas,
Canadian, and Mexico travel to North Carolina based on
aviation, survey, mobile device, and credit card
information.

KEY FINDINGS

4
Tourism Demand
Total tourism demand tallied $34.2 billion in 2019.
This marks another new high for the North
Carolina tourism sector and the tenth consecutive
year of growth.
Continued Growth
Tourism demand increased 5.9% in 2019. Since
2009, visitor spending has grown at an annualized
rate of 5.4% per year. This measure of direct
expenditures in 2019 stood at 69% above 2009
levels.
Fiscal Contributions
Travelers generated $4.1 billion in state and local
taxes in 2019, which is equivalent to $1,046 in tax
savings for every household in North Carolina.
Employment Generation
The travel economy supported more than
462,964 jobs in 2019, or 7.5% of total
employment in North Carolina. This marks a
steady increase in share since 2008 (6.9% of all
jobs).
KEY FINDINGSThe visitor economy is an engine for economic growth

VISITOR ECONOMY TRENDS

6
The TSA was conceived by the UN World Tourism
Organization and has since been ratified by the UN,
Eurostat, and OECD.
The standard has been adopted by over 80 countries
around the world and a growing number of
subnational states and regions.
The TSA deals with the challenge of measuring
tourism in two important ways:
• Defines the tourism economy
• Provides methodology for measuring the travel
economy in a way that is consistent with economic
accounts
The entire travel industry is measured within the TSA,
including leisure, business, group, transit, and the local
spending of outbound travelers.
KEY DEFINITIONS
Tourism Satellite Account (TSA)
Tourism Economic Impact
Total Tourism Demand
Tourism Industry GDP
Measures the full economic impacts of tourism
demand, including indirect and induced impacts. This
expands on the TSA framework to quantify the
downstream impacts of the travel sector.
Includes all visitor spending plus other spending
streams in support of the traveler industry. This
includes government spending and capital investment
in support of travel.
Measures the value of production of “tourism
characteristic industries” on behalf of travelers. This
concept measures only the direct impact of the travel
industry.
Background
7
28,290
29,517
30,641
32,276
34,186
2015 2016 2017 2018 2019
5.9%
Source: U.S. Travel Association; Tourism Economics
25%
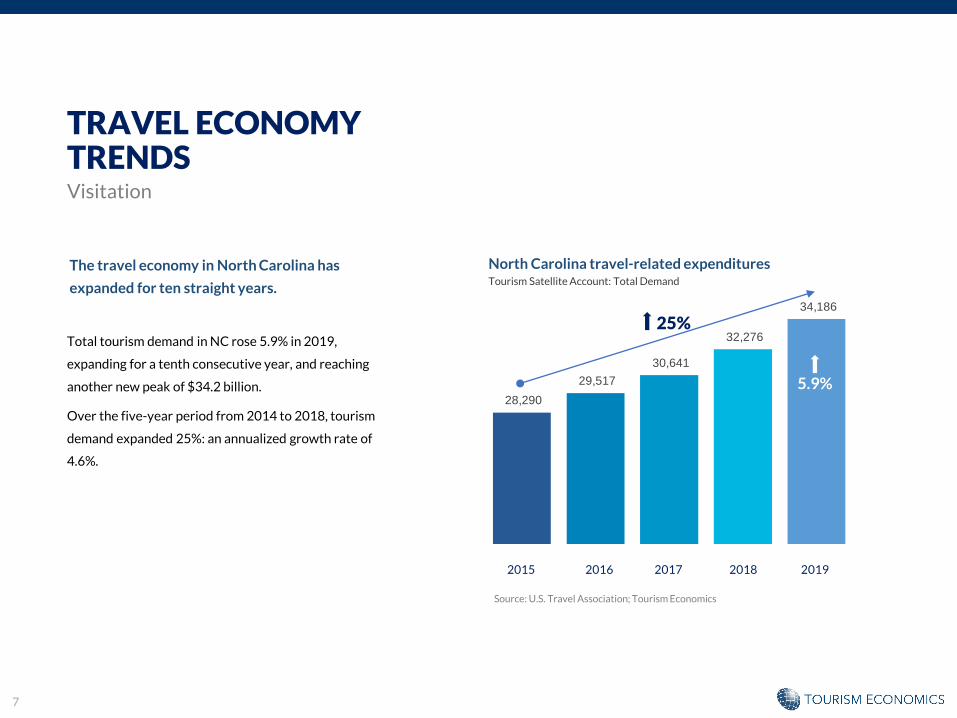
TRAVEL ECONOMYTRENDSVisitation
Total tourism demand in NC rose 5.9% in 2019,
expanding for a tenth consecutive year, and reaching
another new peak of $34.2 billion.
Over the five-year period from 2014 to 2018, tourism
demand expanded 25%: an annualized growth rate of
4.6%.
The travel economy in North Carolina has
expanded for ten straight years.
North Carolina travel-related expendituresTourism Satellite Account: Total Demand
8
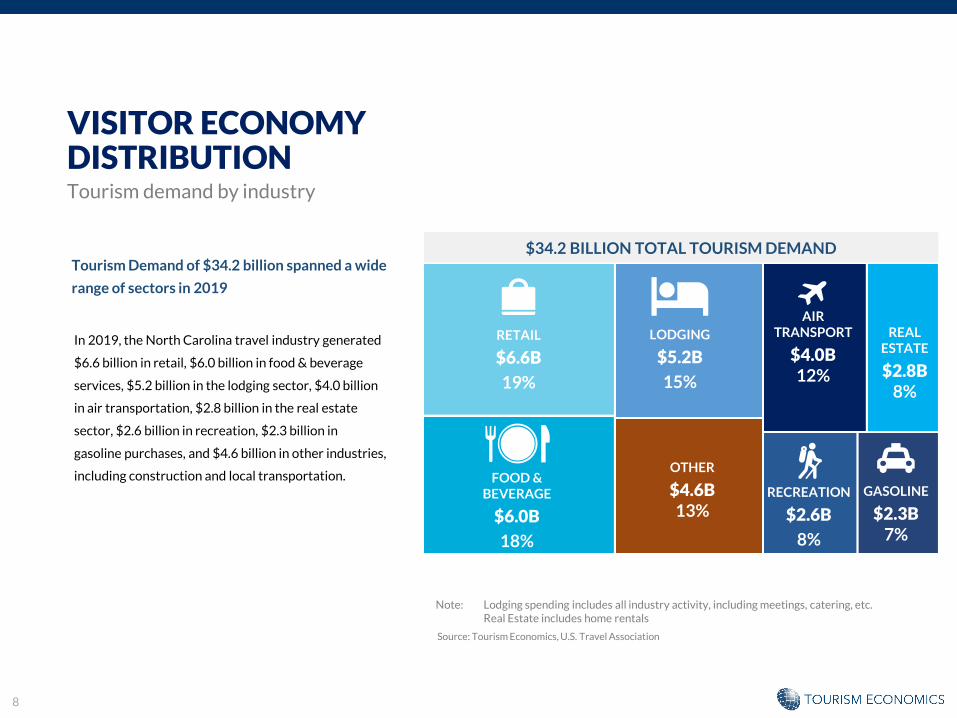
Tourism Demand of $34.2 billion spanned a wide
range of sectors in 2019
FOOD &BEVERAGE
$6.0B
18%
LODGING
$5.2B
15%
RETAIL
$6.6B
19%
AIRTRANSPORT
$4.0B12%
RECREATION
$2.6B
8%
GASOLINE
$2.3B7%
Note: Lodging spending includes all industry activity, including meetings, catering, etc.Real Estate includes home rentals
$34.2 BILLION TOTAL TOURISM DEMAND
VISITOR ECONOMYDISTRIBUTIONTourism demand by industry
In 2019, the North Carolina travel industry generated
$6.6 billion in retail, $6.0 billion in food & beverage
services, $5.2 billion in the lodging sector, $4.0 billion
in air transportation, $2.8 billion in the real estate
sector, $2.6 billion in recreation, $2.3 billion in
gasoline purchases, and $4.6 billion in other industries,
including construction and local transportation.
Source: Tourism Economics, U.S. Travel Association
REAL ESTATE
$2.8B8%
OTHER
$4.6B13%

9
VISITOR ECONOMYTRENDSTourism Demand by source
Growth in the visitor economy was
broad-based in 2019 but especially
strong in domestic visitor markets.
Domestic traveler spending increased by
$1.6 billion with a 5.6% surge.
International visitor spending increased
modestly to $952 million in 2019 while
construction within the travel industry
jumped 13.9% to $2.3 billion.
Non-visitor private consumption
expenditures (PCE) represent tourism
consumer durables such as an RV, boat,
or furniture for a vacation home. These
rose 3.7% to $988 million.
Government support for tourism,
including the budgets for tourism
promotion around the state and visitor
centers, increased 6.8%.
North Carolina Tourism DemandMillions of nominal dollars
Source: Tourism Economics, U.S. Travel Association
2014 2015 2016 2017 2018 2019
2019
growth
2014-2019
CAGR
Tourism Demand $27,319 $28,290 $29,517 $30,641 $32,276 $34,186 5.9% 4.6%
Domestic $23,949 $24,674 $25,689 $26,753 $28,134 $29,698 5.6% 4.4%
International $826 $829 $911 $940 $940 $952 1.3% 2.9%
Non-visitor PCE $851 $873 $898 $925 $952 $988 3.7% 3.0%
Gov't Support $156 $178 $191 $208 $218 $233 6.8% 8.4%
Capital Investment $1,538 $1,736 $1,828 $1,816 $2,032 $2,315 13.9% 8.5%

10
Domestic86.9%
International2.8%
Non-visitor PCE2.9%
Gov't Support
0.7%
CAPEX6.8%
VISITOR ECONOMY DISTRIBUTIONTourism Demand by source
Domestic visitor markets comprised the majority (87%)
of tourism demand in 2019.
Capital investment in tourism-related construction and
machinery & equipment represented 6.8% of all
tourism-related demand.
International visitor markets and non-visitor PCE each
contributed nearly 3% of tourism demand in North
Carolina in 2019.
North Carolina Tourism DemandPercentage distribution
Source: Tourism Economics, U.S. Travel Association

ECONOMIC IMPACTS

12
Our analysis of the North Carolina visitor
economy begins with spending by and on
behalf of travelers, then measures the
downstream effects of this injection of
spending into the local economy. To determine
the total economic impact of tourism in North
Carolina, we analyze visitor spending within a
model of the local economy based on an
IMPLAN input-output model. This process
calculates three distinct types of impact:
direct, indirect, and induced.
The impacts on business sales, jobs, wages,
and taxes are calculated for all three levels of
impact.
How tourism demand generates
employment, income, and taxes
1. Direct Impacts: Visitors create direct
economic value within a discreet group of
sectors (e.g. recreation, transportation).
This supports a relative proportion of jobs,
wages, taxes, and GDP within each sector.
2. Indirect Impacts: Each directly affected
sector also purchases goods and services
as inputs (e.g. food wholesalers, utilities)
into production. These impacts are called
indirect impacts.
3. Induced Impacts: Lastly, the induced
impact is generated when employees
whose wages are generated wither
directly or indirectly by visitors, spend
those wages in the local economy.
ECONOMIC IMPACTS
13
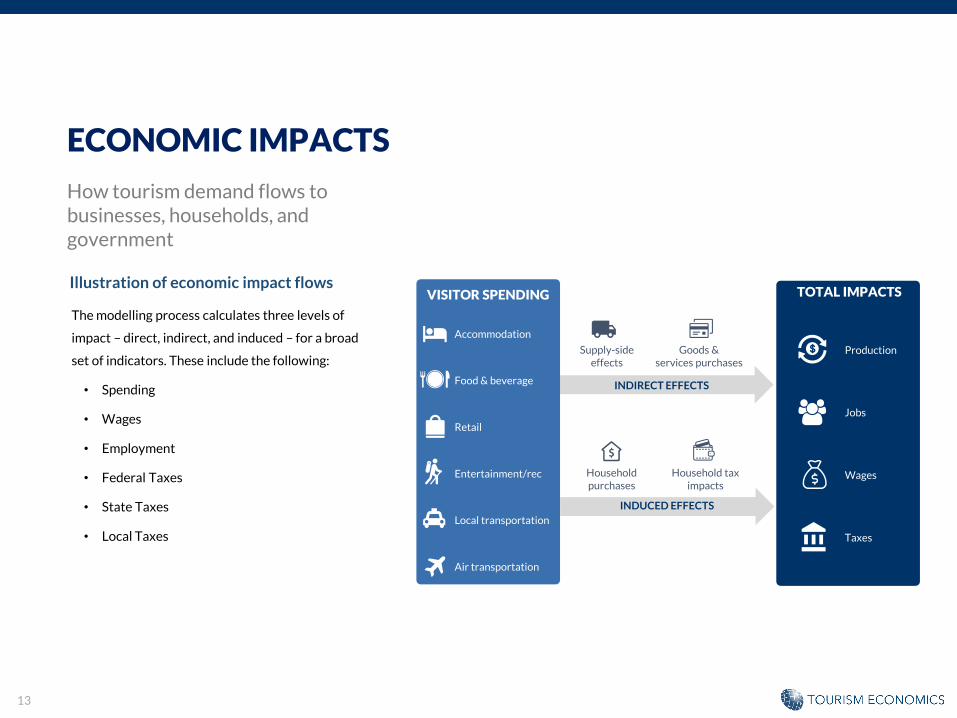
The modelling process calculates three levels of
impact – direct, indirect, and induced – for a broad
set of indicators. These include the following:
• Spending
• Wages
• Employment
• Federal Taxes
• State Taxes
• Local Taxes
Illustration of economic impact flows
ECONOMIC IMPACTS
How tourism demand flows to businesses, households, and government
Accommodation
Food & beverage
Retail
Entertainment/rec
Local transportation
Air transportation
Goods & services purchases
Householdpurchases
VISITOR SPENDING
INDIRECT EFFECTS
INDUCED EFFECTS
TOTAL IMPACTS
Production
Jobs
Wages
Taxes
Supply-side effects
Household tax impacts

14
North Carolina visitor spending of $34.2
billion produced $51.5 billion in business
sales including indirect and induced impacts.
Business sales impacts by industry
ECONOMIC IMPACTS
Amounts in millions of current dollars
Directsales
Indirectsales
Inducedsales
Totalsales
$51.5B
$9.1B
$8.2B
$34.2B
Summary economic impacts ($ millions)
Visitor business sales impacts by industry
Source: Tourism Economics
Direct
sales
Indirect
sales
Induced
sales
Total
sales
Total, all industries $34,186 $8,247 $9,080 $51,512
By industry
Retail Trade $6,661 $238 $1,076 $7,975
Food & Bev $6,042 $214 $460 $6,717
Finance, insur. & real estate $2,779 $1,613 $1,174 $5,566
Lodging $5,232 $70 $65 $5,367
Air Transport $3,991 $19 $21 $4,031
Recreation $2,629 $86 $125 $2,841
Business Svcs. $418 $1,901 $518 $2,836
Manufacturing $0 $1,465 $1,073 $2,538
Gasoline $2,258 $18 $73 $2,348
Wholesale Trd $1,353 $496 $479 $2,329
Government $233 $192 $1,317 $1,742
Personal Svcs $1,145 $169 $368 $1,681
Constr, Utilities $962 $492 $214 $1,668
Edu, Health $0 $9 $1,507 $1,515
Other Transport $482 $611 $248 $1,341
Communications $0 $499 $281 $780
Agriculture $0 $158 $81 $239

15
While most business sales are in industries
directly serving visitors, $5.6 billion in
business sales accrue to the finance,
insurance, and real estate industry as a
result of selling to visitors, tourism
businesses, and their employees.
Similarly, significant indirect and induced
benefits accrue to sectors such as business
services ($2.8 billion), manufacturing ($2.5
billion), education & heath care ($1.5
billion), and communications ($780 million).
Business sales impacts by industry
ECONOMIC IMPACTS
Visitor business sales impacts by industry
Source: Tourism Economics
$0 $2,000 $4,000 $6,000 $8,000
Agriculture
Communications
Other Transport
Edu, Health
Constr, Utilities
Personal Svcs
Government
Wholesale Trd
Gasoline
Manufacturing
Business Svcs.
Recreation
Air Transport
Lodging
Finance, insur. & real estate
Food & Bev
Retail Trade
Direct Indirect Induced
$ millions

16
Tourism GDP is the value added of those
sectors directly interacting with travelers.
The narrow definition of the tourism
industry counts only tourism consumption,
which excludes capital investment and
general government support. This definition
is consistent with economic accounts.
On this basis, tourism industry GDP reached
$14.8 billion in 2019, accounting for 2.3% of
total North Carolina GDP.
Including the direct, indirect and induced
impacts of all total tourism demand, the
tourism sector generated $24.3 billion of
state GDP in 2019. This was 4.1% of the
state economy.
GDP impacts by industry
ECONOMIC IMPACTS
Amounts in millions of current dollars
Tourism GDP impacts by industry
Source: Tourism Economics
Direct
sales
Indirect
sales
Induced
sales
Total
sales
Total, all industries 14,761 4,239 5,323 24,323
By industry
Finance, insur. & real estate 1,950 1,081 716 3,748
Lodging 3,303 44 39 3,386
Food & Bev 2,763 98 211 3,073
Retail Trade 1,547 155 699 2,402
Recreation 1,501 48 74 1,622
Business Svcs. 173 1,002 283 1,458
Air Transport 1,419 5 6 1,431
Government 67 74 1,118 1,259
Wholesale Trd 305 336 325 966
Constr, Utilities 547 273 133 954
Edu, Health - 5 924 929
Other Transport 325 394 132 851
Personal Svcs 522 84 187 793
Manufacturing - 373 276 649
Gasoline 339 12 50 401
Communications - 220 124 344
Agriculture - 35 23 58
Tourism Industry GDP 13,512
17
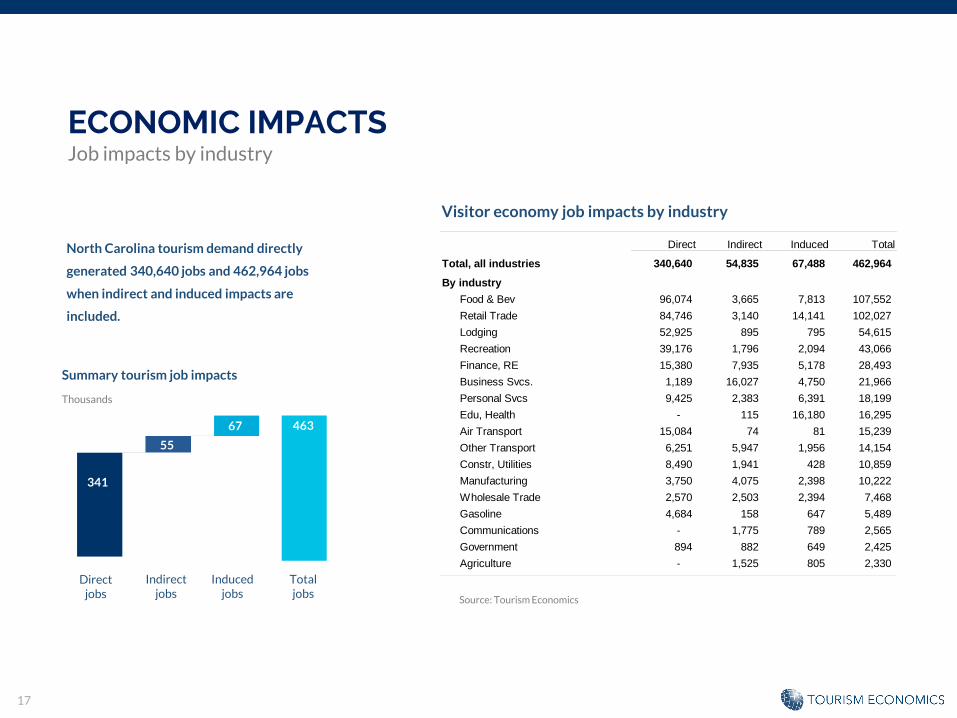
North Carolina tourism demand directly
generated 340,640 jobs and 462,964 jobs
when indirect and induced impacts are
included.
Job impacts by industry
ECONOMIC IMPACTS
Thousands
Visitor economy job impacts by industry
Directjobs
Indirectjobs
Inducedjobs
Totaljobs
46367
55
341
Summary tourism job impacts
Source: Tourism Economics
Direct Indirect Induced Total
Total, all industries 340,640 54,835 67,488 462,964
By industry
Food & Bev 96,074 3,665 7,813 107,552
Retail Trade 84,746 3,140 14,141 102,027
Lodging 52,925 895 795 54,615
Recreation 39,176 1,796 2,094 43,066
Finance, RE 15,380 7,935 5,178 28,493
Business Svcs. 1,189 16,027 4,750 21,966
Personal Svcs 9,425 2,383 6,391 18,199
Edu, Health - 115 16,180 16,295
Air Transport 15,084 74 81 15,239
Other Transport 6,251 5,947 1,956 14,154
Constr, Utilities 8,490 1,941 428 10,859
Manufacturing 3,750 4,075 2,398 10,222
Wholesale Trade 2,570 2,503 2,394 7,468
Gasoline 4,684 158 647 5,489
Communications - 1,775 789 2,565
Government 894 882 649 2,425
Agriculture - 1,525 805 2,330

18
Visitor economy total employment of
462,964 jobs accounts for 7.5% of total
employment in North Carolina.
Tourism-generated employment grew 2.9%
in 2019. This outpaced the total NC job
market, which expanded 2.2%*.
Employment impacts by industry
ECONOMIC IMPACTS
Visitor economy employment impacts by industry
Source: Tourism Economics
* BEA SA25N Total Employment
0 20,000 40,000 60,000 80,000 100,000 120,000
Agriculture
Government
Communications
Gasoline
Wholesale Trade
Manufacturing
Constr, Utilities
Other Transport
Air Transport
Edu, Health
Personal Svcs
Business Svcs.
Finance, RE
Recreation
Lodging
Retail Trade
Food & Bev
Direct Indirect Induced

19
North Carolina visitors directly generated
$9.6 billion in direct personal income and
$15.1 billion including indirect and induced
impacts.
Labor income impacts by industry
ECONOMIC IMPACTS
Amounts in millions of current dollars
Visitor economy labor income impacts by industry
Directlabor
income
Indirectlabor
income
Inducedlabor
income
Totallabor
income
$15.1B$2.8B
$2.7B
$9.6B
Summary labor income impacts ($ millions)
Source: Tourism Economics
Direct Indirect Induced Total
Total, all industries $9,567 $2,685 $2,813 $15,065
By industry
Retail Trade $2,058 $103 $452 $2,613
Food & Bev $2,000 $72 $151 $2,223
Lodging $1,917 $26 $23 $1,965
Finance, RE $440 $393 $303 $1,135
Business Svcs. $67 $834 $235 $1,135
Air Transport $1,085 $5 $5 $1,095
Recreation $767 $40 $52 $859
Edu, Health $0 $5 $813 $818
Other Transport $214 $336 $102 $652
Constr, Utilities $371 $150 $54 $575
Wholesale Trade $165 $197 $184 $546
Personal Svcs $322 $68 $150 $540
Manufacturing $0 $246 $159 $405
Communications $0 $133 $59 $193
Gasoline $129 $6 $23 $158
Government $33 $45 $30 $107
Agriculture $0 $27 $18 $46

20
Labor income impacts by industry
ECONOMIC IMPACTS
Visitor economy labor income impacts by industry
Source: Tourism Economics
0 500 1,000 1,500 2,000 2,500 3,000
Agriculture
Government
Gasoline
Communications
Manufacturing
Personal Svcs
Wholesale Trade
Constr, Utilities
Other Transport
Edu, Health
Recreation
Air Transport
Business Svcs.
Finance, RE
Lodging
Food & Bev
Retail Trade
Direct Indirect Induced

21
Visitor spending, visitor supported jobs, and
business sales generated $8.4 billion in
governmental revenues in 2019.
Fiscal (tax) impacts
ECONOMIC IMPACTS
Amounts in millions of current dollars
Visitor economy fiscal (tax) impacts
State and local taxes alone tallied $4.1 billion in
2019.
Each household in North Carolina would need to be
taxed an additional $1,045 to replace the traveler
taxes received by state and local governments in
2019.
Source: Tourism Economics
2017 2018 2019
2019
growth
Total tax revenues $7,492.6 $7,904.5 $8,359.2 5.5%
Federal $3,820.6 $4,038.3 $4,261.3 5.7%
Personal income $1,075 $1,139 $1,200 5.9%
Corporate $655.5 $689.9 $730.1 5.3%
Indirect business $507.7 $534.3 $565.5 5.3%
Social security $1,582.2 $1,675.4 $1,765.7 5.9%
State and Local $3,672.0 $3,866.2 $4,097.9 5.3%
Sales $1,439.3 $1,514.9 $1,603.2 5.3%
Bed taxes $272.7 $285.4 $310.5 4.7%
Personal income $416.9 $441.4 $465.2 5.9%
Corporate $442.0 $465.3 $492.4 5.3%
State unemployment $28.0 $29.6 $31.2 5.9%
Excise and fees $108.5 $114.2 $120.9 5.3%
Property $964.6 $1,015.3 $1,074.5 5.3%

22
Government support of tourism is divided between
collective (general support) and individual (specific
support) spending.
Expenditures in support of travel
GOVERNMENT SUPPORT
2019/20 Fiscal Year
Tourism Administration and Promotion
Total state government support of tourism tallied
$14 million in the 2019/20 fiscal year, falling 6.8%
County government support of tourism rose 7.4%
to $191 million.
Municipality government support of tourism rose
11% to $27 million.
Total government support of tourism reached $233
million in the most recent fiscal year.
State and local taxes generated by tourism ($3.8
billion) surpass this funding by a rate of 18-to-1.
Source: Tourism Economics
Note: County and municipality figures are based on previous fiscal year based on
availability
Individual Collective Total % change
State $2,452,276 $11,580,766 $14,033,042 -6.8%
Counties $28,744,731 $162,886,808 $191,631,539 7.4%
Municipalities $4,032,513 $22,850,906 $26,883,419 11.0%
TOTAL $35,229,520 $197,318,481 $232,548,000 6.8%

23
Capital investments in new buildings,
infrastructure, and machinery & equipment are
vital to the ongoing growth of the tourism economy.
Travel-related construction and equipment expenditures
CAPITAL INVESTMENT
millions
Tourism Capital Investment
$2.3 billion was invested by and on behalf of the
travel sector last year, including hotels, recreational
facilities, and related government capital outlays.
Source: Tourism Economics
2014 2015 2016 2017 2018 2019
2019
growth
Construction $388 $529 $569 $531 $748 $962 28.6%
Rec. & Entertainment $260 $206 $331 $257 $298 $344 15.2%
Hotels and Motels $115 $310 $233 $273 $438 $608 38.8%
Government Capital $13 $13 $6 $2 $12 $10 -12.1%
Machinery and Equip. $1,150 $1,208 $1,259 $1,284 $1,284 $1,353 5.4%
Total $1,538 $1,736 $1,828 $1,816 $2,032 $2,315 13.9%

ECONOMIC IMPACTS IN CONTEXT
25
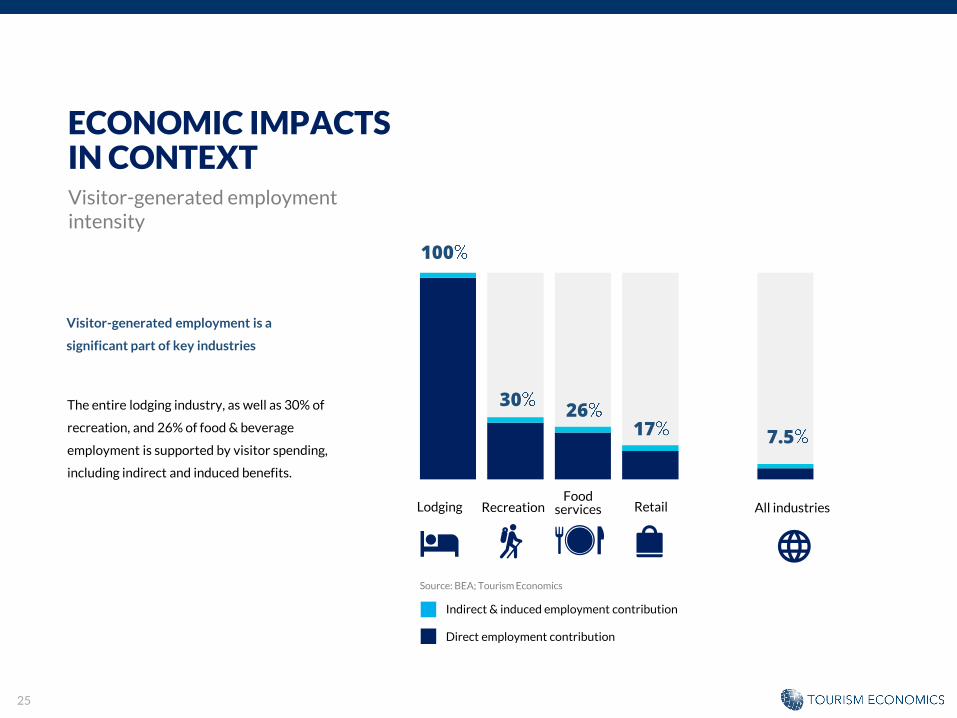
The entire lodging industry, as well as 30% of
recreation, and 26% of food & beverage
employment is supported by visitor spending,
including indirect and induced benefits.
Visitor-generated employment is a
significant part of key industries
Visitor-generated employment intensity
Direct employment contribution
Indirect & induced employment contribution
100
3026
17 7.5
Lodging RecreationFood
services Retail All industries
ECONOMIC IMPACTSIN CONTEXT
Source: BEA; Tourism Economics

26
Tourism Impact per Day
The $51.5 billion in total tourism sales implies that
$141 million in business activity happens EVERY
DAY as a result of the North Carolina tourism
sector.
Personal income
The $14.1 billion in total income generated by the
tourism sector is the equivalent of $3,844 for
every household in North Carolina.
Taxes
The $3.8 billion in state and local taxes generated
by the travel economy would cover the starting
salaries of 76,000 public schoolteachers in North
Carolina.
Employment
The number of jobs sustained by the travel
economy (462,964) is enough to fill the
Spectrum Center for 24 Charlotte Hornets
games.
ECONOMIC IMPACTSIN CONTEXTFigures in context
27
Tourism Economics is an Oxford Economics company with a singular objective: combine an understanding of the travel sector
with proven economic tools to answer the most important questions facing our clients. More than 500 companies, associations,
and destination work with Tourism Economics every year as a research partner. We bring decades of experience to every
engagement to help our clients make better marketing, investment, and policy decisions. Our team of highly-specialized
economists deliver:
• Global travel data-sets with the broadest set of country, city, and state coverage available
• Travel forecasts that are directly linked to the economic and demographic outlook for origins and destinations
• Economic impact analysis that highlights the value of visitors, events, developments, and industry segments
• Policy analysis that informs critical funding, taxation, and travel facilitation decisions
• Market assessments that define market allocation and investment decisions
Tourism Economics operates out of regional headquarters in Philadelphia and Oxford, with offices in Belfast, Dubai, Frankfurt,
and Ontario.
Oxford Economics is one of the world’s foremost independent global advisory firms, providing reports, forecasts and analytical
tools on 200 countries, 100 industrial sectors and over 3,000 cities. Our best-of-class global economic and industry models and
analytical tools give us an unparalleled ability to forecast external market trends and assess their economic, social and business
impact. Headquartered in Oxford, England, with regional centers in London, New York, and Singapore, Oxford Economics has
offices across the globe in Belfast, Chicago, Dubai, Miami, Milan, Paris, Philadelphia, San Francisco, and Washington DC, we
employ over 250 full-time staff, including 150 professional economists, industry experts and business editors—one of the
largest teams of macroeconomists and thought leadership specialists.
ABOUT TOURISM ECONOMICS
For more information: