Economic Impact of Tourism in Kansas, 2016 · The total economic impact of tourism includes...
48
Economic Impact of Tourism in Kansas, 2016 September 2017
Transcript of Economic Impact of Tourism in Kansas, 2016 · The total economic impact of tourism includes...
Economic Impact of Tourism in
Kansas, 2016
September 2017
Table of Contents
1) Key Findings 3
2) Visitation and Spending 7
3) The Tourism Satellite Account 20
4) The Economic Impact of Tourism 24
5) Economic Impact in Context 43
1) Key Findings
| Tourism Economics 4
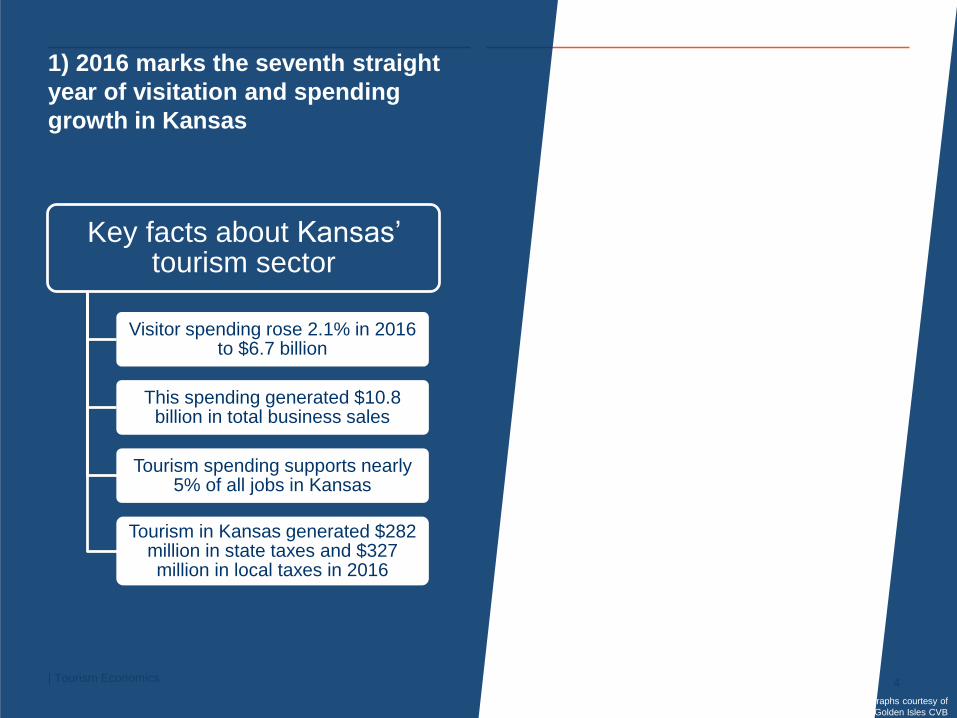
1) 2016 marks the seventh straight
year of visitation and spending
growth in Kansas
Key facts about Kansas’ tourism sector
Visitor spending rose 2.1% in 2016 to $6.7 billion
This spending generated $10.8 billion in total business sales
Tourism spending supports nearly 5% of all jobs in Kansas
Tourism in Kansas generated $282 million in state taxes and $327 million in local taxes in 2016
Photographs courtesy of
Golden Isles CVB
| Tourism Economics 5
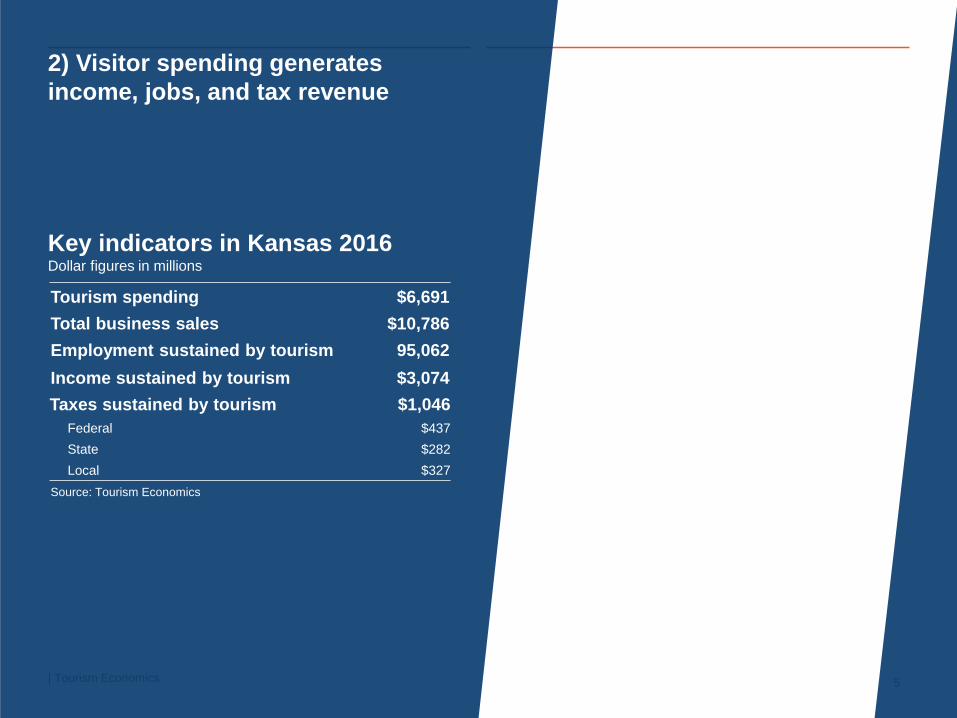
2) Visitor spending generates
income, jobs, and tax revenue
Tourism spending $6,691
Total business sales $10,786
Employment sustained by tourism 95,062
Income sustained by tourism $3,074
Taxes sustained by tourism $1,046
Federal $437
State $282
Local $327
Source: Tourism Economics
Key indicators in Kansas 2016Dollar figures in millions
| Tourism Economics 6
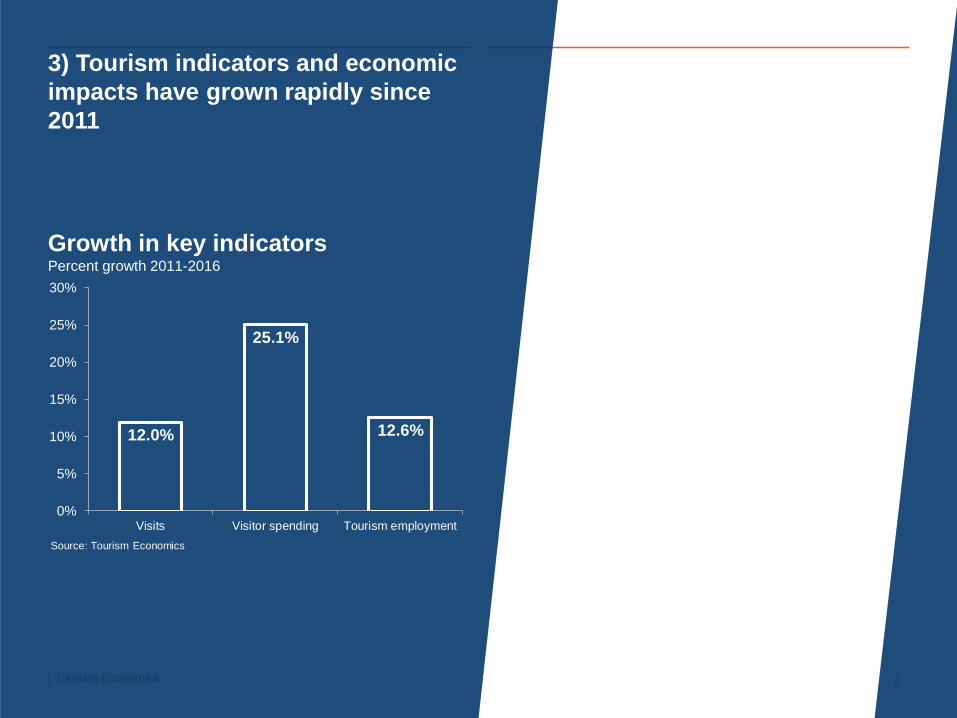
3) Tourism indicators and economic
impacts have grown rapidly since
2011
12.0%
25.1%
12.6%
0%
5%
10%
15%
20%
25%
30%
Visits Visitor spending Tourism employment
Source: Tourism Economics
Growth in key indicatorsPercent growth 2011-2016
2) Visitation and Spending
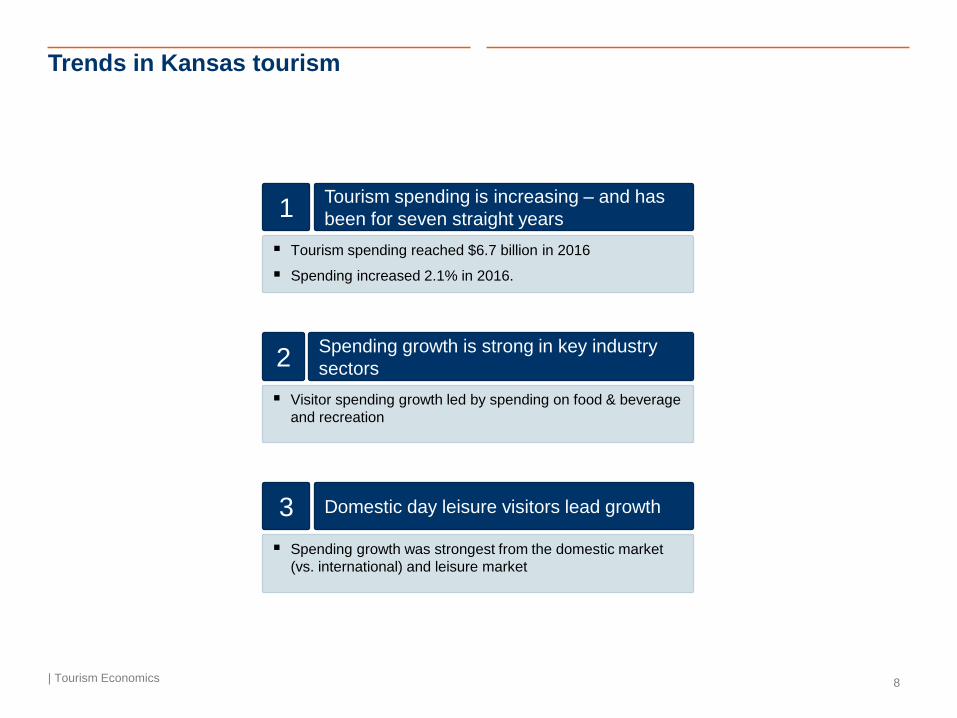
Trends in Kansas tourism
| Tourism Economics 8
▪ Tourism spending reached $6.7 billion in 2016
▪ Spending increased 2.1% in 2016.
▪ Spending growth was strongest from the domestic market
(vs. international) and leisure market
Tourism spending is increasing – and has
been for seven straight years1
Domestic day leisure visitors lead growth3
▪ Visitor spending growth led by spending on food & beverage
and recreation
Spending growth is strong in key industry
sectors2
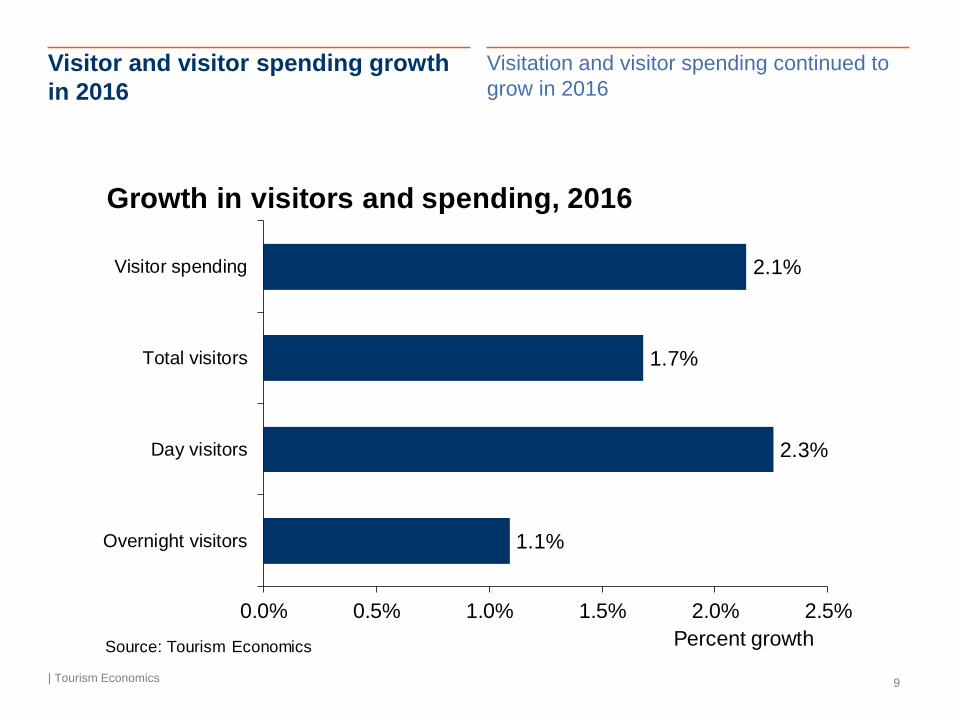
Visitor and visitor spending growth
in 2016
| Tourism Economics 9
Visitation and visitor spending continued to
grow in 2016
2.1%
1.7%
2.3%
1.1%
0.0% 0.5% 1.0% 1.5% 2.0% 2.5%
Visitor spending
Total visitors
Day visitors
Overnight visitors
Growth in visitors and spending, 2016
Percent growthSource: Tourism Economics
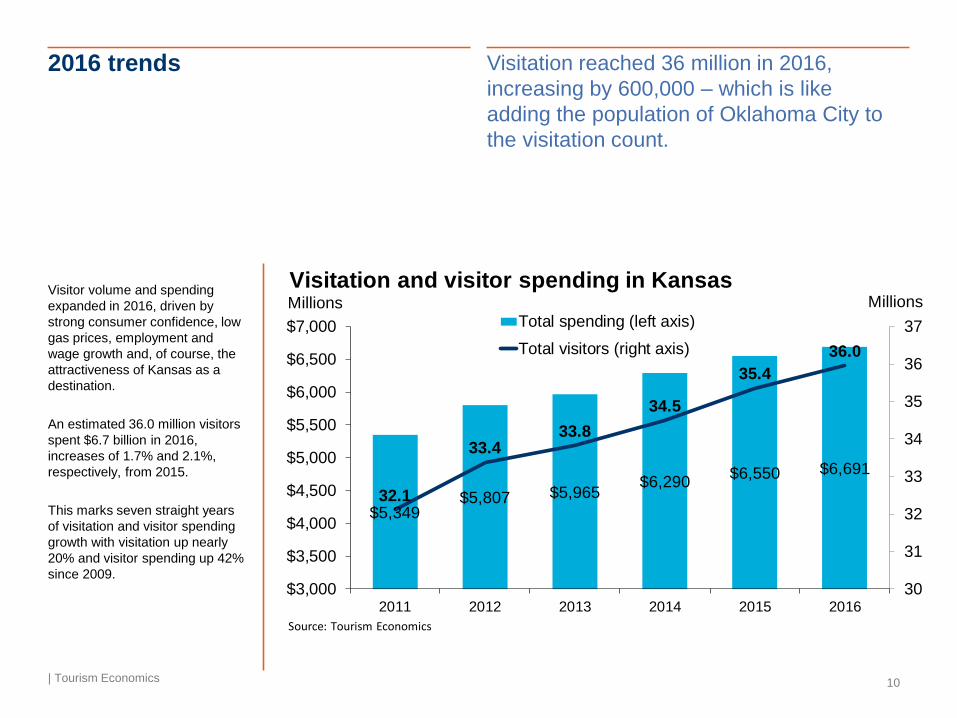
2016 trends
| Tourism Economics 10
Visitation reached 36 million in 2016,
increasing by 600,000 – which is like
adding the population of Oklahoma City to
the visitation count.
Visitor volume and spending
expanded in 2016, driven by
strong consumer confidence, low
gas prices, employment and
wage growth and, of course, the
attractiveness of Kansas as a
destination.
An estimated 36.0 million visitors
spent $6.7 billion in 2016,
increases of 1.7% and 2.1%,
respectively, from 2015.
This marks seven straight years
of visitation and visitor spending
growth with visitation up nearly
20% and visitor spending up 42%
since 2009.
$5,349$5,807 $5,965
$6,290$6,550 $6,691
32.1
33.433.8
34.5
35.4
36.0
30
31
32
33
34
35
36
37
$3,000
$3,500
$4,000
$4,500
$5,000
$5,500
$6,000
$6,500
$7,000
2011 2012 2013 2014 2015 2016
Total spending (left axis)
Total visitors (right axis)
Visitation and visitor spending in KansasMillions
Source: Tourism Economics
Millions
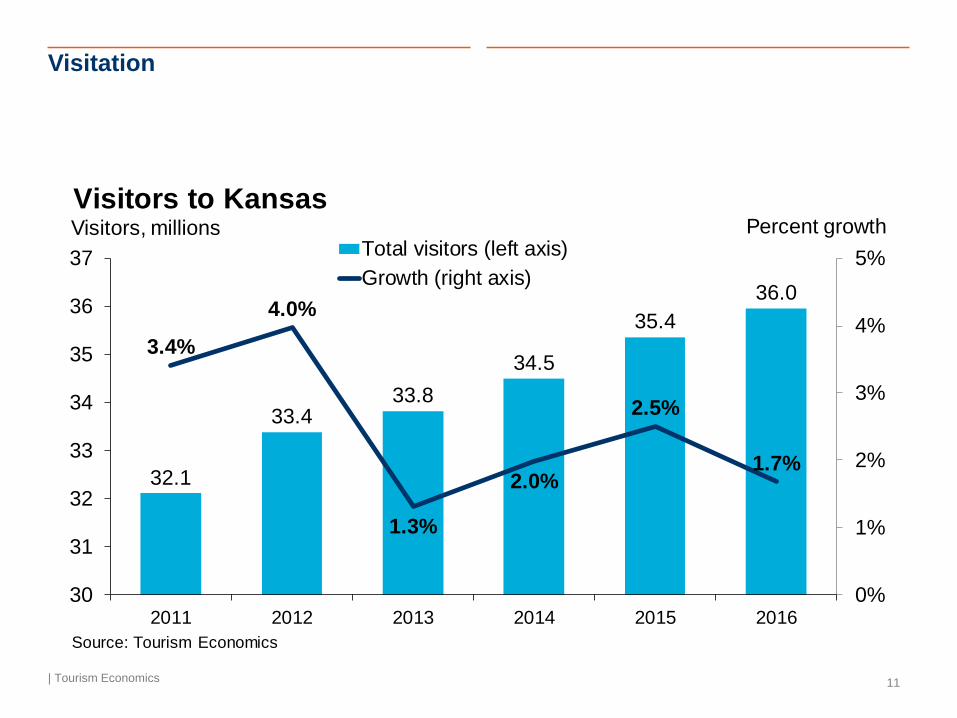
Visitation
| Tourism Economics 11
32.1
33.433.8
34.5
35.4
36.0
3.4%
4.0%
1.3%
2.0%
2.5%
1.7%
0%
1%
2%
3%
4%
5%
30
31
32
33
34
35
36
37
2011 2012 2013 2014 2015 2016
Total visitors (left axis)
Growth (right axis)
Visitors to KansasVisitors, millions
Source: Tourism Economics
Percent growth
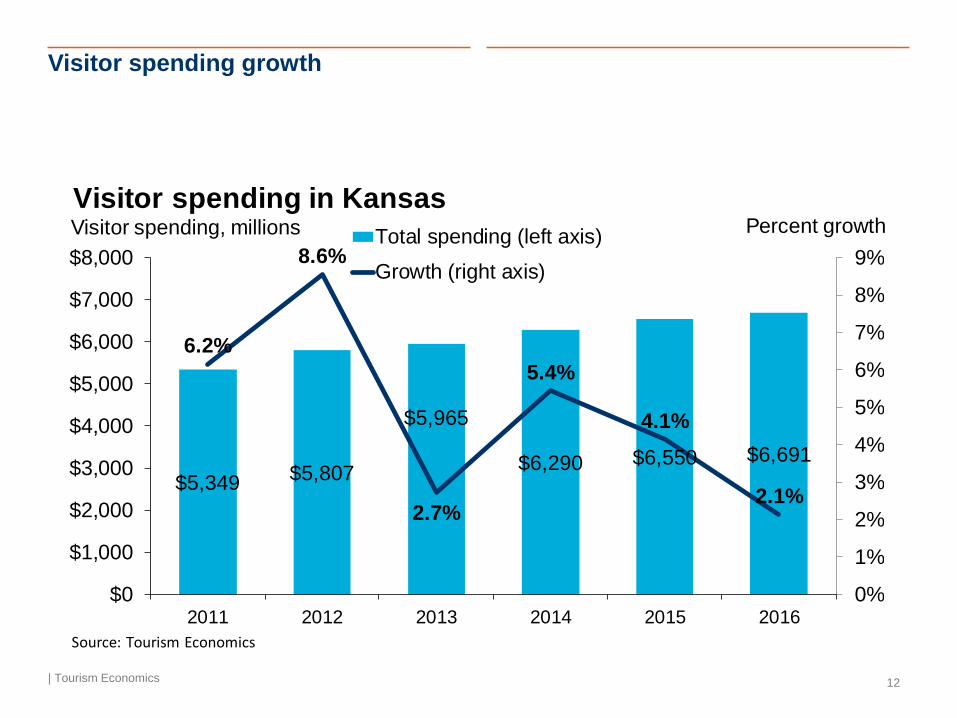
Visitor spending growth
| Tourism Economics 12
$5,349 $5,807
$5,965
$6,290 $6,550 $6,691
6.2%
8.6%
2.7%
5.4%
4.1%
2.1%
0%
1%
2%
3%
4%
5%
6%
7%
8%
9%
$0
$1,000
$2,000
$3,000
$4,000
$5,000
$6,000
$7,000
$8,000
2011 2012 2013 2014 2015 2016
Total spending (left axis)
Growth (right axis)
Visitor spending in KansasVisitor spending, millions
Source: Tourism Economics
Percent growth
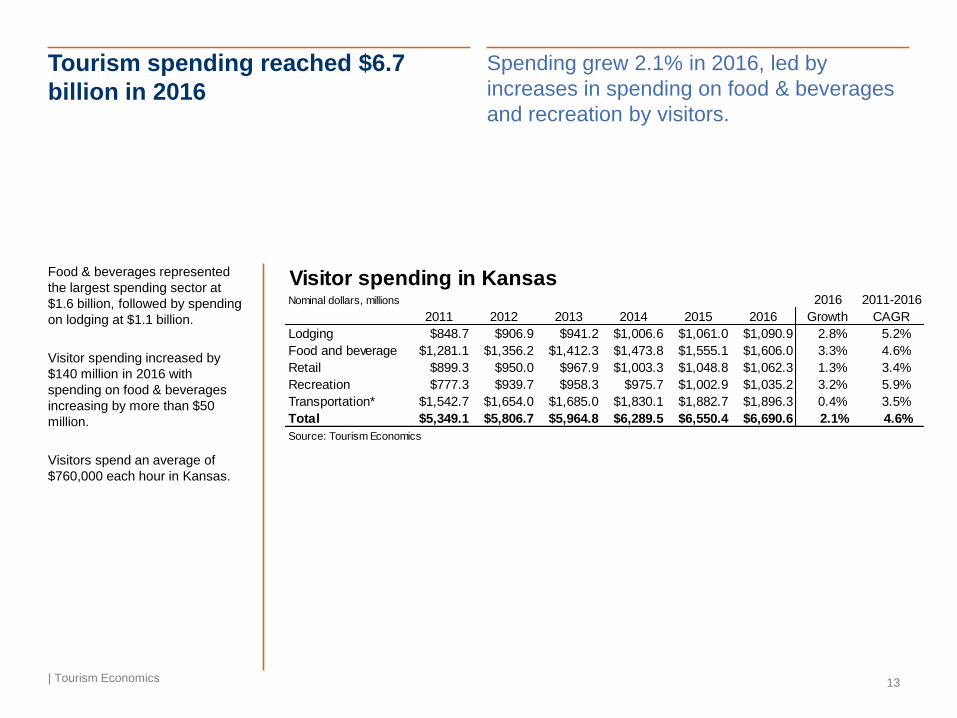
Tourism spending reached $6.7
billion in 2016
| Tourism Economics 13
Spending grew 2.1% in 2016, led by
increases in spending on food & beverages
and recreation by visitors.
Food & beverages represented
the largest spending sector at
$1.6 billion, followed by spending
on lodging at $1.1 billion.
Visitor spending increased by
$140 million in 2016 with
spending on food & beverages
increasing by more than $50
million.
Visitors spend an average of
$760,000 each hour in Kansas.
Visitor spending in KansasNominal dollars, millions 2016 2011-2016
2011 2012 2013 2014 2015 2016 Growth CAGR
Lodging $848.7 $906.9 $941.2 $1,006.6 $1,061.0 $1,090.9 2.8% 5.2%
Food and beverage $1,281.1 $1,356.2 $1,412.3 $1,473.8 $1,555.1 $1,606.0 3.3% 4.6%
Retail $899.3 $950.0 $967.9 $1,003.3 $1,048.8 $1,062.3 1.3% 3.4%
Recreation $777.3 $939.7 $958.3 $975.7 $1,002.9 $1,035.2 3.2% 5.9%
Transportation* $1,542.7 $1,654.0 $1,685.0 $1,830.1 $1,882.7 $1,896.3 0.4% 3.5%
Total $5,349.1 $5,806.7 $5,964.8 $6,289.5 $6,550.4 $6,690.6 2.1% 4.6%
Source: Tourism Economics
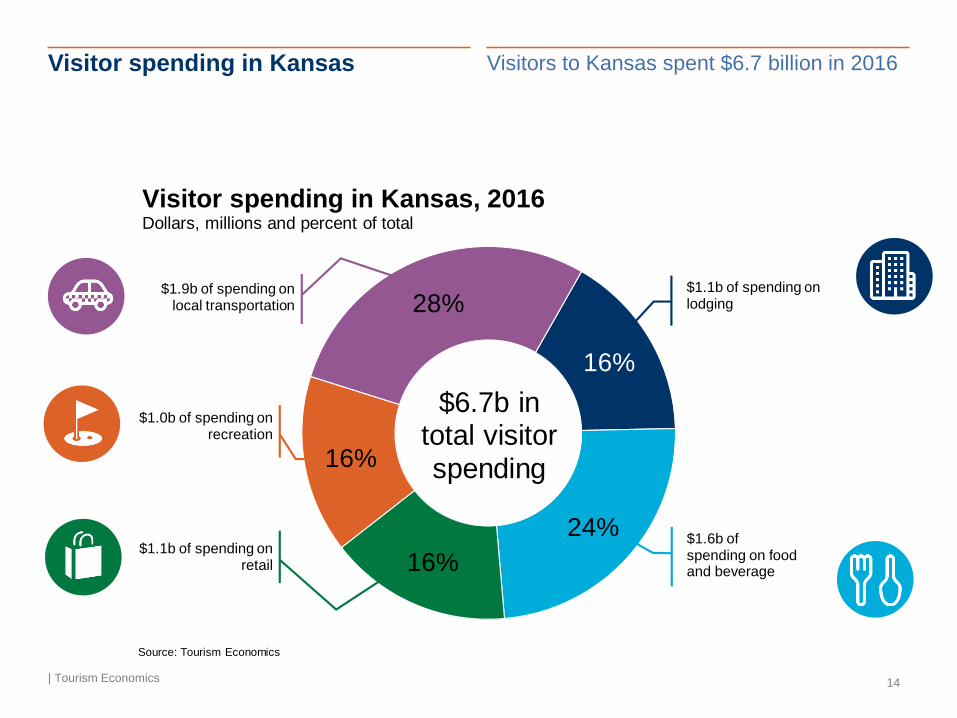
Visitor spending in Kansas
| Tourism Economics 14
Visitors to Kansas spent $6.7 billion in 2016
16%
24%
16%
16%
28%
Source: Tourism Economics
$1.1b of spending on lodging
$6.7b in total visitor spending
$1.6b of spending on food and beverage
$1.9b of spending on local transportation
$1.0b of spending on recreation
Visitor spending in Kansas, 2016Dollars, millions and percent of total
$1.1b of spending on retail
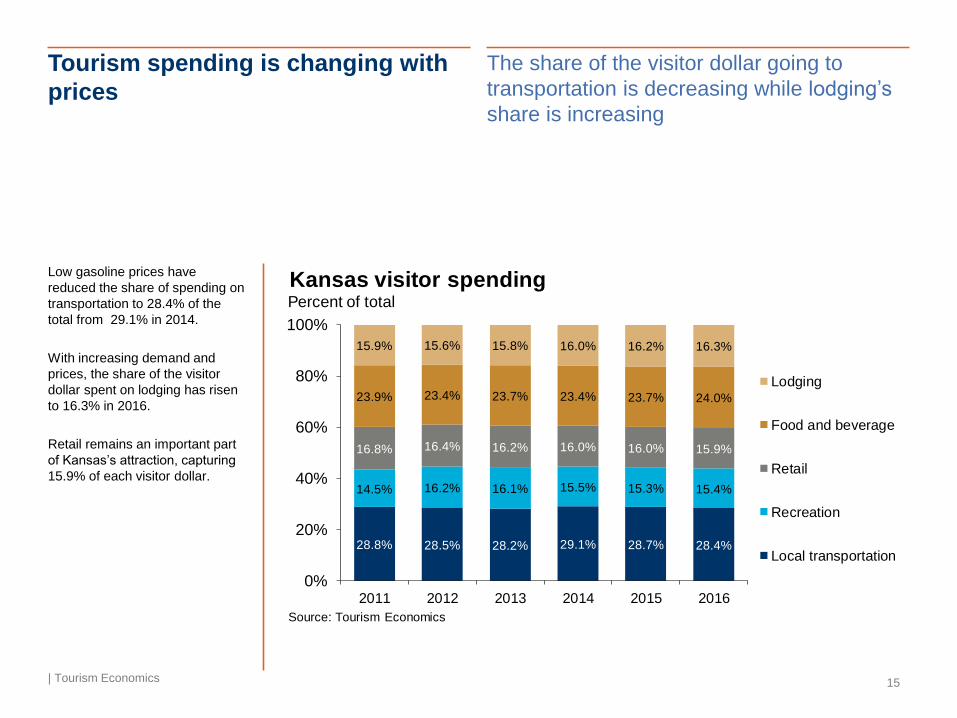
Tourism spending is changing with
prices
| Tourism Economics 15
The share of the visitor dollar going to
transportation is decreasing while lodging’s
share is increasing
Low gasoline prices have
reduced the share of spending on
transportation to 28.4% of the
total from 29.1% in 2014.
With increasing demand and
prices, the share of the visitor
dollar spent on lodging has risen
to 16.3% in 2016.
Retail remains an important part
of Kansas’s attraction, capturing
15.9% of each visitor dollar.
28.8% 28.5% 28.2% 29.1% 28.7% 28.4%
14.5% 16.2% 16.1% 15.5% 15.3% 15.4%
16.8% 16.4% 16.2% 16.0% 16.0% 15.9%
23.9% 23.4% 23.7% 23.4% 23.7% 24.0%
15.9% 15.6% 15.8% 16.0% 16.2% 16.3%
0%
20%
40%
60%
80%
100%
2011 2012 2013 2014 2015 2016
Lodging
Food and beverage
Retail
Recreation
Local transportation
Kansas visitor spendingPercent of total
Source: Tourism Economics
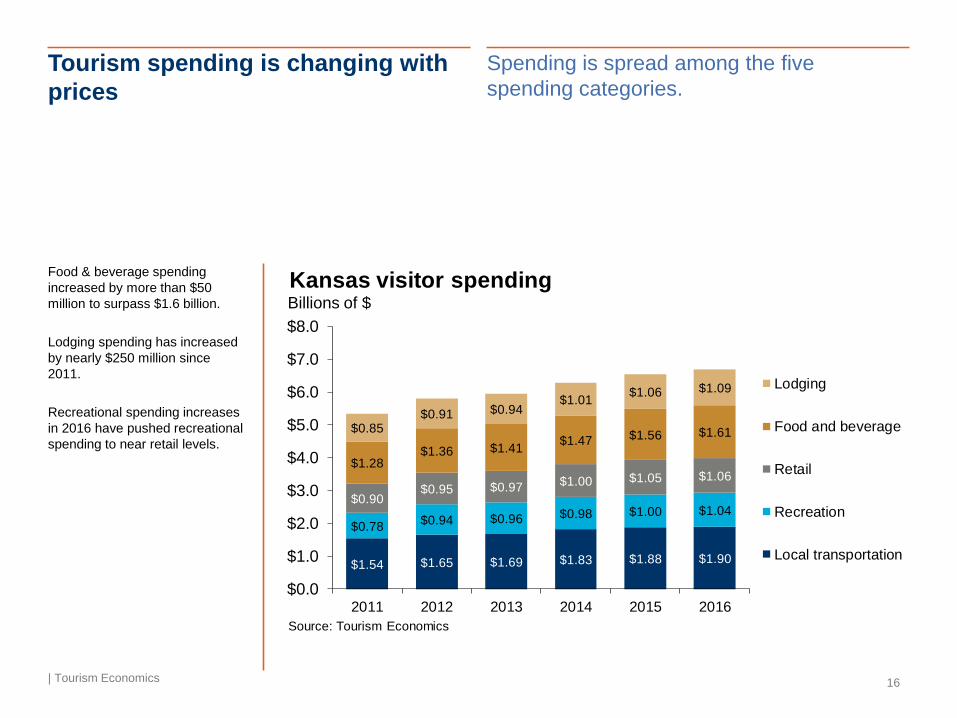
Tourism spending is changing with
prices
| Tourism Economics 16
Spending is spread among the five
spending categories.
Food & beverage spending
increased by more than $50
million to surpass $1.6 billion.
Lodging spending has increased
by nearly $250 million since
2011.
Recreational spending increases
in 2016 have pushed recreational
spending to near retail levels.
$1.54 $1.65 $1.69 $1.83 $1.88 $1.90
$0.78$0.94 $0.96 $0.98 $1.00 $1.04
$0.90$0.95 $0.97 $1.00 $1.05 $1.06
$1.28$1.36 $1.41
$1.47 $1.56 $1.61$0.85$0.91 $0.94
$1.01$1.06 $1.09
$0.0
$1.0
$2.0
$3.0
$4.0
$5.0
$6.0
$7.0
$8.0
2011 2012 2013 2014 2015 2016
Lodging
Food and beverage
Retail
Recreation
Local transportation
Kansas visitor spendingBillions of $
Source: Tourism Economics
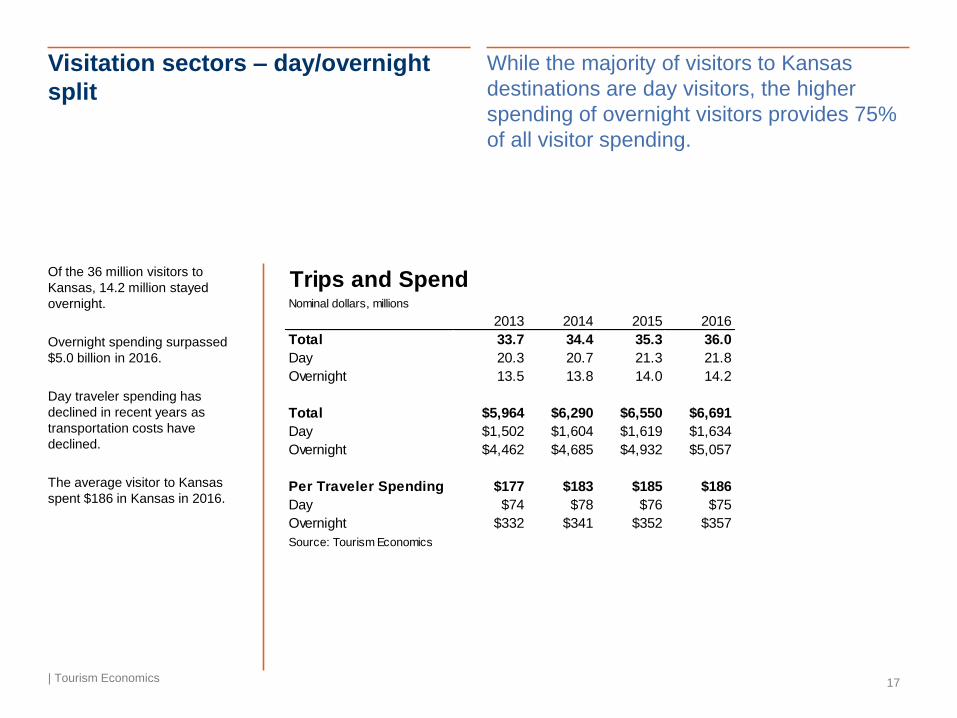
Visitation sectors – day/overnight
split
| Tourism Economics 17
While the majority of visitors to Kansas
destinations are day visitors, the higher
spending of overnight visitors provides 75%
of all visitor spending.
Of the 36 million visitors to
Kansas, 14.2 million stayed
overnight.
Overnight spending surpassed
$5.0 billion in 2016.
Day traveler spending has
declined in recent years as
transportation costs have
declined.
The average visitor to Kansas
spent $186 in Kansas in 2016.
Trips and SpendNominal dollars, millions
2013 2014 2015 2016
Total 33.7 34.4 35.3 36.0
Day 20.3 20.7 21.3 21.8
Overnight 13.5 13.8 14.0 14.2
Total $5,964 $6,290 $6,550 $6,691
Day $1,502 $1,604 $1,619 $1,634
Overnight $4,462 $4,685 $4,932 $5,057
Per Traveler Spending $177 $183 $185 $186
Day $74 $78 $76 $75
Overnight $332 $341 $352 $357
Source: Tourism Economics
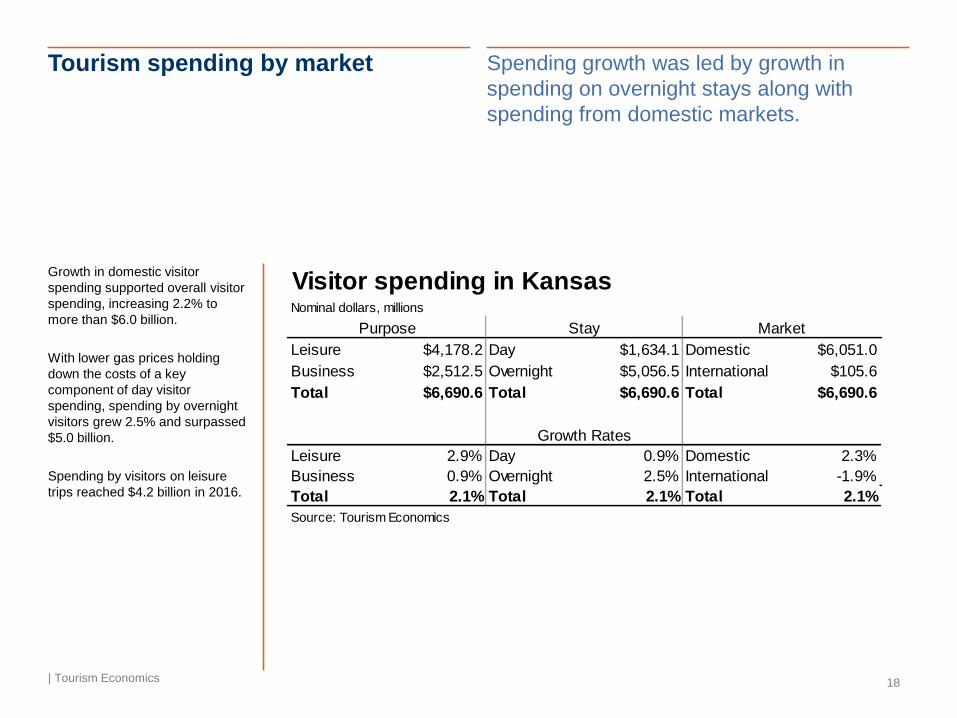
Tourism spending by market
| Tourism Economics 18
Spending growth was led by growth in
spending on overnight stays along with
spending from domestic markets.
Growth in domestic visitor
spending supported overall visitor
spending, increasing 2.2% to
more than $6.0 billion.
With lower gas prices holding
down the costs of a key
component of day visitor
spending, spending by overnight
visitors grew 2.5% and surpassed
$5.0 billion.
Spending by visitors on leisure
trips reached $4.2 billion in 2016.
Visitor spending in KansasNominal dollars, millions
Leisure $4,178.2 Day $1,634.1 Domestic $6,051.0
Business $2,512.5 Overnight $5,056.5 International $105.6
Total $6,690.6 Total $6,690.6 Total $6,690.6
Leisure 2.9% Day 0.9% Domestic 2.3%
Business 0.9% Overnight 2.5% International -1.9%
Total 2.1% Total 2.1% Total 2.1%
Source: Tourism Economics
Purpose Stay Market
Growth Rates
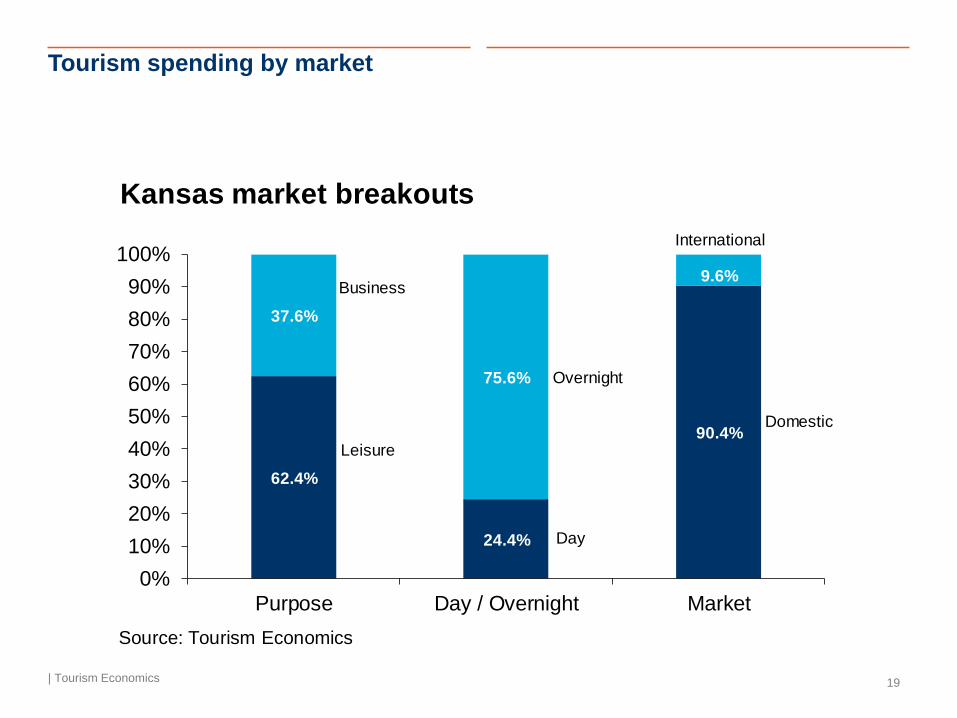
Tourism spending by market
| Tourism Economics 19
62.4%
24.4%
90.4%
37.6%
75.6%
9.6%
0%
10%
20%
30%
40%
50%
60%
70%
80%
90%
100%
Purpose Day / Overnight Market
Kansas market breakouts
Business
Source: Tourism Economics
Leisure
Overnight
Day
International
Domestic
3) The Tourism Satellite Account
Tourism industry & economy sales
| Tourism Economics 21
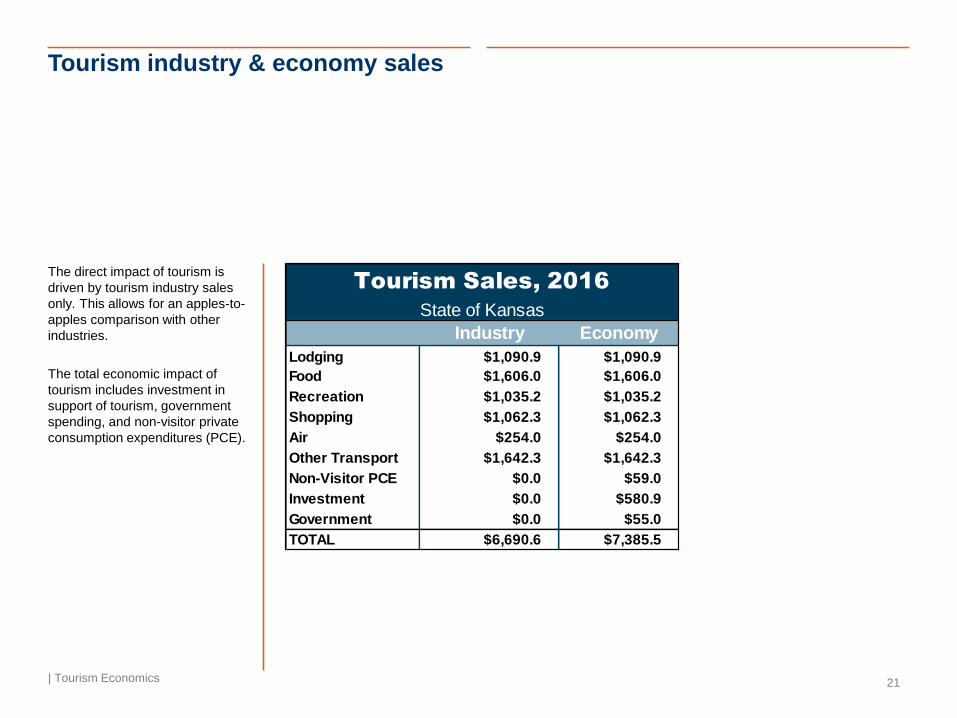
The direct impact of tourism is
driven by tourism industry sales
only. This allows for an apples-to-
apples comparison with other
industries.
The total economic impact of
tourism includes investment in
support of tourism, government
spending, and non-visitor private
consumption expenditures (PCE).
Industry Economy
Lodging $1,090.9 $1,090.9
Food $1,606.0 $1,606.0
Recreation $1,035.2 $1,035.2
Shopping $1,062.3 $1,062.3
Air $254.0 $254.0
Other Transport $1,642.3 $1,642.3
Non-Visitor PCE $0.0 $59.0
Investment $0.0 $580.9
Government $0.0 $55.0
TOTAL $6,690.6 $7,385.5
Tourism Sales, 2016
State of Kansas
Tourism economy sales
| Tourism Economics 22
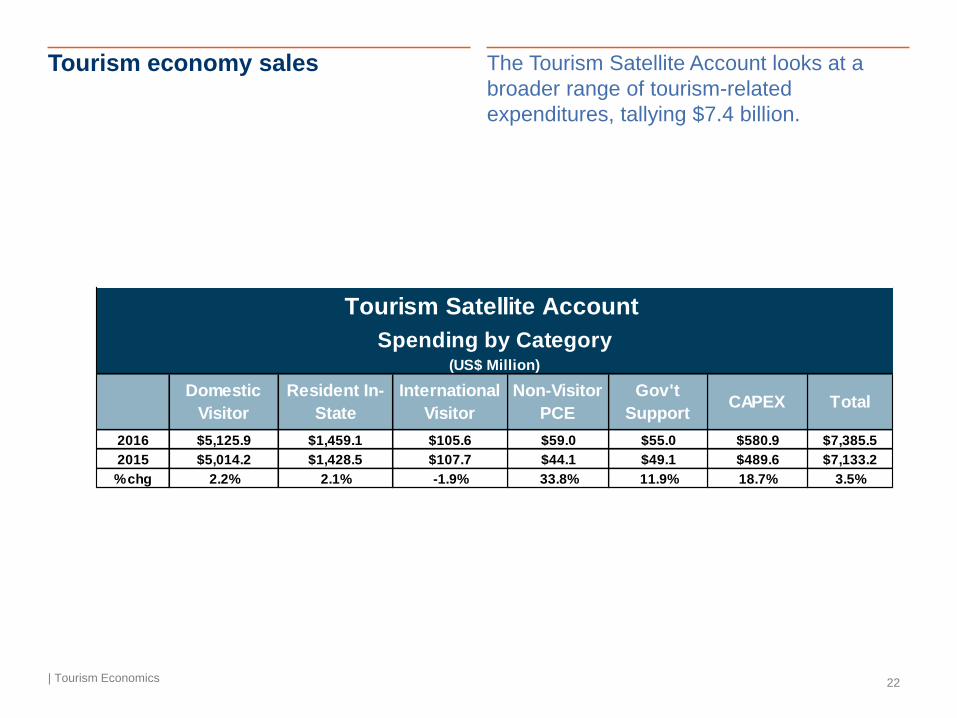
The Tourism Satellite Account looks at a
broader range of tourism-related
expenditures, tallying $7.4 billion.
Domestic
Visitor
Resident In-
State
International
Visitor
Non-Visitor
PCE
Gov't
SupportCAPEX Total
2016 $5,125.9 $1,459.1 $105.6 $59.0 $55.0 $580.9 $7,385.5
2015 $5,014.2 $1,428.5 $107.7 $44.1 $49.1 $489.6 $7,133.2
% chg 2.2% 2.1% -1.9% 33.8% 11.9% 18.7% 3.5%
Tourism Satellite Account
Spending by Category(US$ Million)
Tourism economy sales
| Tourism Economics 23
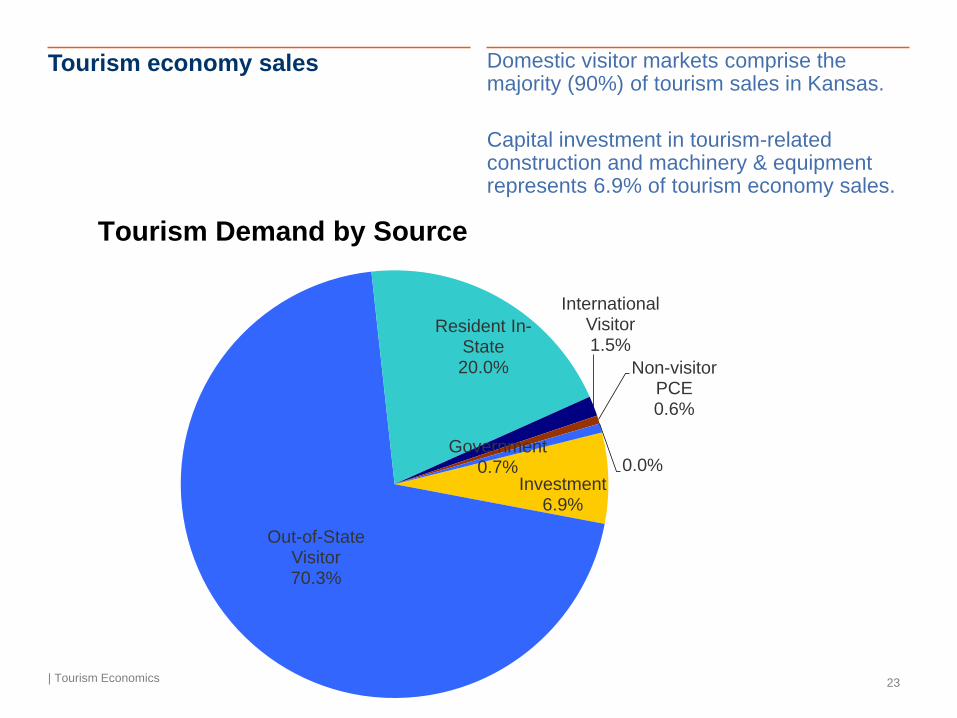
Domestic visitor markets comprise the majority (90%) of tourism sales in Kansas.
Capital investment in tourism-related construction and machinery & equipment represents 6.9% of tourism economy sales.
Investment6.9%
Out-of-State Visitor70.3%
Resident In-State20.0%
International Visitor1.5%
Non-visitor PCE0.6%
0.0%Government
0.7%
Tourism Demand by Source
4) The Economic Impact of Tourism
How tourism generates impact
| Tourism Economics 25
Tourism spending flows through the
economy and generates economic benefit
through multiple channels
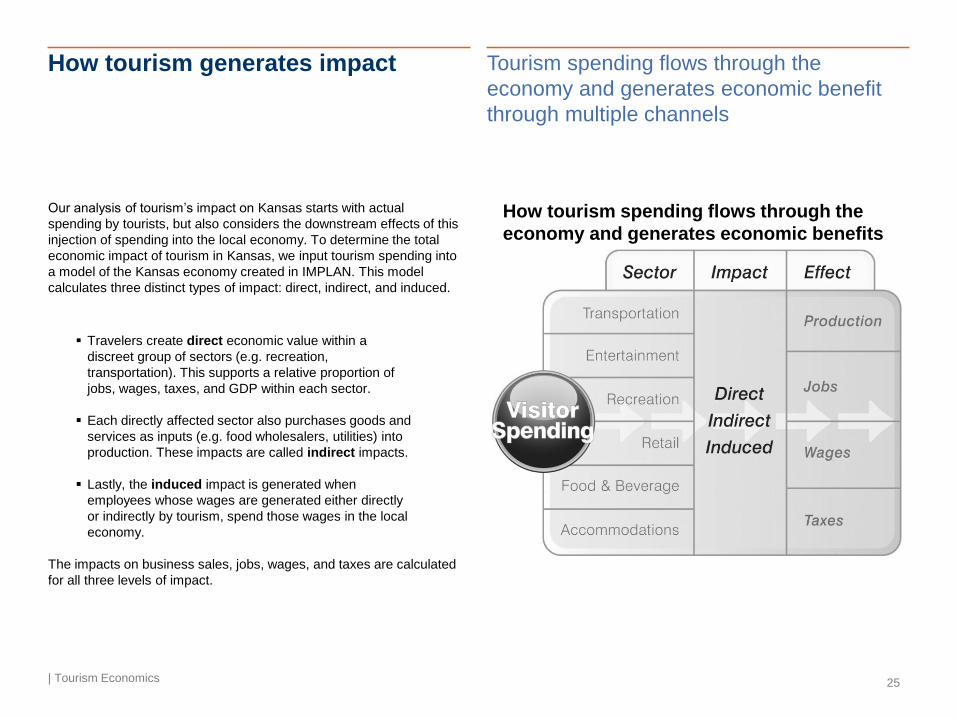
Our analysis of tourism’s impact on Kansas starts with actual
spending by tourists, but also considers the downstream effects of this
injection of spending into the local economy. To determine the total
economic impact of tourism in Kansas, we input tourism spending into
a model of the Kansas economy created in IMPLAN. This model
calculates three distinct types of impact: direct, indirect, and induced.
How tourism spending flows through the
economy and generates economic benefits
▪ Travelers create direct economic value within a
discreet group of sectors (e.g. recreation,
transportation). This supports a relative proportion of
jobs, wages, taxes, and GDP within each sector.
▪ Each directly affected sector also purchases goods and
services as inputs (e.g. food wholesalers, utilities) into
production. These impacts are called indirect impacts.
▪ Lastly, the induced impact is generated when
employees whose wages are generated either directly
or indirectly by tourism, spend those wages in the local
economy.
The impacts on business sales, jobs, wages, and taxes are calculated
for all three levels of impact.
Tourism impact summary - GDP
| Tourism Economics 26
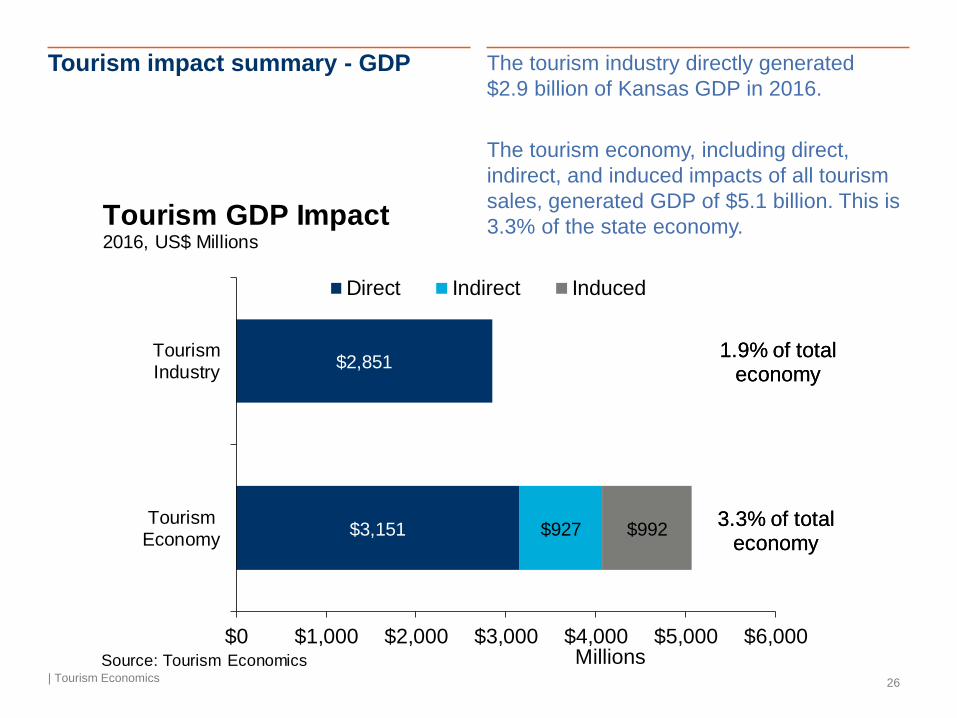
The tourism industry directly generated
$2.9 billion of Kansas GDP in 2016.
The tourism economy, including direct,
indirect, and induced impacts of all tourism
sales, generated GDP of $5.1 billion. This is
3.3% of the state economy.
$3,151
$2,851
$927 $992
$0 $1,000 $2,000 $3,000 $4,000 $5,000 $6,000
TourismEconomy
TourismIndustry
Direct Indirect Induced
Tourism GDP Impact2016, US$ Millions
MillionsSource: Tourism Economics
3.3% of total economy
1.9% of total economy
Source: Tourism Economics
3.3% of total economy
1.9% of total economy
Tourism impact summary - jobs
| Tourism Economics 27
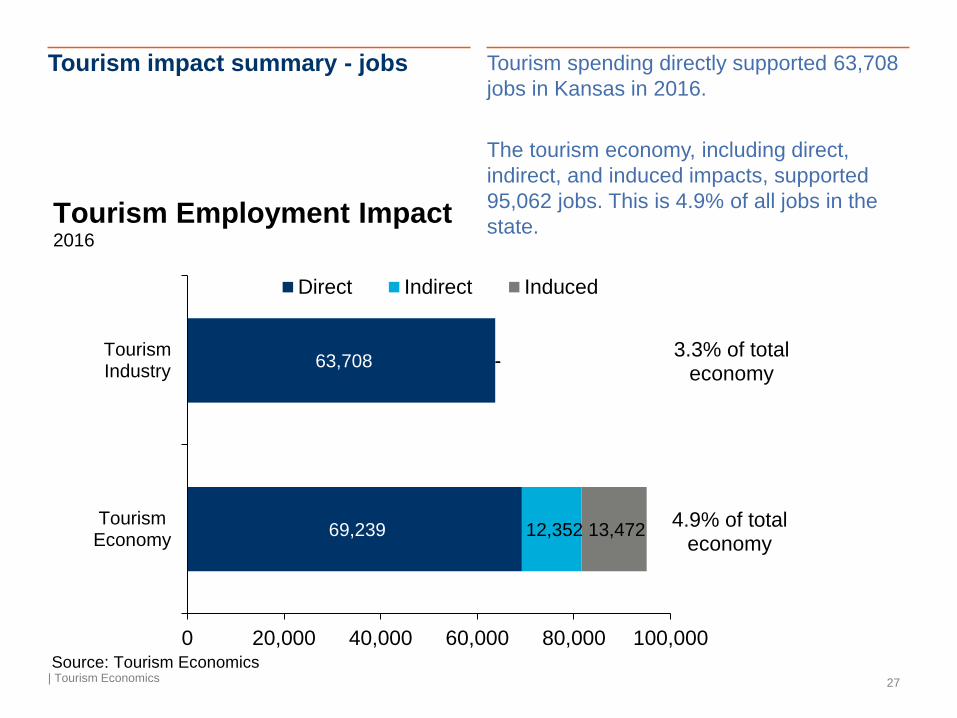
Tourism spending directly supported 63,708
jobs in Kansas in 2016.
The tourism economy, including direct,
indirect, and induced impacts, supported
95,062 jobs. This is 4.9% of all jobs in the
state.
69,239
63,708
12,352
-
13,472
-
0 20,000 40,000 60,000 80,000 100,000
TourismEconomy
TourismIndustry
Direct Indirect Induced
Tourism Employment Impact2016
Source: Tourism Economics
4.9% of total economy
3.3% of total economy
Tourism industry impacts
| Tourism Economics 28
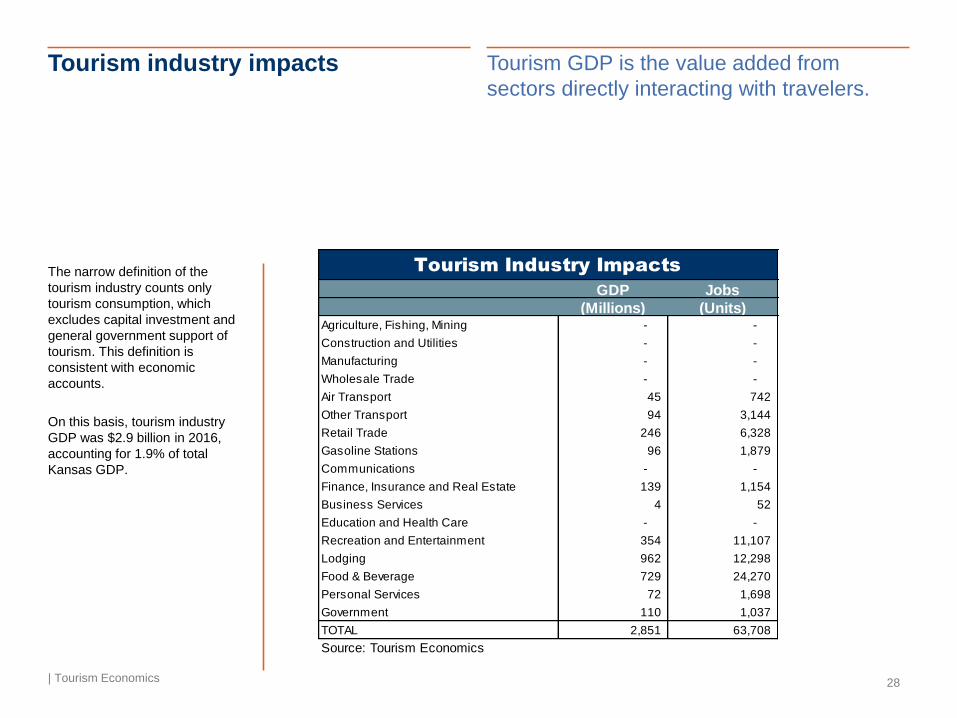
Tourism GDP is the value added from
sectors directly interacting with travelers.
The narrow definition of the
tourism industry counts only
tourism consumption, which
excludes capital investment and
general government support of
tourism. This definition is
consistent with economic
accounts.
On this basis, tourism industry
GDP was $2.9 billion in 2016,
accounting for 1.9% of total
Kansas GDP.
GDP Jobs
(Millions) (Units)Agriculture, Fishing, Mining - -
Construction and Utilities - -
Manufacturing - -
Wholesale Trade - -
Air Transport 45 742
Other Transport 94 3,144
Retail Trade 246 6,328
Gasoline Stations 96 1,879
Communications - -
Finance, Insurance and Real Estate 139 1,154
Business Services 4 52
Education and Health Care - -
Recreation and Entertainment 354 11,107
Lodging 962 12,298
Food & Beverage 729 24,270
Personal Services 72 1,698
Government 110 1,037
TOTAL 2,851 63,708
Source: Tourism Economics
Tourism Industry Impacts
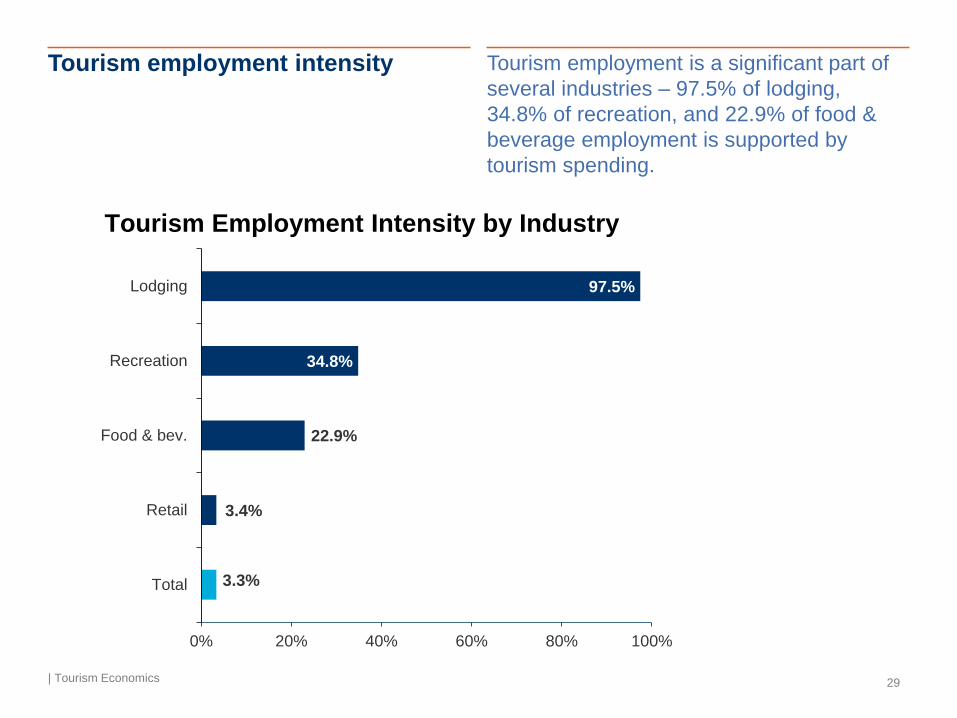
Tourism employment intensity
| Tourism Economics 29
Tourism employment is a significant part of
several industries – 97.5% of lodging,
34.8% of recreation, and 22.9% of food &
beverage employment is supported by
tourism spending.
3.3%
3.4%
22.9%
34.8%
97.5%
0% 20% 40% 60% 80% 100%
Total
Retail
Food & bev.
Recreation
Lodging
Tourism Employment Intensity by Industry
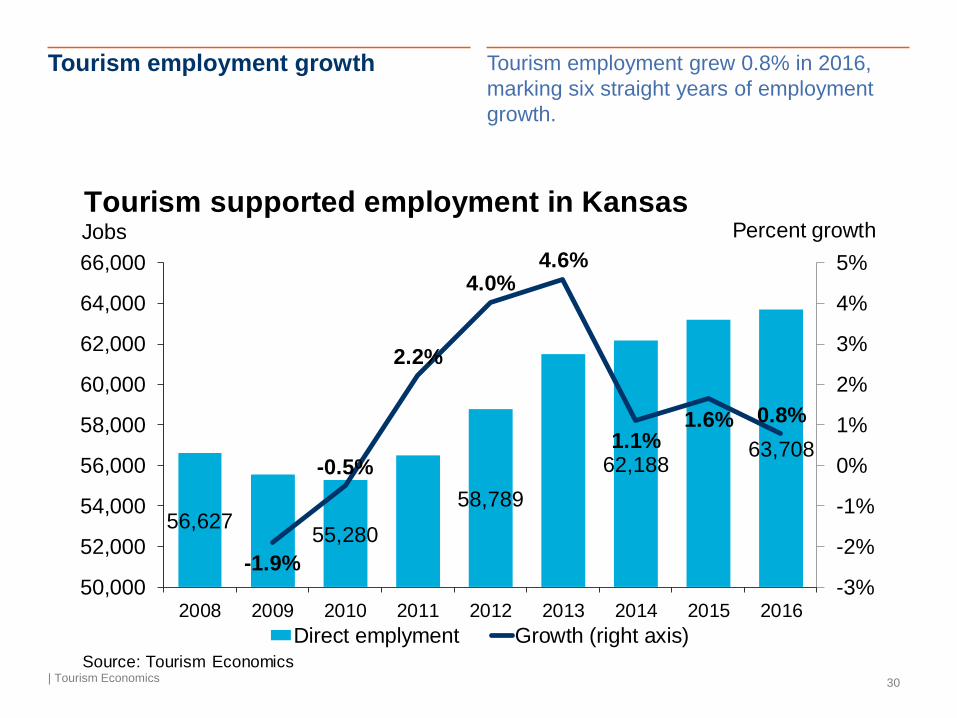
Tourism employment growth
| Tourism Economics 30
Tourism employment grew 0.8% in 2016,
marking six straight years of employment
growth.
56,62755,280
58,789
62,18863,708
-1.9%
-0.5%
2.2%
4.0%4.6%
1.1%1.6% 0.8%
-3%
-2%
-1%
0%
1%
2%
3%
4%
5%
50,000
52,000
54,000
56,000
58,000
60,000
62,000
64,000
66,000
2008 2009 2010 2011 2012 2013 2014 2015 2016
Direct emplyment Growth (right axis)
Tourism supported employment in KansasJobs
Source: Tourism Economics
Percent growth
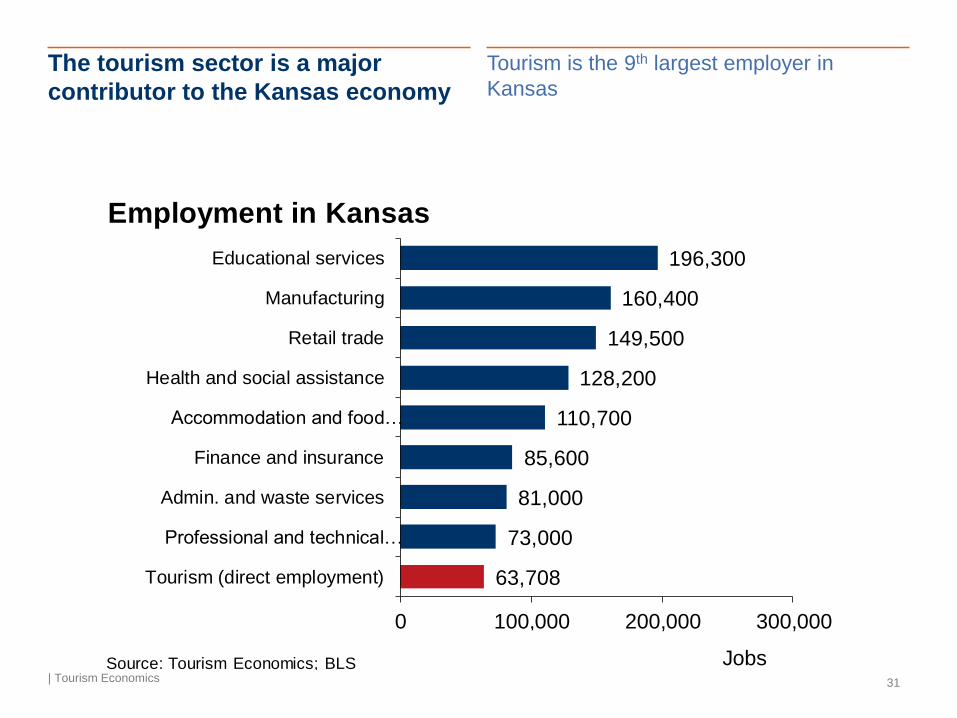
The tourism sector is a major
contributor to the Kansas economy
| Tourism Economics 31
Tourism is the 9th largest employer in
Kansas
196,300
160,400
149,500
128,200
110,700
85,600
81,000
73,000
63,708
0 100,000 200,000 300,000
Educational services
Manufacturing
Retail trade
Health and social assistance
Accommodation and food…
Finance and insurance
Admin. and waste services
Professional and technical…
Tourism (direct employment)
Employment in Kansas
JobsSource: Tourism Economics; BLS
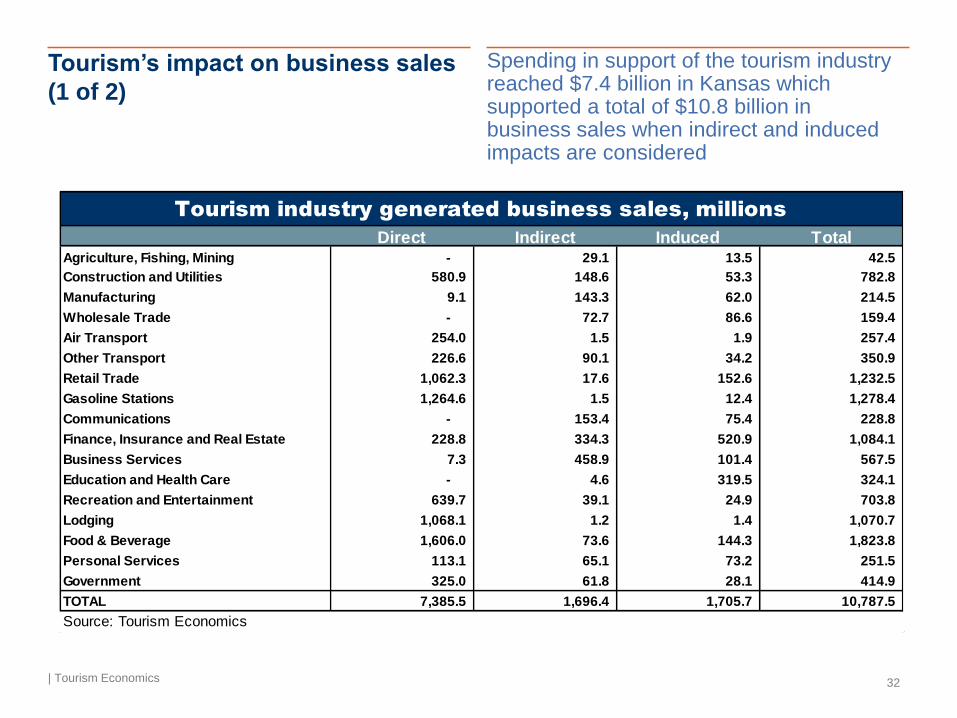
Tourism’s impact on business sales
(1 of 2)
| Tourism Economics 32
Spending in support of the tourism industry reached $7.4 billion in Kansas which supported a total of $10.8 billion in business sales when indirect and induced impacts are considered
Direct Indirect Induced TotalAgriculture, Fishing, Mining - 29.1 13.5 42.5
Construction and Utilities 580.9 148.6 53.3 782.8
Manufacturing 9.1 143.3 62.0 214.5
Wholesale Trade - 72.7 86.6 159.4
Air Transport 254.0 1.5 1.9 257.4
Other Transport 226.6 90.1 34.2 350.9
Retail Trade 1,062.3 17.6 152.6 1,232.5
Gasoline Stations 1,264.6 1.5 12.4 1,278.4
Communications - 153.4 75.4 228.8
Finance, Insurance and Real Estate 228.8 334.3 520.9 1,084.1
Business Services 7.3 458.9 101.4 567.5
Education and Health Care - 4.6 319.5 324.1
Recreation and Entertainment 639.7 39.1 24.9 703.8
Lodging 1,068.1 1.2 1.4 1,070.7
Food & Beverage 1,606.0 73.6 144.3 1,823.8
Personal Services 113.1 65.1 73.2 251.5
Government 325.0 61.8 28.1 414.9
TOTAL 7,385.5 1,696.4 1,705.7 10,787.5
Source: Tourism Economics
Tourism industry generated business sales, millions
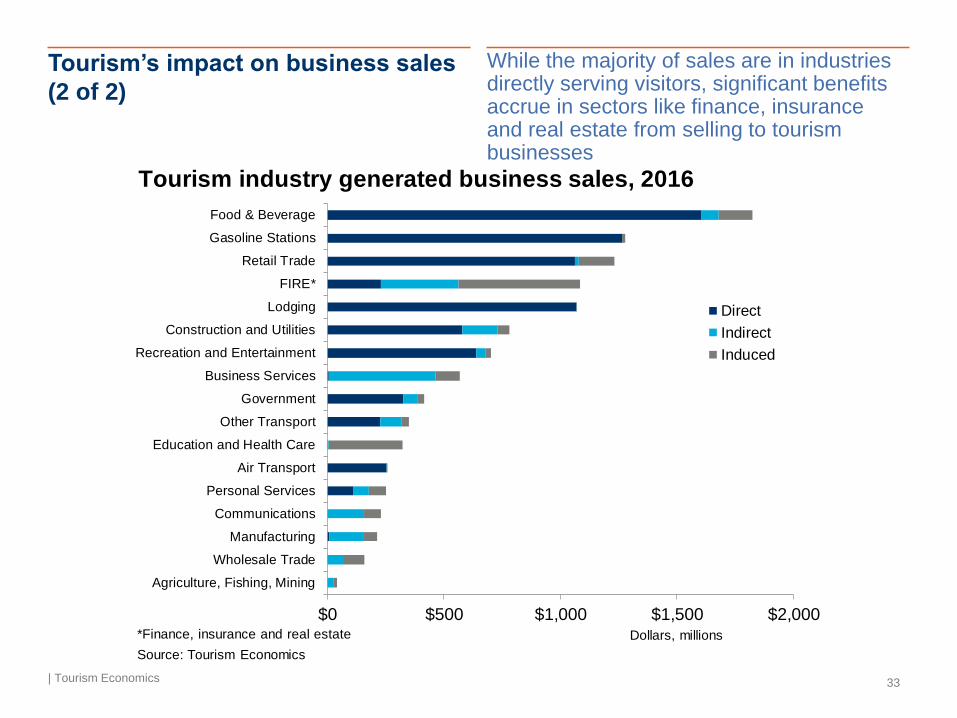
Tourism’s impact on business sales
(2 of 2)
| Tourism Economics 33
While the majority of sales are in industries directly serving visitors, significant benefits accrue in sectors like finance, insurance and real estate from selling to tourism businesses
Food & Beverage
Gasoline Stations
Retail Trade
FIRE*
Lodging
Construction and Utilities
Recreation and Entertainment
Business Services
Government
Other Transport
Education and Health Care
Air Transport
Personal Services
Communications
Manufacturing
Wholesale Trade
Agriculture, Fishing, Mining
$0 $500 $1,000 $1,500 $2,000
Direct
Indirect
Induced
Tourism industry generated business sales, 2016
Source: Tourism Economics
Dollars, millions*Finance, insurance and real estate
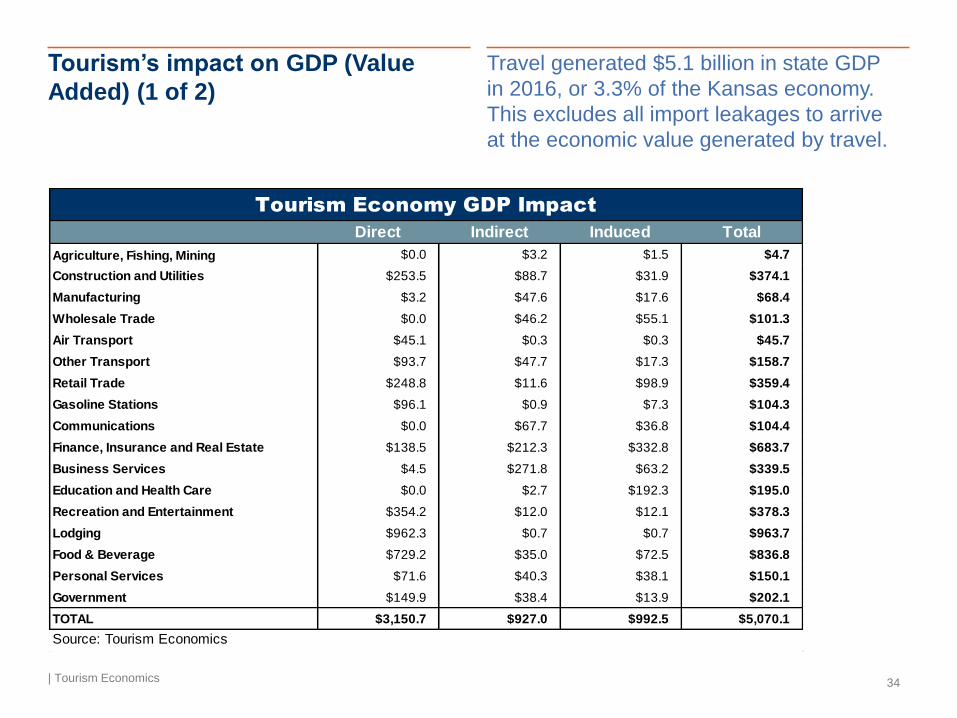
Tourism’s impact on GDP (Value
Added) (1 of 2)
| Tourism Economics 34
Travel generated $5.1 billion in state GDP
in 2016, or 3.3% of the Kansas economy.
This excludes all import leakages to arrive
at the economic value generated by travel.
Direct Indirect Induced Total
Agriculture, Fishing, Mining $0.0 $3.2 $1.5 $4.7
Construction and Utilities $253.5 $88.7 $31.9 $374.1
Manufacturing $3.2 $47.6 $17.6 $68.4
Wholesale Trade $0.0 $46.2 $55.1 $101.3
Air Transport $45.1 $0.3 $0.3 $45.7
Other Transport $93.7 $47.7 $17.3 $158.7
Retail Trade $248.8 $11.6 $98.9 $359.4
Gasoline Stations $96.1 $0.9 $7.3 $104.3
Communications $0.0 $67.7 $36.8 $104.4
Finance, Insurance and Real Estate $138.5 $212.3 $332.8 $683.7
Business Services $4.5 $271.8 $63.2 $339.5
Education and Health Care $0.0 $2.7 $192.3 $195.0
Recreation and Entertainment $354.2 $12.0 $12.1 $378.3
Lodging $962.3 $0.7 $0.7 $963.7
Food & Beverage $729.2 $35.0 $72.5 $836.8
Personal Services $71.6 $40.3 $38.1 $150.1
Government $149.9 $38.4 $13.9 $202.1
TOTAL $3,150.7 $927.0 $992.5 $5,070.1
Source: Tourism Economics
Tourism Economy GDP Impact
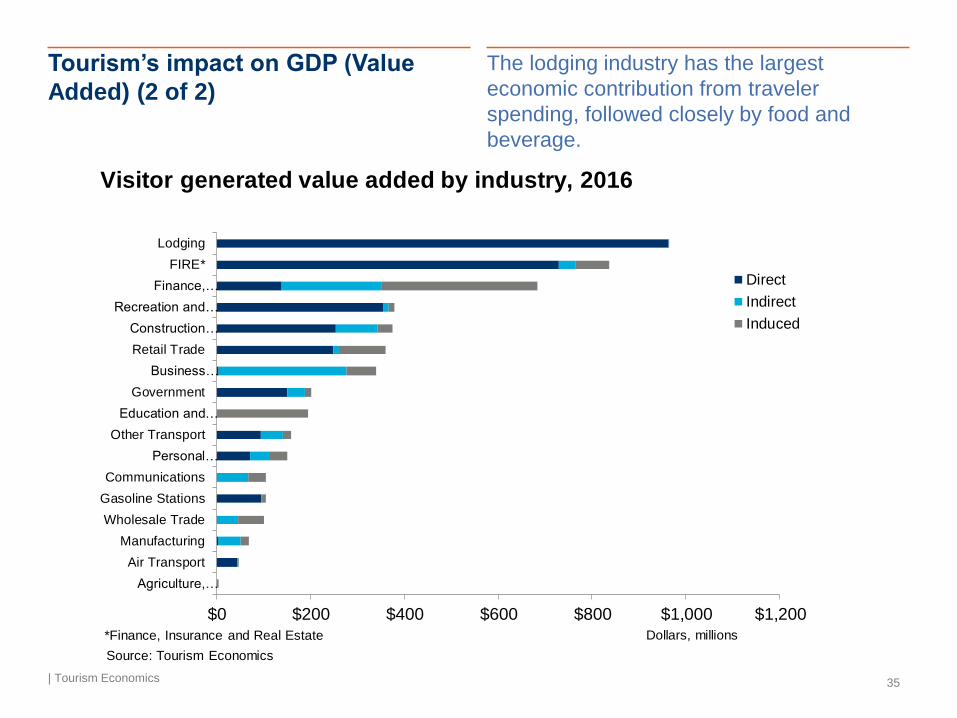
Tourism’s impact on GDP (Value
Added) (2 of 2)
| Tourism Economics 35
The lodging industry has the largest
economic contribution from traveler
spending, followed closely by food and
beverage.
Lodging
FIRE*
Finance,…
Recreation and…
Construction…
Retail Trade
Business…
Government
Education and…
Other Transport
Personal…
Communications
Gasoline Stations
Wholesale Trade
Manufacturing
Air Transport
Agriculture,…
$0 $200 $400 $600 $800 $1,000 $1,200
Direct
Indirect
Induced
Visitor generated value added by industry, 2016
Source: Tourism Economics
Dollars, millions*Finance, Insurance and Real Estate
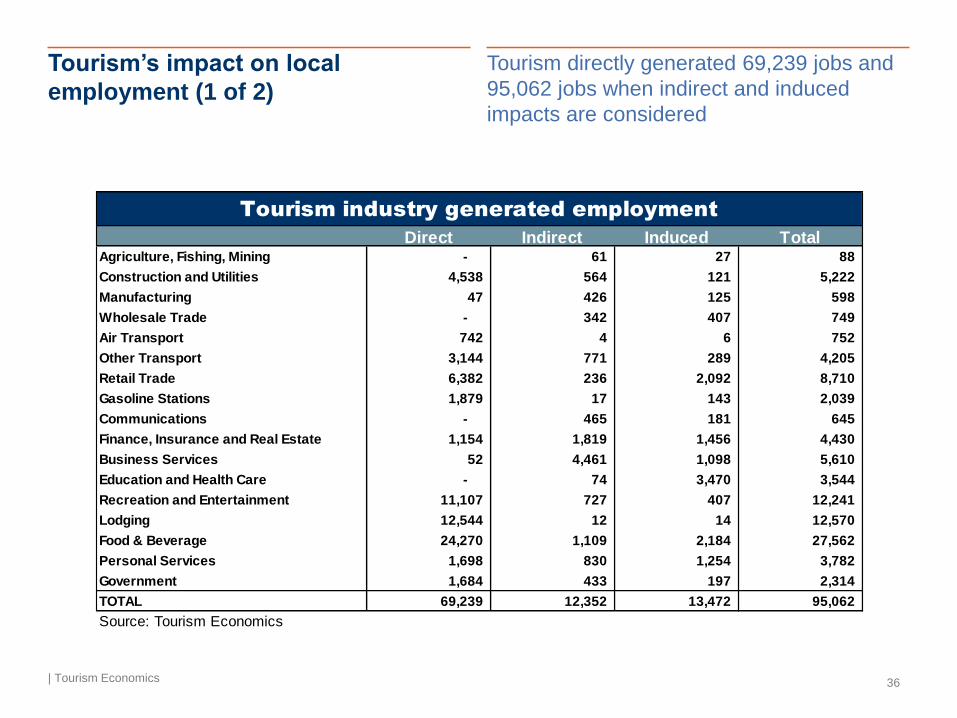
Tourism’s impact on local
employment (1 of 2)
| Tourism Economics 36
Tourism directly generated 69,239 jobs and
95,062 jobs when indirect and induced
impacts are considered
Direct Indirect Induced TotalAgriculture, Fishing, Mining - 61 27 88
Construction and Utilities 4,538 564 121 5,222
Manufacturing 47 426 125 598
Wholesale Trade - 342 407 749
Air Transport 742 4 6 752
Other Transport 3,144 771 289 4,205
Retail Trade 6,382 236 2,092 8,710
Gasoline Stations 1,879 17 143 2,039
Communications - 465 181 645
Finance, Insurance and Real Estate 1,154 1,819 1,456 4,430
Business Services 52 4,461 1,098 5,610
Education and Health Care - 74 3,470 3,544
Recreation and Entertainment 11,107 727 407 12,241
Lodging 12,544 12 14 12,570
Food & Beverage 24,270 1,109 2,184 27,562
Personal Services 1,698 830 1,254 3,782
Government 1,684 433 197 2,314
TOTAL 69,239 12,352 13,472 95,062
Source: Tourism Economics
Tourism industry generated employment
Tourism’s impact on local
employment (2 of 2)
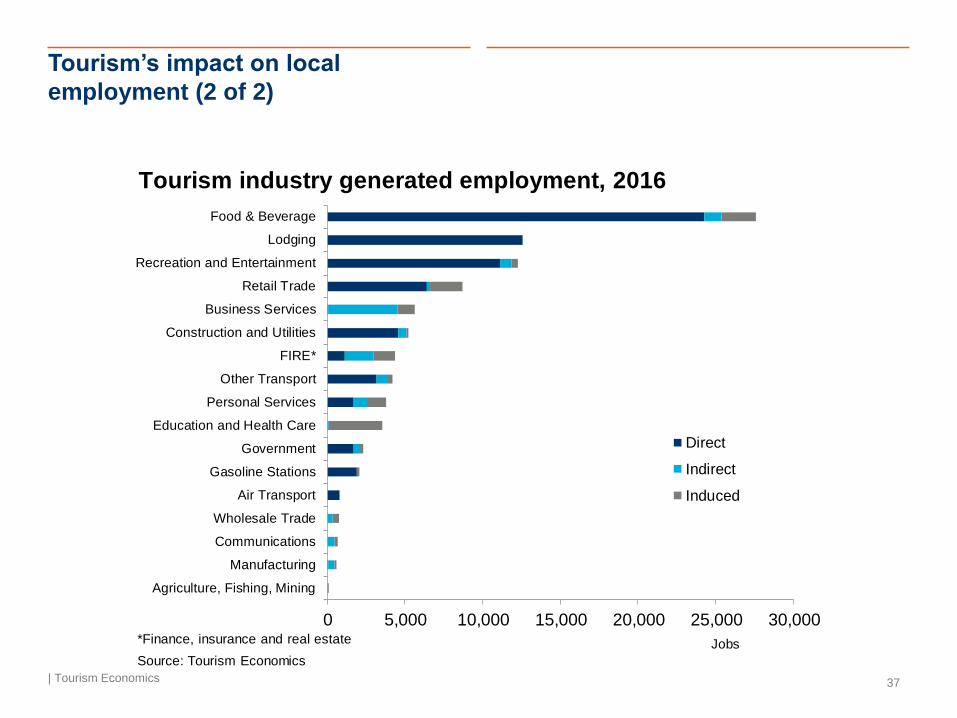
| Tourism Economics 37
Food & Beverage
Lodging
Recreation and Entertainment
Retail Trade
Business Services
Construction and Utilities
FIRE*
Other Transport
Personal Services
Education and Health Care
Government
Gasoline Stations
Air Transport
Wholesale Trade
Communications
Manufacturing
Agriculture, Fishing, Mining
0 5,000 10,000 15,000 20,000 25,000 30,000
Direct
Indirect
Induced
Tourism industry generated employment, 2016
Source: Tourism Economics
Jobs*Finance, insurance and real estate
Tourism’s impact on local income
(1 of 2)
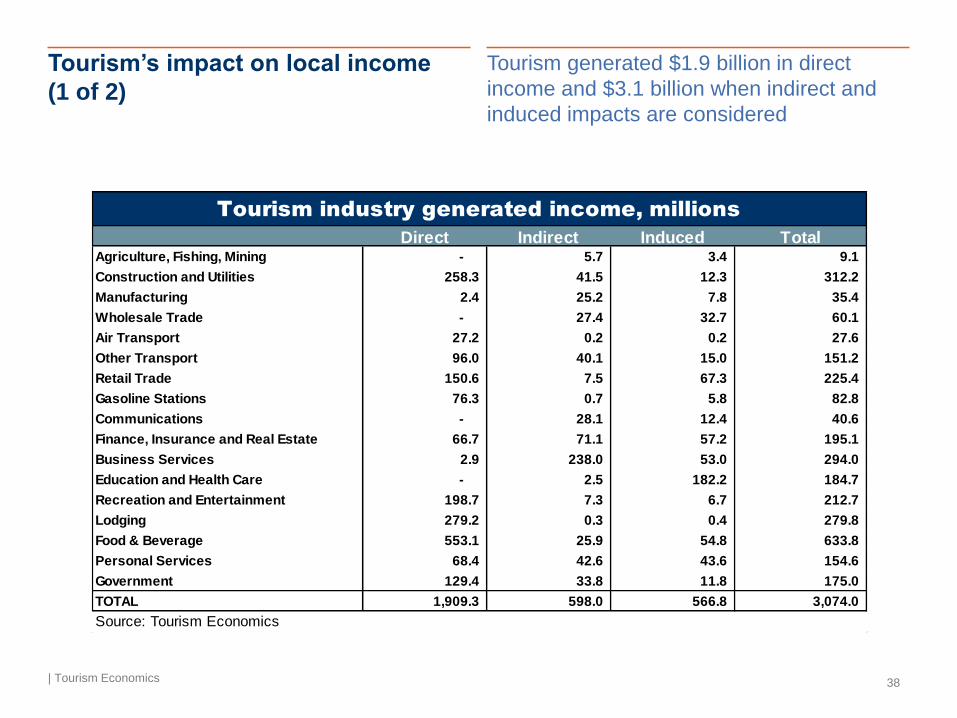
| Tourism Economics 38
Tourism generated $1.9 billion in direct
income and $3.1 billion when indirect and
induced impacts are considered
Direct Indirect Induced TotalAgriculture, Fishing, Mining - 5.7 3.4 9.1
Construction and Utilities 258.3 41.5 12.3 312.2
Manufacturing 2.4 25.2 7.8 35.4
Wholesale Trade - 27.4 32.7 60.1
Air Transport 27.2 0.2 0.2 27.6
Other Transport 96.0 40.1 15.0 151.2
Retail Trade 150.6 7.5 67.3 225.4
Gasoline Stations 76.3 0.7 5.8 82.8
Communications - 28.1 12.4 40.6
Finance, Insurance and Real Estate 66.7 71.1 57.2 195.1
Business Services 2.9 238.0 53.0 294.0
Education and Health Care - 2.5 182.2 184.7
Recreation and Entertainment 198.7 7.3 6.7 212.7
Lodging 279.2 0.3 0.4 279.8
Food & Beverage 553.1 25.9 54.8 633.8
Personal Services 68.4 42.6 43.6 154.6
Government 129.4 33.8 11.8 175.0
TOTAL 1,909.3 598.0 566.8 3,074.0
Source: Tourism Economics
Tourism industry generated income, millions
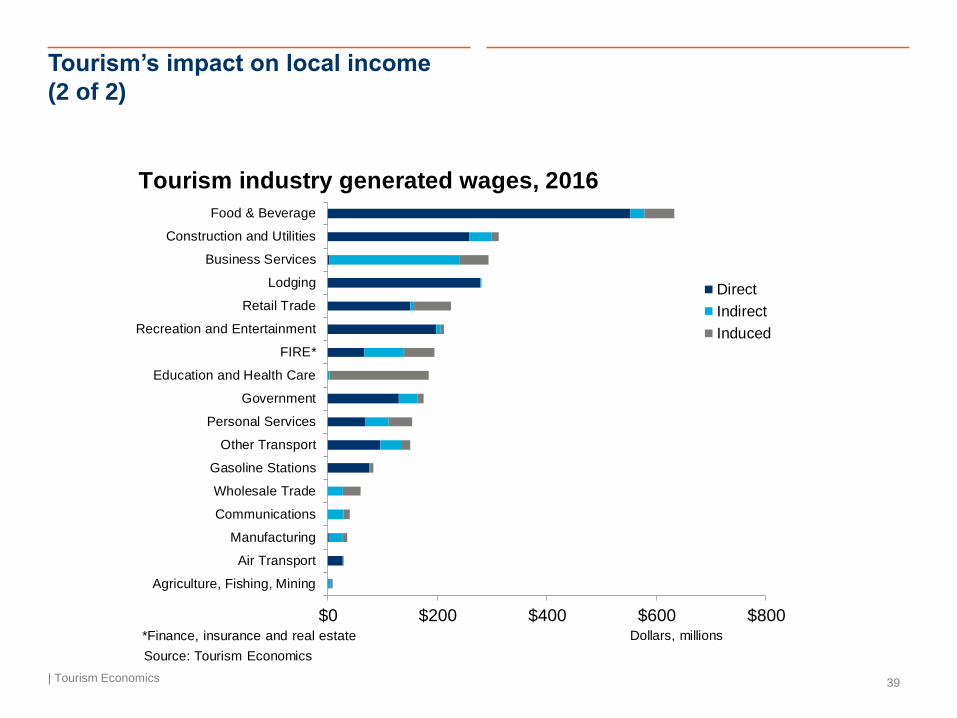
Tourism’s impact on local income
(2 of 2)
| Tourism Economics 39
Food & Beverage
Construction and Utilities
Business Services
Lodging
Retail Trade
Recreation and Entertainment
FIRE*
Education and Health Care
Government
Personal Services
Other Transport
Gasoline Stations
Wholesale Trade
Communications
Manufacturing
Air Transport
Agriculture, Fishing, Mining
$0 $200 $400 $600 $800
Direct
Indirect
Induced
Tourism industry generated wages, 2016
Source: Tourism Economics
Dollars, millions*Finance, insurance and real estate
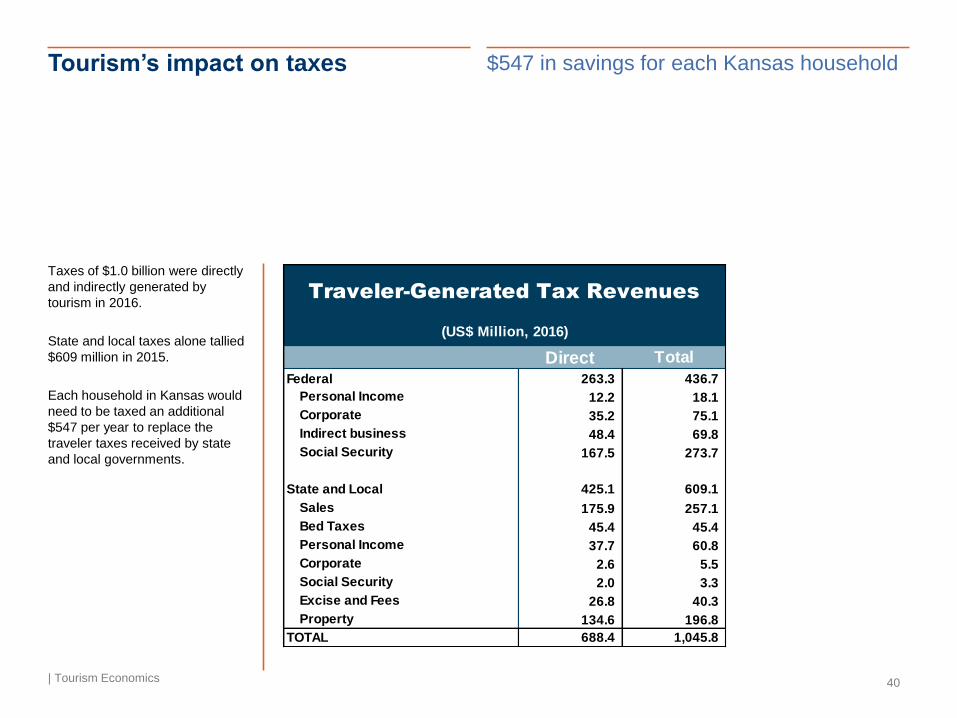
Tourism’s impact on taxes
| Tourism Economics 40
$547 in savings for each Kansas household
Taxes of $1.0 billion were directly
and indirectly generated by
tourism in 2016.
State and local taxes alone tallied
$609 million in 2015.
Each household in Kansas would
need to be taxed an additional
$547 per year to replace the
traveler taxes received by state
and local governments.
Direct Total
Federal 263.3 436.7
Personal Income 12.2 18.1
Corporate 35.2 75.1
Indirect business 48.4 69.8
Social Security 167.5 273.7
State and Local 425.1 609.1
Sales 175.9 257.1
Bed Taxes 45.4 45.4
Personal Income 37.7 60.8
Corporate 2.6 5.5
Social Security 2.0 3.3
Excise and Fees 26.8 40.3
Property 134.6 196.8
TOTAL 688.4 1,045.8
Traveler-Generated Tax Revenues
(US$ Million, 2016)
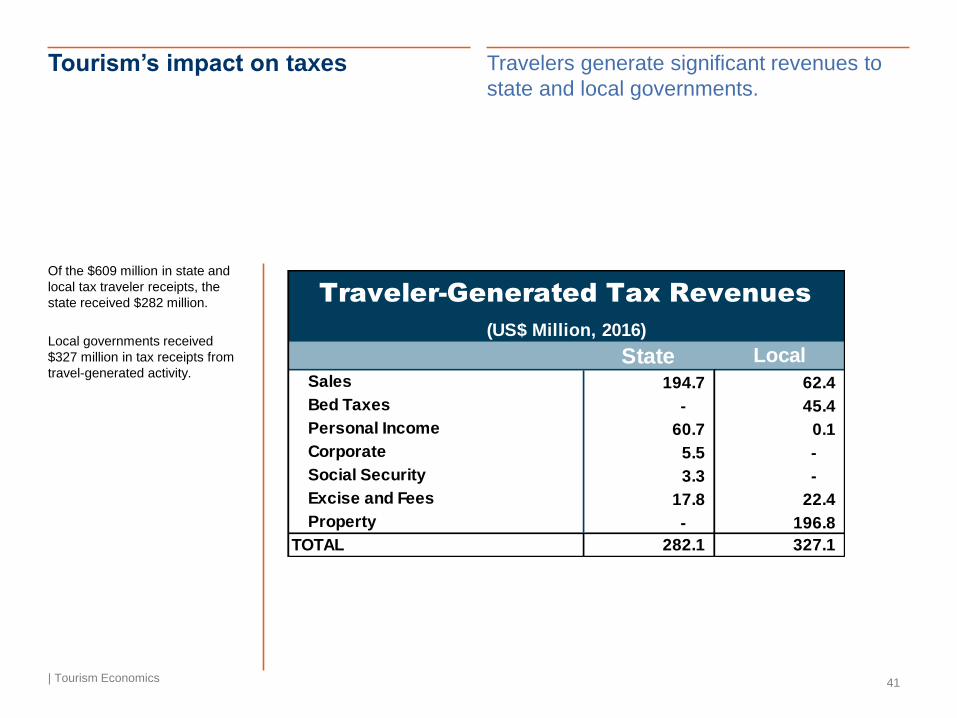
Tourism’s impact on taxes
| Tourism Economics 41
Travelers generate significant revenues to
state and local governments.
Of the $609 million in state and
local tax traveler receipts, the
state received $282 million.
Local governments received
$327 million in tax receipts from
travel-generated activity.State Local
Sales 194.7 62.4
Bed Taxes - 45.4
Personal Income 60.7 0.1
Corporate 5.5 -
Social Security 3.3 -
Excise and Fees 17.8 22.4
Property - 196.8
TOTAL 282.1 327.1
Traveler-Generated Tax Revenues
(US$ Million, 2016)
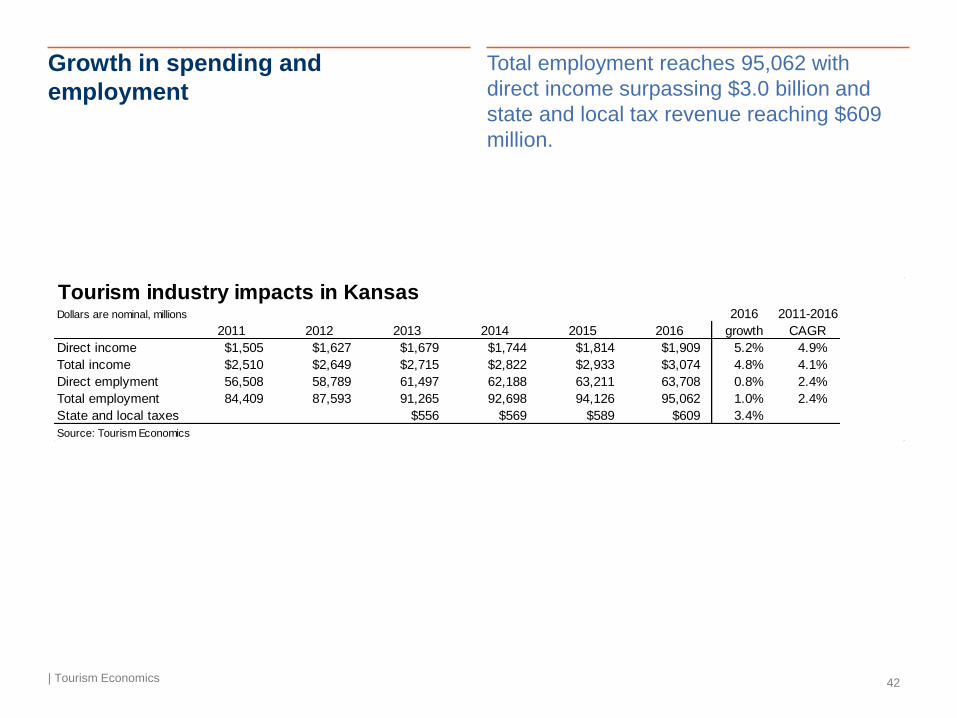
Growth in spending and
employment
| Tourism Economics 42
Total employment reaches 95,062 with
direct income surpassing $3.0 billion and
state and local tax revenue reaching $609
million.
Tourism industry impacts in KansasDollars are nominal, millions 2016 2011-2016
2011 2012 2013 2014 2015 2016 growth CAGR
Direct income $1,505 $1,627 $1,679 $1,744 $1,814 $1,909 5.2% 4.9%
Total income $2,510 $2,649 $2,715 $2,822 $2,933 $3,074 4.8% 4.1%
Direct emplyment 56,508 58,789 61,497 62,188 63,211 63,708 0.8% 2.4%
Total employment 84,409 87,593 91,265 92,698 94,126 95,062 1.0% 2.4%
State and local taxes $556 $569 $589 $609 3.4%
Source: Tourism Economics
4) Economic Impact in Context
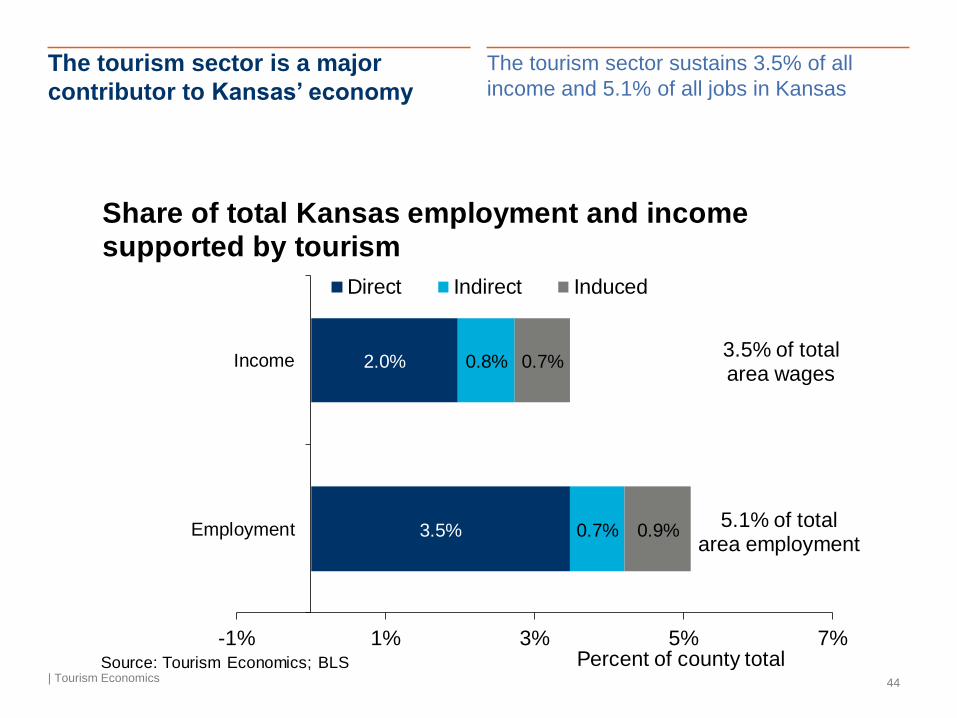
The tourism sector is a major
contributor to Kansas’ economy
| Tourism Economics 44
The tourism sector sustains 3.5% of all
income and 5.1% of all jobs in Kansas
3.5%
2.0%
0.7%
0.8%
0.9%
0.7%
-1% 1% 3% 5% 7%
Employment
Income
Direct Indirect Induced
Share of total Kansas employment and income supported by tourism
Percent of county totalSource: Tourism Economics; BLS
5.1% of total area employment
3.5% of total area wages

Figures in context
| Tourism Economics 45
The $10.8 billion in total impact in 2016
would rank 265 on the Fortune 500 list –
similar in size to PayPal, and larger than
MasterCard and Priceline Group.
Tourism
Supported
Sales
The $6.7 billion in tourism spending is what
Americans spent on legal marijuana in
2016.
Tourism
Spending
Figures in context
| Tourism Economics 46
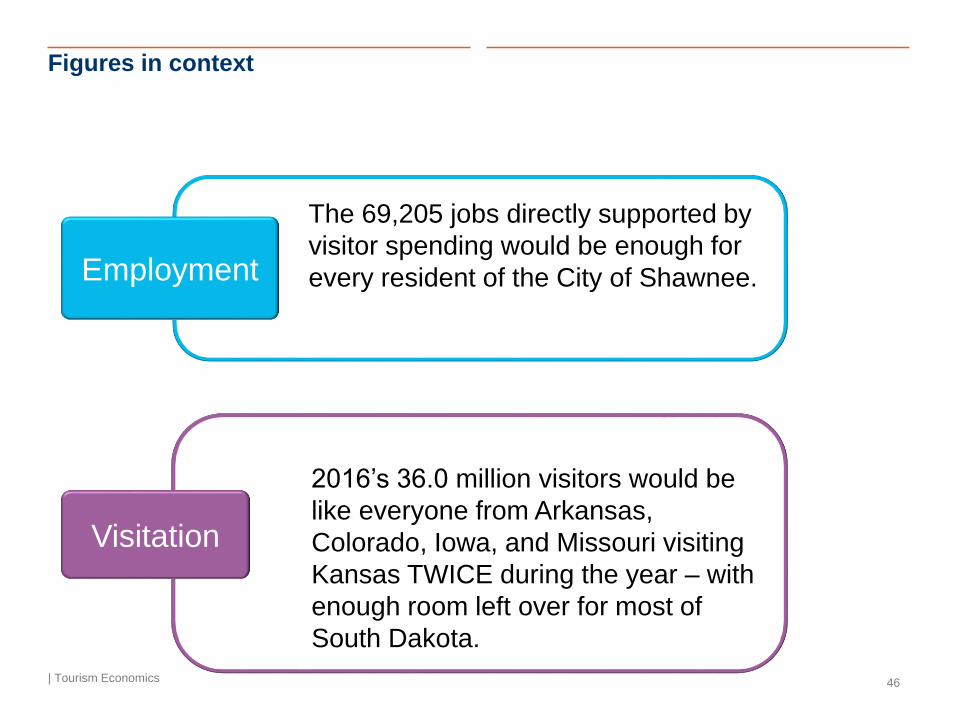
The 69,205 jobs directly supported by
visitor spending would be enough for
every resident of the City of Shawnee.
2016’s 36.0 million visitors would be
like everyone from Arkansas,
Colorado, Iowa, and Missouri visiting
Kansas TWICE during the year – with
enough room left over for most of
South Dakota.
Visitation
Employment
Figures in context
| Tourism Economics 47
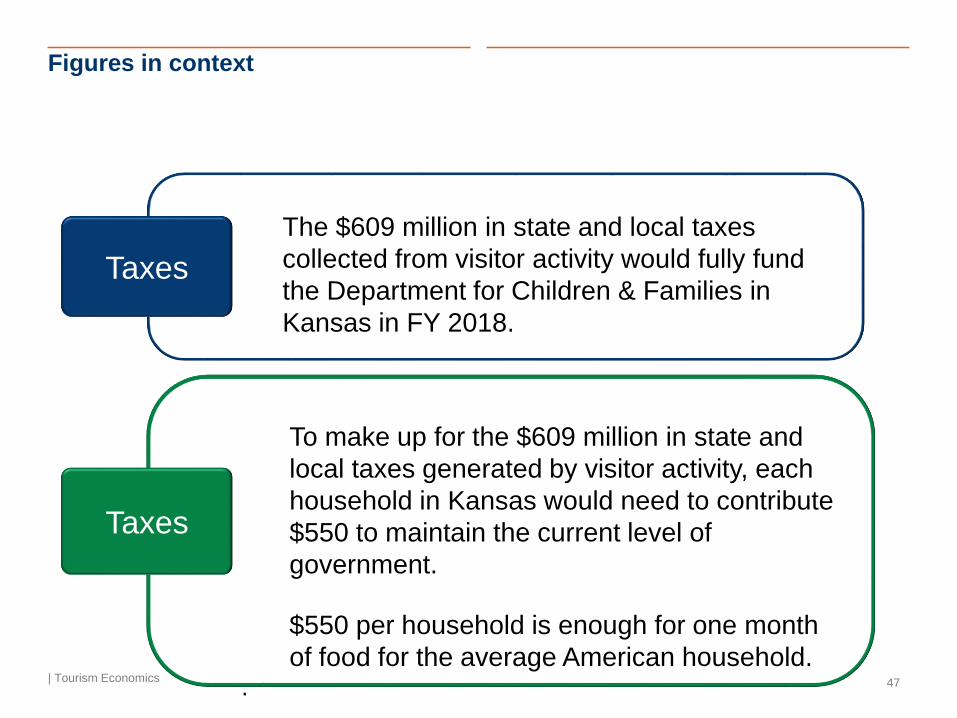
To make up for the $609 million in state and
local taxes generated by visitor activity, each
household in Kansas would need to contribute
$550 to maintain the current level of
government.
$550 per household is enough for one month
of food for the average American household..
Taxes
The $609 million in state and local taxes
collected from visitor activity would fully fund
the Department for Children & Families in
Kansas in FY 2018.
Taxes
About Tourism Economics
| Tourism Economics 48
Tourism Economics is an Oxford Economics company with a singular
objective: combine an understanding of tourism dynamics with
rigorous economics in order to answer the most important questions
facing destinations, developers, and strategic planners. By combining
quantitative methods with industry knowledge, Tourism Economics
designs custom market strategies, destination recovery plans, tourism
forecasting models, tourism policy analysis, and economic impact
studies.
With over four decades of experience of our principal consultants, it is
our passion to work as partners with our clients to achieve a
destination’s full potential.
Oxford Economics is one of the world’s leading providers of economic
analysis, forecasts and consulting advice. Founded in 1981 as a joint
venture with Oxford University’s business college, Oxford Economics
enjoys a reputation for high quality, quantitative analysis and
evidence-based advice. For this, it draws on its own staff of more than
120 professional economists; a dedicated data analysis team; global
modeling tools, and a range of partner institutions in Europe, the US
and in the United Nations Project Link. Oxford Economics has offices
in London, Oxford, Dubai, Philadelphia, and Belfast.
For more information: