The Economic Impact of Tourism in Wisconsinindustry.travelwisconsin.com/pdfs/wi economic impact 2019...
33
The Economic Impact of Tourism in Wisconsin May 2019
Transcript of The Economic Impact of Tourism in Wisconsinindustry.travelwisconsin.com/pdfs/wi economic impact 2019...
The Economic Impact of Tourism in Wisconsin
May 2019
Key Findings
| Tourism Economics 3
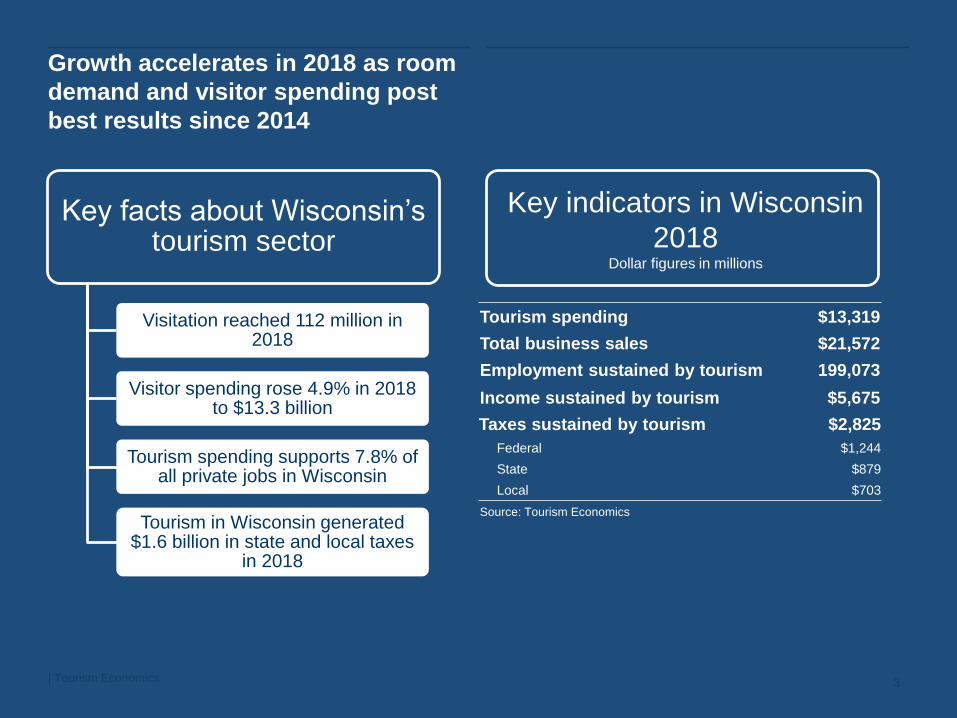
Growth accelerates in 2018 as room
demand and visitor spending post
best results since 2014
Key facts about Wisconsin’s tourism sector
Visitation reached 112 million in 2018
Visitor spending rose 4.9% in 2018 to $13.3 billion
Tourism spending supports 7.8% of all private jobs in Wisconsin
Tourism in Wisconsin generated $1.6 billion in state and local taxes
in 2018
Tourism spending $13,319
Total business sales $21,572
Employment sustained by tourism 199,073
Income sustained by tourism $5,675
Taxes sustained by tourism $2,825
Federal $1,244
State $879
Local $703
Source: Tourism Economics
Key indicators in Wisconsin
2018Dollar figures in millions
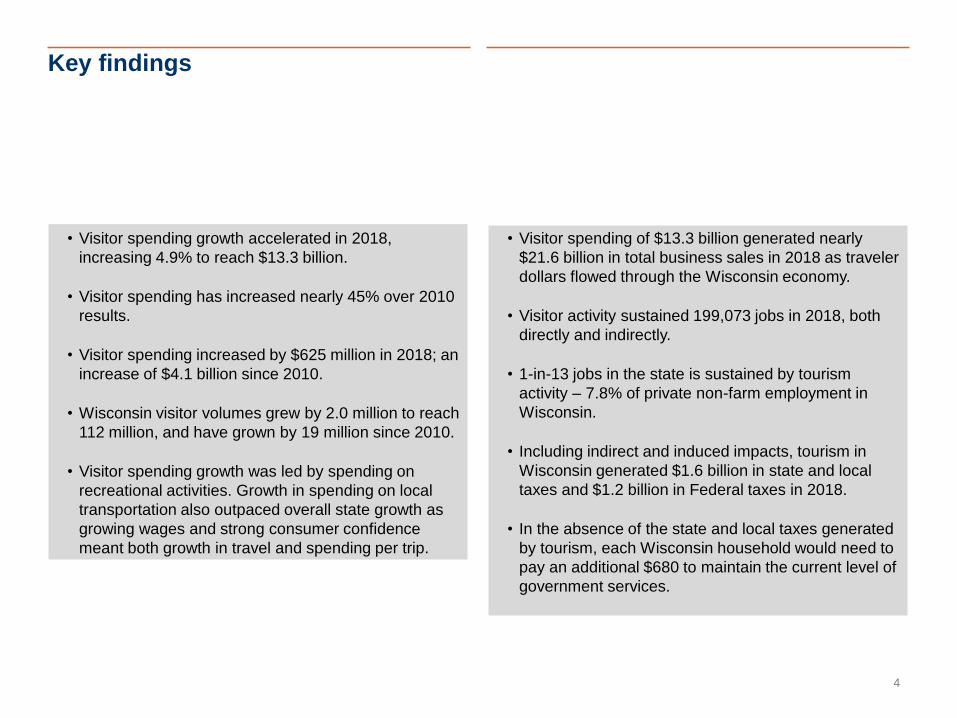
Key findings
4
• Visitor spending growth accelerated in 2018,
increasing 4.9% to reach $13.3 billion.
• Visitor spending has increased nearly 45% over 2010
results.
• Visitor spending increased by $625 million in 2018; an
increase of $4.1 billion since 2010.
• Wisconsin visitor volumes grew by 2.0 million to reach
112 million, and have grown by 19 million since 2010.
• Visitor spending growth was led by spending on
recreational activities. Growth in spending on local
transportation also outpaced overall state growth as
growing wages and strong consumer confidence
meant both growth in travel and spending per trip.
• Visitor spending of $13.3 billion generated nearly
$21.6 billion in total business sales in 2018 as traveler
dollars flowed through the Wisconsin economy.
• Visitor activity sustained 199,073 jobs in 2018, both
directly and indirectly.
• 1-in-13 jobs in the state is sustained by tourism
activity – 7.8% of private non-farm employment in
Wisconsin.
• Including indirect and induced impacts, tourism in
Wisconsin generated $1.6 billion in state and local
taxes and $1.2 billion in Federal taxes in 2018.
• In the absence of the state and local taxes generated
by tourism, each Wisconsin household would need to
pay an additional $680 to maintain the current level of
government services.
Tourism Indicators
Key indicators - lodging
| Tourism Economics 6
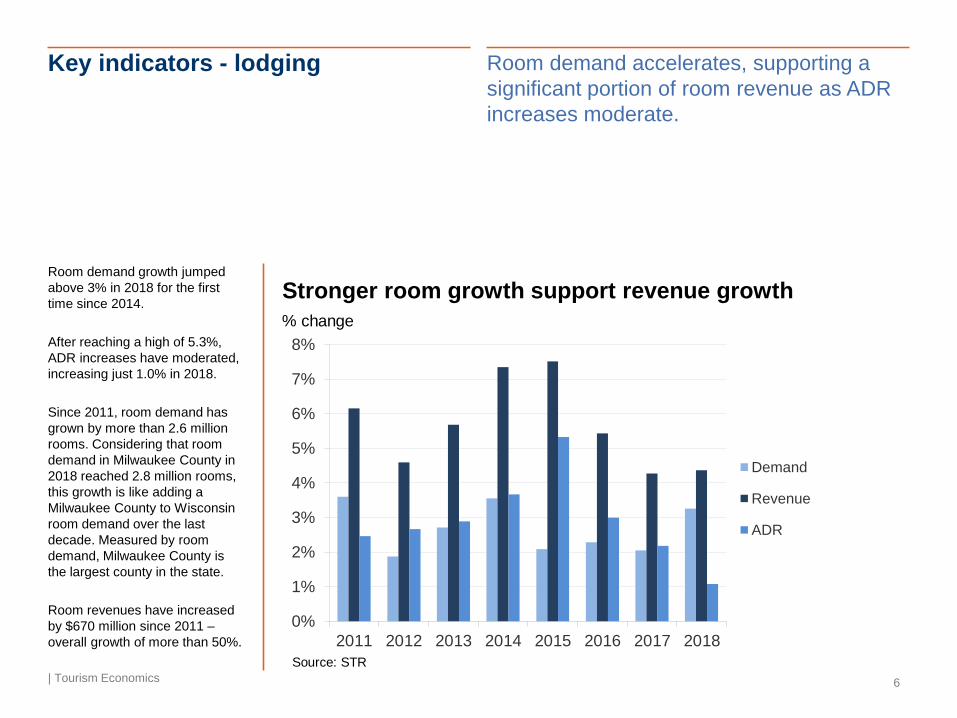
Room demand accelerates, supporting a
significant portion of room revenue as ADR
increases moderate.
Room demand growth jumped
above 3% in 2018 for the first
time since 2014.
After reaching a high of 5.3%,
ADR increases have moderated,
increasing just 1.0% in 2018.
Since 2011, room demand has
grown by more than 2.6 million
rooms. Considering that room
demand in Milwaukee County in
2018 reached 2.8 million rooms,
this growth is like adding a
Milwaukee County to Wisconsin
room demand over the last
decade. Measured by room
demand, Milwaukee County is
the largest county in the state.
Room revenues have increased
by $670 million since 2011 –
overall growth of more than 50%.
0%
1%
2%
3%
4%
5%
6%
7%
8%
2011 2012 2013 2014 2015 2016 2017 2018
Demand
Revenue
ADR
Stronger room growth support revenue growth
Source: STR
% change
Key indicators – sales tax growth in
tourism-related industries
| Tourism Economics 7
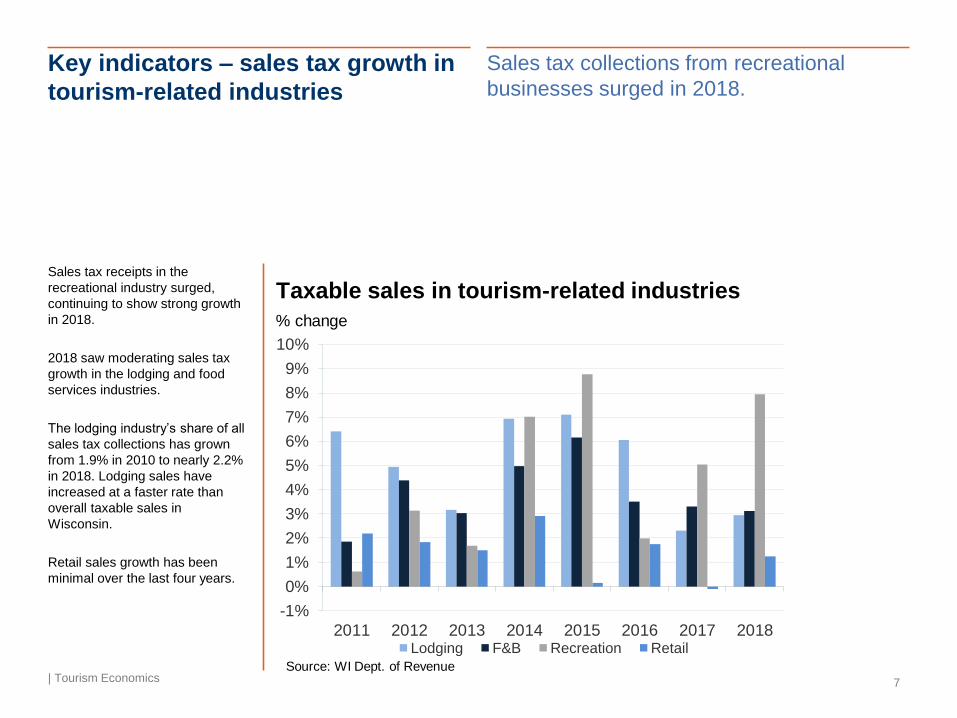
Sales tax collections from recreational
businesses surged in 2018.
Sales tax receipts in the
recreational industry surged,
continuing to show strong growth
in 2018.
2018 saw moderating sales tax
growth in the lodging and food
services industries.
The lodging industry’s share of all
sales tax collections has grown
from 1.9% in 2010 to nearly 2.2%
in 2018. Lodging sales have
increased at a faster rate than
overall taxable sales in
Wisconsin.
Retail sales growth has been
minimal over the last four years.
-1%
0%
1%
2%
3%
4%
5%
6%
7%
8%
9%
10%
2011 2012 2013 2014 2015 2016 2017 2018Lodging F&B Recreation Retail
Taxable sales in tourism-related industries
Source: WI Dept. of Revenue
% change
Key indicators – inflation
| Tourism Economics 8
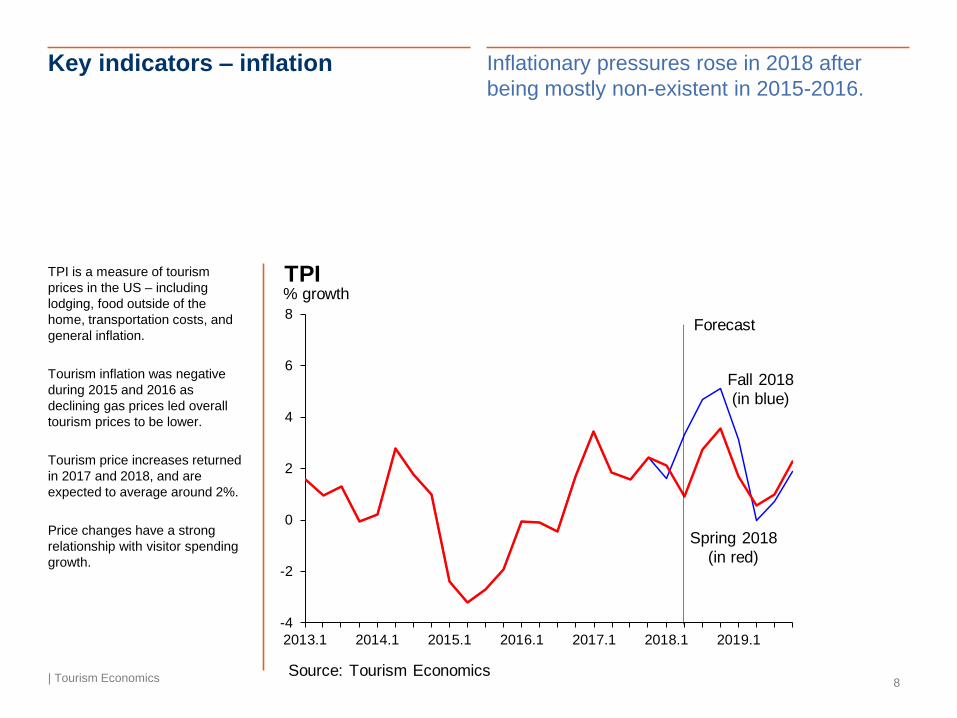
Inflationary pressures rose in 2018 after
being mostly non-existent in 2015-2016.
TPI is a measure of tourism
prices in the US – including
lodging, food outside of the
home, transportation costs, and
general inflation.
Tourism inflation was negative
during 2015 and 2016 as
declining gas prices led overall
tourism prices to be lower.
Tourism price increases returned
in 2017 and 2018, and are
expected to average around 2%.
Price changes have a strong
relationship with visitor spending
growth.
-4
-2
0
2
4
6
8
2013.1 2014.1 2015.1 2016.1 2017.1 2018.1 2019.1
TPI% growth
Source: Tourism Economics
Fall 2018
(in blue)
Spring 2018
(in red)
Forecast
Visitation and Spending
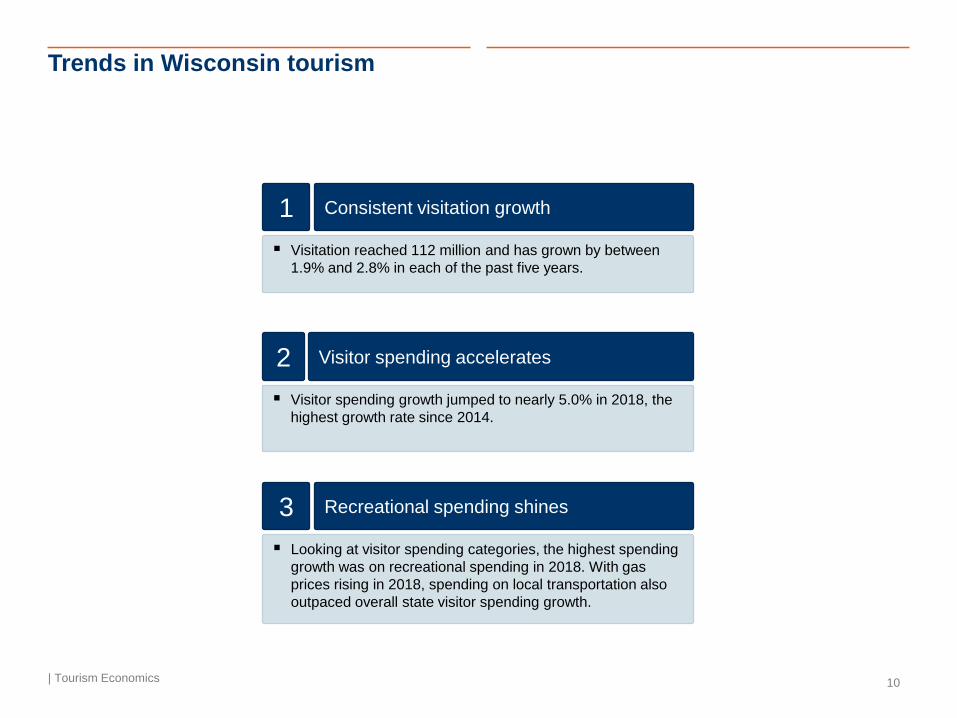
Trends in Wisconsin tourism
| Tourism Economics 10
▪ Visitation reached 112 million and has grown by between
1.9% and 2.8% in each of the past five years.
▪ Looking at visitor spending categories, the highest spending
growth was on recreational spending in 2018. With gas
prices rising in 2018, spending on local transportation also
outpaced overall state visitor spending growth.
Consistent visitation growth1
Recreational spending shines3
▪ Visitor spending growth jumped to nearly 5.0% in 2018, the
highest growth rate since 2014.
Visitor spending accelerates2
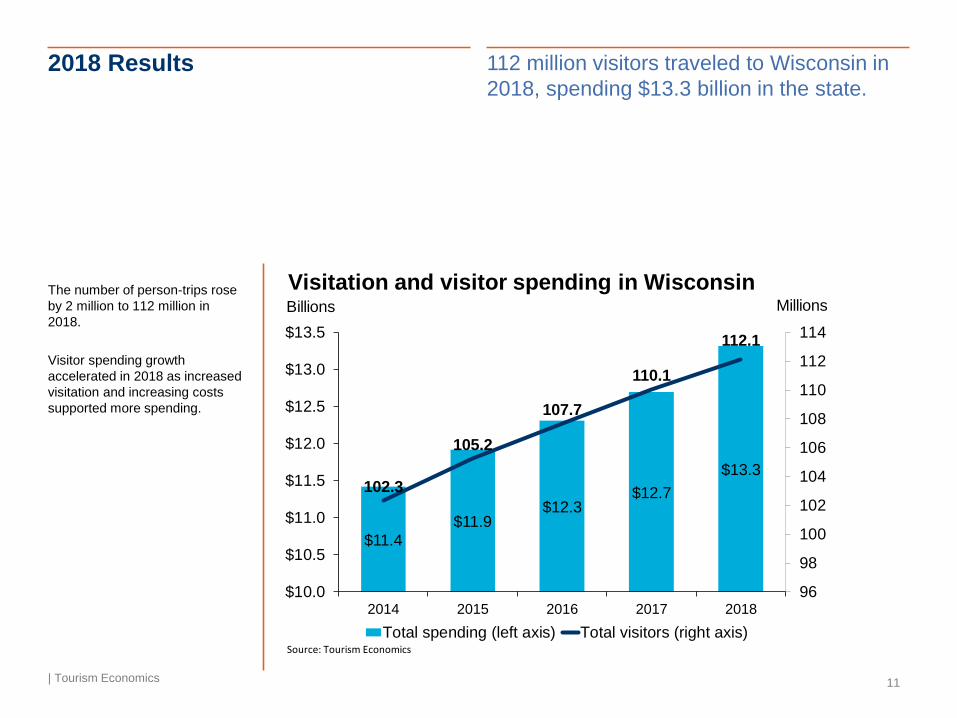
2018 Results
| Tourism Economics 11
112 million visitors traveled to Wisconsin in
2018, spending $13.3 billion in the state.
The number of person-trips rose
by 2 million to 112 million in
2018.
Visitor spending growth
accelerated in 2018 as increased
visitation and increasing costs
supported more spending.
$11.4$11.9
$12.3$12.7
$13.3102.3
105.2
107.7
110.1
112.1
96
98
100
102
104
106
108
110
112
114
$10.0
$10.5
$11.0
$11.5
$12.0
$12.5
$13.0
$13.5
2014 2015 2016 2017 2018
Total spending (left axis) Total visitors (right axis)
Visitation and visitor spending in WisconsinBillions
Source: Tourism Economics
Millions
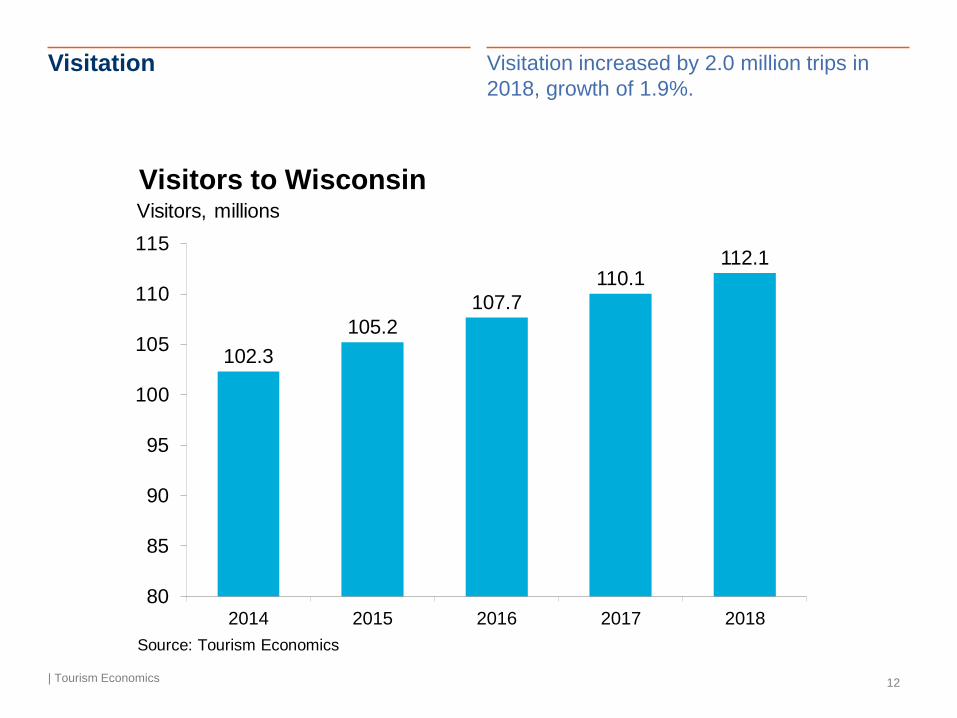
Visitation
| Tourism Economics 12
Visitation increased by 2.0 million trips in
2018, growth of 1.9%.
102.3
105.2
107.7
110.1112.1
80
85
90
95
100
105
110
115
2014 2015 2016 2017 2018
Visitors to WisconsinVisitors, millions
Source: Tourism Economics
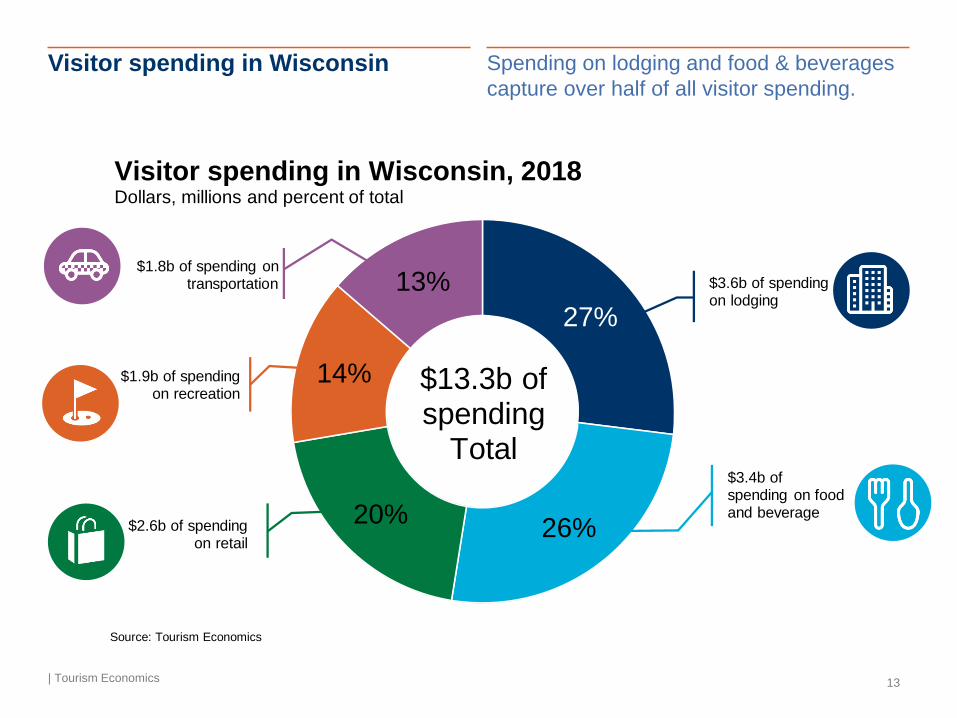
27%
26%20%
14%
13%
Source: Tourism Economics
$3.6b of spending on lodging
$13.3b of spending
Total$3.4b of spending on food and beverage
$1.8b of spending on transportation
$1.9b of spending on recreation
Visitor spending in Wisconsin, 2018Dollars, millions and percent of total
$2.6b of spending on retail
Visitor spending in Wisconsin
| Tourism Economics 13
Spending on lodging and food & beverages
capture over half of all visitor spending.
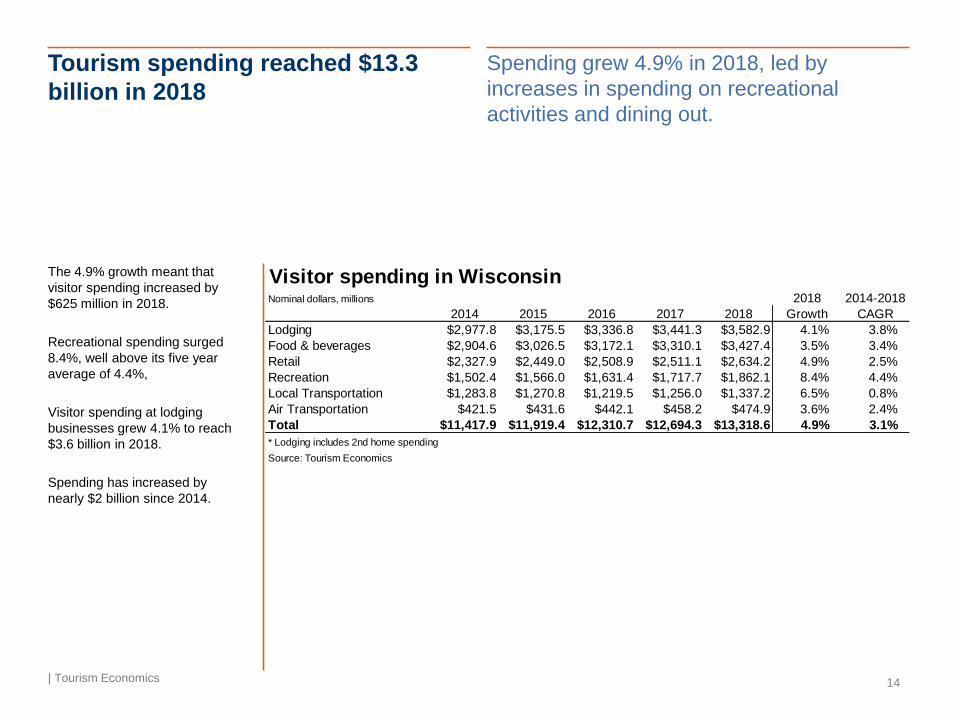
Tourism spending reached $13.3
billion in 2018
| Tourism Economics 14
Spending grew 4.9% in 2018, led by
increases in spending on recreational
activities and dining out.
The 4.9% growth meant that
visitor spending increased by
$625 million in 2018.
Recreational spending surged
8.4%, well above its five year
average of 4.4%,
Visitor spending at lodging
businesses grew 4.1% to reach
$3.6 billion in 2018.
Spending has increased by
nearly $2 billion since 2014.
Visitor spending in WisconsinNominal dollars, millions 2018 2014-2018
2014 2015 2016 2017 2018 Growth CAGR
Lodging $2,977.8 $3,175.5 $3,336.8 $3,441.3 $3,582.9 4.1% 3.8%
Food & beverages $2,904.6 $3,026.5 $3,172.1 $3,310.1 $3,427.4 3.5% 3.4%
Retail $2,327.9 $2,449.0 $2,508.9 $2,511.1 $2,634.2 4.9% 2.5%
Recreation $1,502.4 $1,566.0 $1,631.4 $1,717.7 $1,862.1 8.4% 4.4%
Local Transportation $1,283.8 $1,270.8 $1,219.5 $1,256.0 $1,337.2 6.5% 0.8%
Air Transportation $421.5 $431.6 $442.1 $458.2 $474.9 3.6% 2.4%
Total $11,417.9 $11,919.4 $12,310.7 $12,694.3 $13,318.6 4.9% 3.1%
* Lodging includes 2nd home spending
Source: Tourism Economics
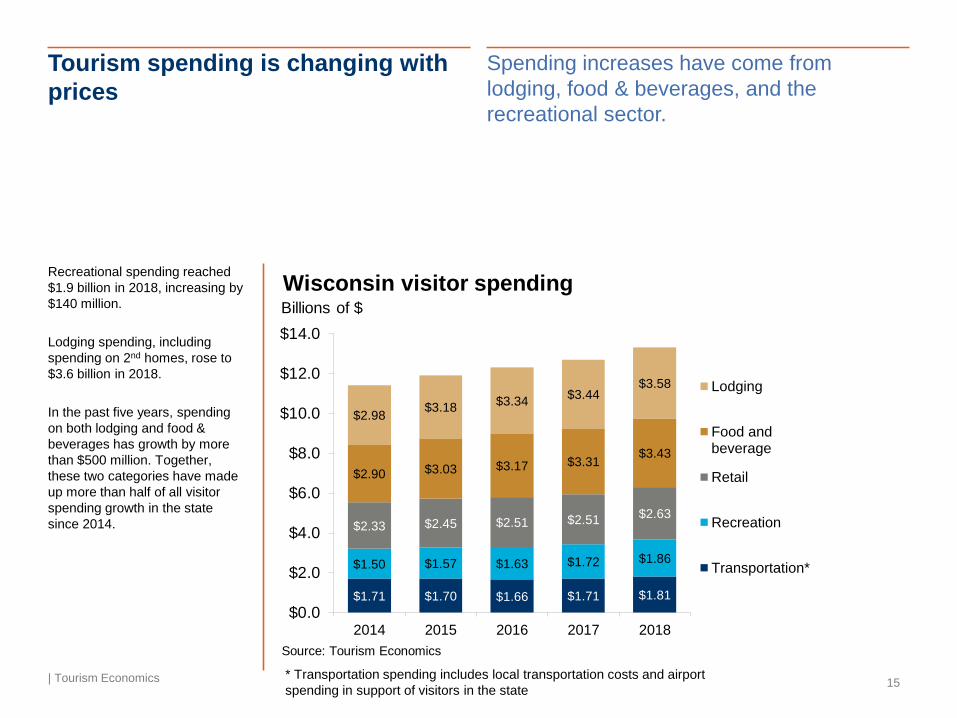
Tourism spending is changing with
prices
| Tourism Economics 15
Spending increases have come from
lodging, food & beverages, and the
recreational sector.
Recreational spending reached
$1.9 billion in 2018, increasing by
$140 million.
Lodging spending, including
spending on 2nd homes, rose to
$3.6 billion in 2018.
In the past five years, spending
on both lodging and food &
beverages has growth by more
than $500 million. Together,
these two categories have made
up more than half of all visitor
spending growth in the state
since 2014.
$1.71 $1.70 $1.66 $1.71 $1.81
$1.50 $1.57 $1.63 $1.72 $1.86
$2.33 $2.45 $2.51 $2.51$2.63
$2.90 $3.03 $3.17 $3.31$3.43
$2.98$3.18
$3.34$3.44
$3.58
$0.0
$2.0
$4.0
$6.0
$8.0
$10.0
$12.0
$14.0
2014 2015 2016 2017 2018
Lodging
Food andbeverage
Retail
Recreation
Transportation*
Wisconsin visitor spendingBillions of $
Source: Tourism Economics
* Transportation spending includes local transportation costs and airport
spending in support of visitors in the state
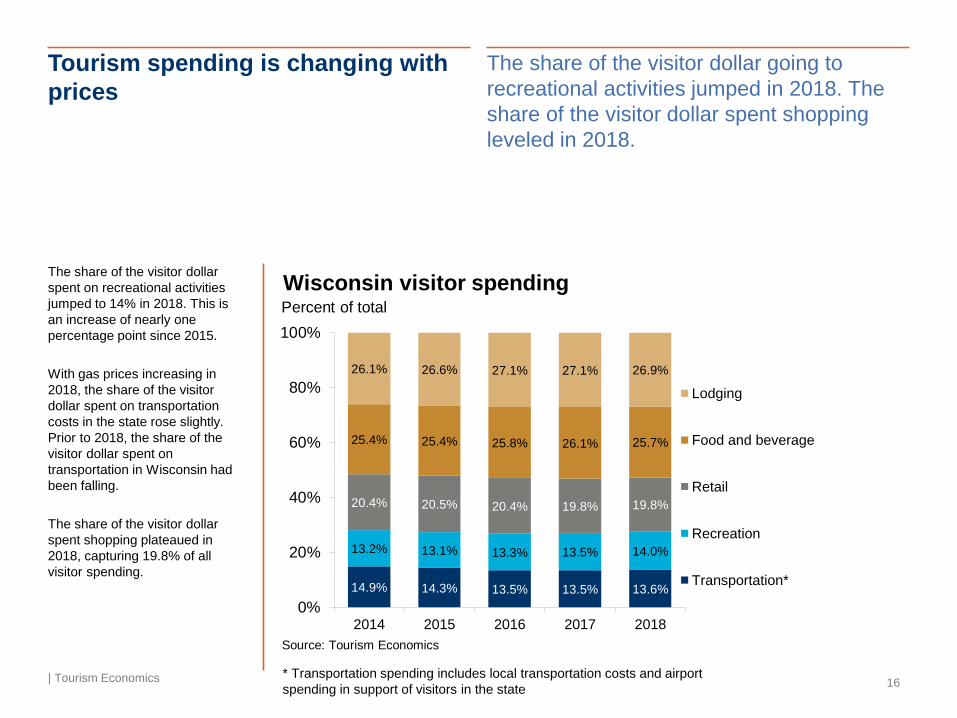
Tourism spending is changing with
prices
| Tourism Economics 16
The share of the visitor dollar
spent on recreational activities
jumped to 14% in 2018. This is
an increase of nearly one
percentage point since 2015.
With gas prices increasing in
2018, the share of the visitor
dollar spent on transportation
costs in the state rose slightly.
Prior to 2018, the share of the
visitor dollar spent on
transportation in Wisconsin had
been falling.
The share of the visitor dollar
spent shopping plateaued in
2018, capturing 19.8% of all
visitor spending.14.9% 14.3% 13.5% 13.5% 13.6%
13.2% 13.1% 13.3% 13.5% 14.0%
20.4% 20.5% 20.4% 19.8% 19.8%
25.4% 25.4% 25.8% 26.1% 25.7%
26.1% 26.6% 27.1% 27.1% 26.9%
0%
20%
40%
60%
80%
100%
2014 2015 2016 2017 2018
Lodging
Food and beverage
Retail
Recreation
Transportation*
Wisconsin visitor spendingPercent of total
Source: Tourism Economics
The share of the visitor dollar going to
recreational activities jumped in 2018. The
share of the visitor dollar spent shopping
leveled in 2018.
* Transportation spending includes local transportation costs and airport
spending in support of visitors in the state
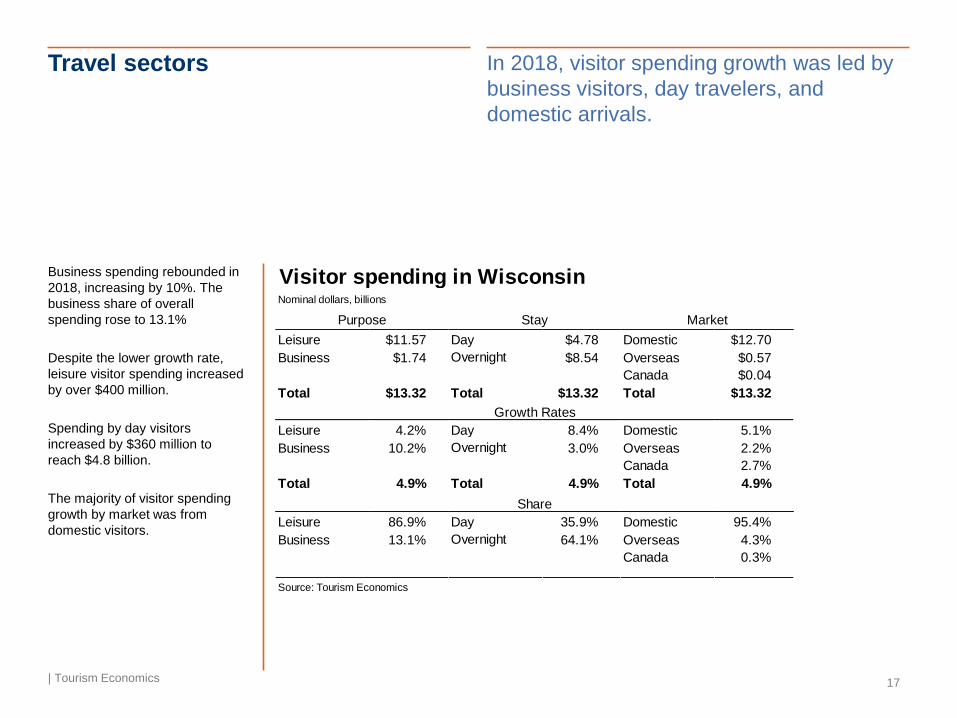
Travel sectors
| Tourism Economics 17
In 2018, visitor spending growth was led by
business visitors, day travelers, and
domestic arrivals.
Business spending rebounded in
2018, increasing by 10%. The
business share of overall
spending rose to 13.1%
Despite the lower growth rate,
leisure visitor spending increased
by over $400 million.
Spending by day visitors
increased by $360 million to
reach $4.8 billion.
The majority of visitor spending
growth by market was from
domestic visitors.
Visitor spending in WisconsinNominal dollars, billions
Leisure $11.57 Day $4.78 Domestic $12.70
Business $1.74 Overnight $8.54 Overseas $0.57
Canada $0.04
Total $13.32 Total $13.32 Total $13.32
Leisure 4.2% Day 8.4% Domestic 5.1%
Business 10.2% Overnight 3.0% Overseas 2.2%
Canada 2.7%
Total 4.9% Total 4.9% Total 4.9%
Leisure 86.9% Day 35.9% Domestic 95.4%
Business 13.1% Overnight 64.1% Overseas 4.3%
Canada 0.3%
Source: Tourism Economics
Share
Purpose Stay Market
Growth Rates
Travel sectors
| Tourism Economics 18
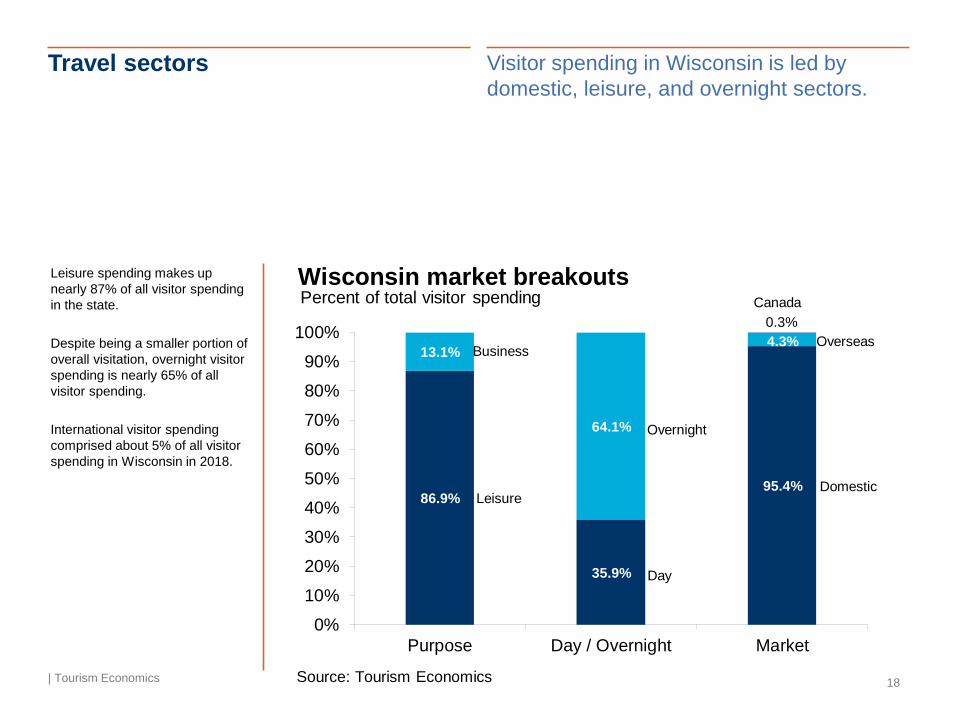
Visitor spending in Wisconsin is led by
domestic, leisure, and overnight sectors.
86.9%
35.9%
95.4%
13.1%
64.1%
4.3%
0.3%
0%
10%
20%
30%
40%
50%
60%
70%
80%
90%
100%
Purpose Day / Overnight Market
Wisconsin market breakouts
Business
Source: Tourism Economics
Leisure
Overnight
Day
Overseas
Domestic
CanadaPercent of total visitor spending
Leisure spending makes up
nearly 87% of all visitor spending
in the state.
Despite being a smaller portion of
overall visitation, overnight visitor
spending is nearly 65% of all
visitor spending.
International visitor spending
comprised about 5% of all visitor
spending in Wisconsin in 2018.
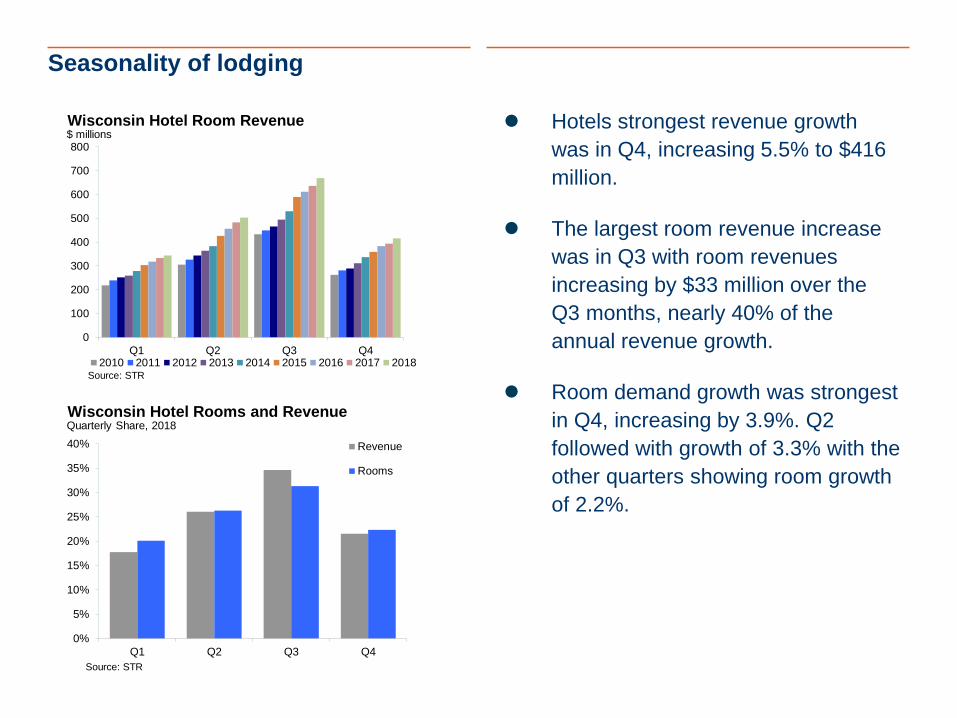
Seasonality of lodging
⚫ Hotels strongest revenue growth
was in Q4, increasing 5.5% to $416
million.
⚫ The largest room revenue increase
was in Q3 with room revenues
increasing by $33 million over the
Q3 months, nearly 40% of the
annual revenue growth.
⚫ Room demand growth was strongest
in Q4, increasing by 3.9%. Q2
followed with growth of 3.3% with the
other quarters showing room growth
of 2.2%.
0
100
200
300
400
500
600
700
800
Q1 Q2 Q3 Q42010 2011 2012 2013 2014 2015 2016 2017 2018
Wisconsin Hotel Room Revenue$ millions
Source: STR
0%
5%
10%
15%
20%
25%
30%
35%
40%
Q1 Q2 Q3 Q4
Revenue
Rooms
Wisconsin Hotel Rooms and RevenueQuarterly Share, 2018
Source: STR
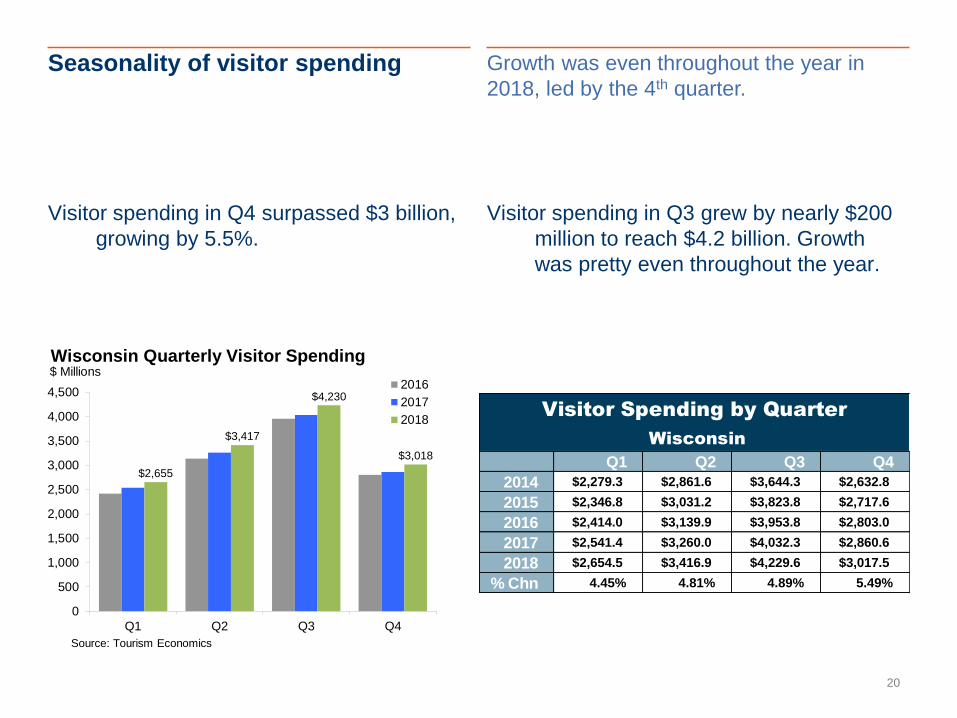
Seasonality of visitor spending
20
Growth was even throughout the year in
2018, led by the 4th quarter.
Visitor spending in Q4 surpassed $3 billion,
growing by 5.5%.
Visitor spending in Q3 grew by nearly $200
million to reach $4.2 billion. Growth
was pretty even throughout the year.
$2,655
$3,417
$4,230
$3,018
0
500
1,000
1,500
2,000
2,500
3,000
3,500
4,000
4,500
Q1 Q2 Q3 Q4
2016
2017
2018
Wisconsin Quarterly Visitor Spending$ Millions
Source: Tourism Economics
Q1 Q2 Q3 Q4
2014 $2,279.3 $2,861.6 $3,644.3 $2,632.8
2015 $2,346.8 $3,031.2 $3,823.8 $2,717.6
2016 $2,414.0 $3,139.9 $3,953.8 $2,803.0
2017 $2,541.4 $3,260.0 $4,032.3 $2,860.6
2018 $2,654.5 $3,416.9 $4,229.6 $3,017.5
% Chn 4.45% 4.81% 4.89% 5.49%
Visitor Spending by Quarter
Wisconsin
The Economic Impact of Tourism
How tourism generates impact
| Tourism Economics 22
Tourism spending flows through the
economy and generates economic benefit
through multiple channels.
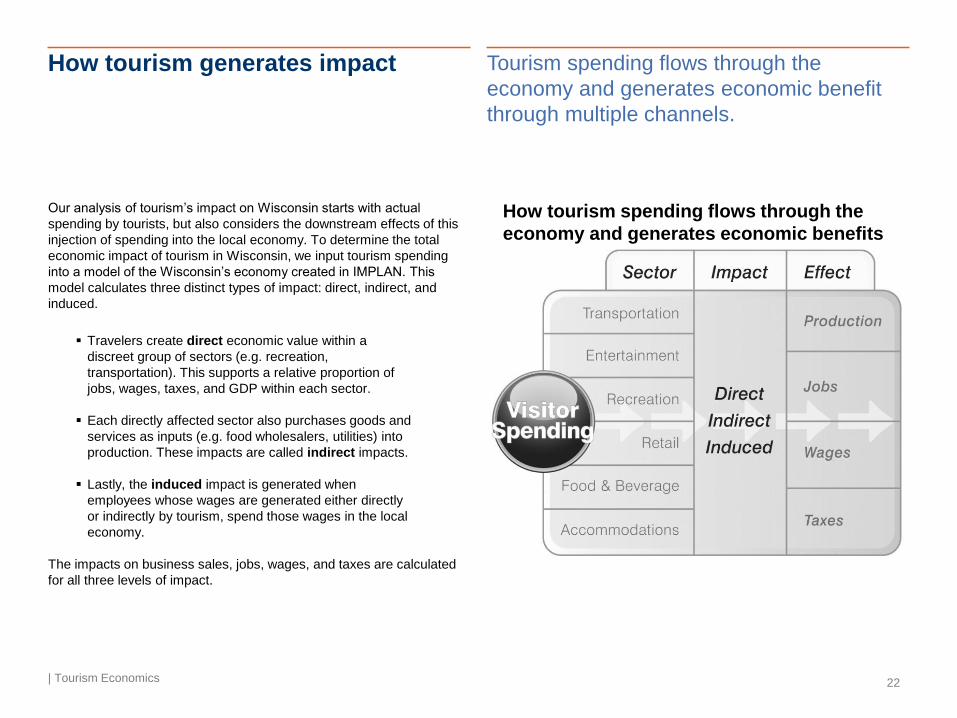
Our analysis of tourism’s impact on Wisconsin starts with actual
spending by tourists, but also considers the downstream effects of this
injection of spending into the local economy. To determine the total
economic impact of tourism in Wisconsin, we input tourism spending
into a model of the Wisconsin’s economy created in IMPLAN. This
model calculates three distinct types of impact: direct, indirect, and
induced.
How tourism spending flows through the
economy and generates economic benefits
▪ Travelers create direct economic value within a
discreet group of sectors (e.g. recreation,
transportation). This supports a relative proportion of
jobs, wages, taxes, and GDP within each sector.
▪ Each directly affected sector also purchases goods and
services as inputs (e.g. food wholesalers, utilities) into
production. These impacts are called indirect impacts.
▪ Lastly, the induced impact is generated when
employees whose wages are generated either directly
or indirectly by tourism, spend those wages in the local
economy.
The impacts on business sales, jobs, wages, and taxes are calculated
for all three levels of impact.
Business sales impacts (1 of 2)
| Tourism Economics 23
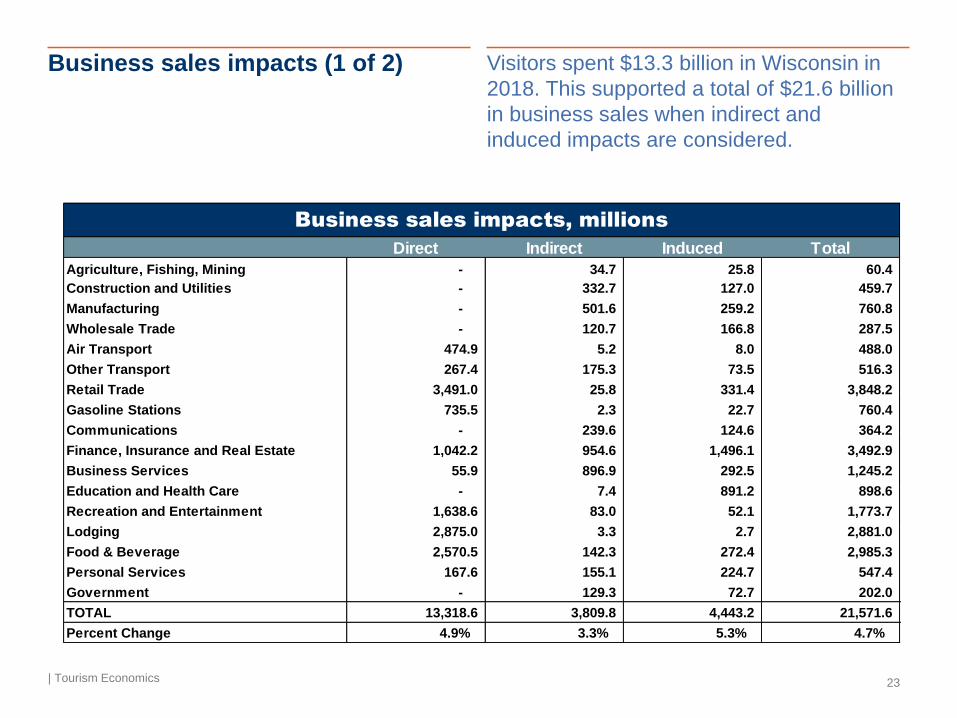
Visitors spent $13.3 billion in Wisconsin in
2018. This supported a total of $21.6 billion
in business sales when indirect and
induced impacts are considered.
Direct Indirect Induced Total
Agriculture, Fishing, Mining - 34.7 25.8 60.4
Construction and Utilities - 332.7 127.0 459.7
Manufacturing - 501.6 259.2 760.8
Wholesale Trade - 120.7 166.8 287.5
Air Transport 474.9 5.2 8.0 488.0
Other Transport 267.4 175.3 73.5 516.3
Retail Trade 3,491.0 25.8 331.4 3,848.2
Gasoline Stations 735.5 2.3 22.7 760.4
Communications - 239.6 124.6 364.2
Finance, Insurance and Real Estate 1,042.2 954.6 1,496.1 3,492.9
Business Services 55.9 896.9 292.5 1,245.2
Education and Health Care - 7.4 891.2 898.6
Recreation and Entertainment 1,638.6 83.0 52.1 1,773.7
Lodging 2,875.0 3.3 2.7 2,881.0
Food & Beverage 2,570.5 142.3 272.4 2,985.3
Personal Services 167.6 155.1 224.7 547.4
Government - 129.3 72.7 202.0
TOTAL 13,318.6 3,809.8 4,443.2 21,571.6
Percent Change 4.9% 3.3% 5.3% 4.7%
Business sales impacts, millions
Business sales impacts (2 of 2)
| Tourism Economics 24
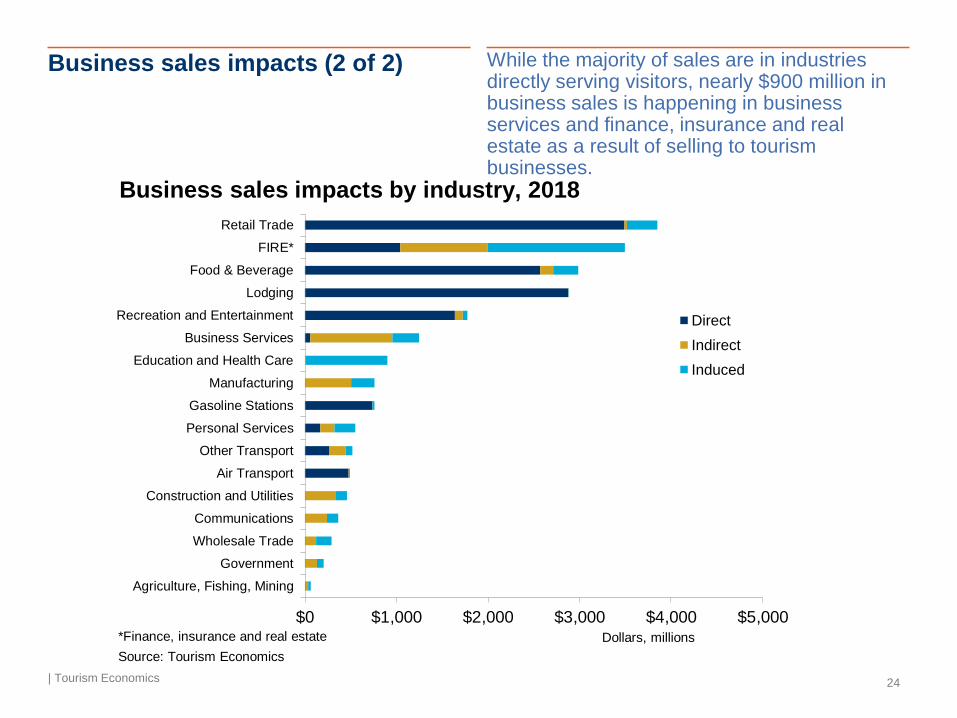
While the majority of sales are in industries directly serving visitors, nearly $900 million in business sales is happening in business services and finance, insurance and real estate as a result of selling to tourism businesses.
Retail Trade
FIRE*
Food & Beverage
Lodging
Recreation and Entertainment
Business Services
Education and Health Care
Manufacturing
Gasoline Stations
Personal Services
Other Transport
Air Transport
Construction and Utilities
Communications
Wholesale Trade
Government
Agriculture, Fishing, Mining
$0 $1,000 $2,000 $3,000 $4,000 $5,000
Direct
Indirect
Induced
Business sales impacts by industry, 2018
Source: Tourism Economics
Dollars, millions*Finance, insurance and real estate
GDP impacts (1 of 2)
| Tourism Economics 25
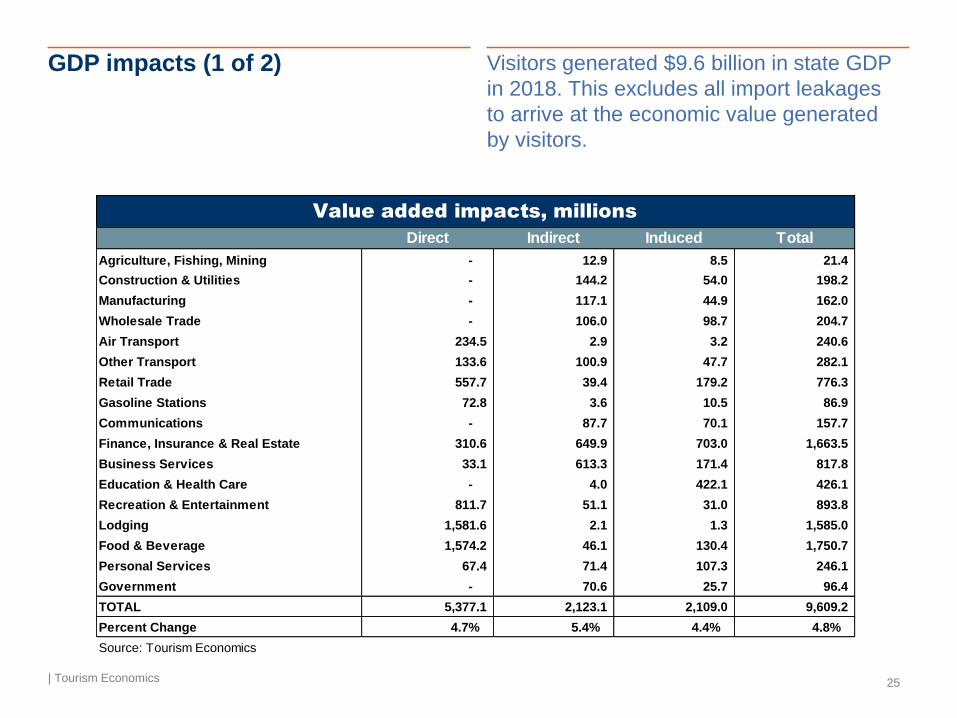
Visitors generated $9.6 billion in state GDP
in 2018. This excludes all import leakages
to arrive at the economic value generated
by visitors.
Direct Indirect Induced Total
Agriculture, Fishing, Mining - 12.9 8.5 21.4
Construction & Utilities - 144.2 54.0 198.2
Manufacturing - 117.1 44.9 162.0
Wholesale Trade - 106.0 98.7 204.7
Air Transport 234.5 2.9 3.2 240.6
Other Transport 133.6 100.9 47.7 282.1
Retail Trade 557.7 39.4 179.2 776.3
Gasoline Stations 72.8 3.6 10.5 86.9
Communications - 87.7 70.1 157.7
Finance, Insurance & Real Estate 310.6 649.9 703.0 1,663.5
Business Services 33.1 613.3 171.4 817.8
Education & Health Care - 4.0 422.1 426.1
Recreation & Entertainment 811.7 51.1 31.0 893.8
Lodging 1,581.6 2.1 1.3 1,585.0
Food & Beverage 1,574.2 46.1 130.4 1,750.7
Personal Services 67.4 71.4 107.3 246.1
Government - 70.6 25.7 96.4
TOTAL 5,377.1 2,123.1 2,109.0 9,609.2
Percent Change 4.7% 5.4% 4.4% 4.8%
Source: Tourism Economics
Value added impacts, millions
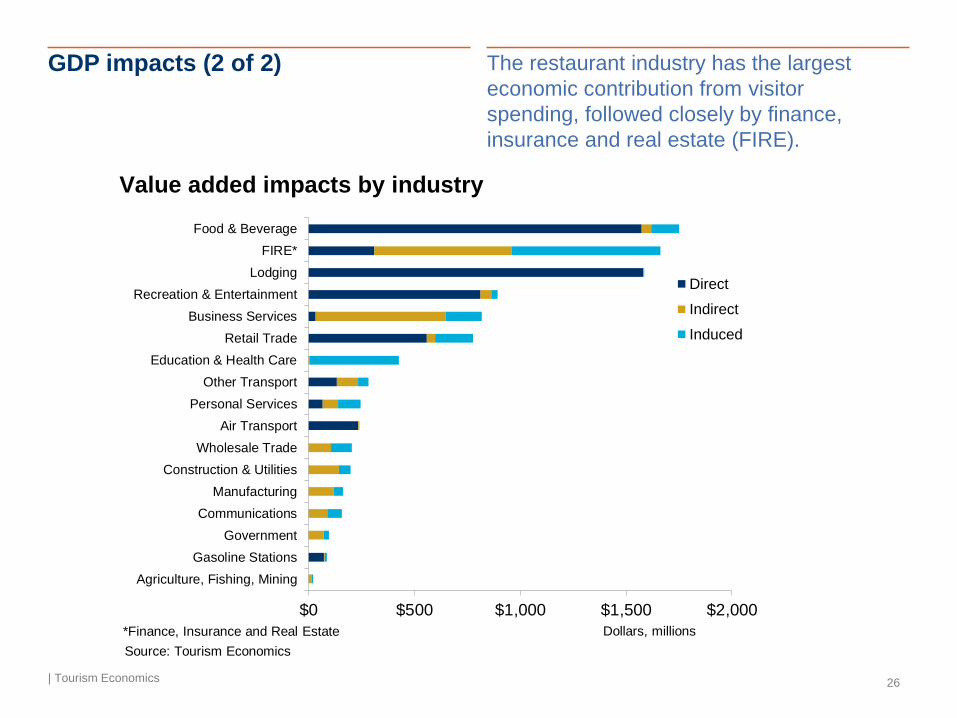
GDP impacts (2 of 2)
| Tourism Economics 26
The restaurant industry has the largest
economic contribution from visitor
spending, followed closely by finance,
insurance and real estate (FIRE).
Food & Beverage
FIRE*
Lodging
Recreation & Entertainment
Business Services
Retail Trade
Education & Health Care
Other Transport
Personal Services
Air Transport
Wholesale Trade
Construction & Utilities
Manufacturing
Communications
Government
Gasoline Stations
Agriculture, Fishing, Mining
$0 $500 $1,000 $1,500 $2,000
Direct
Indirect
Induced
Value added impacts by industry
Source: Tourism Economics
Dollars, millions*Finance, Insurance and Real Estate
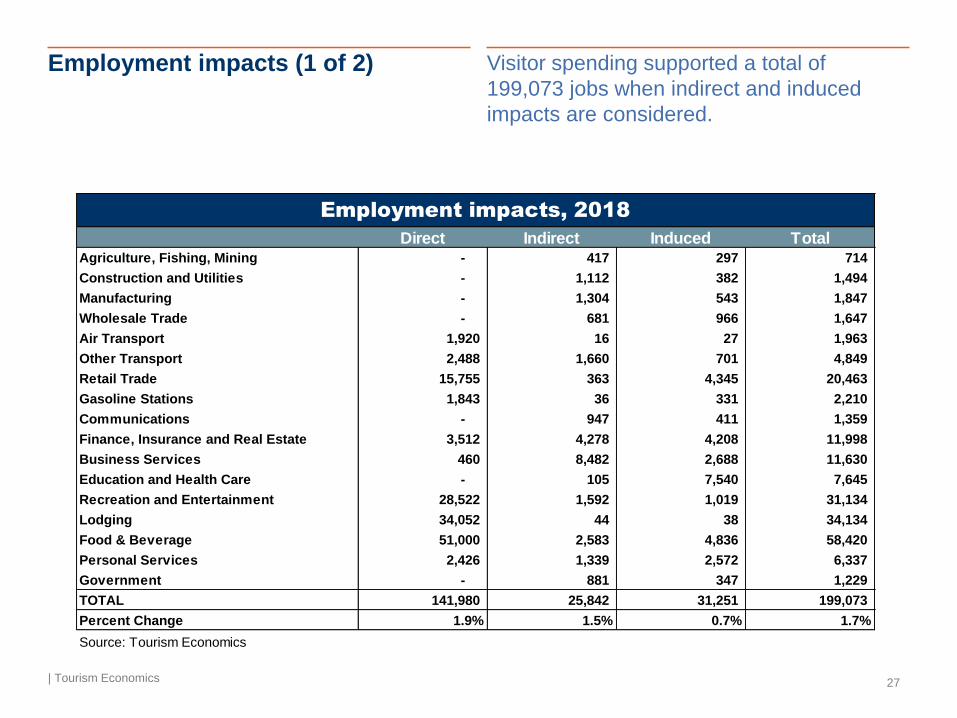
Employment impacts (1 of 2)
| Tourism Economics 27
Visitor spending supported a total of
199,073 jobs when indirect and induced
impacts are considered.
Direct Indirect Induced TotalAgriculture, Fishing, Mining - 417 297 714
Construction and Utilities - 1,112 382 1,494
Manufacturing - 1,304 543 1,847
Wholesale Trade - 681 966 1,647
Air Transport 1,920 16 27 1,963
Other Transport 2,488 1,660 701 4,849
Retail Trade 15,755 363 4,345 20,463
Gasoline Stations 1,843 36 331 2,210
Communications - 947 411 1,359
Finance, Insurance and Real Estate 3,512 4,278 4,208 11,998
Business Services 460 8,482 2,688 11,630
Education and Health Care - 105 7,540 7,645
Recreation and Entertainment 28,522 1,592 1,019 31,134
Lodging 34,052 44 38 34,134
Food & Beverage 51,000 2,583 4,836 58,420
Personal Services 2,426 1,339 2,572 6,337
Government - 881 347 1,229
TOTAL 141,980 25,842 31,251 199,073
Percent Change 1.9% 1.5% 0.7% 1.7%
Source: Tourism Economics
Employment impacts, 2018
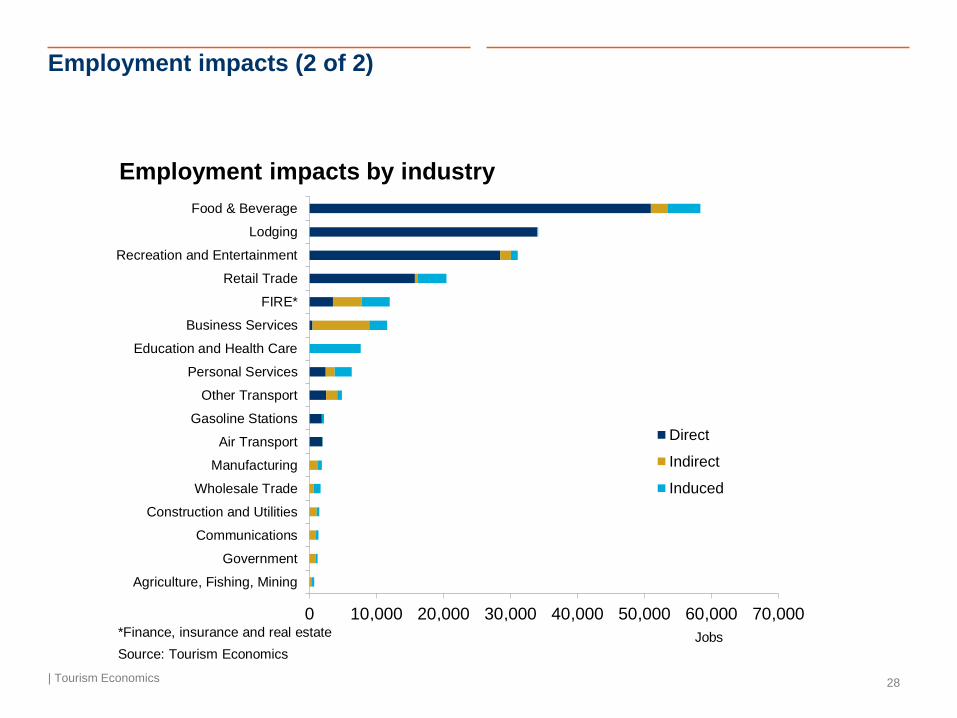
Employment impacts (2 of 2)
| Tourism Economics 28
Food & Beverage
Lodging
Recreation and Entertainment
Retail Trade
FIRE*
Business Services
Education and Health Care
Personal Services
Other Transport
Gasoline Stations
Air Transport
Manufacturing
Wholesale Trade
Construction and Utilities
Communications
Government
Agriculture, Fishing, Mining
0 10,000 20,000 30,000 40,000 50,000 60,000 70,000
Direct
Indirect
Induced
Employment impacts by industry
Source: Tourism Economics
Jobs*Finance, insurance and real estate
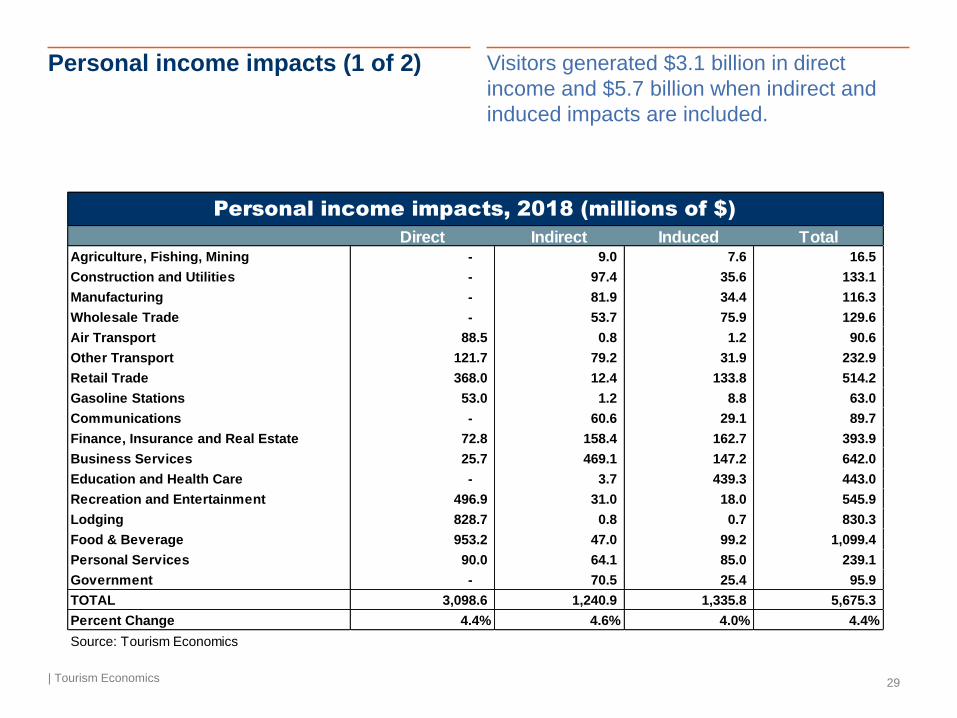
Personal income impacts (1 of 2)
| Tourism Economics 29
Visitors generated $3.1 billion in direct
income and $5.7 billion when indirect and
induced impacts are included.
Direct Indirect Induced TotalAgriculture, Fishing, Mining - 9.0 7.6 16.5
Construction and Utilities - 97.4 35.6 133.1
Manufacturing - 81.9 34.4 116.3
Wholesale Trade - 53.7 75.9 129.6
Air Transport 88.5 0.8 1.2 90.6
Other Transport 121.7 79.2 31.9 232.9
Retail Trade 368.0 12.4 133.8 514.2
Gasoline Stations 53.0 1.2 8.8 63.0
Communications - 60.6 29.1 89.7
Finance, Insurance and Real Estate 72.8 158.4 162.7 393.9
Business Services 25.7 469.1 147.2 642.0
Education and Health Care - 3.7 439.3 443.0
Recreation and Entertainment 496.9 31.0 18.0 545.9
Lodging 828.7 0.8 0.7 830.3
Food & Beverage 953.2 47.0 99.2 1,099.4
Personal Services 90.0 64.1 85.0 239.1
Government - 70.5 25.4 95.9
TOTAL 3,098.6 1,240.9 1,335.8 5,675.3
Percent Change 4.4% 4.6% 4.0% 4.4%
Source: Tourism Economics
Personal income impacts, 2018 (millions of $)
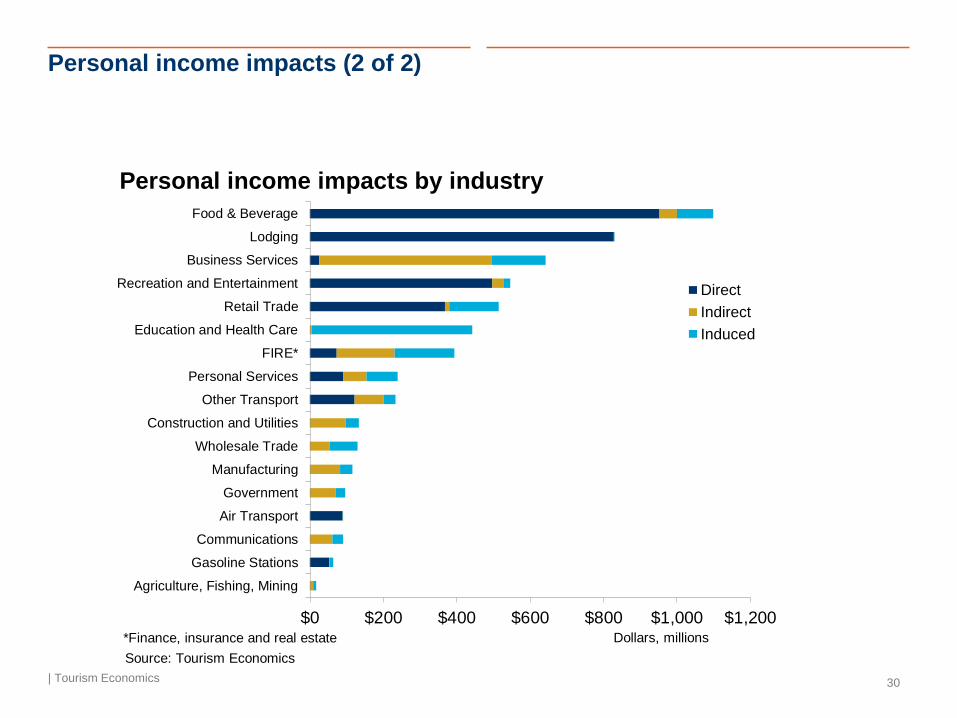
Personal income impacts (2 of 2)
| Tourism Economics 30
Food & Beverage
Lodging
Business Services
Recreation and Entertainment
Retail Trade
Education and Health Care
FIRE*
Personal Services
Other Transport
Construction and Utilities
Wholesale Trade
Manufacturing
Government
Air Transport
Communications
Gasoline Stations
Agriculture, Fishing, Mining
$0 $200 $400 $600 $800 $1,000 $1,200
Direct
Indirect
Induced
Personal income impacts by industry
Source: Tourism Economics
Dollars, millions*Finance, insurance and real estate
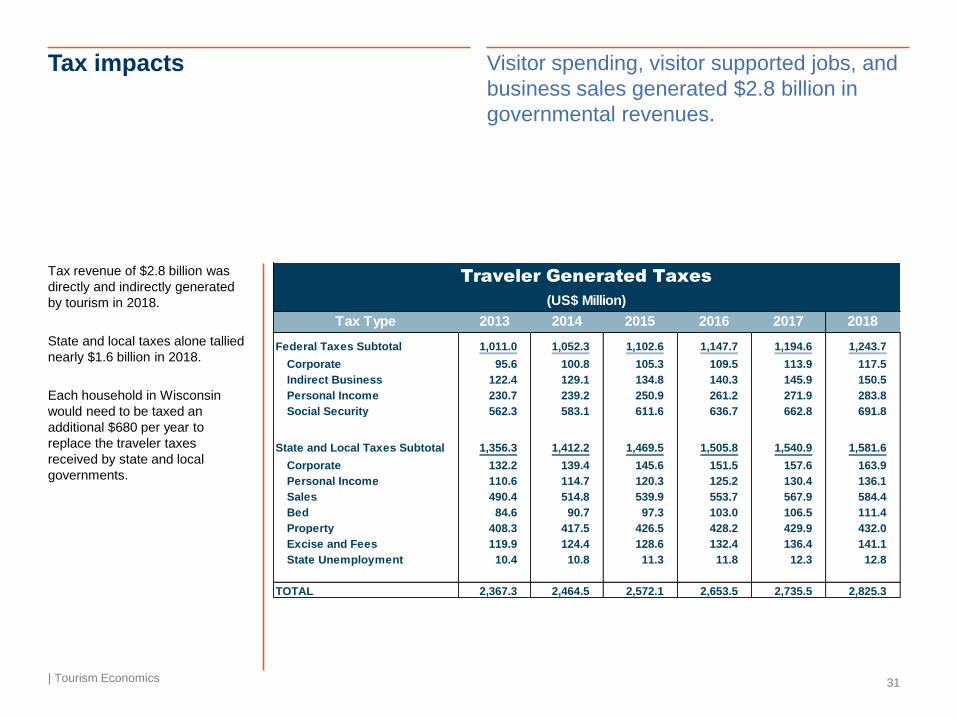
Tax impacts
| Tourism Economics 31
Visitor spending, visitor supported jobs, and
business sales generated $2.8 billion in
governmental revenues.
Tax revenue of $2.8 billion was
directly and indirectly generated
by tourism in 2018.
State and local taxes alone tallied
nearly $1.6 billion in 2018.
Each household in Wisconsin
would need to be taxed an
additional $680 per year to
replace the traveler taxes
received by state and local
governments.
Tax Type 2013 2014 2015 2016 2017 2018
Federal Taxes Subtotal 1,011.0 1,052.3 1,102.6 1,147.7 1,194.6 1,243.7
Corporate 95.6 100.8 105.3 109.5 113.9 117.5
Indirect Business 122.4 129.1 134.8 140.3 145.9 150.5
Personal Income 230.7 239.2 250.9 261.2 271.9 283.8
Social Security 562.3 583.1 611.6 636.7 662.8 691.8
State and Local Taxes Subtotal 1,356.3 1,412.2 1,469.5 1,505.8 1,540.9 1,581.6
Corporate 132.2 139.4 145.6 151.5 157.6 163.9
Personal Income 110.6 114.7 120.3 125.2 130.4 136.1
Sales 490.4 514.8 539.9 553.7 567.9 584.4
Bed 84.6 90.7 97.3 103.0 106.5 111.4
Property 408.3 417.5 426.5 428.2 429.9 432.0
Excise and Fees 119.9 124.4 128.6 132.4 136.4 141.1
State Unemployment 10.4 10.8 11.3 11.8 12.3 12.8
TOTAL 2,367.3 2,464.5 2,572.1 2,653.5 2,735.5 2,825.3
Traveler Generated Taxes
(US$ Million)
Tax Type 2014 2015 2016 2017 2018
State Tax Subtotal 767.0 803.4 824.9 850.5 879.2
Corporate 139.4 145.6 151.5 157.6 163.9
Personal Income 114.7 120.3 125.2 130.4 136.1
Sales 476.2 499.5 511.8 524.9 540.1
Lodging 0.0 0.0 0.0 0.0 0.0
Property 0.0 0.0 0.0 0.0 0.0
Excise and Fees 25.9 26.7 24.7 25.4 26.3
State Unemployment 10.8 11.3 11.8 12.3 12.8
Local Tax Subtotal 645.2 666.0 680.8 690.4 703.4
Corporate 0.0 0.0 0.0 0.0 0.0
Personal Income 0.0 0.0 0.0 0.0 0.0
Sales 38.5 40.4 41.9 43.0 44.3
Lodging 90.7 97.3 103.0 106.5 112.4
Property 417.5 426.5 428.2 429.9 432.0
Excise and Fees 98.5 101.8 107.7 110.9 114.8
State Unemployment 0.0 0.0 0.0 0.0 0.0
(US$ Million)
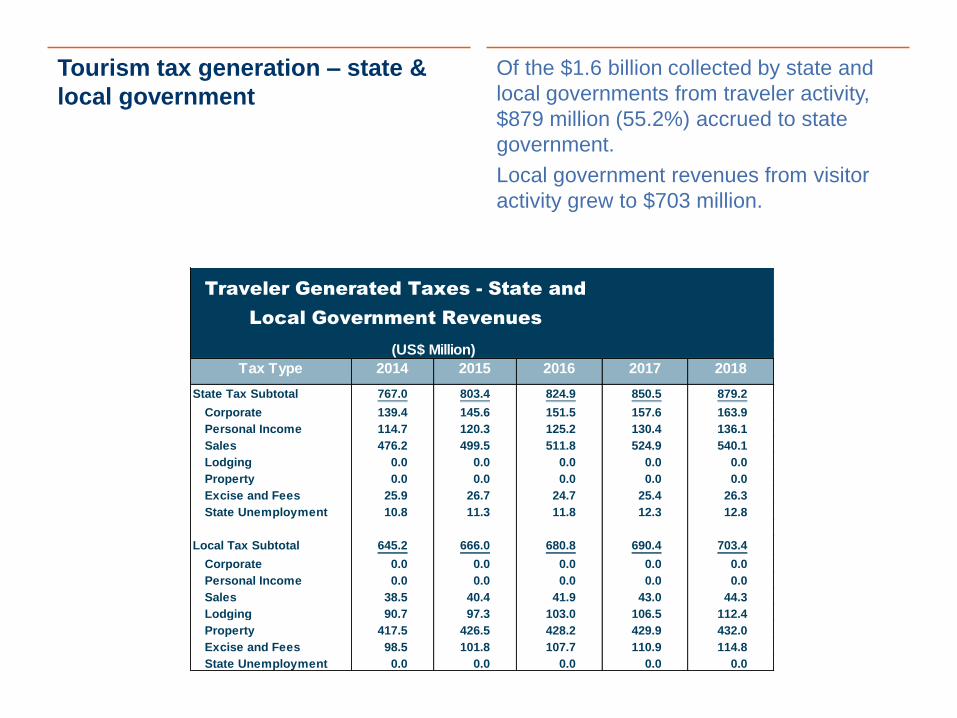
Traveler Generated Taxes - State and
Local Government Revenues
Tourism tax generation – state &
local government
Of the $1.6 billion collected by state and
local governments from traveler activity,
$879 million (55.2%) accrued to state
government.
Local government revenues from visitor
activity grew to $703 million.
About Tourism Economics
| Tourism Economics 33
Tourism Economics is an Oxford Economics company with a singular
objective: combine an understanding of tourism dynamics with
rigorous economics in order to answer the most important questions
facing destinations, developers, and strategic planners. By combining
quantitative methods with industry knowledge, Tourism Economics
designs custom market strategies, destination recovery plans, tourism
forecasting models, tourism policy analysis, and economic impact
studies.
With over four decades of experience of our principal consultants, it is
our passion to work as partners with our clients to achieve a
destination’s full potential.
Oxford Economics is one of the world’s leading providers of economic
analysis, forecasts and consulting advice. Founded in 1981 as a joint
venture with Oxford University’s business college, Oxford Economics
enjoys a reputation for high quality, quantitative analysis and
evidence-based advice. For this, it draws on its own staff of more than
200 professional economists; a dedicated data analysis team; global
modeling tools, and a range of partner institutions in Europe, the US
and in the United Nations Project Link. Oxford Economics has offices
in London, Oxford, Dubai, Philadelphia, and Belfast.
For more information: