Combining Tourism Economic Account and Tourism Employment ...

The EconomicImpact of Tourism
In Prom Country
May 2004
South Gippsland Shire
U aR B NEnterpr i se Pty L td
389 St Georges Rd North Fitzroy, Vic 3068
Ph: (03) 9482 3888, Fax: (03) 9482 3933,
Email: [email protected]
Web: www.urbanenterprise.com.au
Urban Planners
Land Economists
Tourism Planners

Report Authors: Mike Ruzzene Matt Ainsaar
© Copyright, Urban Enterprise Pty Ltd, June 2004.
This work is copyright. Apart from any use as permitted under Copyright Act 1963, no part may be reproduced without written permission of Urban Enterprise Pty Ltd.
Document Information:
Filename: c:\my documents\mike ruzzene\prom country tourism economic impact study\final report\economic impact of tourism 27-05-04.doc
Last Saved: 27 May 2004 3:18 PM
Last Printed: 1 June 2004 9:28 AM
File Size: 915kb
Disclaimer:
Neither Urban Enterprise Pty. Ltd. nor any member or employee of Urban Enterprise Pty. Ltd. takes responsibility in any way whatsoever to any person or organisation (other than that for which this report has been prepared) in respect of the information set out in this report, including any errors or omissions therein. In the course of our preparation of this report, projections have been prepared on the basis of assumptions and methodology, which have been described in the report. It is possible that some of the assumptions underlying the projections may change. Nevertheless, the professional judgement of the members and employees of Urban Enterprise Pty. Ltd. have been applied in making these assumptions, such that they constitute an understandable basis for estimates and projections. Beyond this, to the extent that the assumptions do not materialise, the estimates and projections of achievable results may vary.

CONTENTS
Section Page Section Page
Urban Enterprise Pty Ltd ii Economic Impact of Tourism 1 June 2004 South Gippsland Shire
1 SUMMARY OF THE ECONOMIC IMPACT OF TOURISM 5
1.1 Visitation 5 1.2 Expenditure By Visitors 6 1.3 Businesses Involved in Tourism 7 1.4 Employment In Tourism 8 1.5 Business Income 9 1.6 Capital Investment 10 1.7 Future Trends 11
2 INTRODUCTION 12
2.1 Background 12 2.2 Brief 12 2.3 Scope of works 13 2.4 Survey Methodolgy 14
3 PROFILE OF VISITORS 15
3.1 Key Findings 15 3.2 Introduction 17 3.3 Number of Visitors 19 3.4 Reason for Visit 19 3.5 Visitor Origin 21 3.6 Overnight Stays 24 3.7 Visitor Profile 25 3.8 Visitor Expenditure 26 3.9 Visitor Perception 28 3.10 Visitor Satisfaction 29
4 PROFILE OF HOLIDAY HOMES31
4.1 Key Findings 31 4.2 Introduction 33 4.3 Number of Holiday Homes 34 4.4 Location of Holiday Homes 35 4.5 Origin of Holiday Home Owners 36 4.6 Characteristics of Holiday Home Ownership 40 4.7 Visitation Generated By Holiday Homes 41 4.8 Seasonal Visitation to Holiday Homes 42 4.9 Activities Undertaken By Visitors Staying In
Holiday Homes 45 4.10 Expenditure By Visitors Staying In Holiday
Homes 47 4.11 Expenditure on Holiday Home Maintenance 48
5 PROFILE OF VISITOR ACCOMMODATION 49
5.1 Key Findings 49 5.2 Introduction 52 5.3 Number And Location of Visitor
Accommodation Businesses 53 5.4 Number of Guest Rooms/ Camping Sites 54 5.5 Number of Bed Spaces 55 5.6 Employment 56 5.7 Room And Camping Sites Nights 57 5.8 Guest Nights 58 5.9 Occupancy Rate And Length of Stay 59 5.10 Seasonality of Visitation In Accommodation 60 5.11 Takings 61 5.12 Capital Investment In Accommodation 62
6 PROFILE OF SPECIALISED TOURISM BUSINESSES 63
6.1 Key Findings 63 6.2 Introduction 65 6.3 Number and Location of Specialised Tourism
Businesses 67 6.4 Employment 68 6.5 Capital Investment 69 6.6 Future Capital Investment 2003-2004 70 6.7 Business Income 71
7 PROFILE OF OTHER BUSINESSES THAT BENEFIT FROM TOURISM 72
7.1 Key Findings 72 7.2 Introduction 74 7.3 Number and Location of Businesses 76 7.4 Proportion of Business Turnover Generated
By Visitors to the Shire 77 7.5 Employment 78 7.6 Capital Investment 2002-2003 79 7.7 Future Capital Investment 2003-2004 81 7.8 Business Income 83
8 TOURISM MONITORING FRAMEWORK 84
8.1 Overview of Existing Tourism Research 84 8.2 Monitoring The Economic Impact of Tourism 85

CONTENTS
Section Page Section Page
Urban Enterprise Pty Ltd iii Economic Impact of Tourism 1 June 2004 South Gippsland Shire
9 IMPLICATIONS FOR MARKETING 86
9.1 Visitor Markets 86 9.2 Visitor Perception and Activities – What to
Market 86 9.3 Niche Markets 87
APPENDICES
Appendix A. Glossary of Terms and Definitions 89 Appendix B. References 91

Urban Enterprise Pty Ltd iv Economic Impact of Tourism 1 June 2004 South Gippsland Shire
ACKNOWLEDGEMENTS The assistance of Claire Buckland, Tourism Co-ordinator (South Gippsland Shire) and Christie Sullivan, Tourism Marketing Officer (South Gippsland Shire) in providing information, supporting the project and in distributing and collecting survey responses is gratefully acknowledged.
Urban Enterprise would also like to acknowledge the assistance of all tourism operators who completed business surveys and who assisted in the distribution of visitor surveys throughout the South Gippsland Shire.

Urban Enterprise Pty Ltd 5 Economic Impact of Tourism 1 June 2004 South Gippsland Shire
1 Summary of the Economic Impact of Tourism
1.1 VISITATION The South Gippsland Shire attracts an estimated 1.1 million visitors annually, composing of 577,000 daytrip visitors, and 573,000 overnight visitors. Almost half of all overnight visitors stay in holiday homes. 18% are staying in caravans and camping and 16% stay in cabin accommodation. (Wilson’s Promontory contributes 31% of total visitors staying in caravan parks, and 54% of visitors staying in cabins).
Accommodation Type Number of
Overnight Visitors % of Total Overnight
Visitors Visitor Nights (Guest
Nights)
Guest Houses 3,163 1% 5,378
Hotels 7,084 1% 12,043
B&Bs 7,697 1% 13,086
Backpackers 13,448 2% 22,861
Motels 36,663 6% 62,327
Self Contained 55,736 10% 94,752
Cabins 92,262 16% 156,845
Camping Sites 103,265 18% 663,246
Holiday Homes 257,235 45% 917,320
Total Overnight Visitors 576,553 100% 1,947,858
Source: Urban Enterprise: Based on a survey of all accommodation establishments and holiday homes survey
HIGHLIGHTS • More than one million people visit the South Gippsland Shire each year.
• Visitors spend more than $213 million in the Shire each year.
• More than half of all businesses in the Shire rely on tourism for their income.
• 1700 jobs in the Shire are directly attributed to tourism.
• Two thirds of tourism – related businesses expect to increase earnings thisyear and almost one quarter of all businesses expect to increase employment.
Urban Enterprise Pty Ltd 6 Economic Impact of Tourism 1 June 2004 South Gippsland Shire
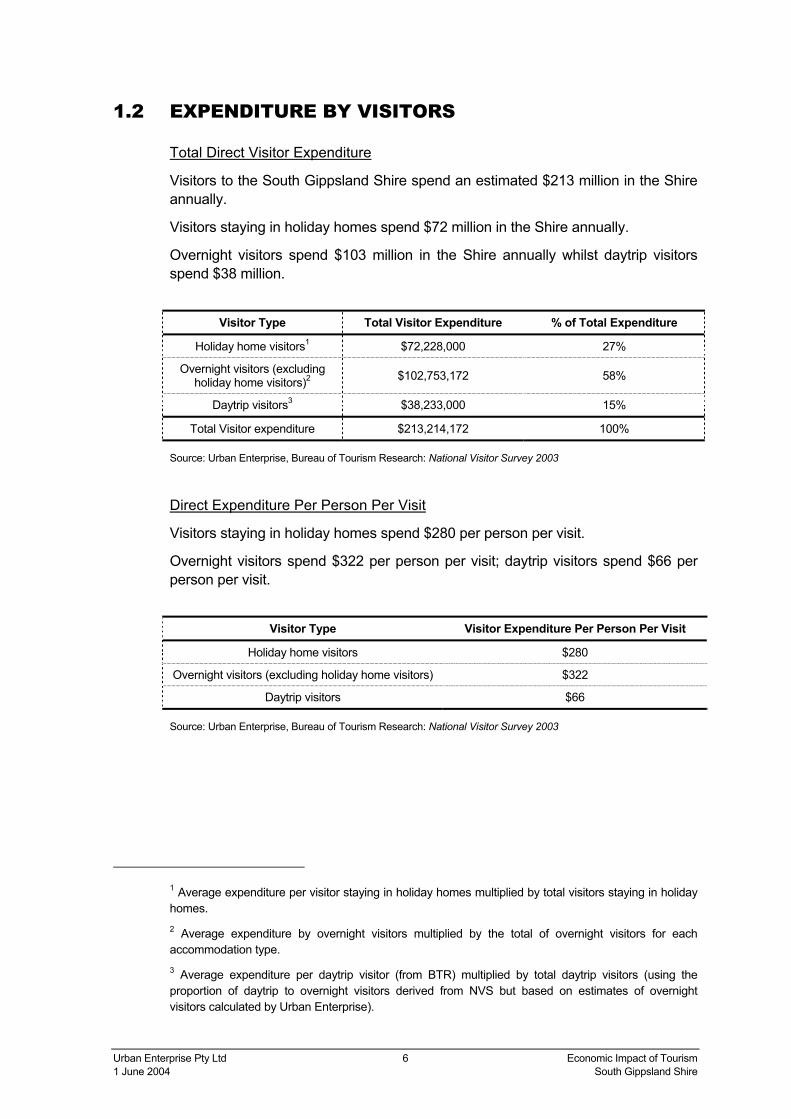
1.2 EXPENDITURE BY VISITORS
Total Direct Visitor Expenditure
Visitors to the South Gippsland Shire spend an estimated $213 million in the Shire annually.
Visitors staying in holiday homes spend $72 million in the Shire annually.
Overnight visitors spend $103 million in the Shire annually whilst daytrip visitors spend $38 million.
Visitor Type Total Visitor Expenditure % of Total Expenditure
Holiday home visitors1 $72,228,000 27%
Overnight visitors (excluding holiday home visitors)2 $102,753,172 58%
Daytrip visitors3 $38,233,000 15%
Total Visitor expenditure $213,214,172 100%
Source: Urban Enterprise, Bureau of Tourism Research: National Visitor Survey 2003
Direct Expenditure Per Person Per Visit
Visitors staying in holiday homes spend $280 per person per visit.
Overnight visitors spend $322 per person per visit; daytrip visitors spend $66 per person per visit.
Visitor Type Visitor Expenditure Per Person Per Visit
Holiday home visitors $280
Overnight visitors (excluding holiday home visitors) $322
Daytrip visitors $66
Source: Urban Enterprise, Bureau of Tourism Research: National Visitor Survey 2003
1 Average expenditure per visitor staying in holiday homes multiplied by total visitors staying in holiday homes. 2 Average expenditure by overnight visitors multiplied by the total of overnight visitors for each accommodation type. 3 Average expenditure per daytrip visitor (from BTR) multiplied by total daytrip visitors (using the proportion of daytrip to overnight visitors derived from NVS but based on estimates of overnight visitors calculated by Urban Enterprise).
Urban Enterprise Pty Ltd 7 Economic Impact of Tourism 1 June 2004 South Gippsland Shire
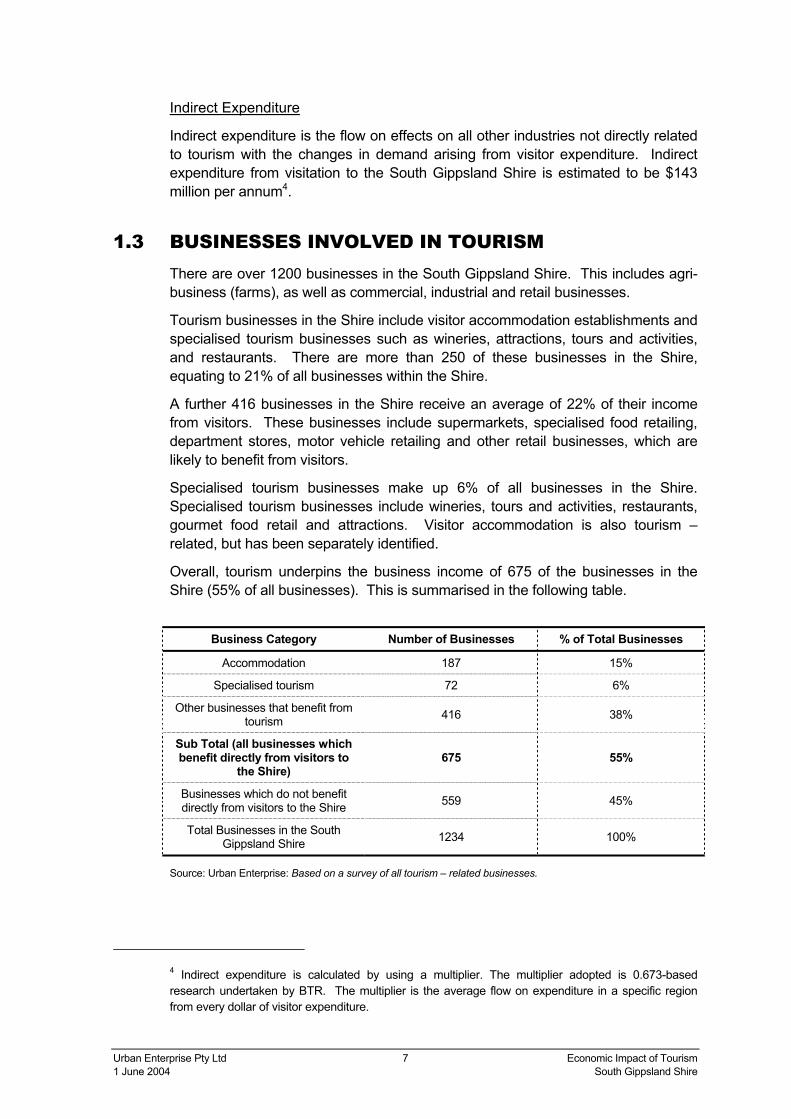
Indirect Expenditure
Indirect expenditure is the flow on effects on all other industries not directly related to tourism with the changes in demand arising from visitor expenditure. Indirect expenditure from visitation to the South Gippsland Shire is estimated to be $143 million per annum4.
1.3 BUSINESSES INVOLVED IN TOURISM There are over 1200 businesses in the South Gippsland Shire. This includes agri-business (farms), as well as commercial, industrial and retail businesses.
Tourism businesses in the Shire include visitor accommodation establishments and specialised tourism businesses such as wineries, attractions, tours and activities, and restaurants. There are more than 250 of these businesses in the Shire, equating to 21% of all businesses within the Shire.
A further 416 businesses in the Shire receive an average of 22% of their income from visitors. These businesses include supermarkets, specialised food retailing, department stores, motor vehicle retailing and other retail businesses, which are likely to benefit from visitors.
Specialised tourism businesses make up 6% of all businesses in the Shire. Specialised tourism businesses include wineries, tours and activities, restaurants, gourmet food retail and attractions. Visitor accommodation is also tourism –related, but has been separately identified.
Overall, tourism underpins the business income of 675 of the businesses in the Shire (55% of all businesses). This is summarised in the following table.
Business Category Number of Businesses % of Total Businesses
Accommodation 187 15%
Specialised tourism 72 6%
Other businesses that benefit from tourism 416 38%
Sub Total (all businesses which benefit directly from visitors to
the Shire) 675 55%
Businesses which do not benefit directly from visitors to the Shire 559 45%
Total Businesses in the South Gippsland Shire 1234 100%
Source: Urban Enterprise: Based on a survey of all tourism – related businesses.
4 Indirect expenditure is calculated by using a multiplier. The multiplier adopted is 0.673-based research undertaken by BTR. The multiplier is the average flow on expenditure in a specific region from every dollar of visitor expenditure.
Urban Enterprise Pty Ltd 8 Economic Impact of Tourism 1 June 2004 South Gippsland Shire
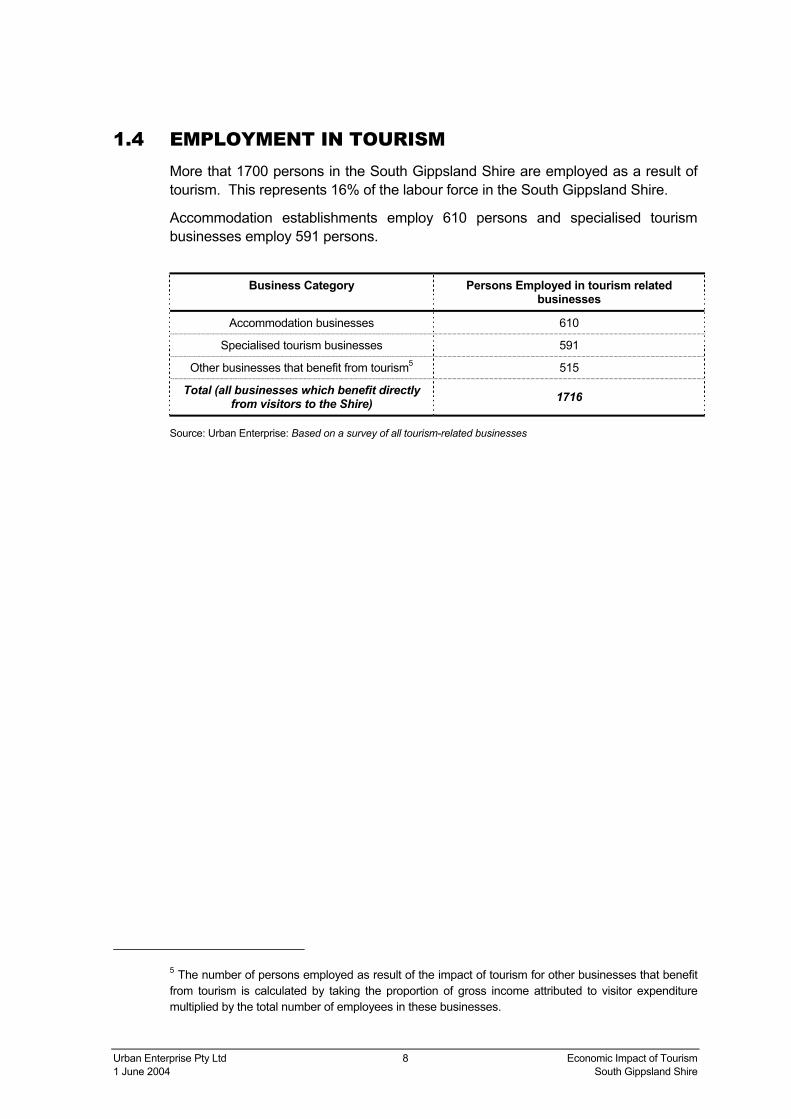
1.4 EMPLOYMENT IN TOURISM More that 1700 persons in the South Gippsland Shire are employed as a result of tourism. This represents 16% of the labour force in the South Gippsland Shire.
Accommodation establishments employ 610 persons and specialised tourism businesses employ 591 persons.
Business Category Persons Employed in tourism related
businesses
Accommodation businesses 610
Specialised tourism businesses 591
Other businesses that benefit from tourism5 515
Total (all businesses which benefit directly from visitors to the Shire) 1716
Source: Urban Enterprise: Based on a survey of all tourism-related businesses
5 The number of persons employed as result of the impact of tourism for other businesses that benefit from tourism is calculated by taking the proportion of gross income attributed to visitor expenditure multiplied by the total number of employees in these businesses.

Urban Enterprise Pty Ltd 9 Economic Impact of Tourism 1 June 2004 South Gippsland Shire
1.5 BUSINESS INCOME
Percentage of Business Turnover Generated From Visitors
Accommodation businesses and specialised tourism businesses clearly generate all or most of their income from visitors.
Other businesses that benefit from tourism, including grocery stores, sport and recreation and specialised food retailing generate over 20% of their income on average from visitors. This is shown in the table below.
Category of Business % of Gross Turnover Generated by Visitors
Supermarket & Grocery Stores 32%
Sport and Recreation 14%
Specialised Food Retailing 36%
Restaurants/Cafes 39%
Recreational Goods Retailing 51%
Personal & House Retail &Services 12%
Motor Vehicle Retailing 11%
Furniture, Household & Appliance Retail 8%
Clothing and Soft Good Retail 12%
Property Services 25%
Average for All Other Businesses 22%
Source: Urban Enterprise

Urban Enterprise Pty Ltd 10 Economic Impact of Tourism 1 June 2004 South Gippsland Shire
1.6 CAPITAL INVESTMENT Tourism –related businesses in the South Gippsland Shire invested $7.2 million in 2002/2003 in capital improvements. Capital was invested in new buildings, renovations, fittings, equipment and vehicles.
Accommodation businesses invested over $4.3 million in capital improvements followed by specialised tourism businesses ($1.7 million) as shown in the table below.
Business Category Capital Investment Made by Tourism
Related Businesses
($Million)
Accommodation businesses $4.3
Specialised tourism businesses $1.7
Other businesses that benefit from tourism6 $1.2
Total (all businesses which benefit directly from visitors to the Shire) $7.2
6 Capital investment for these businesses is calculated by taking the proportion of gross income attributed to visitor expenditure multiplied by the capital investment reported by the businesses.
Source: Urban Enterprise

Urban Enterprise Pty Ltd 11 Economic Impact of Tourism 1 June 2004 South Gippsland Shire
1.7 FUTURE TRENDS
Expected Change in Business Turnover 2004
445 businesses that benefit from visitation to the Shire expect an increase in gross turnover in 2004, this represents two thirds of all tourism businesses.
Expected Change in Persons Employed 2004
One quarter of businesses (162) that benefit from visitation to the Shire expect to increase the number of staff employed in their business. The majority of businesses that expect no change in the number persons employed are small businesses such as bed and breakfasts accommodation.
Source: Urban Enterprise: Profile of Visitor
Accommodation, Profile of Specialised
Tourism Businesses, Profile of Other
Businesses That Benefit From Tourism
Increase66%
Decrease8%
Same26%
Same72%
Decrease4%
Increase24%

Urban Enterprise Pty Ltd 12 Economic Impact of Tourism 1 June 2004 South Gippsland Shire
2 Introduction
2.1 BACKGROUND Urban Enterprise Pty Ltd was commissioned in April 2003 to undertake a study into the economic impact of tourism in the South Gippsland Shire (Prom Country Region).
The aim of the study is to obtain the following:
• Establish baseline information regarding the size and nature of the tourism industry in the region
• Provide quantitative information that would facilitate investment in tourism infrastructure by both public and private sectors
• Provide relevant information about the tourism industry and its performance to prospective investors in the region
• Measure the effectiveness of existing marketing and promotional campaigns
• Inform future marketing and promotional campaigns in the region
2.2 BRIEF The South Gippsland Shire sought a consultancy to undertake quantitative research, which will measure the economic impact of tourism within the Shire. The consultant is required to liase with industry and undertake visitor and industry surveys in order to obtain reflective information on the tourism industry.
The initial timeline for the project was over an 18-month period, however due to funding restrictions this was decreased to a 10-month period. The project began in April 2003 and was completed in May 2004.
Urban Enterprise Pty Ltd 13 Economic Impact of Tourism 1 June 2004 South Gippsland Shire
2.3 SCOPE OF WORKS The following works were undertaken as part of the economic impact study over the 10-month period.
Data in this report is sourced from primary research undertaken by Urban Enterprise in the period August 2003 – April 2004.
Industry Audit and Creation of Databases
The compilation of a holiday homeowner’s database, and industry databases was undertaken as a result of an audit of existing databases from South Gippsland Shire and independent sources. The databases were used for survey mail outs and extrapolation of results.
Holiday Home Owners Survey
The holiday homeowners survey was mailed to 1000 holiday homeowners in late August 2003. The survey was collected and results collated in September 2003.
Visitor Survey
The visitor survey was distributed to visitors in 130 locations across the Shire in October 2003 – March 2004. The survey results were collated in April 2004.
Survey of Visitor Accommodation
The survey of visitor accommodation was mailed to all accommodation businesses in the Shire in late August 2003. Completed surveys were received before the end of September 2003. A follow up survey over the phone was conducted for all businesses, which did not complete the mailed out survey. The survey results were collated in September 2003.
Survey of Specialised Tourism Businesses
A survey was mailed to all identified specialised tourism businesses in the Shire in October 2003. Completed surveys were received before the end of October 2003. A follow up survey over the phone was conducted for all businesses, which did not complete the mailed out survey. Results were collated in November 2003.
Survey of Other Relevant Businesses
A survey was mailed to all businesses in the Shire, which were identified as likely to benefit from tourist visitation. Completed surveys were received before October 2003 and survey results were collated in November 2003.
Reporting of the Results
Results from the surveys have been released at intervals throughout the study period. The final report document contains all results from the surveys and the economic impact of tourism in the South Gippsland Shire.
Urban Enterprise Pty Ltd 14 Economic Impact of Tourism 1 June 2004 South Gippsland Shire
2.4 SURVEY METHODOLGY A detailed methodology for each of the five surveys is contained in their corresponding sections of this report.
All data in the report has been sourced from results obtained from the five surveys conducted for the project and supplemented by the National Visitor Survey results 2003 undertaken by the Bureau of Tourism Research.
Total visitor numbers and expenditure figures can be obtained from the Bureau of Tourism Research using CDMota, however the error margins are too great at the local level.7 Therefore the results from the accommodation and holiday homes surveys undertaken by Urban Enterprise have been used to estimate total visitor numbers, as these results are more reliable.
7 For example, NVS data on visitors to the South Gippsland Shire has an error margin of 20%, i.e. the actual visitor numbers could vary +/- 20% from those estimated at the 95% confidence interval.
Urban Enterprise Pty Ltd 15 Economic Impact of Tourism 1 June 2004 South Gippsland Shire
3 Profile of Visitors
3.1 KEY FINDINGS
Number of Visitors
South Gippsland Shire attracts an estimated 1.1 million visitors annually. Of these 577,000 are overnight visitors and 573,000 are daytrip visitors.
Reason for Visiting
68% of visitors to the South Gippsland are visiting for “holiday or leisure”.
28% of visitors to South Gippsland Shire are regular visitors, a further 20% were recommended to visit.
The Internet was the most widely used information source, with 32% of visitors using it to plan their trip.
Visitor Origin
73% of visitors to the South Gippsland Shire are from Melbourne. 14% of visitors are from country Victoria, 11% are from interstate and a further 3% are from overseas.
Overnight Stays
50% of visitors are staying overnight. The average length of stay for overnight visitors is 3.7 nights.
HIGHLIGHTS • The South Gippsland Shire attracts an estimated 1.1 million visitors annually.
• Wilson’s Promontory is a significant attraction for visitors to South Gippsland Shire, with72% visiting a National Park.
• Daytrip and overnight visitors to the South Gippsland Shire (not including those staying inholiday homes) spend $141 million per annum in the Shire.
Urban Enterprise Pty Ltd 16 Economic Impact of Tourism 1 June 2004 South Gippsland Shire
44% of overnight visitors stay in paid accommodation, of these 40% stay in caravan parks or were camping.
Visitor Activities
76% of visitors to the South Gippsland Shire went general sightseeing, 72% visited a national park, and a further 56% of visitors went to the beach.
Visitor Expenditure
Daytrip visitors to the South Gippsland Shire spend an estimated $38 million annually. Overnight visitors to the South Gippsland Shire (excluding visitors staying in holiday homes) spend an estimated $103 million annually.
Daytrip visitors spend an estimated $66 per person per visit. Overnight visitors (excluding visitors staying holiday homes) spend an estimated $322 per person per visit.
Visitor Perception
52% of visitors perceive the South Gippsland Shire as being “relaxing and peaceful”. 43% of visitors to the South Gippsland Shire associated it with Wilson’s Promontory.
Visitor Satisfaction
Visitors were generally satisfied with visitor information, the range of activities available, tourist signage, accommodation, customer service and picnic and BBQ areas.
Visitors were most satisfied with the accommodation in the South Gippsland Shire; Visitors were least satisfied with public toilets.

Urban Enterprise Pty Ltd 17 Economic Impact of Tourism 1 June 2004 South Gippsland Shire
3.2 INTRODUCTION This section provides a profile of visitors to Prom Country, including key economic indicators such as visitor expenditure, expenditure items, accommodation type used, and proportion of overnight visitors compared to daytrip visitors.
The data is sourced from a visitor survey conducted from October 2003 to March 2004. Quantitative data is supplemented with the National Visitor Survey 2003 conducted by the Bureau of Tourism Research, where the data is reliable at the LGA level.
Methodology
The survey collected data for the following:
• Reason for visit
• Influence of visit
• Previous visit to Shire
• Type of travel party
• Overnight stay
• Accommodation type
• Number of nights stay
• Activities undertaken
• Visitor perception
• Age group
• Intention to revisit
• Visitor origin
The survey questionnaires were distributed to 130 tourism businesses in the South Gippsland Shire as well as the Shire’s visitor information centres (VICs). Visitors to these businesses and VICs were encouraged to complete the survey.
Survey Period
Visitors completed the surveys over a six-month period from October 2003 - March 2004.
Survey Sample
434 completed responses were received from visitors to South Gippsland Shire.

Urban Enterprise Pty Ltd 18 Economic Impact of Tourism 1 June 2004 South Gippsland Shire
The survey responses for each town/location are shown below:
Town/Location Number of
responses
Foster 96
Yanakie 76
Korumburra 31
Loch 29
Leongatha 28
Sandy point 27
Waratah Bay 22
Koonwarra 18
Welshpool 18
Toora 17
Mirboo North 18
Port Welshpool 11
Bena 10
Tarwin lower 8
Fish Creek 8
Lyrebird Hill Winery 4
Wilsons prom 3
Waratah North 3
Tarra Valley 3
Walkerville North 2
Venus Bay 2
Total 434
The age groups of respondents to the survey are shown below:
Although not a random sample the survey results are considered to be reliable due to the broad sample of visitors surveyed from 28 locations throughout the Shire. In addition to this the sample size is considered statistically significant with 434 survey respondents.
8%
20%
24%
21%
23%
2%
3%
0% 10% 20% 30%
65+
55-64
44-54
35-44
25 -34
18-25
U18
Urban Enterprise Pty Ltd 19 Economic Impact of Tourism 1 June 2004 South Gippsland Shire
3.3 NUMBER OF VISITORS
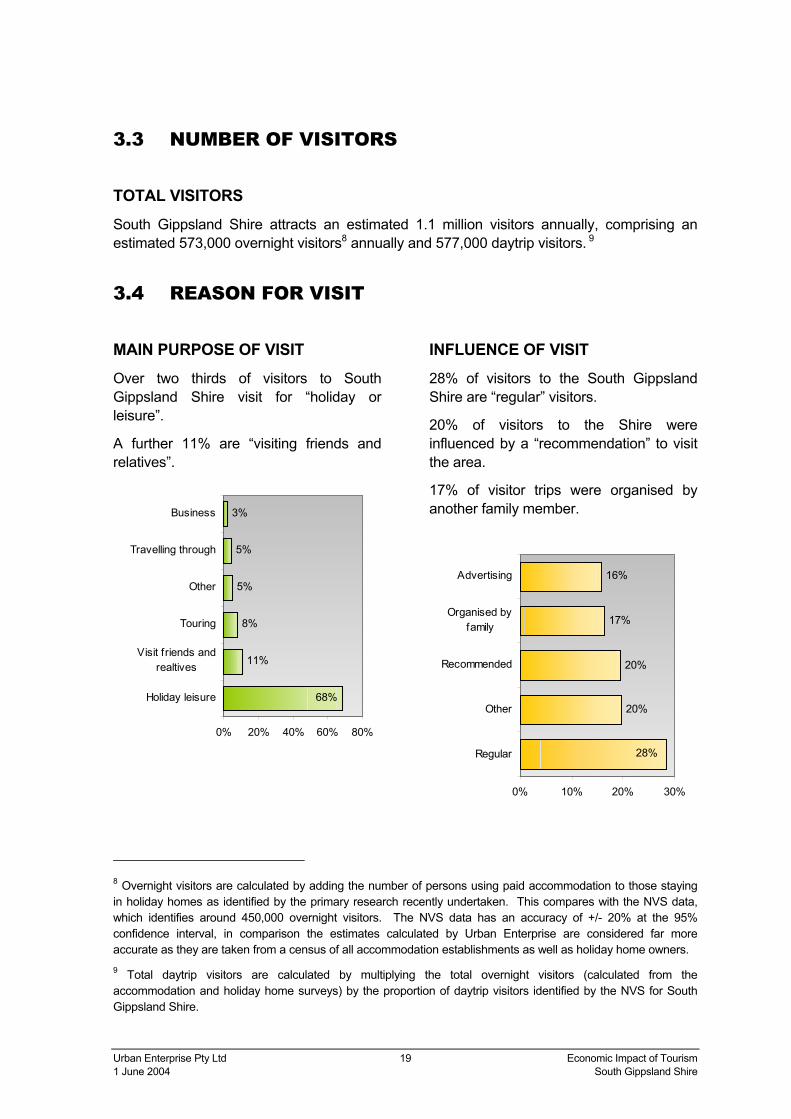
TOTAL VISITORS South Gippsland Shire attracts an estimated 1.1 million visitors annually, comprising an estimated 573,000 overnight visitors8 annually and 577,000 daytrip visitors. 9
3.4 REASON FOR VISIT
8 Overnight visitors are calculated by adding the number of persons using paid accommodation to those staying in holiday homes as identified by the primary research recently undertaken. This compares with the NVS data, which identifies around 450,000 overnight visitors. The NVS data has an accuracy of +/- 20% at the 95% confidence interval, in comparison the estimates calculated by Urban Enterprise are considered far more accurate as they are taken from a census of all accommodation establishments as well as holiday home owners. 9 Total daytrip visitors are calculated by multiplying the total overnight visitors (calculated from the accommodation and holiday home surveys) by the proportion of daytrip visitors identified by the NVS for South Gippsland Shire.
MAIN PURPOSE OF VISIT Over two thirds of visitors to South Gippsland Shire visit for “holiday or leisure”.
A further 11% are “visiting friends and relatives”.
INFLUENCE OF VISIT 28% of visitors to the South Gippsland Shire are “regular” visitors.
20% of visitors to the Shire were influenced by a “recommendation” to visit the area.
17% of visitor trips were organised by another family member.
11%
8%
5%
5%
3%
68%
0% 20% 40% 60% 80%
Holiday leisure
Visit friends andrealtives
Touring
Other
Travelling through
Business
20%
20%
17%
16%
28%
0% 10% 20% 30%
Regular
Other
Recommended
Organised byfamily
Advertising

Urban Enterprise Pty Ltd 20 Economic Impact of Tourism 1 June 2004 South Gippsland Shire
INFORMATION SOURCE Almost one third of all visitors to the South Gippsland Shire used the “Internet” to plan their trip.
21% of visitors used a “tourist publication” and a further 18% used a “visitor information centre” to plan their trip.
PREVIOUS VISITATION 65% of visitors to South Gippsland Shire have visited previously.
24%
21%
18%
16%
6%
32%
0% 10% 20% 30% 40%
Internet
None
TouristPublication
VIC
Other
New spaper
Yes65%
No35%
Urban Enterprise Pty Ltd 21 Economic Impact of Tourism 1 June 2004 South Gippsland Shire
3.5 VISITOR ORIGIN
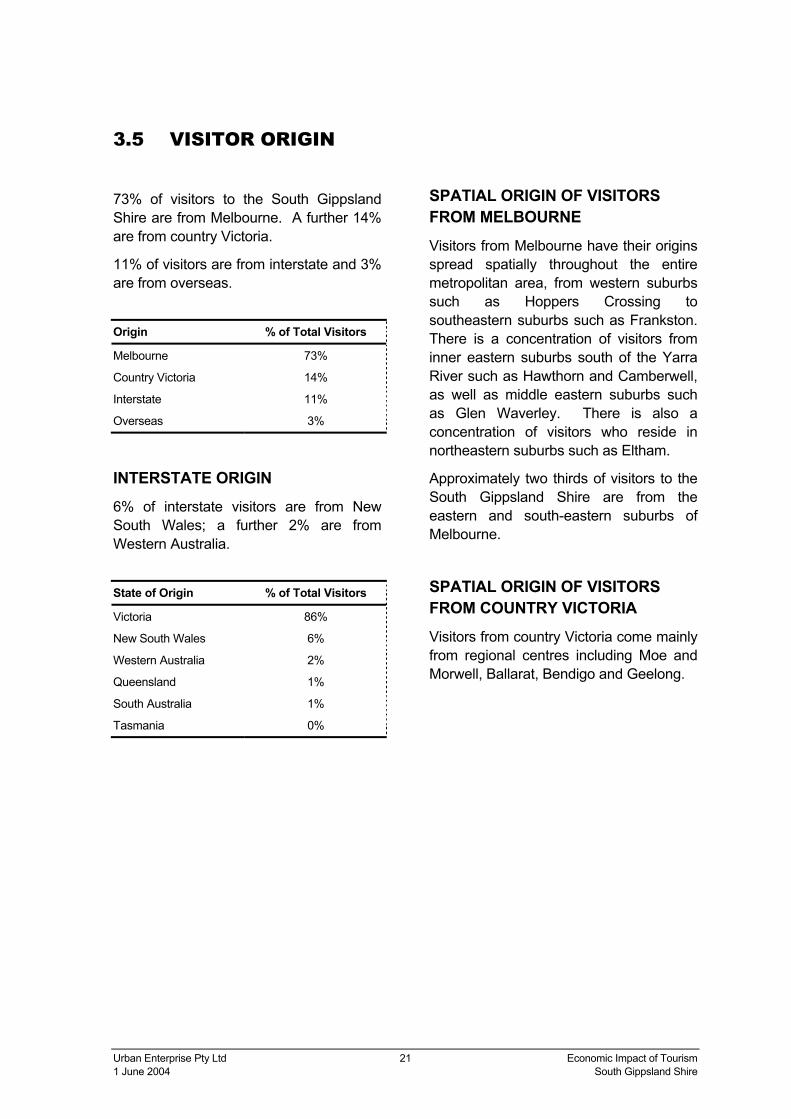
73% of visitors to the South Gippsland Shire are from Melbourne. A further 14% are from country Victoria.
11% of visitors are from interstate and 3% are from overseas.
Origin % of Total Visitors
Melbourne 73%
Country Victoria 14%
Interstate 11%
Overseas 3%
INTERSTATE ORIGIN 6% of interstate visitors are from New South Wales; a further 2% are from Western Australia.
State of Origin % of Total Visitors
Victoria 86%
New South Wales 6%
Western Australia 2%
Queensland 1%
South Australia 1%
Tasmania 0%
SPATIAL ORIGIN OF VISITORS FROM MELBOURNE Visitors from Melbourne have their origins spread spatially throughout the entire metropolitan area, from western suburbs such as Hoppers Crossing to southeastern suburbs such as Frankston. There is a concentration of visitors from inner eastern suburbs south of the Yarra River such as Hawthorn and Camberwell, as well as middle eastern suburbs such as Glen Waverley. There is also a concentration of visitors who reside in northeastern suburbs such as Eltham.
Approximately two thirds of visitors to the South Gippsland Shire are from the eastern and south-eastern suburbs of Melbourne.
SPATIAL ORIGIN OF VISITORS FROM COUNTRY VICTORIA Visitors from country Victoria come mainly from regional centres including Moe and Morwell, Ballarat, Bendigo and Geelong.


Urban Enterprise Pty Ltd 24 Economic Impact of Tourism 1 June 2004 South Gippsland Shire
3.6 OVERNIGHT STAYS
PROPORTION STAYING OVERNIGHT The South Gippsland Shire attracts an equal proportion of daytrip and overnight visitors.
Source: Bureau of Tourism Research, National Visitor
Survey 2003
LENGTH OF STAY The average length of stay for overnight visitors is 3.7 nights; this is a similar result as that found by visitors staying holiday homes who stay for 3.6 nights.
36% of overnight visitors stay 2 nights, a further 26% stay between 3-4 nights.
ACCOMMODATION TYPE10 Almost one third of visitors stay with “friends or relatives” when visiting South Gippsland Shire.
44% of visitors to South Gippsland Shire stay in paid accommodation.
Source: Bureau of Tourism Research, National Visitor
Survey 2003
10 The accommodation type data has been sourced from BTR for South Gippsland Shire, as the results from the Survey of Visitors conducted by Urban Enterprise were skewed due to the large amount of surveys completed at B&B accommodation.
Overnight visitors
50%
Day-trippers
50%
8%
26%
20%
36%
9%
0% 10% 20% 30% 40%
8+ Nights
5-7 Nights
3-4 Nights
2 Nights
1 Night
32%
23%
17%
14%
7%
6%
1%
0% 10% 20% 30% 40%
Friends or relativesproperty
Caravan park
Caravan/ camping
Hotel, Motel
Ow n property
Self Contained
Guest house or B&B
Urban Enterprise Pty Ltd 25 Economic Impact of Tourism 1 June 2004 South Gippsland Shire
3.7 VISITOR PROFILE
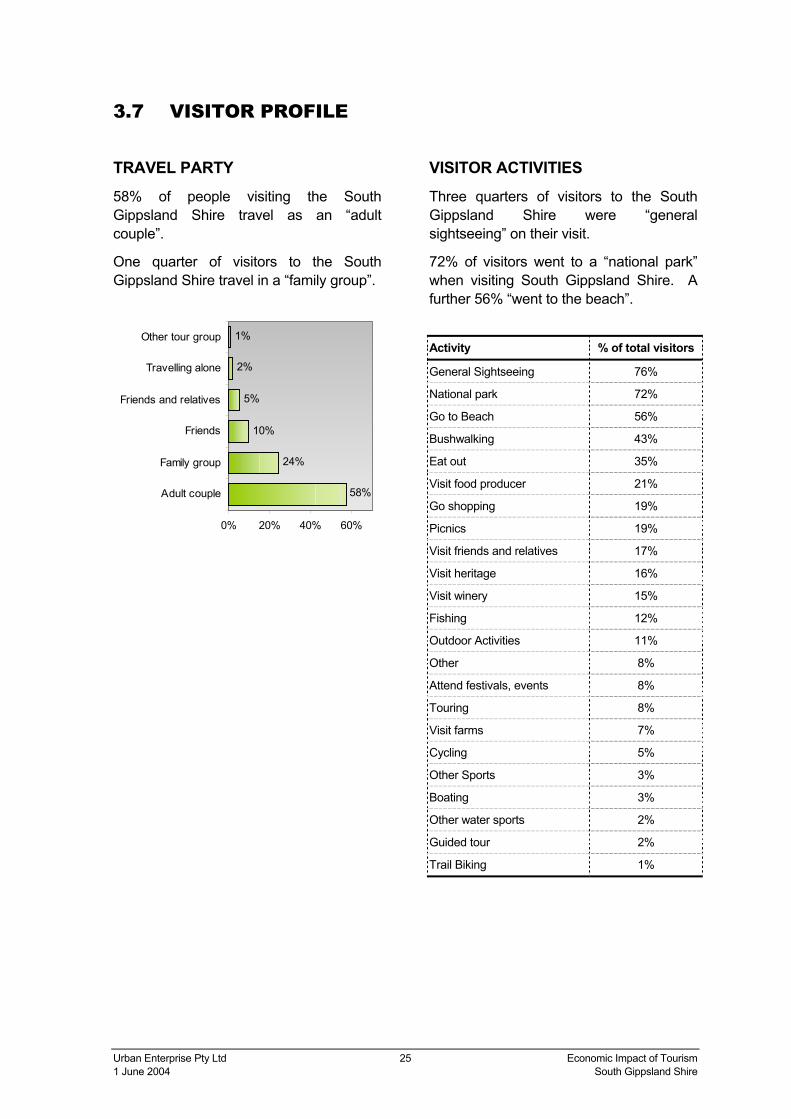
TRAVEL PARTY 58% of people visiting the South Gippsland Shire travel as an “adult couple”.
One quarter of visitors to the South Gippsland Shire travel in a “family group”.
VISITOR ACTIVITIES Three quarters of visitors to the South Gippsland Shire were “general sightseeing” on their visit.
72% of visitors went to a “national park” when visiting South Gippsland Shire. A further 56% “went to the beach”.
Activity % of total visitors
General Sightseeing 76%
National park 72%
Go to Beach 56%
Bushwalking 43%
Eat out 35%
Visit food producer 21%
Go shopping 19%
Picnics 19%
Visit friends and relatives 17%
Visit heritage 16%
Visit winery 15%
Fishing 12%
Outdoor Activities 11%
Other 8%
Attend festivals, events 8%
Touring 8%
Visit farms 7%
Cycling 5%
Other Sports 3%
Boating 3%
Other water sports 2%
Guided tour 2%
Trail Biking 1%
24%
10%
5%
2%
1%
58%
0% 20% 40% 60%
Adult couple
Family group
Friends
Friends and relatives
Travelling alone
Other tour group
Urban Enterprise Pty Ltd 26 Economic Impact of Tourism 1 June 2004 South Gippsland Shire
3.8 VISITOR EXPENDITURE
DAYTRIP EXPENDITURE11
Total Daytrip Expenditure
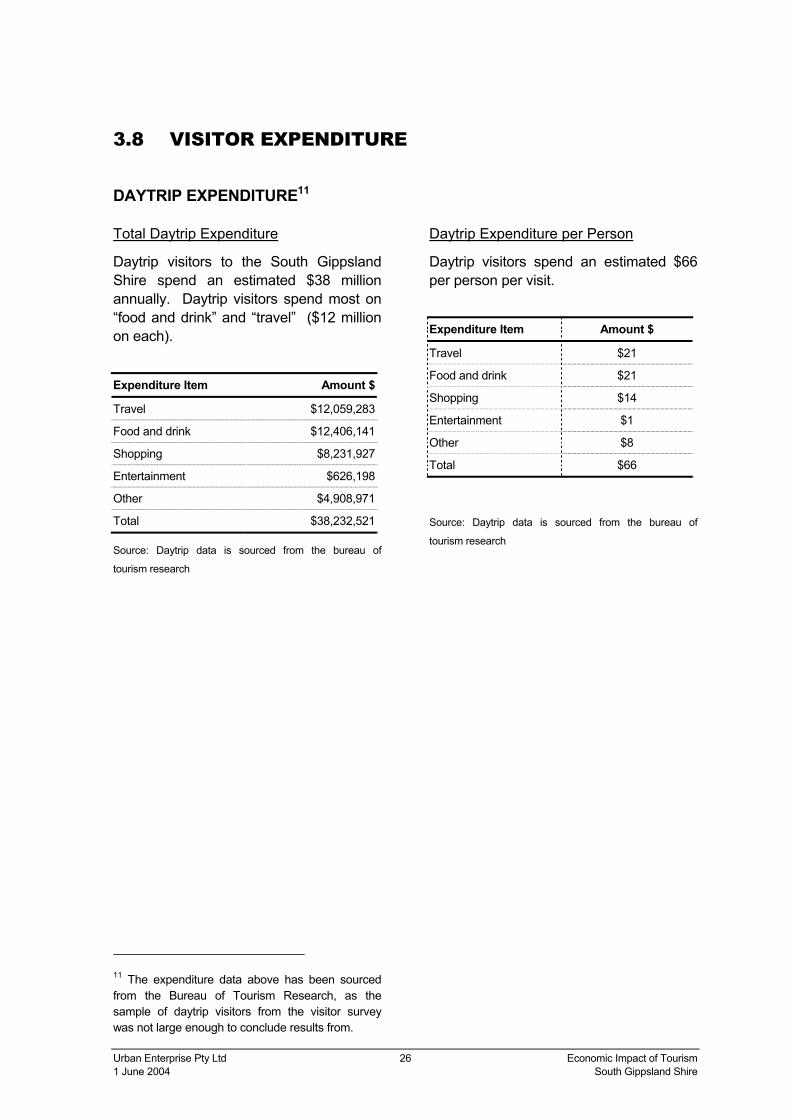
Daytrip visitors to the South Gippsland Shire spend an estimated $38 million annually. Daytrip visitors spend most on “food and drink” and “travel” ($12 million on each).
Expenditure Item Amount $
Travel $12,059,283
Food and drink $12,406,141
Shopping $8,231,927
Entertainment $626,198
Other $4,908,971
Total $38,232,521
Source: Daytrip data is sourced from the bureau of
tourism research
11 The expenditure data above has been sourced from the Bureau of Tourism Research, as the sample of daytrip visitors from the visitor survey was not large enough to conclude results from.
Daytrip Expenditure per Person
Daytrip visitors spend an estimated $66 per person per visit.
Expenditure Item Amount $
Travel $21
Food and drink $21
Shopping $14
Entertainment $1
Other $8
Total $66
Source: Daytrip data is sourced from the bureau of
tourism research
Urban Enterprise Pty Ltd 27 Economic Impact of Tourism 1 June 2004 South Gippsland Shire
OVERNIGHT EXPENDITURE
Total Overnight Expenditure
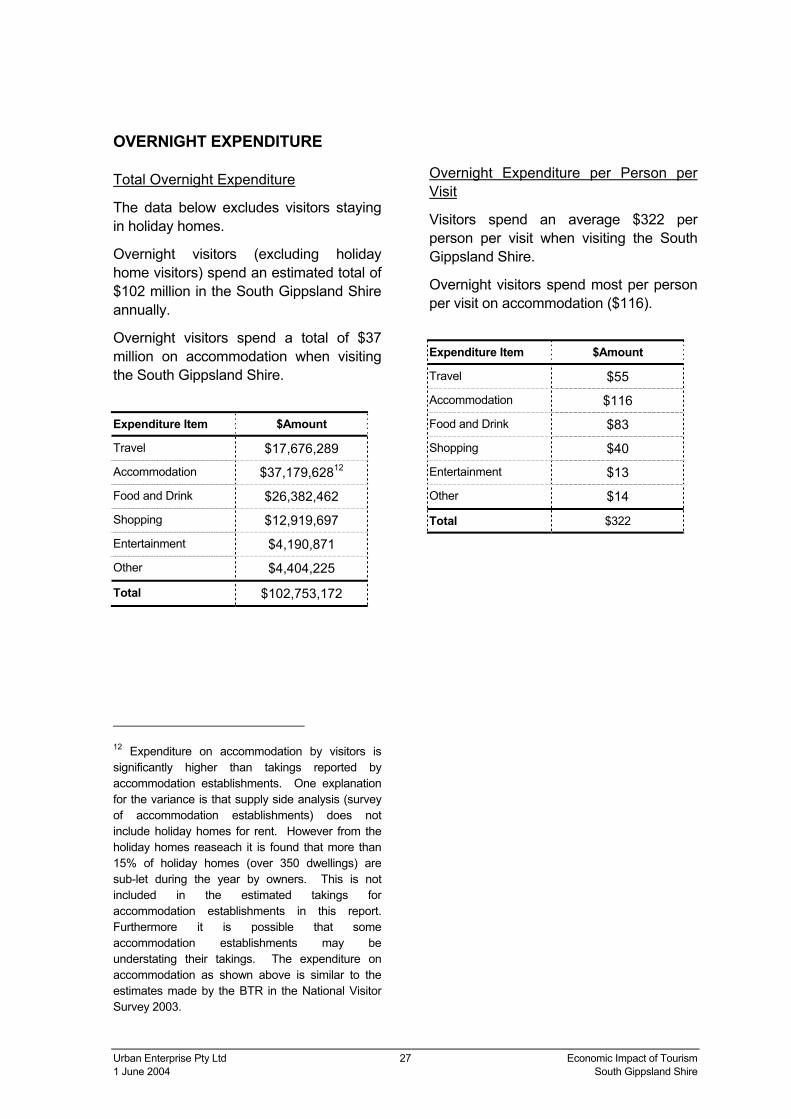
The data below excludes visitors staying in holiday homes.
Overnight visitors (excluding holiday home visitors) spend an estimated total of $102 million in the South Gippsland Shire annually.
Overnight visitors spend a total of $37 million on accommodation when visiting the South Gippsland Shire.
Expenditure Item $Amount
Travel $17,676,289
Accommodation $37,179,62812
Food and Drink $26,382,462
Shopping $12,919,697
Entertainment $4,190,871
Other $4,404,225
Total $102,753,172
12 Expenditure on accommodation by visitors is significantly higher than takings reported by accommodation establishments. One explanation for the variance is that supply side analysis (survey of accommodation establishments) does not include holiday homes for rent. However from the holiday homes reaseach it is found that more than 15% of holiday homes (over 350 dwellings) are sub-let during the year by owners. This is not included in the estimated takings for accommodation establishments in this report. Furthermore it is possible that some accommodation establishments may be understating their takings. The expenditure on accommodation as shown above is similar to the estimates made by the BTR in the National Visitor Survey 2003.
Overnight Expenditure per Person per Visit
Visitors spend an average $322 per person per visit when visiting the South Gippsland Shire.
Overnight visitors spend most per person per visit on accommodation ($116).
Expenditure Item $Amount
Travel $55
Accommodation $116
Food and Drink $83
Shopping $40
Entertainment $13
Other $14
Total $322
Urban Enterprise Pty Ltd 28 Economic Impact of Tourism 1 June 2004 South Gippsland Shire
3.9 VISITOR PERCEPTION
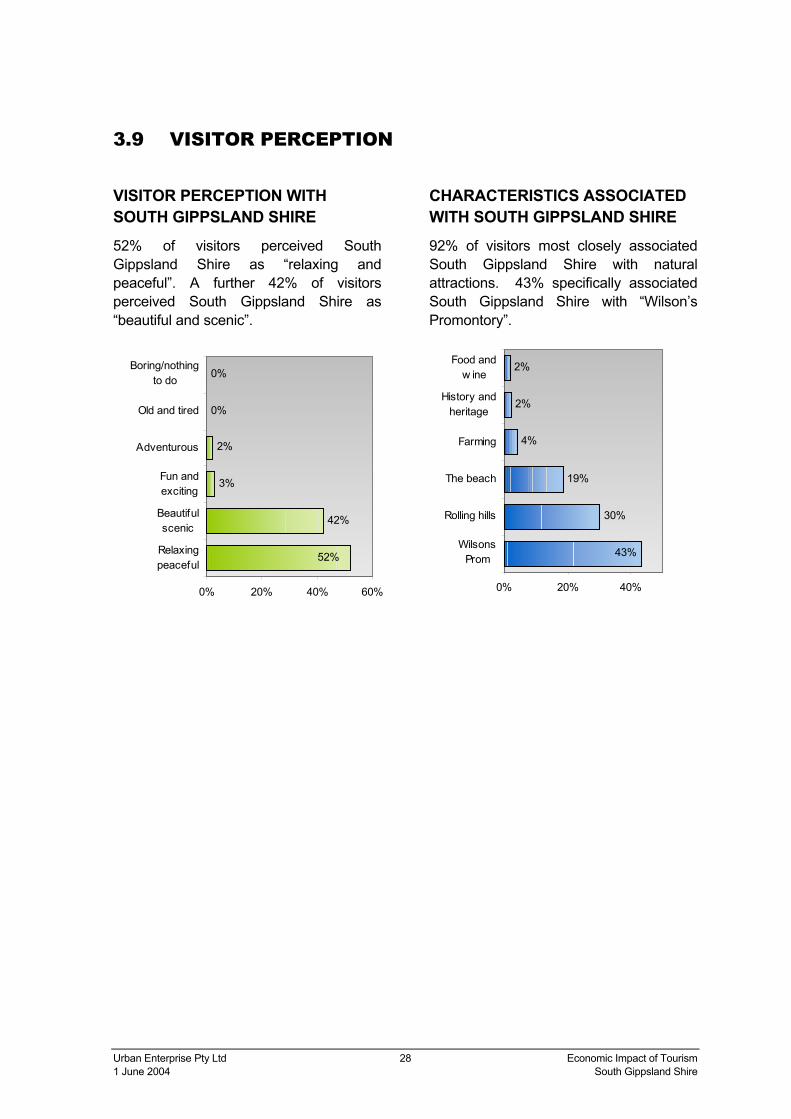
VISITOR PERCEPTION WITH SOUTH GIPPSLAND SHIRE 52% of visitors perceived South Gippsland Shire as “relaxing and peaceful”. A further 42% of visitors perceived South Gippsland Shire as “beautiful and scenic”.
CHARACTERISTICS ASSOCIATED WITH SOUTH GIPPSLAND SHIRE 92% of visitors most closely associated South Gippsland Shire with natural attractions. 43% specifically associated South Gippsland Shire with “Wilson’s Promontory”.
42%
3%
2%
0%
0%
52%
0% 20% 40% 60%
Relaxingpeaceful
Beautifulscenic
Fun andexciting
Adventurous
Old and tired
Boring/nothingto do
30%
19%
4%
2%
2%
43%
0% 20% 40%
WilsonsProm
Rolling hills
The beach
Farming
History andheritage
Food andw ine
Urban Enterprise Pty Ltd 29 Economic Impact of Tourism 1 June 2004 South Gippsland Shire
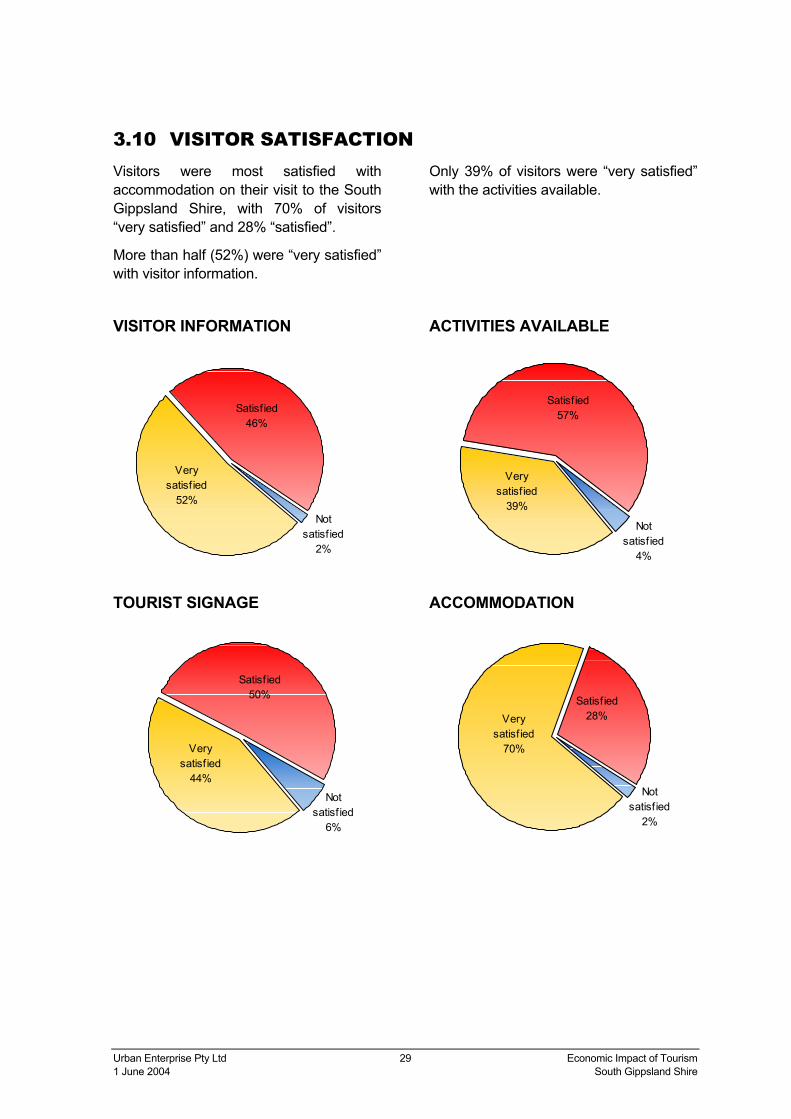
3.10 VISITOR SATISFACTION Visitors were most satisfied with accommodation on their visit to the South Gippsland Shire, with 70% of visitors “very satisfied” and 28% “satisfied”.
More than half (52%) were “very satisfied” with visitor information.
VISITOR INFORMATION
TOURIST SIGNAGE
Only 39% of visitors were “very satisfied” with the activities available.
ACTIVITIES AVAILABLE
ACCOMMODATION
Satisfied46%
Very satisf ied
52%
Not satisf ied
2%
Satisfied50%
Very satisf ied
44%
Not satisf ied
6%
Not satisf ied
4%
Very satisf ied
39%
Satisfied57%
Satisfied28%Very
satisf ied70%
Not satisf ied
2%
Urban Enterprise Pty Ltd 30 Economic Impact of Tourism 1 June 2004 South Gippsland Shire
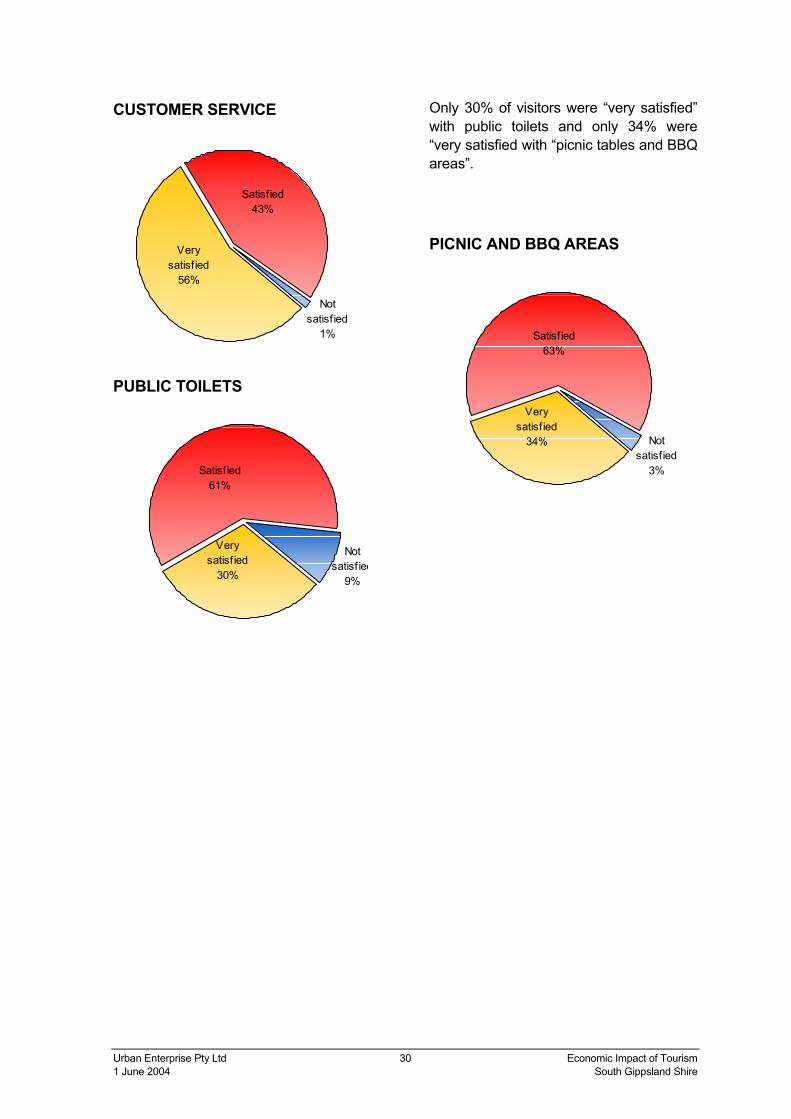
CUSTOMER SERVICE
PUBLIC TOILETS
Only 30% of visitors were “very satisfied” with public toilets and only 34% were “very satisfied with “picnic tables and BBQ areas”.
PICNIC AND BBQ AREAS
Not satisf ied
1%
Very satisf ied
56%
Satisfied43%
Satisfied61%
Very satisf ied
30%
Not satisf ied
9%
Not satisf ied
3%
Very satisf ied
34%
Satisfied63%

Urban Enterprise Pty Ltd 31 Economic Impact of Tourism 1 June 2004 South Gippsland Shire
4 Profile of Holiday Homes
4.1 KEY FINDINGS
Number and Location of Holiday Homes
• There are an estimated 2458 holiday homes in the South Gippsland Shire. This is around one quarter of all residential properties in the Shire.
• The majority of holiday homes in the South Gippsland Shire are located in Venus Bay (40% of holiday houses) and Sandy Point (18%).
Characteristics of Holiday Home Ownership
• The vast majority of holiday homeowners (89%) live in Melbourne.
• The main reason for purchasing a holiday home in the South Gippsland Shire was the natural beauty and tranquillity of the area.
• Almost half of all holiday homeowners have owned their holiday home for more than 11 years.
Visitation Generated by Holiday Homes
• An estimated 257,000 visitors stay in holiday homes in the South Gippsland Shire each year.
• Three quarters of visitors staying in holiday homes are owners and their families.
• An estimated 917,000 visitor days are spent in holiday homes each year in the South Gippsland Shire.
HIGHLIGHTS • There are almost 2500 holiday homes in the South Gippsland Shire – one quarter of the
housing stock.
• Holiday homes attract over 257,000 visitors to South Gippsland Shire each year.(Almost half of all overnight visitors).
• Visitors staying in holiday homes spend more than $72 million in South Gippsland Shireeach year.

Urban Enterprise Pty Ltd 32 Economic Impact of Tourism 1 June 2004 South Gippsland Shire
• The average length of stay for visitors staying in holiday homes is 3.6 days per visit.
• The average number of visits per holiday home is 27 days per year.
• Visitation and length of stay is clearly higher in the summer months. The actual visits made to holiday homes are generally steady through the rest of the year.
Visitor Activities
• The most popular activity undertaken by visitors staying in holiday homes is “going to the beach” (90%).
• “General sightseeing” (66%) and “fishing” (61%) are also popular activities. Visitors staying in holiday homes in Port Welshpool prefer to “go fishing” (89%), or “go boating” (79%).
Expenditure
• Visitors staying in holiday homes spend an estimated $72 million per year within the South Gippsland Shire.
• Average expenditure per person per visit is $280.
• Visitors spend most money on food and drink ($30 million).
• Holiday homeowners in the South Gippsland Shire spend over $5 million per year on holiday home and garden maintenance.
• An average of $2102 is spent each year on holiday home maintenance, per home.

Urban Enterprise Pty Ltd 33 Economic Impact of Tourism 1 June 2004 South Gippsland Shire
4.2 INTRODUCTION This section provides an analysis of the economic impact of holiday homes in South Gippsland Shire.
Methodology
Holiday homeowners were identified using the South Gippsland Shire’s property database. They were identified using the following method:
• All residential properties were identified (non-improved or vacant land was excluded);
• Owners of these properties who live outside the South Gippsland Shire were identified;
• Public or private company / business owners were excluded.
A random sample of 1000 holiday homeowners were sent a questionnaire designed to collect the following information:
• Reason for purchasing holiday home in area
• Length of ownership of holiday home
• Number of visits
• Number of days holiday home was used
• Activities undertaken
• Expenditure
Information requested related to the financial year 2002-2003.
275 completed responses were received from holiday homeowners. Results were extrapolated for all holiday houses to calculate visitation and expenditure.
The following formula was used for extrapolation:
Using the 95% confidence interval, the margin for error for the survey is calculated at 5%. This means that we can be 95% confident that the actual results for the survey are within 5% of the results shown.
This is an acceptable error margin for the purposes of this study.
Averages for completed surveys X
Total holiday homes in database =
Total number

Urban Enterprise Pty Ltd 34 Economic Impact of Tourism 1 June 2004 South Gippsland Shire
4.3 NUMBER OF HOLIDAY HOMES 2458 holiday homes were identified from the Council property database of 9,906 residential properties in the South Gippsland Shire. In other words approximately one quarter of all residential properties in the Shire are holiday homes.
This is verified by an analysis of unoccupied dwellings as identified by the ABS 2001 census in South Gippsland Shire. The proportion of unoccupied dwellings on census night is similar to the proportion of holiday homes as identified by the consultants from the council’s database.

Urban Enterprise Pty Ltd 35 Economic Impact of Tourism 1 June 2004 South Gippsland Shire
4.4 LOCATION OF HOLIDAY HOMES The Table below shows the location of holiday homes in the Shire.
Town Number of holiday
homes % of total holiday
homes % of total responses
received
Venus Bay 993 40% 50%
Sandy Point 449 18% 21%
Walkerville 141 6% 4%
Foster 117 5% 2%
Korumburra 113 5% 1%
Leongatha 84 3% 1%
Port Welshpool 73 3% 5%
Mirboo North 71 3% 1%
Waratah Bay 58 2% 2%
Toora 51 2% 1%
Fish Creek 40 2% 2%
Nyora 35 1% 0%
Yanakie 34 1% 2%
Kongwak area 26 1% 0%
Tarwin Lower 25 1% 1%
Welshpool 25 1% 6%
Poowong 19 1% 0%
Loch 16 1% 0%
Meeniyan 16 1% 0%
Port Franklin 16 1% 0%
Waratah North 15 1% 1%
Kardella 13 1% 0%
Other 13 1% 0%
Dumbalk 11 0% 0%
Bena 4 0% 0%
Total 2458 100% 100%
The Table indicates that the survey responses received are a reasonably representative sample of the distribution of holiday homes throughout the Shire.
Venus Bay has the most holiday homes in the South Gippsland Shire, (almost 1000 holiday homes, making up 40% of the holiday homes in the Shire). This is followed by Sandy Point (449 holiday homes, representing 18% of holiday homes).

Urban Enterprise Pty Ltd 36 Economic Impact of Tourism 1 June 2004 South Gippsland Shire
4.5 ORIGIN OF HOLIDAY HOME OWNERS
Origin of Owners Number of Owners
Percentage of Owners
Metropolitan Melbourne 2171 89%
Country Victoria 226 9%
Interstate 61 2%
Total 2458 100%
89% of holiday homeowners live in Metropolitan Melbourne. A further 9% live in country Victoria and 2% of holiday homeowners live interstate.
MELBOURNE METROPOLITAN AREA The following Table shows the suburbs of Melbourne that have the highest number of owners of holiday homes in the South Gippsland Shire.
Suburbs Postcode Number of Holiday
Home Owners
1 Glen Waverley 3150 66
2 Ferntree Gully / Lysterfield 3156 47
3 Frankston 3199 45
4 Croydon 3136 40
5 Cranbourne 3977 34
6 Wantirna / Knox City Centre
3152 28
7 Chadstone 3148 28
8 Dandenong 3175 28
9 Oakleigh 3166 27
10 Eltham 3095 27
Persons living in the eastern suburbs of Melbourne make up over three quarters of all holiday homeowners in the South Gippsland Shire.
The map on the following page highlights where the holiday homeowners live.

Urban Enterprise Pty Ltd 38 Economic Impact of Tourism 1 June 2004 South Gippsland Shire
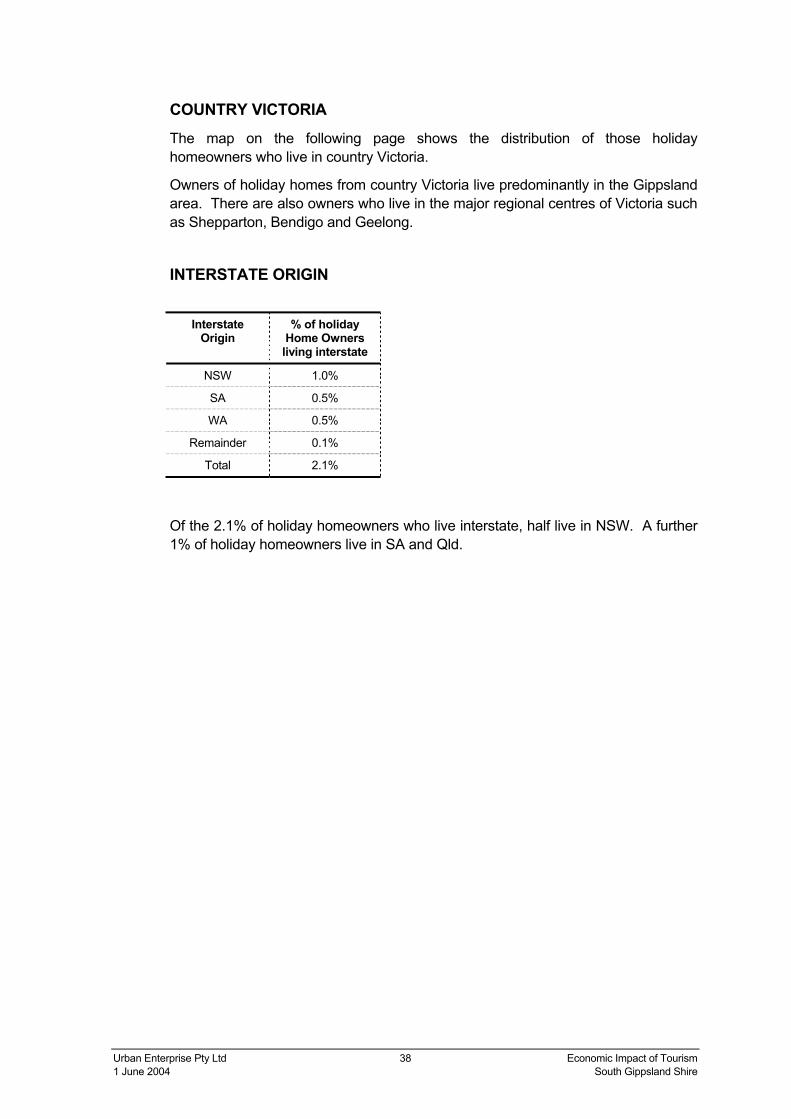
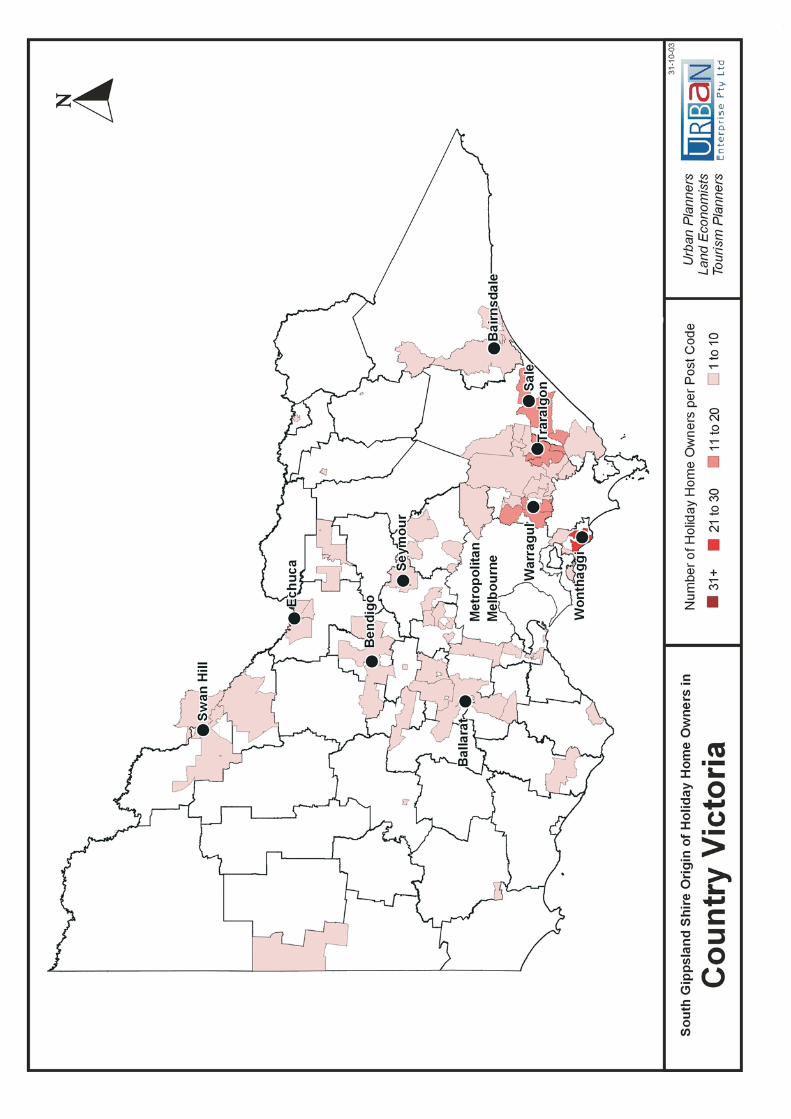
COUNTRY VICTORIA The map on the following page shows the distribution of those holiday homeowners who live in country Victoria.
Owners of holiday homes from country Victoria live predominantly in the Gippsland area. There are also owners who live in the major regional centres of Victoria such as Shepparton, Bendigo and Geelong.
INTERSTATE ORIGIN
Interstate Origin
% of holiday Home Owners living interstate
NSW 1.0%
SA 0.5%
WA 0.5%
Remainder 0.1%
Total 2.1%
Of the 2.1% of holiday homeowners who live interstate, half live in NSW. A further 1% of holiday homeowners live in SA and Qld.

Urban Enterprise Pty Ltd 40 Economic Impact of Tourism 1 June 2004 South Gippsland Shire
4.6 CHARACTERISTICS OF HOLIDAY HOME OWNERSHIP
REASON FOR PURCHASE OF HOLIDAY HOME
78% of holiday homeowners purchased in South Gippsland Shire due to the “natural beauty” of the area. A further 64% purchased in the South Gippsland Shire due to the “tranquillity” of the area.
57% of holiday homeowners purchased in the South Gippsland Shire due to “affordable property”. A further 45% of holiday homeowners purchased their property having “visited previously”.
DURATION OF HOLIDAY HOME OWNERSHIP
Almost half of the holiday homeowners in the South Gippsland Shire have owned their holiday home for “more than 11 years”.
Only 15% of holiday homeowners have owned their property for less than 2 years.
14%
15%
47%
24%
0% 10% 20% 30% 40% 50%
11+ years
6- 10years
3-5 years
less than 2years
64%
45%
37%
21%
5%
4%
57%
78%
0% 20% 40% 60% 80%
Natural beauty
Tranquility
Affordable property
Visited previously
Activites offered
Close to home
Other
Inherited the property
Urban Enterprise Pty Ltd 41 Economic Impact of Tourism 1 June 2004 South Gippsland Shire
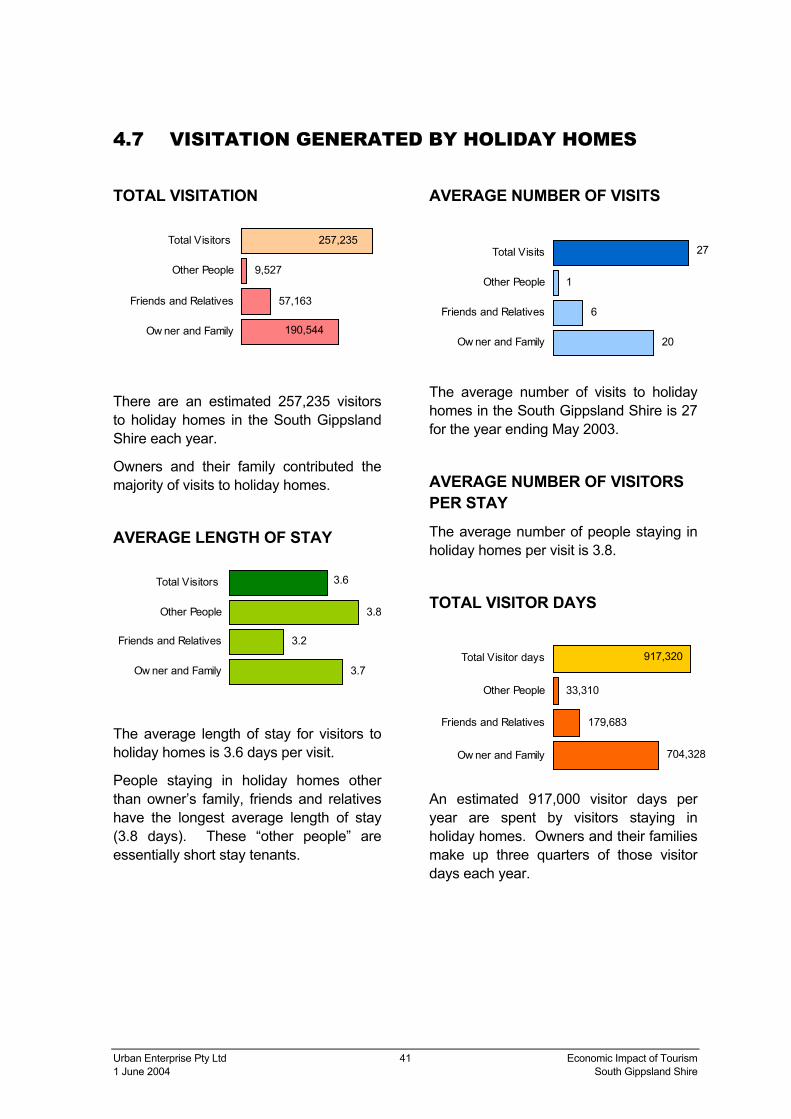
4.7 VISITATION GENERATED BY HOLIDAY HOMES
TOTAL VISITATION
There are an estimated 257,235 visitors to holiday homes in the South Gippsland Shire each year.
Owners and their family contributed the majority of visits to holiday homes.
AVERAGE LENGTH OF STAY
The average length of stay for visitors to holiday homes is 3.6 days per visit.
People staying in holiday homes other than owner’s family, friends and relatives have the longest average length of stay (3.8 days). These “other people” are essentially short stay tenants.
AVERAGE NUMBER OF VISITS
The average number of visits to holiday homes in the South Gippsland Shire is 27 for the year ending May 2003.
AVERAGE NUMBER OF VISITORS PER STAY The average number of people staying in holiday homes per visit is 3.8.
TOTAL VISITOR DAYS
An estimated 917,000 visitor days per year are spent by visitors staying in holiday homes. Owners and their families make up three quarters of those visitor days each year.
3.7
3.2
3.8
3.6
Ow ner and Family
Friends and Relatives
Other People
Total Visitors
20
6
1
27
Ow ner and Family
Friends and Relatives
Other People
Total Visits
704,328
179,683
33,310
917,320
Ow ner and Family
Friends and Relatives
Other People
Total Visitor days
57,163
9,527
190,544
257,235
Ow ner and Family
Friends and Relatives
Other People
Total Visitors

Urban Enterprise Pty Ltd 42 Economic Impact of Tourism 1 June 2004 South Gippsland Shire
4.8 SEASONAL VISITATION TO HOLIDAY HOMES
DAYS SPENT AT HOLIDAY HOME BY SEASON
Owner and Family
Friends and Relatives
Other Visitors
All Visitors
Around one third of visitor days spent in holiday homes are in the summer months.
Spring and autumn are the next most popular seasons for visiting.
1315
28
16
-
5
10
15
20
25
30
Winter Spring Summer Autumn
No o
f Day
s
3.1
4.1
8.2
4.3
0.0
1.0
2.0
3.0
4.0
5.0
6.0
7.0
8.0
9.0
Winter Spring Summer Autumn
No o
f Day
s
0.58 0.63
1.92
0.98
0.00
0.50
1.00
1.50
2.00
2.50
Winter Spring Summer Autumn
No o
f Day
s
17.120.2
38.2
21.2
0.0
10.0
20.0
30.0
40.0
Winter Spring Summer Autumn
No o
f Day
s

Urban Enterprise Pty Ltd 43 Economic Impact of Tourism 1 June 2004 South Gippsland Shire
AVERAGE LENGTH OF STAY BY SEASON
Owner and Family
Friends and Relatives
Other Visitors
All Visitors
Visitors to holiday homes stayed longest in the summer (an average of 4.9 days per visit). Persons other than the owner’s friends, family and relatives stayed on average the longest in summer and autumn.
Visitors stayed the shortest periods in the winter.
2.8 2.8
4.1
2.6
0.0
0.5
1.0
1.5
2.0
2.5
3.0
3.5
4.0
4.5
Winter Spring Summer Autumn
No o
f Day
s
2.9 3.0
5.1
3.2
0.0
1.0
2.0
3.0
4.0
5.0
6.0
Winter Spring Summer Autumn
No o
f Day
s
2.4 2.6
5.6
3.7
0.0
1.0
2.0
3.0
4.0
5.0
6.0
Winter Spring Summer Autumn
No o
f Day
s
2.7 2.8
4.9
3.1
0.0
1.0
2.0
3.0
4.0
5.0
6.0
Winter Spring Summer Autumn
No o
f Day
s
Urban Enterprise Pty Ltd 44 Economic Impact of Tourism 1 June 2004 South Gippsland Shire
AVERAGE NUMBER OF VISITS BY SEASON
Owner and Family
Friends and Relatives
Other Visitors
All Visitors
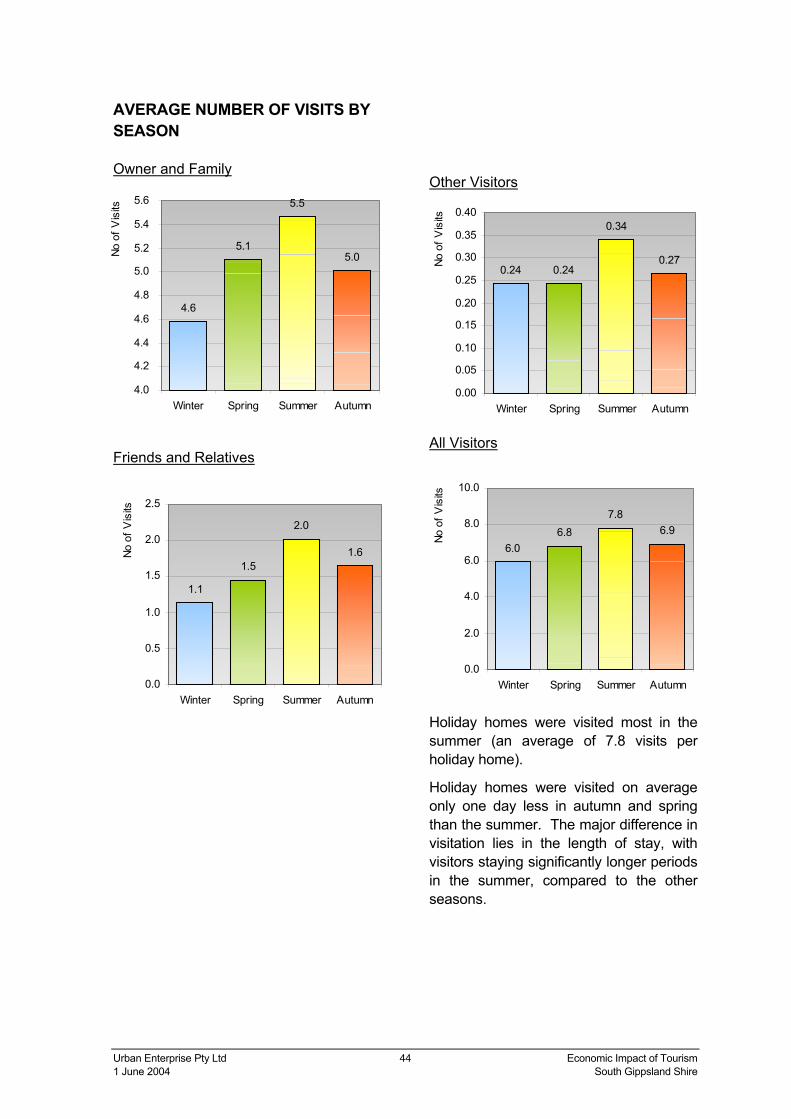
Holiday homes were visited most in the summer (an average of 7.8 visits per holiday home).
Holiday homes were visited on average only one day less in autumn and spring than the summer. The major difference in visitation lies in the length of stay, with visitors staying significantly longer periods in the summer, compared to the other seasons.
4.6
5.1
5.5
5.0
4.0
4.2
4.4
4.6
4.8
5.0
5.2
5.4
5.6
Winter Spring Summer Autumn
No o
f Vis
its
1.1
1.5
2.0
1.6
0.0
0.5
1.0
1.5
2.0
2.5
Winter Spring Summer Autumn
No o
f Vis
its
0.24 0.24
0.34
0.27
0.00
0.05
0.10
0.15
0.20
0.25
0.30
0.35
0.40
Winter Spring Summer Autumn
No o
f Vis
its
6.06.8
7.86.9
0.0
2.0
4.0
6.0
8.0
10.0
Winter Spring Summer Autumn
No o
f Vis
its
Urban Enterprise Pty Ltd 45 Economic Impact of Tourism 1 June 2004 South Gippsland Shire
4.9 ACTIVITIES UNDERTAKEN BY VISITORS STAYING IN HOLIDAY HOMES
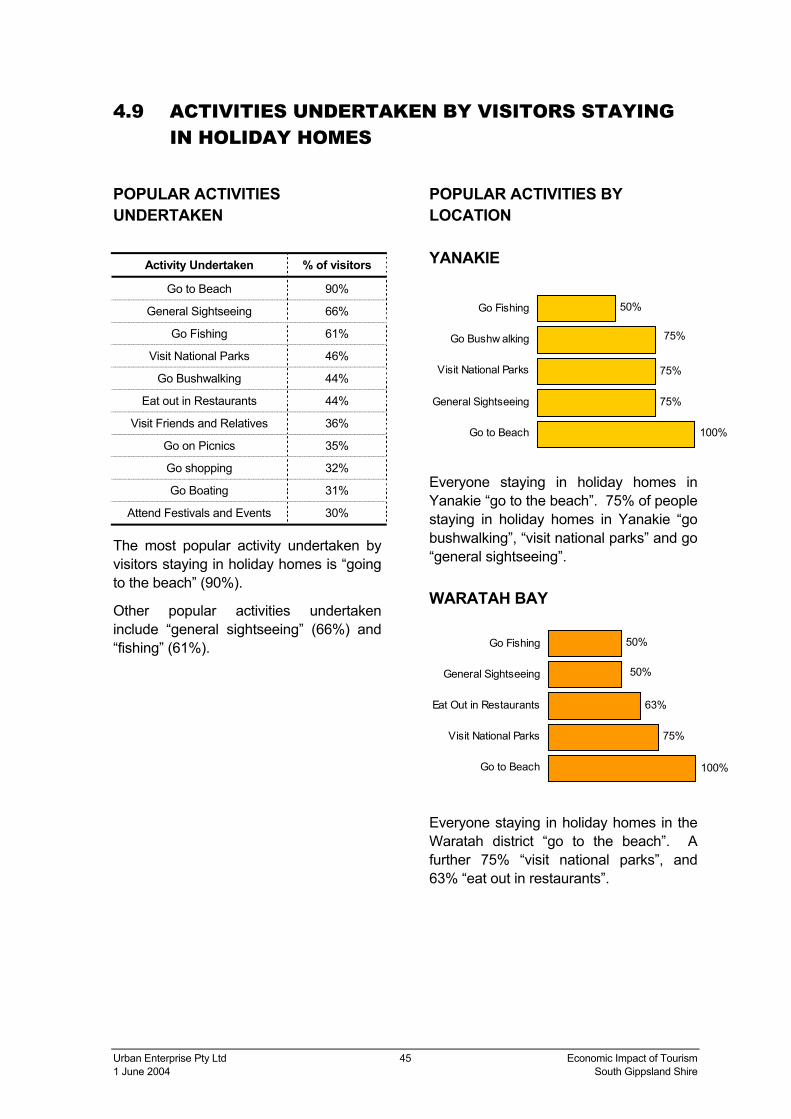
POPULAR ACTIVITIES UNDERTAKEN
Activity Undertaken % of visitors
Go to Beach 90%
General Sightseeing 66%
Go Fishing 61%
Visit National Parks 46%
Go Bushwalking 44%
Eat out in Restaurants 44%
Visit Friends and Relatives 36%
Go on Picnics 35%
Go shopping 32%
Go Boating 31%
Attend Festivals and Events 30%
The most popular activity undertaken by visitors staying in holiday homes is “going to the beach” (90%).
Other popular activities undertaken include “general sightseeing” (66%) and “fishing” (61%).
POPULAR ACTIVITIES BY LOCATION
YANAKIE
Everyone staying in holiday homes in Yanakie “go to the beach”. 75% of people staying in holiday homes in Yanakie “go bushwalking”, “visit national parks” and go “general sightseeing”.
WARATAH BAY
Everyone staying in holiday homes in the Waratah district “go to the beach”. A further 75% “visit national parks”, and 63% “eat out in restaurants”.
75%
75%
50%
75%
100%Go to Beach
General Sightseeing
Visit National Parks
Go Bushw alking
Go Fishing
75%
63%
50%
100%
50%
Go to Beach
Visit National Parks
Eat Out in Restaurants
General Sightseeing
Go Fishing

Urban Enterprise Pty Ltd 46 Economic Impact of Tourism 1 June 2004 South Gippsland Shire
WALKERVILLE DISTRICT
Everyone staying in the Walkerville district “go to the beach”. A further 85% of visitors go “general sightseeing”.
VENUS BAY
The most popular activity for persons staying in holiday homes in Venus Bay is “going to the beach” (95%). Other popular activities are “fishing” (66%) and “general sightseeing” (66%).
SANDY POINT
“Going to the beach” (98%) is the most popular activity for people staying in holiday homes. “Going fishing” (67%) and “general sightseeing” (65%) are also popular activities.
PORT WELSHPOOL
The most popular activities for people staying in Port Welshpool are “fishing” (86%) and boating (79%). These two activities are more popular than going to the beach (57%).
66%
66%
43%
95%
44%
Go to the Beach
General Sightseeing
Go Fishing
Eat Out in Restaurants
Go Bushw alking
67%
65%
52%
62%
98%Go to Beach
Go Fishing
General Sightseeing
Visit National Parks
Go Bushw alking
79%
57%
50%
86%
50%
Go Fishing
Go Boating
Go to Beach
General Sightseeing
Visit Friends and Relatives
85%
55%
50%
50%
100% Go to the Beach
General Sightseeing
Go Bushwalking
Visit National Parks
Go Fishing
Urban Enterprise Pty Ltd 47 Economic Impact of Tourism 1 June 2004 South Gippsland Shire
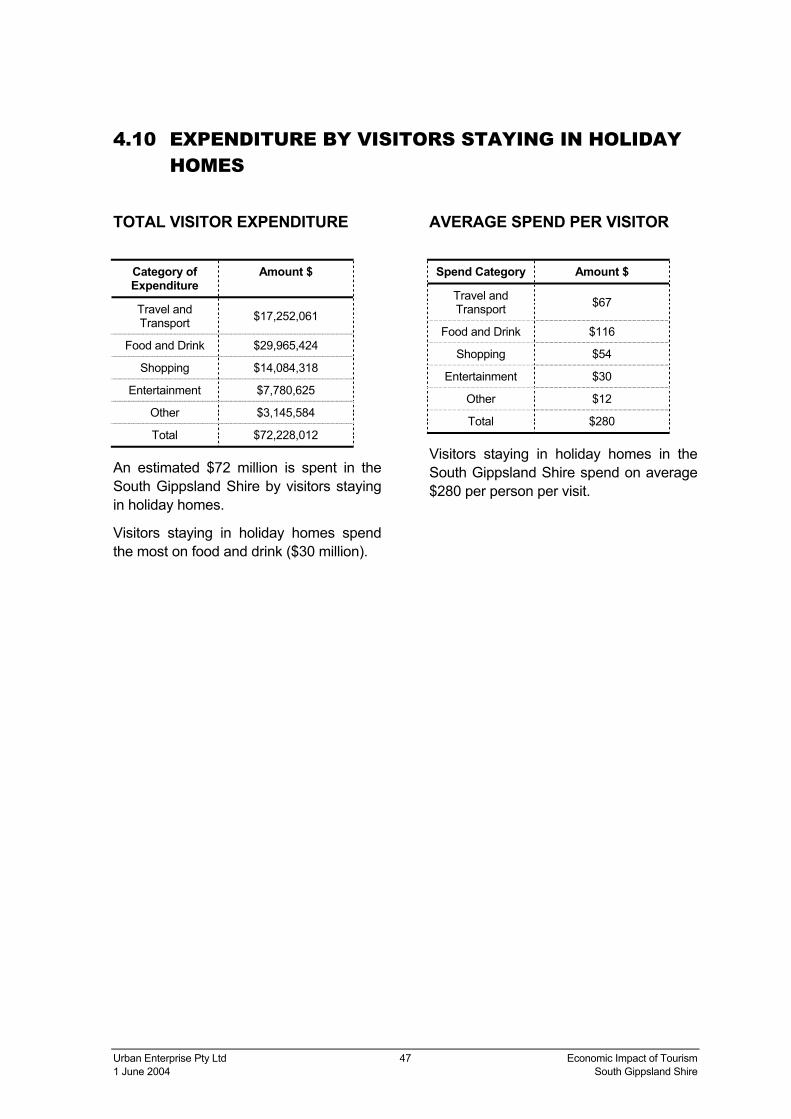
4.10 EXPENDITURE BY VISITORS STAYING IN HOLIDAY HOMES
TOTAL VISITOR EXPENDITURE
Category of Expenditure
Amount $
Travel and Transport $17,252,061
Food and Drink $29,965,424
Shopping $14,084,318
Entertainment $7,780,625
Other $3,145,584
Total $72,228,012
An estimated $72 million is spent in the South Gippsland Shire by visitors staying in holiday homes.
Visitors staying in holiday homes spend the most on food and drink ($30 million).
AVERAGE SPEND PER VISITOR
Spend Category Amount $
Travel and Transport $67
Food and Drink $116
Shopping $54
Entertainment $30
Other $12
Total $280
Visitors staying in holiday homes in the South Gippsland Shire spend on average $280 per person per visit.
Urban Enterprise Pty Ltd 48 Economic Impact of Tourism 1 June 2004 South Gippsland Shire
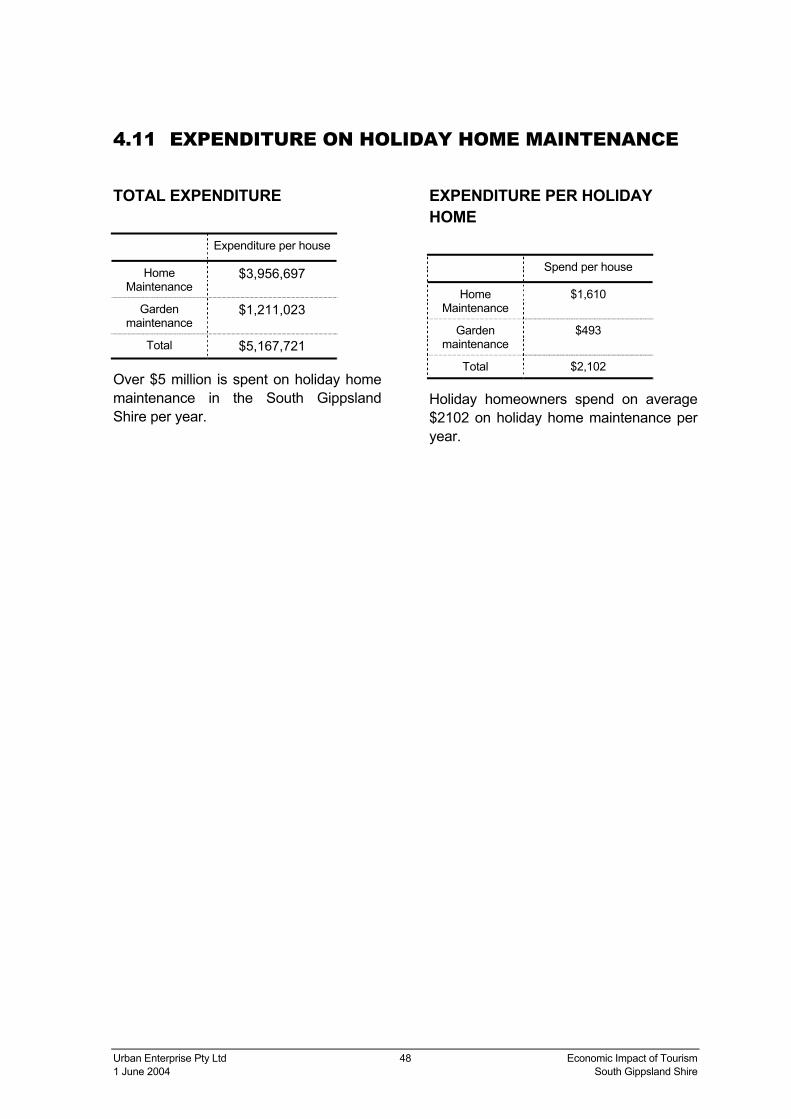
4.11 EXPENDITURE ON HOLIDAY HOME MAINTENANCE
TOTAL EXPENDITURE
Expenditure per house
Home Maintenance
$3,956,697
Garden maintenance
$1,211,023
Total $5,167,721
Over $5 million is spent on holiday home maintenance in the South Gippsland Shire per year.
EXPENDITURE PER HOLIDAY HOME
Spend per house
Home Maintenance
$1,610
Garden maintenance
$493
Total $2,102
Holiday homeowners spend on average $2102 on holiday home maintenance per year.

Urban Enterprise Pty Ltd 49 Economic Impact of Tourism 1 June 2004 South Gippsland Shire
5 Profile of Visitor Accommodation
5.1 KEY FINDINGS
Number and Location of Visitor Accommodation Businesses
• 187 accommodation businesses have been identified in the South Gippsland Shire; these make up 15% of all businesses within the Shire.
• Over half of the accommodation businesses in the Shire are self-contained cottages.
• Accommodation businesses are evenly spread throughout the Shire, with higher concentrations of accommodation businesses in Foster, and Yanakie.
• There are more self-contained accommodation businesses than other accommodation types. The average occupancy rate for Self contained accommodation is relatively low but takings from these businesses are higher than any other accommodation type. This due to higher than average tariffs for self-contained accommodation.
• Cabin accommodation businesses comprise the second highest number of rooms in the Shire and the second highest takings.
• The 18 caravan parks and cabin accommodation establishments in the South Gippsland Shire contain around 1400 camping sites. One third of these camping sites are located in Wilson’s Promontory.
HIGHLIGHTS • South Gippsland Shire has 187 visitor accommodation businesses comprising over
1000 rooms and 1400 camping sites.
• Small accommodation businesses dominate the Shire’s accommodation stock.
• Accommodation businesses generate over 1 million guest nights per year.
• The average occupancy rate across all accommodation businesses is 38%.
• Takings from accommodation businesses are estimated at $14.3 million per year.
• More than 600 people are employed in accommodation businesses in the Shire.

Urban Enterprise Pty Ltd 50 Economic Impact of Tourism 1 June 2004 South Gippsland Shire
Number of Guest Rooms and Bed Spaces
• There are 1034 guest rooms and 1400 camping sites in accommodation businesses in the South Gippsland Shire.
• There are an average of 6 guest rooms per accommodation establishment.
• Self-contained accommodation contained over one quarter of all guest rooms available (301 rooms).
• There are 3227 bed spaces in accommodation businesses in the Shire.
Employment in Visitor Accommodation
• 610 persons are employed in accommodation businesses in the South Gippsland Shire.
• Over half of the employees (56%) of are employed on a part time basis.
Room Nights
• Accommodation businesses in the South Gippsland Shire generate an estimated 145,000 room nights and 190,000 camping site nights per year.
• It is estimated that accommodation businesses generate an average of 774 room nights per year per establishment.
Guest Nights
• Accommodation businesses in the South Gippsland Shire generate an estimated 1 million guest nights per year.
• It is estimated that accommodation businesses generate an average of 1964 guest nights per year per establishment.
Occupancy Rates
• Accommodation businesses in the South Gippsland Shire have an average occupancy rate of 38% per year.
• Cabin accommodation has the highest average occupancy rate of all accommodation types.
Seasonality of Visitation
• 40% of visitors staying in paid accommodation visit the South Gippsland Shire in the March quarter (January – March).
Takings
• Total takings from accommodation businesses are estimated at $14.3 million in takings per year.
• Accommodation businesses take an estimated average of $61,000 per year.
• 70% of accommodation businesses expect an increase in takings over the next financial year.

Urban Enterprise Pty Ltd 51 Economic Impact of Tourism 1 June 2004 South Gippsland Shire
Capital Investment
• Total capital investment by accommodation businesses in the South Gippsland Shire is estimated at $4.3 million per year.
• Over half of the estimated capital invested in accommodation businesses is spent on new buildings ($2.3 million).

Urban Enterprise Pty Ltd 52 Economic Impact of Tourism 1 June 2004 South Gippsland Shire
5.2 INTRODUCTION This section provides an analysis of visitor accommodation in the South Gippsland Shire.
Due to the diverse nature of caravan parks, they are broken into cabins and camping sites in some areas within this section. Accommodation at Wilson’s Promontory National Park is included under caravan parks, cabins, and camping sites. It must be noted that Wilson’s Promontory makes up a large proportion of both the cabins and camping sites data in this report.
Methodology
Accommodation businesses in the South Gippsland Shire were identified using databases provided by the South Gippsland Shire.
All 187 accommodation businesses identified from the database were sent a survey questionnaire. The survey was designed to collect the following information:
• Type of accommodation
• Persons employed
• Number of rooms and beds
• Room nights
• Occupancy Rate
• Capital investment
• Guest Nights
• Seasonality of visitation
• Takings
• Visitor origin
All information collected related to the financial year 2002-2003.
70 completed responses were received from accommodation businesses. Results were extrapolated for missing values to calculate room nights, guest nights, occupancy rates and takings.
The following formula was used for extrapolation:
Using the 95% confidence interval, the margin for error for the survey is calculated below 10%. This means that we can be 95% confident that the actual results in the report are within 10% of the results shown.
This is an acceptable error margin for the purposes of this study.
Averages for completed surveys X
Total accommodation in database =
Total number

Urban Enterprise Pty Ltd 53 Economic Impact of Tourism 1 June 2004 South Gippsland Shire
5.3 NUMBER AND LOCATION OF VISITOR ACCOMMODATION BUSINESSES
NUMBER OF BUSINESSES
There are 187 accommodation businesses identified in the South Gippsland Shire.
Over half of the accommodation is classified as “self contained” (107 businesses).
LOCATION OF ACCOMMODATION BUSINESSES
Locality % of Total
Other Towns (below 1%) 32%
Foster 14%
Yanakie 12%
Walkerville 6%
Leongatha 4%
Fish Creek 4%
Korumburra 4%
Toora 3%
Sandy Point 3%
Mirboo North 3%
Meeniyan 3%
Waratah Nth 2%
Waratah Bay 2%
Tarwin Lower 2%
Welshpool 2%
Venus Bay 2%
Accommodation businesses are evenly spread throughout the Shire, with higher concentrations of accommodation businesses in Foster, and Yanakie.
36
5
18
4
5
12
107
187
B&Bs
Backpackers
Cabins/ Caravan Parks /Camping Sites
Guest Houses
Hotels
Motels
Self Contained
Total

Urban Enterprise Pty Ltd 54 Economic Impact of Tourism 1 June 2004 South Gippsland Shire
5.4 NUMBER OF GUEST ROOMS/ CAMPING SITES
TOTAL ROOMS AND CAMPING SITES
There are 1034 guest rooms in accommodation businesses in the South Gippsland Shire. There are a further 1392 camping sites in caravan parks. Around 40% of all camping sites are located in Wilson’s Promontory.
Self-contained accommodation has the most guest rooms available (301 rooms), this is followed by cabin accommodation (289 rooms). 38% of cabin guest rooms are located in Wilson’s Promontory.
AVERAGE NUMBER OF ROOMS BY TYPE
The average number of rooms per accommodation establishment is 6.
Motels had the largest average number of rooms per establishment (17 rooms), followed by cabins (16 rooms).
Bed and Breakfast accommodation had the least number of rooms per establishment (2 rooms).
#Note: Data not available for camping sites.
2
11
16
7
14
17
3
6
B&Bs
Backpackers
Cabins
Guest Houses
Hotels
Motels
Self Contained
Total Average
86
57
289
26
68
207
301
2426
1392
B&Bs
Backpackers
Cabins
Guest Houses
Hotels
Motels
Self Contained
Camping Sites
Total Rooms
Urban Enterprise Pty Ltd 55 Economic Impact of Tourism 1 June 2004 South Gippsland Shire
5.5 NUMBER OF BED SPACES
TOTAL BED SPACES
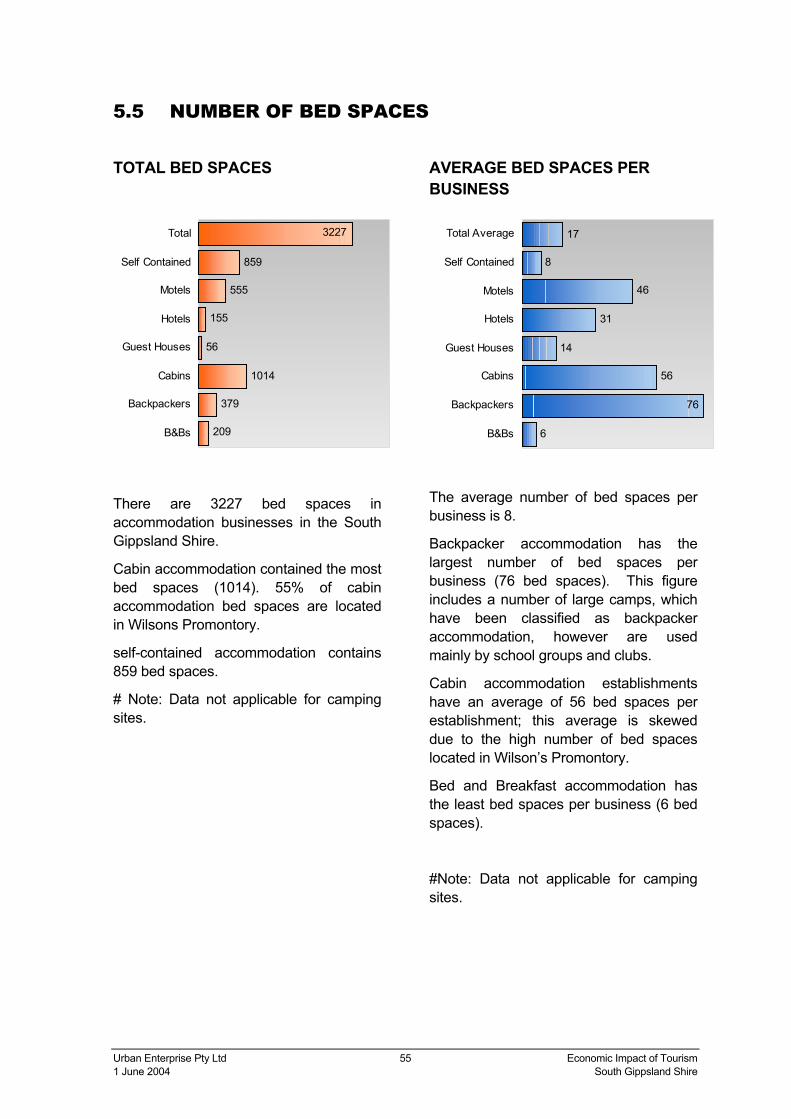
There are 3227 bed spaces in accommodation businesses in the South Gippsland Shire.
Cabin accommodation contained the most bed spaces (1014). 55% of cabin accommodation bed spaces are located in Wilsons Promontory.
self-contained accommodation contains 859 bed spaces.
# Note: Data not applicable for camping sites.
AVERAGE BED SPACES PER BUSINESS
The average number of bed spaces per business is 8.
Backpacker accommodation has the largest number of bed spaces per business (76 bed spaces). This figure includes a number of large camps, which have been classified as backpacker accommodation, however are used mainly by school groups and clubs.
Cabin accommodation establishments have an average of 56 bed spaces per establishment; this average is skewed due to the high number of bed spaces located in Wilson’s Promontory.
Bed and Breakfast accommodation has the least bed spaces per business (6 bed spaces).
#Note: Data not applicable for camping sites.
209
379
1014
56
155
555
859
3227
B&Bs
Backpackers
Cabins
Guest Houses
Hotels
Motels
Self Contained
Total
6
56
14
31
46
8
17
76
B&Bs
Backpackers
Cabins
Guest Houses
Hotels
Motels
Self Contained
Total Average

Urban Enterprise Pty Ltd 56 Economic Impact of Tourism 1 June 2004 South Gippsland Shire
5.6 EMPLOYMENT
TOTAL NUMBER OF PERSONS EMPLOYED BY SECTOR
There are 610 persons employed in accommodation businesses in the South Gippsland Shire.
Self-contained accommodation employed the most persons (196), followed by motels (103). Employment numbers include casual workers.
TYPE OF EMPLOYMENT
56% of persons employed in accommodation businesses were employed on a part time basis. Only 25% of persons are employed full-time.
FUTURE EMPLOYMENT INTENTIONS
70% of accommodation businesses predicted no change in employment in the next financial year.
22% of accommodation businesses predicted an increase in employment.
Causal19%
Full Time25%
Part Time56%
Increase22%
decrease8%
same70%
same Increase decrease
58
91
81
15
65
103
196
610
B&Bs
Backpackers
Cabins / Caravan Parks /Camping Sites
Guest Houses
Hotels
Motels
Self Contained
Total
Urban Enterprise Pty Ltd 57 Economic Impact of Tourism 1 June 2004 South Gippsland Shire
5.7 ROOM AND CAMPING SITES NIGHTS
TOTAL ROOM AND CAMPING SITE NIGHTS
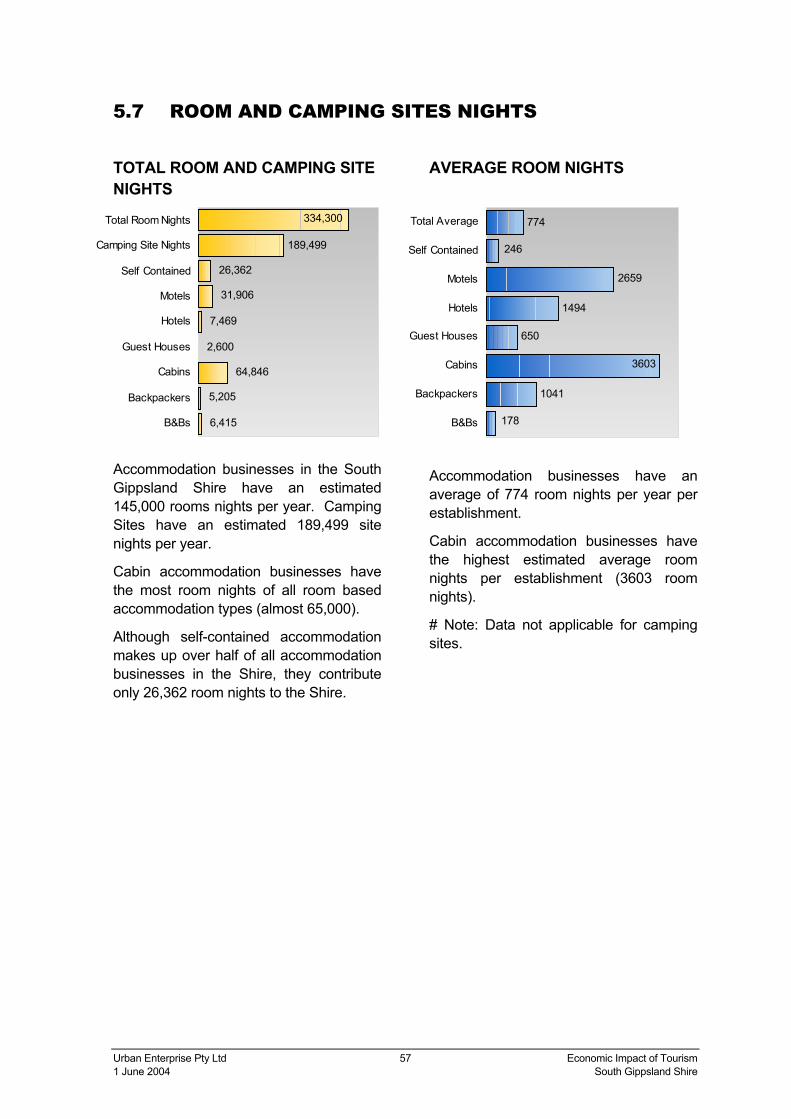
Accommodation businesses in the South Gippsland Shire have an estimated 145,000 rooms nights per year. Camping Sites have an estimated 189,499 site nights per year.
Cabin accommodation businesses have the most room nights of all room based accommodation types (almost 65,000).
Although self-contained accommodation makes up over half of all accommodation businesses in the Shire, they contribute only 26,362 room nights to the Shire.
AVERAGE ROOM NIGHTS
Accommodation businesses have an average of 774 room nights per year per establishment.
Cabin accommodation businesses have the highest estimated average room nights per establishment (3603 room nights).
# Note: Data not applicable for camping sites.
1041
650
1494
2659
774
246
3603
178B&Bs
Backpackers
Cabins
Guest Houses
Hotels
Motels
Self Contained
Total Average
6,415
5,205
64,846
2,600
7,469
31,906
26,362
334,300
189,499
B&Bs
Backpackers
Cabins
Guest Houses
Hotels
Motels
Self Contained
Camping Site Nights
Total Room Nights
Urban Enterprise Pty Ltd 58 Economic Impact of Tourism 1 June 2004 South Gippsland Shire
5.8 GUEST NIGHTS
TOTAL GUEST NIGHTS
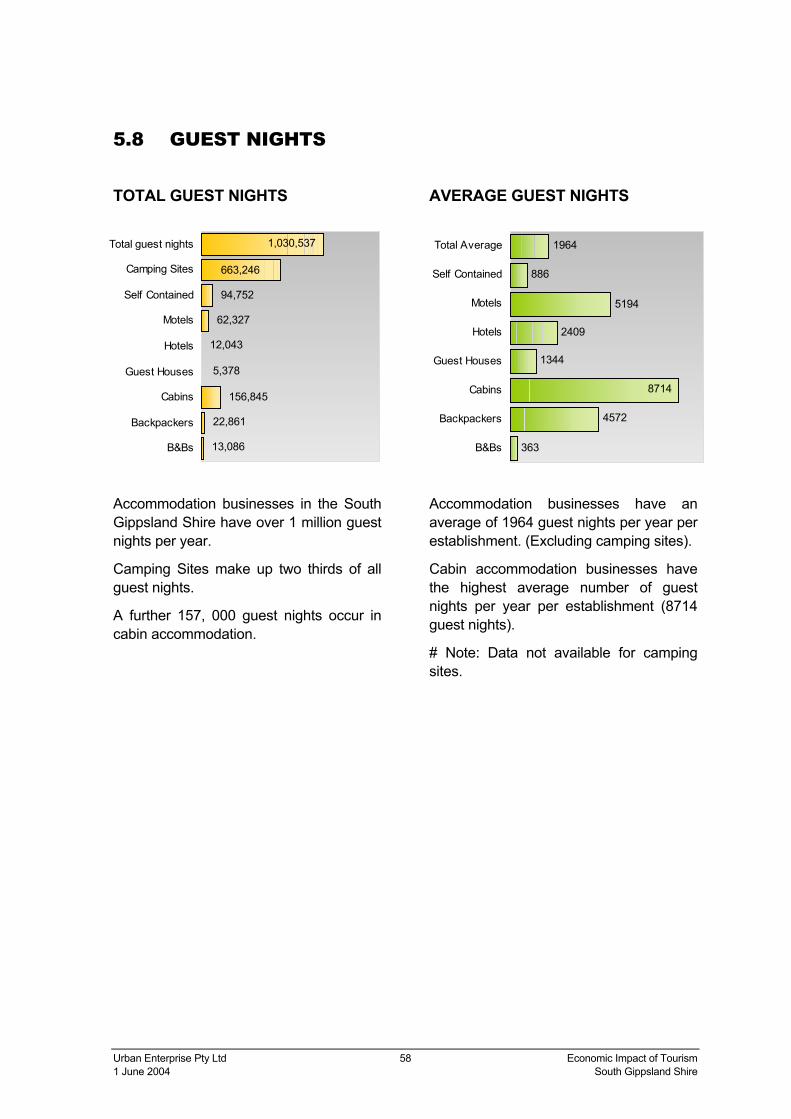
Accommodation businesses in the South Gippsland Shire have over 1 million guest nights per year.
Camping Sites make up two thirds of all guest nights.
A further 157, 000 guest nights occur in cabin accommodation.
AVERAGE GUEST NIGHTS
Accommodation businesses have an average of 1964 guest nights per year per establishment. (Excluding camping sites).
Cabin accommodation businesses have the highest average number of guest nights per year per establishment (8714 guest nights).
# Note: Data not available for camping sites.
363
4572
1344
2409
5194
886
8714
1964
B&Bs
Backpackers
Cabins
Guest Houses
Hotels
Motels
Self Contained
Total Average
13,086
22,861
156,845
12,043
62,327
94,752
5,378
663,246
1,030,537
B&Bs
Backpackers
Cabins
Guest Houses
Hotels
Motels
Self Contained
Camping Sites
Total guest nights
Urban Enterprise Pty Ltd 59 Economic Impact of Tourism 1 June 2004 South Gippsland Shire
5.9 OCCUPANCY RATE AND LENGTH OF STAY
OCCUPANCY RATE
.
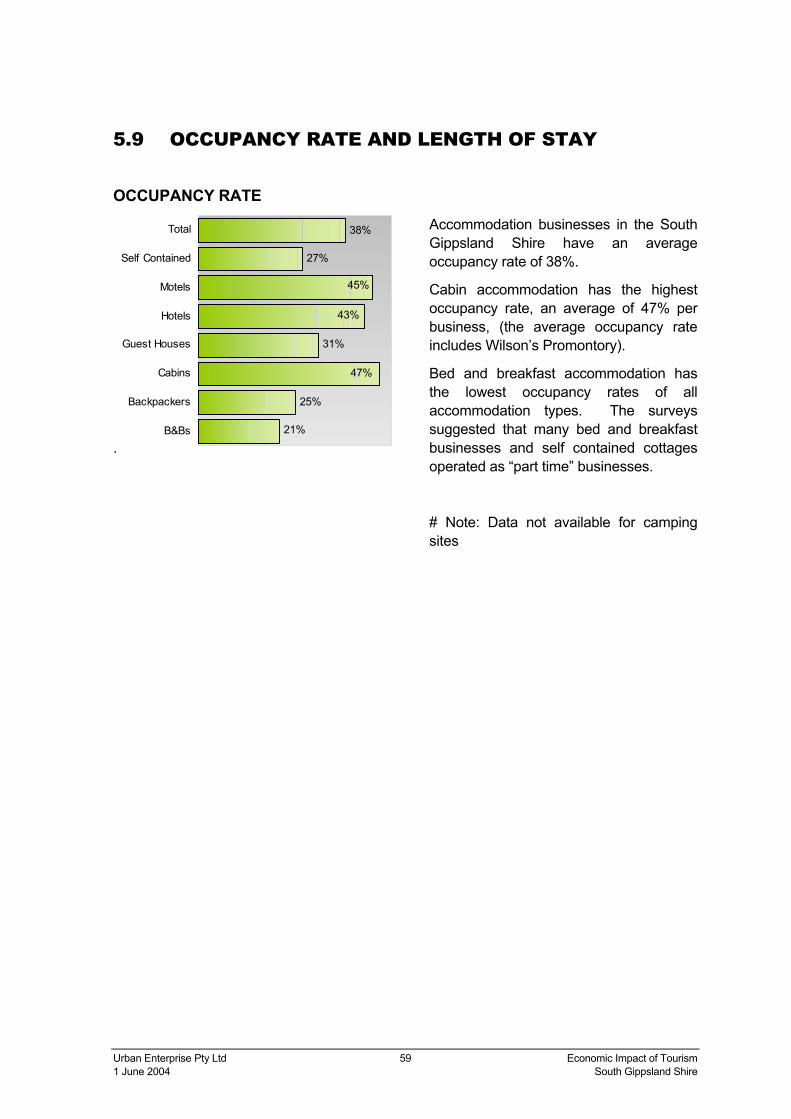
Accommodation businesses in the South Gippsland Shire have an average occupancy rate of 38%.
Cabin accommodation has the highest occupancy rate, an average of 47% per business, (the average occupancy rate includes Wilson’s Promontory).
Bed and breakfast accommodation has the lowest occupancy rates of all accommodation types. The surveys suggested that many bed and breakfast businesses and self contained cottages operated as “part time” businesses.
# Note: Data not available for camping sites
21%
25%
31%
27%
38%
43%
45%
47%
B&Bs
Backpackers
Cabins
Guest Houses
Hotels
Motels
Self Contained
Total
Urban Enterprise Pty Ltd 60 Economic Impact of Tourism 1 June 2004 South Gippsland Shire
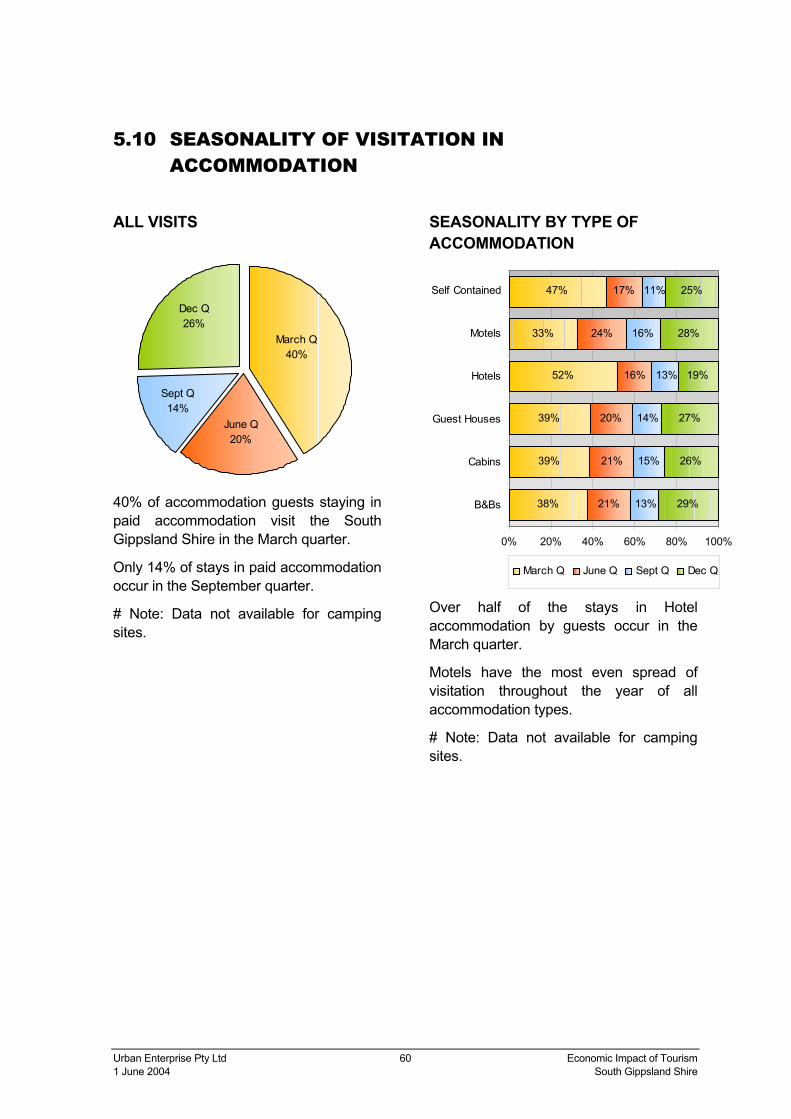
5.10 SEASONALITY OF VISITATION IN ACCOMMODATION
ALL VISITS
40% of accommodation guests staying in paid accommodation visit the South Gippsland Shire in the March quarter.
Only 14% of stays in paid accommodation occur in the September quarter.
# Note: Data not available for camping sites.
SEASONALITY BY TYPE OF ACCOMMODATION
Over half of the stays in Hotel accommodation by guests occur in the March quarter.
Motels have the most even spread of visitation throughout the year of all accommodation types.
# Note: Data not available for camping sites.
June Q20%
March Q40%
Sept Q14%
Dec Q26%
38%
39%
39%
52%
33%
47%
21%
21%
20%
16%
24%
17%
13%
15%
14%
13%
16%
29%
26%
27%
19%
28%
25%11%
0% 20% 40% 60% 80% 100%
B&Bs
Cabins
Guest Houses
Hotels
Motels
Self Contained
March Q June Q Sept Q Dec Q

Urban Enterprise Pty Ltd 61 Economic Impact of Tourism 1 June 2004 South Gippsland Shire
5.11 TAKINGS
TOTAL TAKINGS
Accommodation businesses take an estimated $14.2 million in takings per year.
Self-contained accommodation has the highest takings of all accommodation types (over $3.5 million per year). This is followed by cabin accommodation (over $3.4 million per year).
# Note: The takings data presented above represents commercial takings for accommodation establishments in the South Gippsland Shire. The takings associated with holiday home rentals are not included.
AVERAGE TAKINGS
Accommodation businesses on average generate an estimated income of $61,000 per business per year.
Cabin accommodation has the highest takings, with $194,000 per business per year. This is followed by motel accommodation ($190,500 per business per year).
# Note: Not available for camping sites
EXPECTED FUTURE TAKINGS
70% of accommodation businesses predict an increase in takings in the next financial year, with 25% expected an increase of more than 10%
$22,590
$96,012
$89,888
$81,612
$33,217
$194,066
$190,490
$60,931
B&Bs
Backpackers
Cabins
Guest Houses
Hotels
Motels
Self Contained
Total
2%
5%
24%
44%
19%
6%
-30% or less
-1% to -10%
no change
1% to +10%
11% to +20%
21% to +30%
$813,236
$480,062
$3,493,182
$359,552
$408,058
$2,285,885
$3,554,206
$14,236,664
$2,842,483
B&Bs
Backpackers
Cabins
Guest Houses
Hotels
Motels
Self Contained
Camping Sites
Total
Urban Enterprise Pty Ltd 62 Economic Impact of Tourism 1 June 2004 South Gippsland Shire
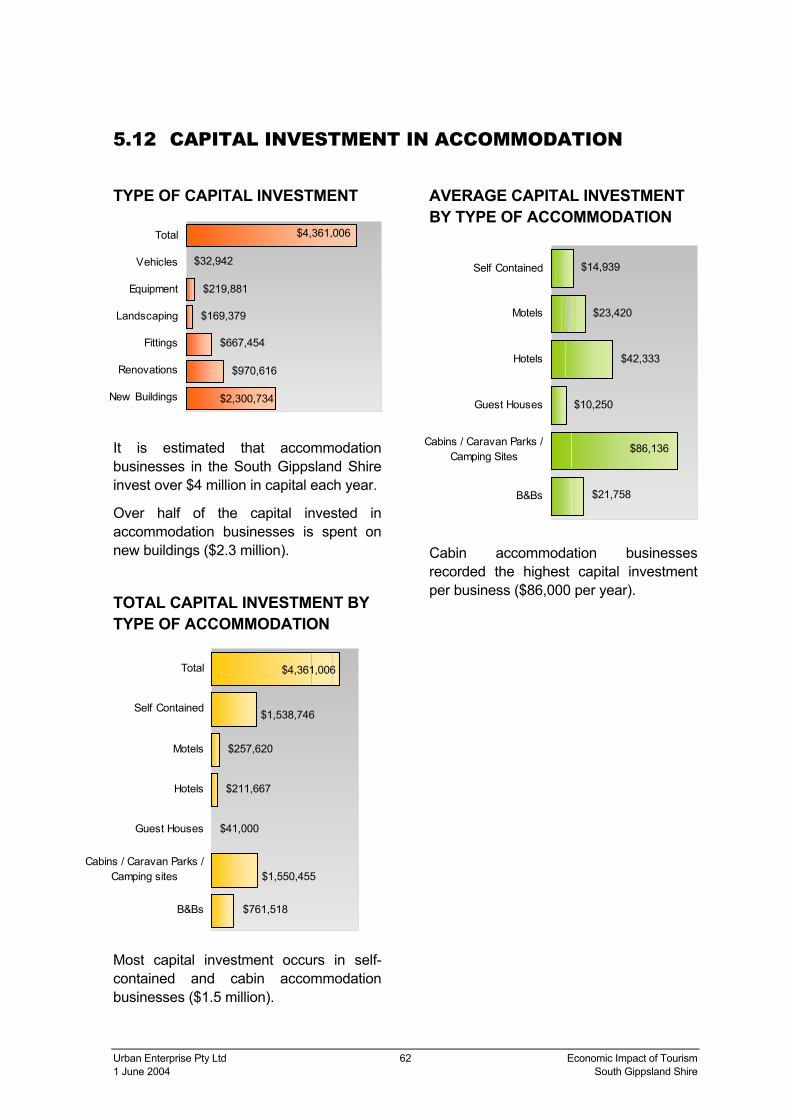
5.12 CAPITAL INVESTMENT IN ACCOMMODATION
TYPE OF CAPITAL INVESTMENT
It is estimated that accommodation businesses in the South Gippsland Shire invest over $4 million in capital each year.
Over half of the capital invested in accommodation businesses is spent on new buildings ($2.3 million).
TOTAL CAPITAL INVESTMENT BY TYPE OF ACCOMMODATION
Most capital investment occurs in self-contained and cabin accommodation businesses ($1.5 million).
AVERAGE CAPITAL INVESTMENT BY TYPE OF ACCOMMODATION
Cabin accommodation businesses recorded the highest capital investment per business ($86,000 per year).
$970,616
$667,454
$169,379
$219,881
$32,942
$4,361,006
$2,300,734New Buildings
Renovations
Fittings
Landscaping
Equipment
Vehicles
Total
$1,550,455
$41,000
$211,667
$257,620
$1,538,746
$4,361,006
$761,518B&Bs
Cabins / Caravan Parks /Camping sites
Guest Houses
Hotels
Motels
Self Contained
Total
$10,250
$42,333
$23,420
$14,939
$86,136
$21,758B&Bs
Cabins / Caravan Parks /Camping Sites
Guest Houses
Hotels
Motels
Self Contained
Urban Enterprise Pty Ltd 63 Economic Impact of Tourism 1 June 2004 South Gippsland Shire
6 Profile of Specialised Tourism Businesses
6.1 KEY FINDINGS
Number and Location of Tourism Businesses
• 72 tourism businesses have been identified in the South Gippsland Shire.
• Specialised tourism businesses make up 9% of all businesses in the Shire.
• Almost half of specialised tourism businesses were food retailers /producers.
• Specialised tourism businesses are evenly spread throughout the Shire, with a concentration of businesses in Foster.
Employment in Tourism Businesses
• 591 persons are employed in specialised tourism businesses in the South Gippsland Shire.
• Over half of the employees (52%) are employed on a casual basis.
Capital Investment
• Total capital investment by specialised tourism businesses in the South Gippsland Shire is estimated at $1.7 million in the financial year 2002-2003.
HIGHLIGHTS • South Gippsland Shire has 72 specialised tourism businesses (other than
accommodation) employing 591 persons.
• Specialised tourism businesses invested $1.7 million in capital improvements in theyear 2002-2003.
• Two thirds of specialised tourism businesses reported an increase in gross businessincome in the year 2002-2003
• 83% of specialised tourism businesses are expecting a further increase in grossbusiness income in the year 2003 - 2004.

Urban Enterprise Pty Ltd 64 Economic Impact of Tourism 1 June 2004 South Gippsland Shire
• Over one third of capital investment by specialised tourism businesses is spent on equipment.
• Specialised tourism businesses expect to invest an estimated $1.1 million in the financial year 2003-2004.
Business Income
• Two thirds of specialised tourism businesses reported an increase in gross business income in the financial year 2002-2003.
• 83% of specialised tourism businesses predict an increase in gross businesses income in the financial year 2003-2004.
Urban Enterprise Pty Ltd 65 Economic Impact of Tourism 1 June 2004 South Gippsland Shire
6.2 INTRODUCTION This section provides an analysis of specialised tourism businesses in the South Gippsland Shire, other than accommodation businesses. It is assumed these businesses receive close to 100% of their income from visitors to the Shire.
Methodology
Tourism businesses were identified using databases provided by the South Gippsland Shire.
96 tourism businesses were sent a survey, which collected the following information:
• Type of business;
• Persons employed;
• Capital investment;
• Performance of business.
Current information collected related to the financial year 2002-2003, and forecasts for the financial year 2003-2004.
Arising from the survey, 24 businesses were excluded from further consideration for the following reasons:
• Tourism is not their core business,
• The business is based outside the South Gippsland Shire boundary,
• The business is a volunteer organisation or does not gain financially from visitors.
Of the remaining 72 businesses, those that did not return the survey were contacted by telephone.

Urban Enterprise Pty Ltd 66 Economic Impact of Tourism 1 June 2004 South Gippsland Shire
72 businesses were deemed to be specialised tourism businesses, which received the majority of their turnover from visitors to the Shire. The data in this section relates to these 72 specialised tourism businesses, which have been categorised as follows:
Business Category Type of Business
Attractions Includes historic sites, cinemas, museums, national parks
Antiques / Galleries / Art & Craft
Includes shops selling antiques and collectibles, bookshops, art galleries and studios, and craft shops
Golf Includes golf courses, driving ranges and golf complexes. Does not include mini-golf
Restaurants13 Includes restaurants, pubs, cafes and taverns
Tours & Activities Includes boat charter cruises, ferries and passenger services, trail rides, fishing charters and dive tours
Wineries Includes wineries and vineyards. Businesses in this category may also have accommodation and eating facilities, however their core business is winemaking or grape growing)
Specialised Food Producers and Retailers
Includes food producers and retailers who sell their products locally with and emphasis on marketing to the visitors
Other Any businesses, which do not fit into the categories above, this includes horseracing clubs/events.
43 completed responses were received from tourism businesses. The businesses that did not respond could not be contacted, were not interested or were too busy to complete the survey.
Results were extrapolated for missing values to calculate total employment and capital investment.
The following formula was used for extrapolation:
Using the 95% confidence interval, the margin for error for the survey is calculated at less than 10%. This means that we can be 95% confident that the actual results from this survey are within 10% of the results shown.
This is an acceptable error margin for the purposes of this study.
13 This included only some of the restaurants in the Shire, which are members of Prom Country Tourism; the other restaurants cafes are included in section 9.
Averages for completed surveys X
Total specialised tourism businesses
in database =
Total number
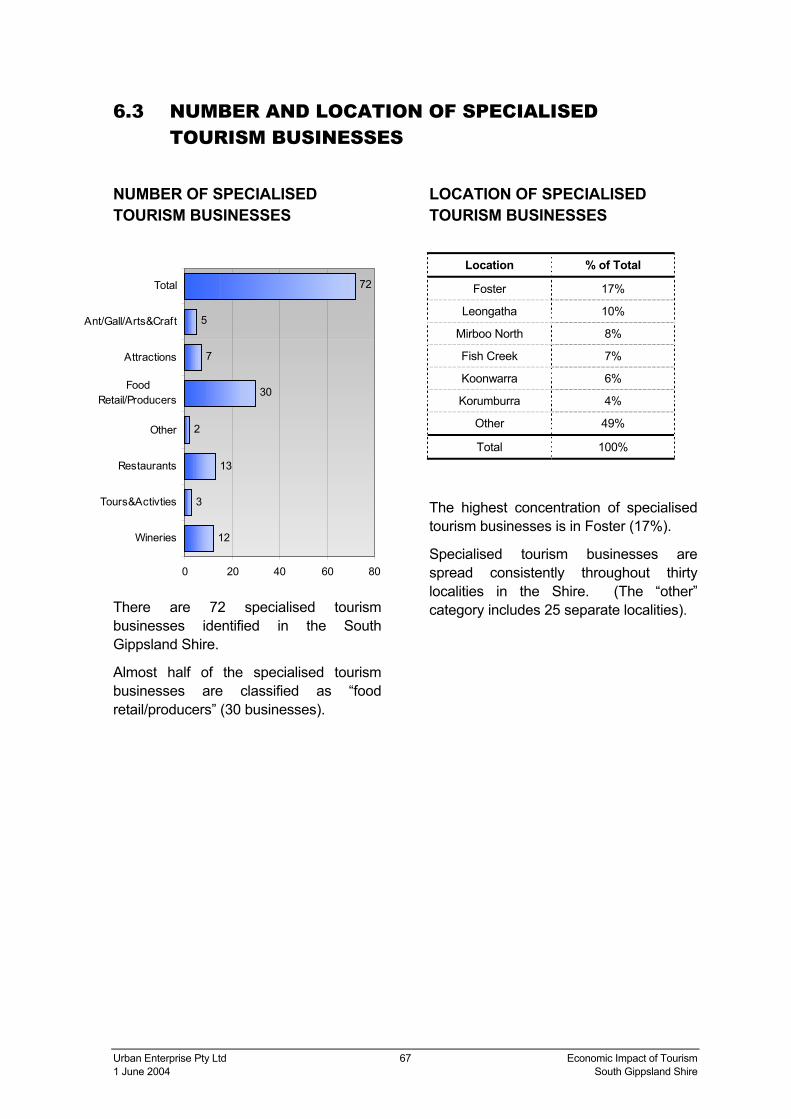
Urban Enterprise Pty Ltd 67 Economic Impact of Tourism 1 June 2004 South Gippsland Shire
6.3 NUMBER AND LOCATION OF SPECIALISED TOURISM BUSINESSES
NUMBER OF SPECIALISED TOURISM BUSINESSES
There are 72 specialised tourism businesses identified in the South Gippsland Shire.
Almost half of the specialised tourism businesses are classified as “food retail/producers” (30 businesses).
LOCATION OF SPECIALISED TOURISM BUSINESSES
Location % of Total
Foster 17%
Leongatha 10%
Mirboo North 8%
Fish Creek 7%
Koonwarra 6%
Korumburra 4%
Other 49%
Total 100%
The highest concentration of specialised tourism businesses is in Foster (17%).
Specialised tourism businesses are spread consistently throughout thirty localities in the Shire. (The “other” category includes 25 separate localities).
12
3
13
2
30
7
5
72
0 20 40 60 80
Wineries
Tours&Activties
Restaurants
Other
FoodRetail/Producers
Attractions
Ant/Gall/Arts&Craft
Total

Urban Enterprise Pty Ltd 68 Economic Impact of Tourism 1 June 2004 South Gippsland Shire
6.4 EMPLOYMENT
TOTAL NUMBER OF PERSONS EMPLOYED PER SECOR
There are 591 persons employed in specialised tourism businesses in the South Gippsland Shire. Employment numbers include causal staff.
“Food retail/producers” employed the most persons (179), followed by “restaurants” (166).
TYPE OF EMPLOYMENT
52% of persons employed in specialised tourism businesses were employed on a casual basis. 32% of persons are employed full-time.
FUTURE EMPLOYMENT INTENTIONS (2003-2004)
65% of specialised tourism businesses predicted no change in employment in the next financial year.
33% of specialised tourism businesses predicted an increase in employment.
Casual52%
Full Time32%
Part Time16%
Same65%
Decrease2%
Increase33%
44
23
166
28
179
147
5
591
0 200 400 600 800
Wineries
Tours&Activties
Restaurants
Other
FoodRetail/Producers
Attractions
AntiquesGall/Arts&Craft
Total
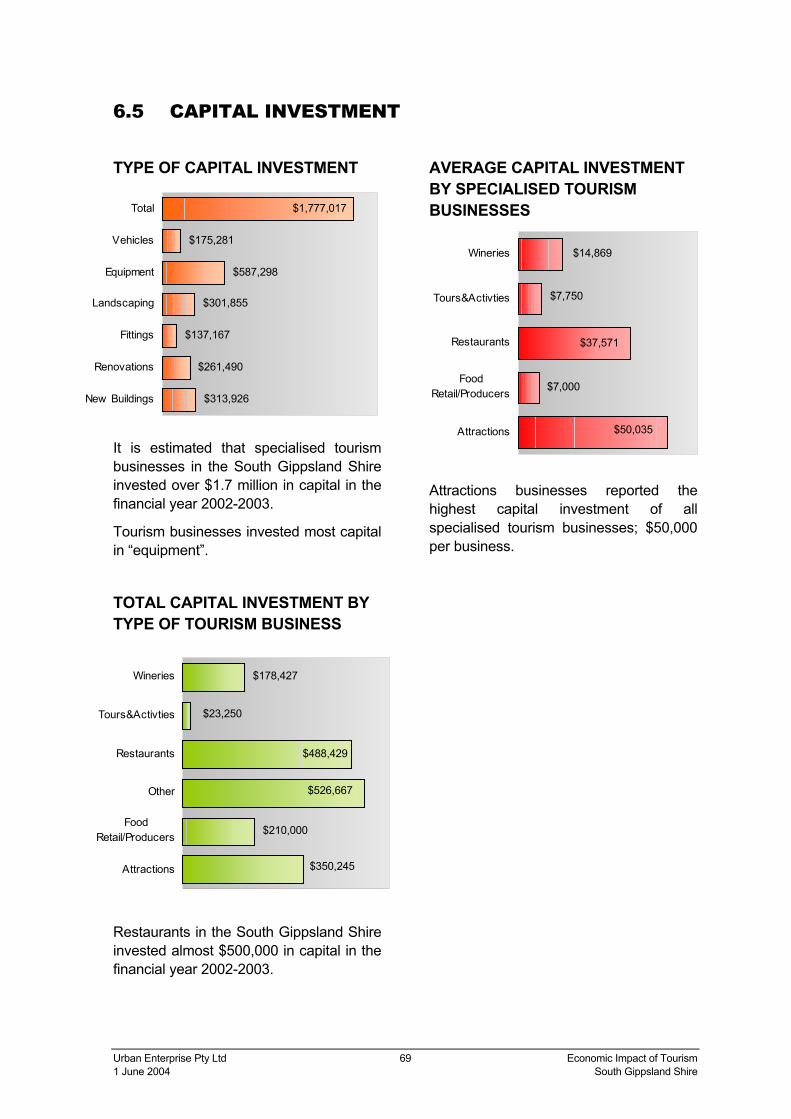
Urban Enterprise Pty Ltd 69 Economic Impact of Tourism 1 June 2004 South Gippsland Shire
6.5 CAPITAL INVESTMENT
TYPE OF CAPITAL INVESTMENT
It is estimated that specialised tourism businesses in the South Gippsland Shire invested over $1.7 million in capital in the financial year 2002-2003.
Tourism businesses invested most capital in “equipment”.
TOTAL CAPITAL INVESTMENT BY TYPE OF TOURISM BUSINESS
Restaurants in the South Gippsland Shire invested almost $500,000 in capital in the financial year 2002-2003.
AVERAGE CAPITAL INVESTMENT BY SPECIALISED TOURISM BUSINESSES
Attractions businesses reported the highest capital investment of all specialised tourism businesses; $50,000 per business.
$313,926
$261,490
$137,167
$301,855
$587,298
$175,281
$1,777,017
New Buildings
Renovations
Fittings
Landscaping
Equipment
Vehicles
Total
$210,000
$178,427
$526,667
$488,429
$23,250
$350,245Attractions
FoodRetail/Producers
Other
Restaurants
Tours&Activties
Wineries
$7,000
$37,571
$50,035
$14,869
$7,750
Attractions
FoodRetail/Producers
Restaurants
Tours&Activties
Wineries

Urban Enterprise Pty Ltd 70 Economic Impact of Tourism 1 June 2004 South Gippsland Shire
6.6 FUTURE CAPITAL INVESTMENT 2003-2004
TYPE OF CAPITAL INVESTMENT
Specialised tourism businesses in the South Gippsland Shire intend to invest over $1.1 million in capital in the financial year 2003-2004.
Specialised tourism businesses intend to invest the most capital in “equipment”. (Over $500,000)
TOTAL CAPITAL INVESTMENT BY TYPE OF TOURISM BUSINESSES
“Attractions” in the South Gippsland Shire intend to invest $350,000 in capital in the financial year 2003-2004.
AVERAGE CAPITAL INVESTMENT BY TYPE OF TOURISM BUSINESS
“Other” specialised tourism businesses intend to invest the highest amount of capital per business in the financial year 2003-2004.
$74,879
$187,460
$46,887
$226,325
$551,078
$16,786
$1,103,414
New Buildings
Renovations
Fittings
Landscaping
Equipment
Vehicles
total
$256,667
$96,818
$350,280
$15,000
$271,143
Attractions
FoodRetail/Producers
Other
Restaurants
Tours&Activties
$3,227
$128,333
$20,857
$5,000
$50,040Attractions
FoodRetail/Producers
Other
Restaurants
Tours&Activties

Urban Enterprise Pty Ltd 71 Economic Impact of Tourism 1 June 2004 South Gippsland Shire
6.7 BUSINESS INCOME
CHANGE IN BUSINESS INCOME 2002-2003
Over two thirds of specialised tourism businesses reported an increase in gross business income in the financial year 2002-2003.
A further 23% of specialised tourism businesses reported no change in gross business income in the financial year 2002-2003.
9% of tourism businesses reported a decrease in gross business income.
PREDICTED FUTURE INCOME 2003-2004
83% of specialised tourism businesses predict an increase in gross business income in the financial year 2003-2004.
9%
23%
2%
37%
16%
12%
-1% to -10%
No Change
1% to 10%
11% to 20%
21% to 30%
30% or more
Increase83%
Same12% Decrease
5%

Urban Enterprise Pty Ltd 72 Economic Impact of Tourism 1 June 2004 South Gippsland Shire
7 Profile of Other Businesses That Benefit From Tourism
7.1 KEY FINDINGS
Number and Location of Businesses
• 416 businesses (other than specialised tourism and accommodation businesses) that also benefit from visitation to the Shire make up 35% of all businesses in the Shire.
• One third of these businesses are located in Leongatha. The remainder are distributed evenly throughout he Shire.
Proportion of Business Turnover Generated by Visitors to the Shire
• For these other businesses 22% of their business income is generated by visitation to the Shire.
• 32% of business income in the summer months is generated by visitation to the Shire.
• Visitors contributed over half of the business turnover for recreational goods retailers.
HIGHLIGHTS • South Gippsland Shire has 416 businesses (other than specialised tourism and
accommodation businesses) that benefit from visitors to the Shire. Thesebusinesses employ an estimated 2341 persons.
• These businesses invested an estimated $9.8 million in capital improvements totheir business in the year 2002-2003. These businesses expect to invest a further$18 million in capital in the year 2003-2004.
• 58% of these businesses reported an increase in gross business income in the year2002-2003
• 57% of these businesses are expecting a further increase in gross business incomein the year 2003-2004.
Urban Enterprise Pty Ltd 73 Economic Impact of Tourism 1 June 2004 South Gippsland Shire
Employment
• 2341 persons are employed in these businesses.
• Almost half of the employees (49%) are employed full time.
Capital Investment
• Total capital investment by these businesses, is estimated at almost $10 million in the financial year 2002-2003.
• Businesses invested most capital on vehicles ($2.7 million) and new buildings ($2.2 million).
• Other businesses, which benefit from visitors to the Shire expect to invest an estimated $18 million in the financial year 2003-2004, half of which is expected to be spent on buildings.
Business Performance
• 58% of these businesses reported an increase in gross business income in the financial year 2002-2003.
• 57% of these businesses predict an increase in gross businesses income in the financial year 2003-2004.
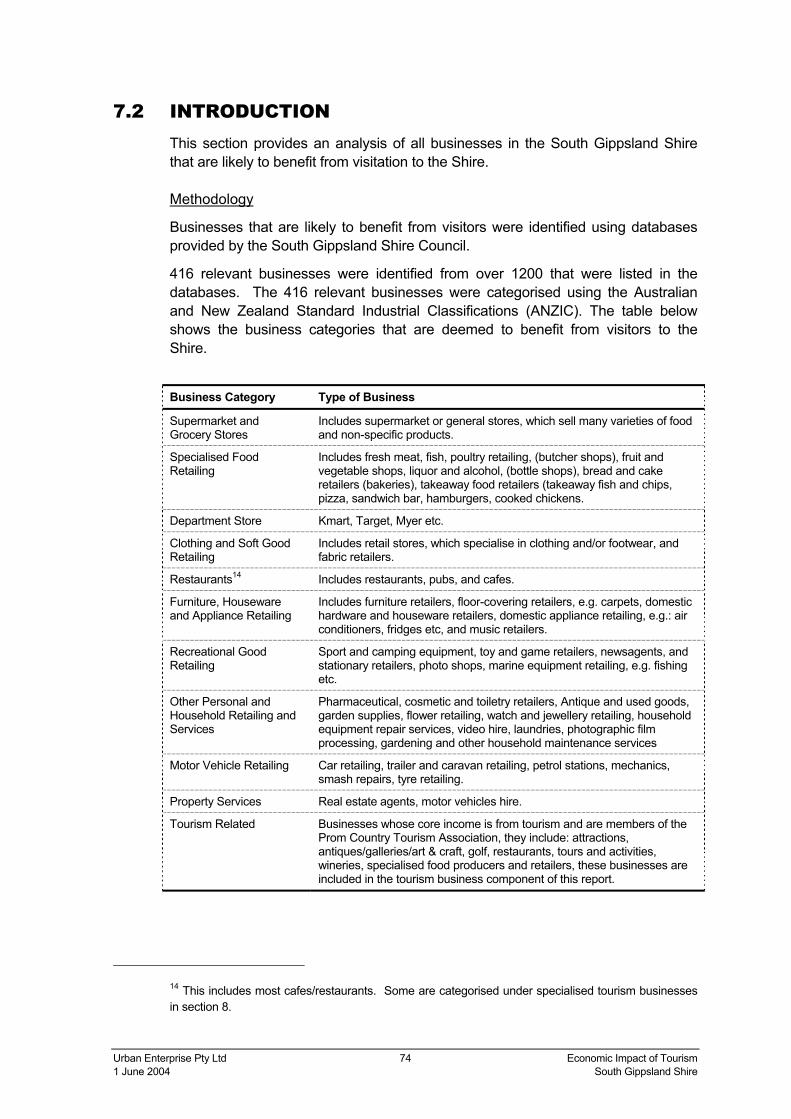
Urban Enterprise Pty Ltd 74 Economic Impact of Tourism 1 June 2004 South Gippsland Shire
7.2 INTRODUCTION This section provides an analysis of all businesses in the South Gippsland Shire that are likely to benefit from visitation to the Shire.
Methodology
Businesses that are likely to benefit from visitors were identified using databases provided by the South Gippsland Shire Council.
416 relevant businesses were identified from over 1200 that were listed in the databases. The 416 relevant businesses were categorised using the Australian and New Zealand Standard Industrial Classifications (ANZIC). The table below shows the business categories that are deemed to benefit from visitors to the Shire.
Business Category Type of Business
Supermarket and Grocery Stores
Includes supermarket or general stores, which sell many varieties of food and non-specific products.
Specialised Food Retailing
Includes fresh meat, fish, poultry retailing, (butcher shops), fruit and vegetable shops, liquor and alcohol, (bottle shops), bread and cake retailers (bakeries), takeaway food retailers (takeaway fish and chips, pizza, sandwich bar, hamburgers, cooked chickens.
Department Store Kmart, Target, Myer etc.
Clothing and Soft Good Retailing
Includes retail stores, which specialise in clothing and/or footwear, and fabric retailers.
Restaurants14 Includes restaurants, pubs, and cafes.
Furniture, Houseware and Appliance Retailing
Includes furniture retailers, floor-covering retailers, e.g. carpets, domestic hardware and houseware retailers, domestic appliance retailing, e.g.: air conditioners, fridges etc, and music retailers.
Recreational Good Retailing
Sport and camping equipment, toy and game retailers, newsagents, and stationary retailers, photo shops, marine equipment retailing, e.g. fishing etc.
Other Personal and Household Retailing and Services
Pharmaceutical, cosmetic and toiletry retailers, Antique and used goods, garden supplies, flower retailing, watch and jewellery retailing, household equipment repair services, video hire, laundries, photographic film processing, gardening and other household maintenance services
Motor Vehicle Retailing Car retailing, trailer and caravan retailing, petrol stations, mechanics, smash repairs, tyre retailing.
Property Services Real estate agents, motor vehicles hire.
Tourism Related Businesses whose core income is from tourism and are members of the Prom Country Tourism Association, they include: attractions, antiques/galleries/art & craft, golf, restaurants, tours and activities, wineries, specialised food producers and retailers, these businesses are included in the tourism business component of this report.
14 This includes most cafes/restaurants. Some are categorised under specialised tourism businesses in section 8.

Urban Enterprise Pty Ltd 75 Economic Impact of Tourism 1 June 2004 South Gippsland Shire
All 416 relevant businesses were sent a survey questionnaire. The survey was designed to collect the following information:
• Type of business;
• Persons employed;
• Capital investment;
• Performance of business;
• Proportion of customers who were visitors to the local area.
Information collected related to the financial year 2002-2003, and forecasts related to the financial year 2003-2004.
111 completed responses were received. Results were extrapolated for missing values to calculate total employment and capital investment.
The following formula was used for extrapolation:
Using the 95% confidence interval, the margin for error for the survey is calculated at less than 8%. This means that we can be 95% confident that the actual results in the report are within 8% of the results shown.
This is an acceptable error margin for the purposes of this study.
Averages for completed surveys X
Total businesses in database =
Total number
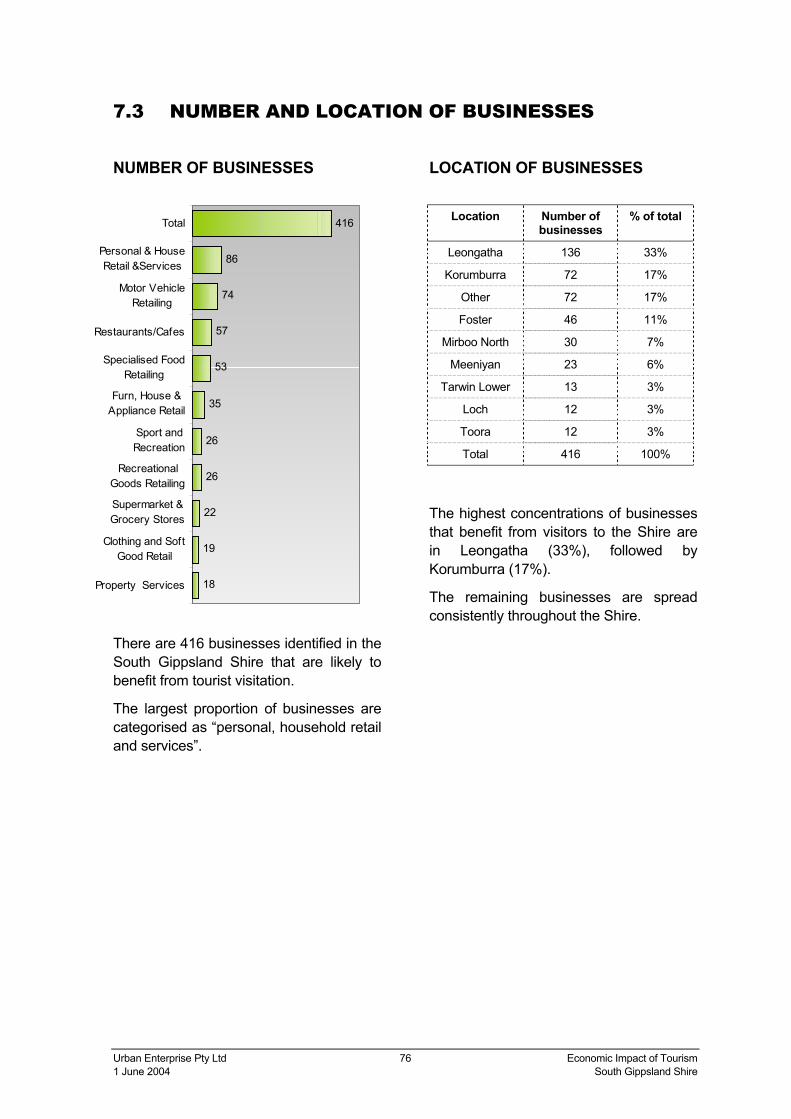
Urban Enterprise Pty Ltd 76 Economic Impact of Tourism 1 June 2004 South Gippsland Shire
7.3 NUMBER AND LOCATION OF BUSINESSES
NUMBER OF BUSINESSES
There are 416 businesses identified in the South Gippsland Shire that are likely to benefit from tourist visitation.
The largest proportion of businesses are categorised as “personal, household retail and services”.
LOCATION OF BUSINESSES
Location Number of businesses
% of total
Leongatha 136 33%
Korumburra 72 17%
Other 72 17%
Foster 46 11%
Mirboo North 30 7%
Meeniyan 23 6%
Tarwin Lower 13 3%
Loch 12 3%
Toora 12 3%
Total 416 100%
The highest concentrations of businesses that benefit from visitors to the Shire are in Leongatha (33%), followed by Korumburra (17%).
The remaining businesses are spread consistently throughout the Shire.
18
19
22
26
26
35
53
57
74
86
416
Property Services
Clothing and SoftGood Retail
Supermarket &Grocery Stores
RecreationalGoods Retailing
Sport andRecreation
Furn, House &Appliance Retail
Specialised FoodRetailing
Restaurants/Cafes
Motor VehicleRetailing
Personal & HouseRetail &Services
Total
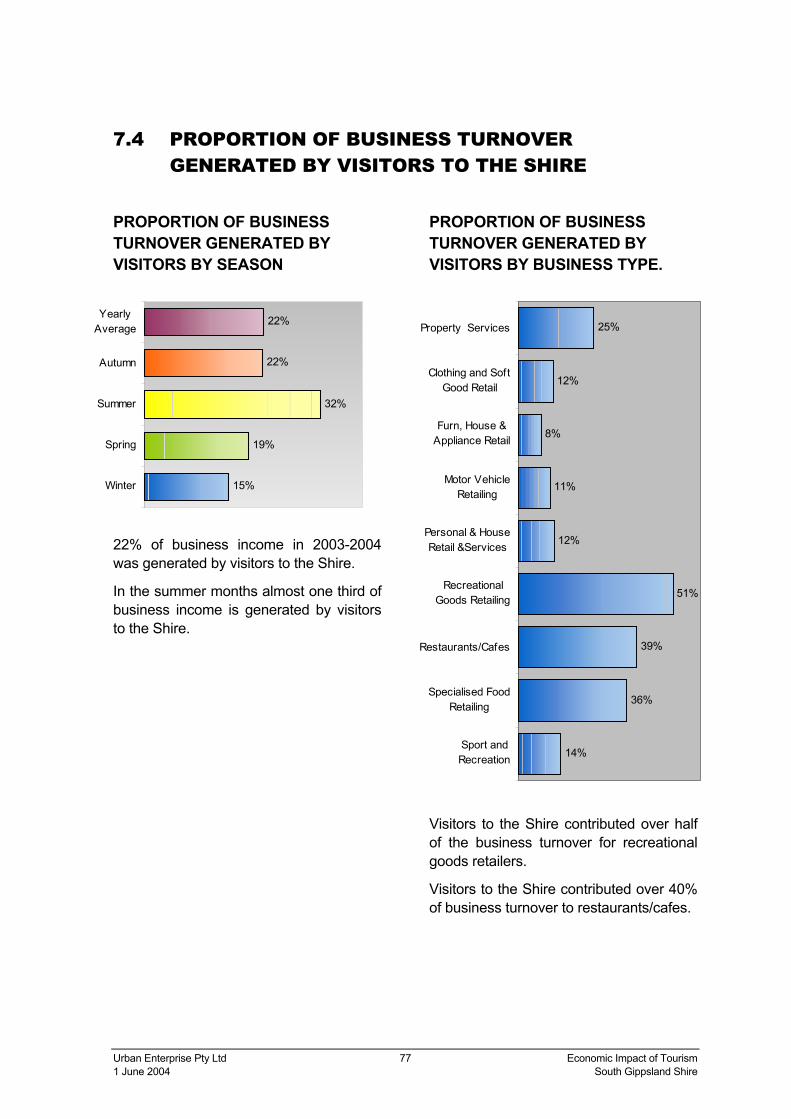
Urban Enterprise Pty Ltd 77 Economic Impact of Tourism 1 June 2004 South Gippsland Shire
7.4 PROPORTION OF BUSINESS TURNOVER GENERATED BY VISITORS TO THE SHIRE
PROPORTION OF BUSINESS TURNOVER GENERATED BY VISITORS BY SEASON
22% of business income in 2003-2004 was generated by visitors to the Shire.
In the summer months almost one third of business income is generated by visitors to the Shire.
PROPORTION OF BUSINESS TURNOVER GENERATED BY VISITORS BY BUSINESS TYPE.
Visitors to the Shire contributed over half of the business turnover for recreational goods retailers.
Visitors to the Shire contributed over 40% of business turnover to restaurants/cafes.
15%
19%
32%
22%
22%
Winter
Spring
Summer
Autumn
YearlyAverage
14%
36%
39%
51%
12%
11%
8%
12%
25%
Sport andRecreation
Specialised FoodRetailing
Restaurants/Cafes
RecreationalGoods Retailing
Personal & HouseRetail &Services
Motor VehicleRetailing
Furn, House &Appliance Retail
Clothing and SoftGood Retail
Property Services

Urban Enterprise Pty Ltd 78 Economic Impact of Tourism 1 June 2004 South Gippsland Shire
7.5 EMPLOYMENT
NUMBER OF PERSONS EMPLOYED
There are 2341 persons employed in businesses that benefit from visitors to the Shire.
“Motor vehicle retailing” employed the most persons (624), followed by “restaurants/cafes” (358).
TYPE OF EMPLOYMENT
Half of the persons employed in businesses that are likely to benefit from visitors to the Shire are employed on a full time basis. One third of persons are employed on a casual basis.
FUTURE EMPLOYMENT INTENTIONS (2003-2004)
Three quarters of businesses expect to have the same number of staff in 2003-2004.
61
224
624
286
85
100
358
175
111
319
2341
Clothing and SoftGood Retail
Furn, House &Appliance Retail
Motor VehicleRetailing
Personal & HouseRetail &Services
Property Services
RecreationalGoods Retailing
Restaurants/Cafes
Specialised FoodRetailing
Sport andRecreation
Supermarket &Grocery Stores
Total
Increase22%
Same75%
Decrease3%
Full Time49%
Casual33%
Part Time18%
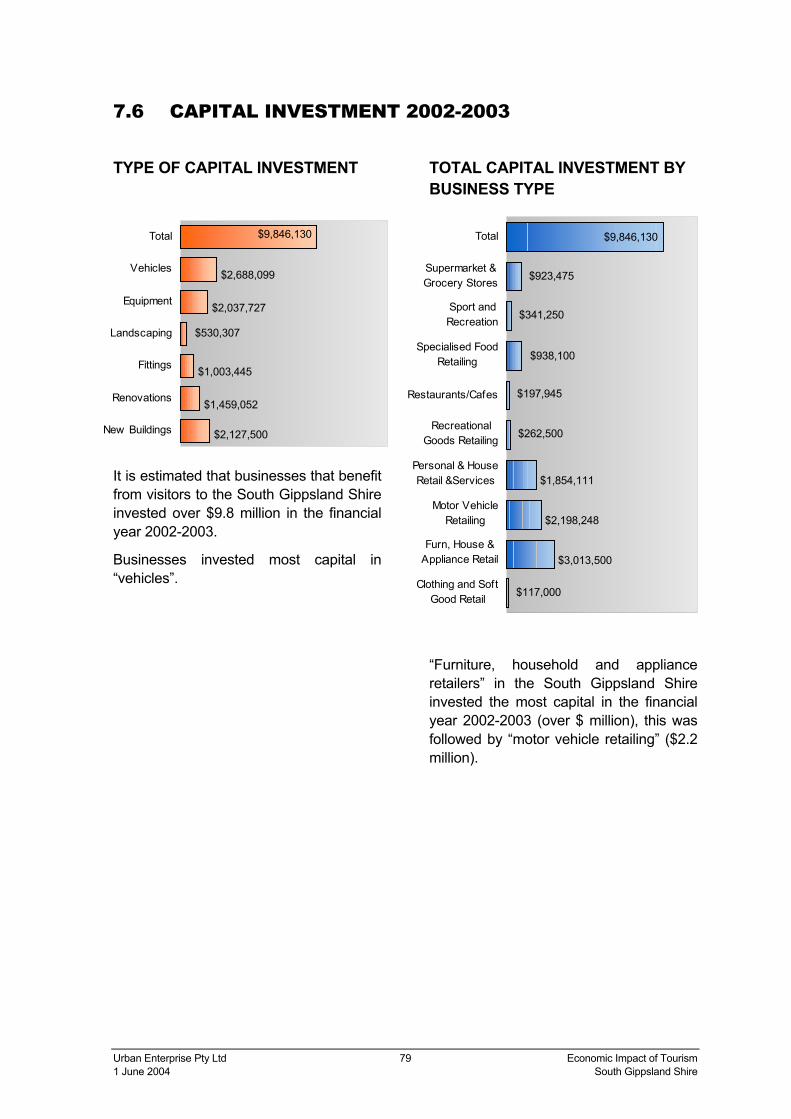
Urban Enterprise Pty Ltd 79 Economic Impact of Tourism 1 June 2004 South Gippsland Shire
7.6 CAPITAL INVESTMENT 2002-2003
TYPE OF CAPITAL INVESTMENT
It is estimated that businesses that benefit from visitors to the South Gippsland Shire invested over $9.8 million in the financial year 2002-2003.
Businesses invested most capital in “vehicles”.
TOTAL CAPITAL INVESTMENT BY BUSINESS TYPE
“Furniture, household and appliance retailers” in the South Gippsland Shire invested the most capital in the financial year 2002-2003 (over $ million), this was followed by “motor vehicle retailing” ($2.2 million).
$2,127,500
$1,459,052
$1,003,445
$530,307
$2,037,727
$2,688,099
$9,846,130
New Buildings
Renovations
Fittings
Landscaping
Equipment
Vehicles
Total
$117,000
$3,013,500
$2,198,248
$1,854,111
$262,500
$197,945
$341,250
$923,475
$9,846,130
$938,100
Clothing and SoftGood Retail
Furn, House &Appliance Retail
Motor VehicleRetailing
Personal & HouseRetail &Services
RecreationalGoods Retailing
Restaurants/Cafes
Specialised FoodRetailing
Sport andRecreation
Supermarket &Grocery Stores
Total
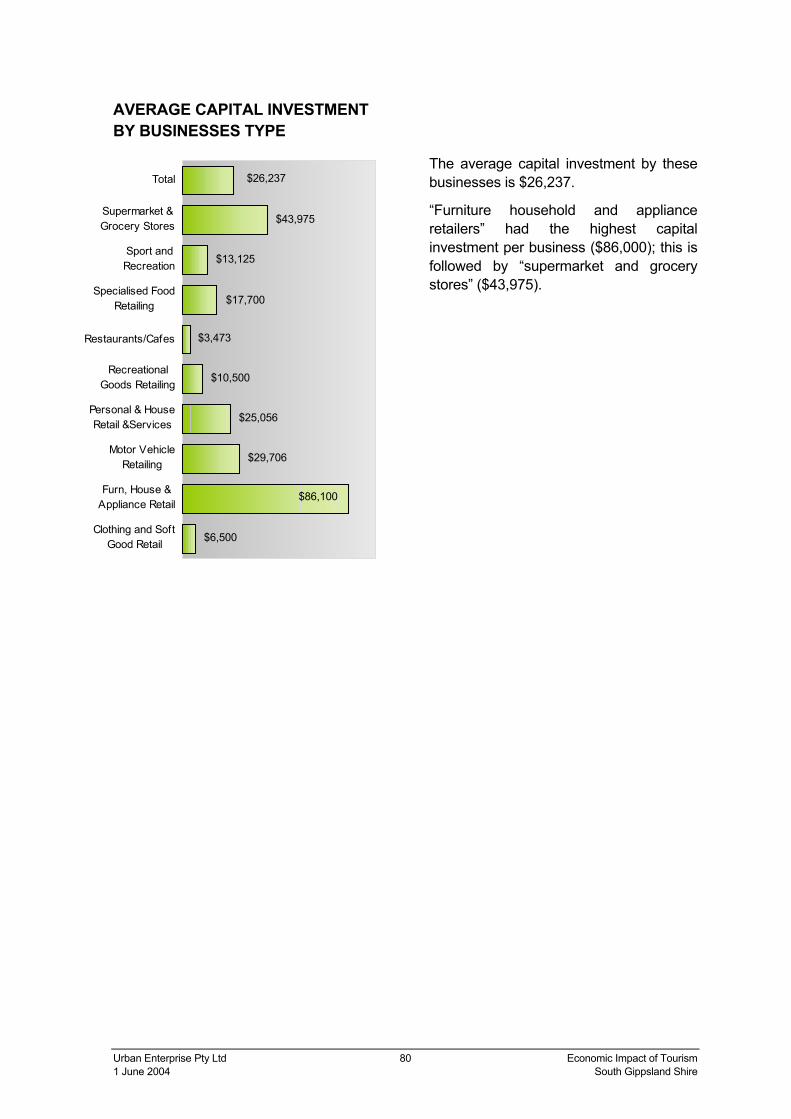
Urban Enterprise Pty Ltd 80 Economic Impact of Tourism 1 June 2004 South Gippsland Shire
AVERAGE CAPITAL INVESTMENT BY BUSINESSES TYPE
The average capital investment by these businesses is $26,237.
“Furniture household and appliance retailers” had the highest capital investment per business ($86,000); this is followed by “supermarket and grocery stores” ($43,975).
$6,500
$29,706
$25,056
$10,500
$3,473
$13,125
$43,975
$86,100
$17,700
$26,237
Clothing and SoftGood Retail
Furn, House &Appliance Retail
Motor VehicleRetailing
Personal & HouseRetail &Services
RecreationalGoods Retailing
Restaurants/Cafes
Specialised FoodRetailing
Sport andRecreation
Supermarket &Grocery Stores
Total

Urban Enterprise Pty Ltd 81 Economic Impact of Tourism 1 June 2004 South Gippsland Shire
7.7 FUTURE CAPITAL INVESTMENT 2003-2004
TYPE OF CAPITAL INVESTMENT
Businesses in the South Gippsland Shire, which benefit from visitors to the Shire, intend to invest over $18 million in capital in the financial year 2003-2004.
Half of the proposed investment is in “new buildings”, (over 49 million).
TOTAL CAPITAL INVESTMENT BY BUSINESS TYPE
Half of the intended capital investment in 2003-2004 is proposed by “sport and recreation” businesses.
$9,085,385
$2,208,173
$2,021,387
$1,623,308
$1,976,805
$1,191,175
$18,106,233
New Buildings
Renovations
Fittings
Landscaping
Equipment
Vehicles
Total
$157,500
$4,627,000
$777,000
$2,034,288
$93,750
$131,670
$9,091,250
$1,127,525
$66,250
$18,106,233
Clothing and SoftGood Retail
Furn, House &Appliance Retail
Motor VehicleRetailing
Personal & HouseRetail &Services
RecreationalGoods Retailing
Restaurants/Cafes
Specialised FoodRetailing
Sport andRecreation
Supermarket &Grocery Stores
Total

Urban Enterprise Pty Ltd 82 Economic Impact of Tourism 1 June 2004 South Gippsland Shire
AVERAGE CAPITAL INVESTMENT BY BUSINESS TYPE
Businesses, which benefit from visitors to the Shire, intend to invest on average $42,000 in the financial year 2003-2004.
“Sport and recreation” businesses intend to invest the highest amount of capital per business in the financial year 2003-2004, ($138,258).
$8,750
$10,500
$27,490
$3,750
$2,310
$53,692
$132,200
$138,125
$42,007
$1,250
Clothing and SoftGood Retail
Furn, House &Appliance Retail
Motor VehicleRetailing
Personal & HouseRetail &Services
RecreationalGoods Retailing
Restaurants/Cafes
Specialised FoodRetailing
Sport andRecreation
Supermarket &Grocery Stores
Total

Urban Enterprise Pty Ltd 83 Economic Impact of Tourism 1 June 2004 South Gippsland Shire
7.8 BUSINESS INCOME
CHANGE IN BUSINESS INCOME 2002-2003
58% of businesses reported an increase in gross business income in the financial year 2002-2003.
A further 19% of businesses reported no change in gross business income in the financial year 2002-2003.
24% of businesses reported a decrease in gross business income.
PREDICTED FUTURE INCOME 2003-2004
57% of businesses predict an increase in gross business income in the financial year 2003-2004.
4%
19%
14%
6%
5%
33%
19%
-11% to -20%
-1% to -10%
No Change
1% to 10%
11% to 20%
21% to 30%
30% or more
Decrease10%
Same33%
Increase57%

Urban Enterprise Pty Ltd 84 Economic Impact of Tourism 1 June 2004 South Gippsland Shire
8 Tourism Monitoring Framework
8.1 OVERVIEW OF EXISTING TOURISM RESEARCH The information presented in this report is the outcome of a holistic research approach and analysis of the tourism industry, using primary research methods. Such primary research methods are time consuming and costly. However primary research at the local level can be supplemented by existing data sources. Some relevant and improving secondary research is now available, this is outlined below.
National Visitor Survey Data – Bureau of Tourism Research
The National Visitor Survey has recently (March 2004) been made available at the Statistical Local Area level. This means that a profile of visitors can be created from an existing data source where previously it could not be. Subscribers of CDMota can obtain the data, which is a product of the Bureau of Tourism Research. The downfall to this data is the accuracy levels, which can be low for many SLA areas. The South Gippsland Shire is made up of three SLAs, and when combined the accuracy levels are only at an acceptable level for determining general conclusions.
Survey of Tourist Accommodation – Australian Bureau of Statistics
The Australia Bureau of Statistics undertakes a quarterly survey of accommodation establishments with 15 guest rooms or more. The research is undertaken as a census and presents an accurate picture of the large accommodation sector. However there is not data for accommodation establishments of 14 rooms or less, which is the predominant sector in the South Gippsland Shire.
Although the accommodation survey does not include results for small accommodation establishments, the results from the survey can provide trend information for guests, room nights and takings if collected and analysed on a yearly basis.
Urban Enterprise Pty Ltd 85 Economic Impact of Tourism 1 June 2004 South Gippsland Shire
8.2 MONITORING THE ECONOMIC IMPACT OF TOURISM This report provides comprehensive baseline information on the economic impact of tourism. However without continual updating, the information would progressively become obsolete. It is recommended that an on-going program of research be undertaken to maintain changes over time.
This program would be based on updating one component of the research each year on a rotational basis supplemented by analysis of the latest secondary data sources, namely the NVS and other relevant council databases.
The recommended research program comprises: -
Year 1 – Profile of the accommodation sector. Follow–up survey of all accommodation businesses and review of latest NVS data in respect of these results. Recalculation of the economic impact of tourism.
Year 2 – Profile of the business sector. Follow up survey of all tourism-related businesses and review of the latest NVS data in respect of these results. Recalculation of the economic impact of tourism.
Year 3 – Visitor profile. Follow up survey of visitors to the South Gippsland Shire, and review of the latest NVS in respect of these results. Recalculation of the economic impact of tourism.
Year 4 – Profile of the accommodation sector. Follow–up survey of all accommodation businesses and review of latest NVS data in respect of these results. Recalculation of the economic impact of tourism. Conduct a trend analysis based on the 3 surveys.
Year 5 – Repeat year 2 research
Urban Enterprise Pty Ltd 86 Economic Impact of Tourism 1 June 2004 South Gippsland Shire
9 Implications for Marketing
9.1 VISITOR MARKETS
Melbourne Market
The research clearly indicates that holiday homeowners are a significant contribution to tourism in the South Gippsland Shire.
The data on the place of residence of holiday homeowners provides guidance for targeting marketing campaigns to holiday homeowners, mostly of who live in the eastern and southeastern areas of Melbourne.
Results from the visitor survey also indicate higher levels of visitation from areas in the southeastern and eastern areas of Melbourne.
Country Victoria
Visitors and holiday homeowners from country Victoria are concentrated in the regional areas surrounding the South Gippsland Shire. This includes the towns of Moe, Morwell and Yarragon to the north and Wonthaggi to the West.
There is also higher than average visitation to the South Gippsland Shire from regional centres of Ballarat and Bendigo.
Interstate Market
The visitor survey indicates that 11% of visitors to the South Gippsland Shire are from interstate. The NSW market makes up over half of all interstate visitation.
9.2 VISITOR PERCEPTION AND ACTIVITIES – WHAT TO MARKET The vast majority of visitors (72%) visit national parks when frequenting the South Gippsland Shire, i.e.: Wilson’s Promontory. In addition to this the visitor survey indicates that 43% of visitors associate the South Gippsland Shire most with Wilson’s Promontory. In terms of marketing, the natural attractions within the South Gippsland Shire namely Wilson’s Promontory and the ocean beaches should continue to be a focus for marketing campaigns. Natural attractions are responsible for attracting the majority of visitors to the region.
Urban Enterprise Pty Ltd 87 Economic Impact of Tourism 1 June 2004 South Gippsland Shire
However, there is clearly a need to raise awareness for the Shire’s other tourism attractions and activities. An example of this is that only 4% of visitors associated the Shire with farming, and 2% with food and wine.
9.3 NICHE MARKETS There is a possibility to further develop niche markets in the South Gippsland Shire. The research indicates that bushwalking, going to the beach and undertaking outdoor activities are some of the key activities undertaken by visitors to the South Gippsland Shire. There is an opportunity to expand the backpacker market, which is suited to these popular these activities.
The visitor survey results indicate that 35% of visitors eat out, 21% of visitors visit a food producer and 15% of visitors visit wineries. Food and wine tourism is a potentially growing niche market.
Finally, the substantial amount of tourism generated by camping, suggests that this will continue to be an important market segment. Close co-operation with Parks Victoria and a focus on caravan and camping shows, publications and free publicity are strategies that can continue to cater to this market.
Urban Enterprise Pty Ltd 88 Economic Impact of Tourism 1 June 2004 South Gippsland Shire
Appendices

Urban Enterprise Pty Ltd 89 Economic Impact of Tourism 1 June 2004 South Gippsland Shire
Appendix A. Glossary of Terms and Definitions
ABS Australian Bureau of Statistics, responsible for national
statistics relating to population and industry.
Accommodation Businesses This refers to all businesses listed on the prom country accommodation database.
Average Length Stay This is the average taken from the total of all visitors nominated length of stay. It simply refers to how many days person stayed in the South Gippsland Shire.
BTR Bureau of Tourism Research – a government funded body which undertakes tourism related research, namely the National Visitor Survey (NVS) and International Visitor Survey (IVS)
Capital Investment This refers to the dollar amount, which businesses have spent, on their business for the financial year 2002-2003.
Country Victoria This refers to all areas outside the Melbourne Metropolitan area.
Guest Nights The number of guests physically staying in the accommodation facility.
Guest Rooms The total number of rooms available at each establishment for accommodating short term paying guests.
Holiday Homes This refers to all residential dwellings identified as being owned by persons who live outside the South Gippsland Shire.
IVS International Visitor Survey – A survey of international visitors to Australia conducted in international airport departure lounges Australia wide.
Metropolitan Melbourne This refers to all Local Government areas, which make up the Melbourne metropolis.
NVS National Visitor Survey – An Australia wide phone survey of more than 80,000 respondents per year.
Occupancy Occupancy in terms of room nights refers to the total number of nights each paying guest stayed.
Occupancy Rates Occupancy rates represent occupancy expressed as a percentage of total capacity available.
Urban Enterprise Pty Ltd 90 Economic Impact of Tourism 1 June 2004 South Gippsland Shire
Other businesses that Benefit From Visitors to the Shire
This refers to all businesses that derive more than 10% of their of turnover from visitors to the Shire.
Room Nights Number of rooms physically occupied.
Room Nights Available The number of guest rooms/units available multiplied by the number of days for which they were available.
Specialised Tourism Businesses
This refers to all businesses, which have been identified as specifically targeting tourists/ visitors for the majority of their income.
Takings Takings refer to the gross earnings businesses accumulate from selling their product or service.
Turnover/ Business Income This refers to all income derived by a business from products or services, which they sell.
Visitor This refers to persons who visit the Shire and live outside the Shire.
Visitor Accommodation This refers to self-contained cottages, motels, hotels, guesthouses, cabins, backpackers, B&Bs and camping grounds. Holiday homes are defined separately.
Visitor Activities This refers to the activities undertaken by visitors to the South Gippsland Shire.
Visitor Days This refers to the number of days visitors spend in the South. For example, two visitors’ spending 10 days in the Shire is equal to 20 visitor days.
Visitor Expenditure This refers to the amount that visitors have spent or intend to spend in the Shire.
Visitor Nights This refers to the number of nights visitors spend in the Shire. For example, two visitors spending 10 nights in the Shire, equals 20 visitor nights.

Urban Enterprise Pty Ltd 91 Economic Impact of Tourism 1 June 2004 South Gippsland Shire
Appendix B. References
Australian Bureau of Statistics: (2002) CDATA 2001, Employment by Industry
Australian Bureau of Statistics: (2003) Summary of Caravan Parks (Victoria)
Bureau of Tourism Research (2003) CDMOTA National Visitor Survey 2003