Economic Development Inventory 2003 Prepared for the Northwest Initiative By the Indiana Business...
32
Economic Development Inventory 2003 Prepared for the Northwest Initiative By the Indiana Business Research Center Kelley School of Business Indiana University December 2003 Economic Development Inventory 2003
-
Upload
isabel-brown -
Category
Documents
-
view
215 -
download
0
Transcript of Economic Development Inventory 2003 Prepared for the Northwest Initiative By the Indiana Business...
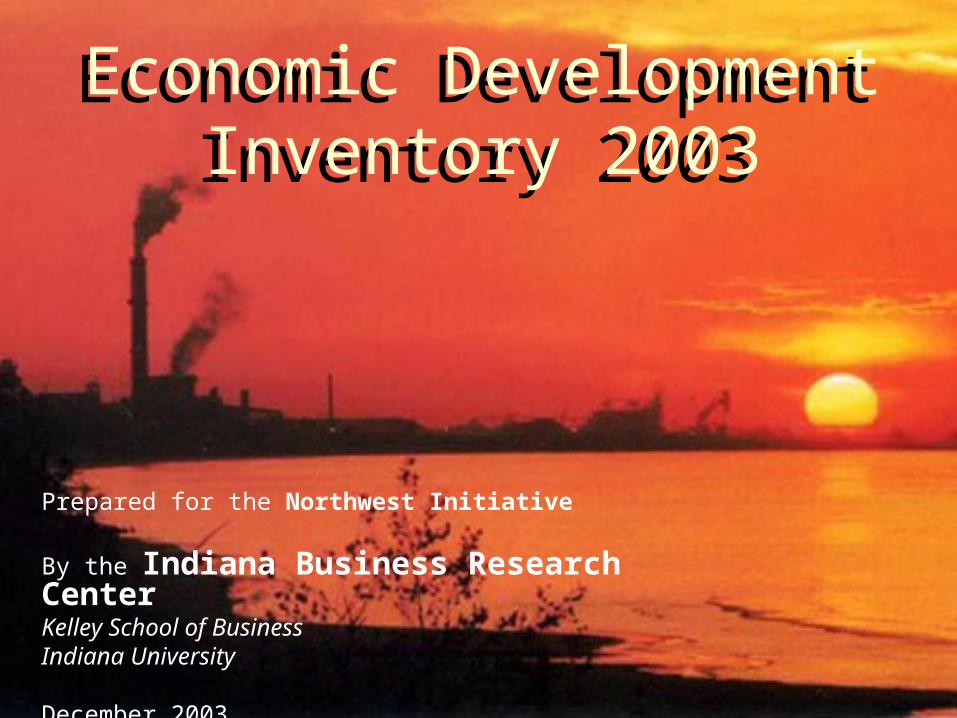
Economic Development Inventory 2003
Prepared for the Northwest Initiative
By the Indiana Business Research Center Kelley School of BusinessIndiana University
December 2003
Economic Development Inventory 2003
2
The survey
• 51 participants from eight counties
• Letters, faxes, phone calls to encourage participants from a list of 91 organizations
• Surveyed during Fall 2003
• On-line survey instrument equal to five pages
• Developed by and tested with economic development professionals
3
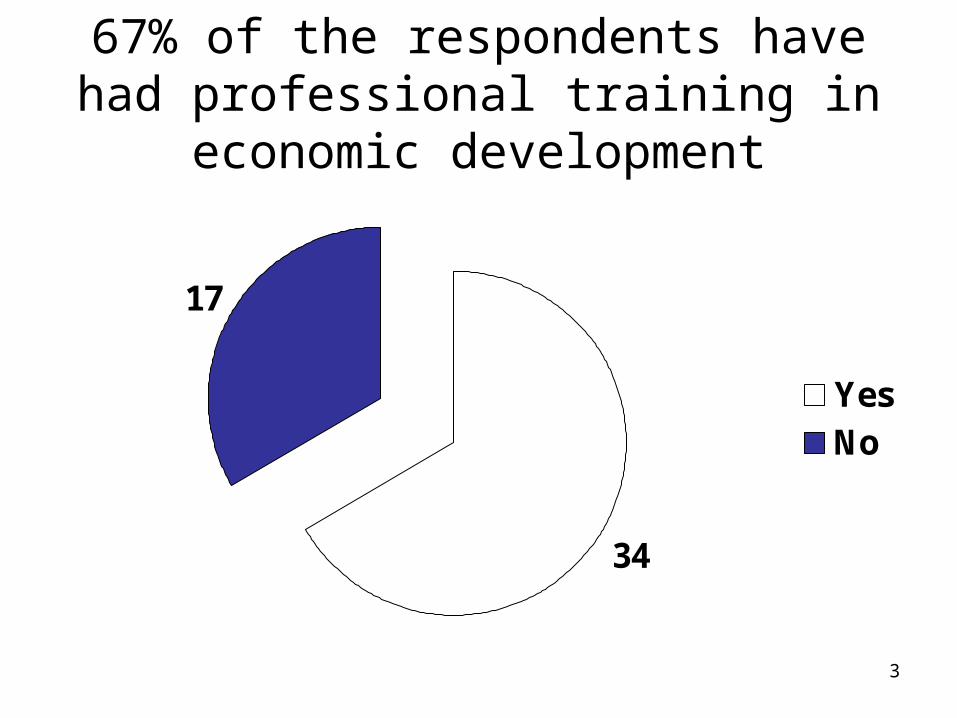
67% of the respondents have had professional training in economic
development
34
17
YesNo
4
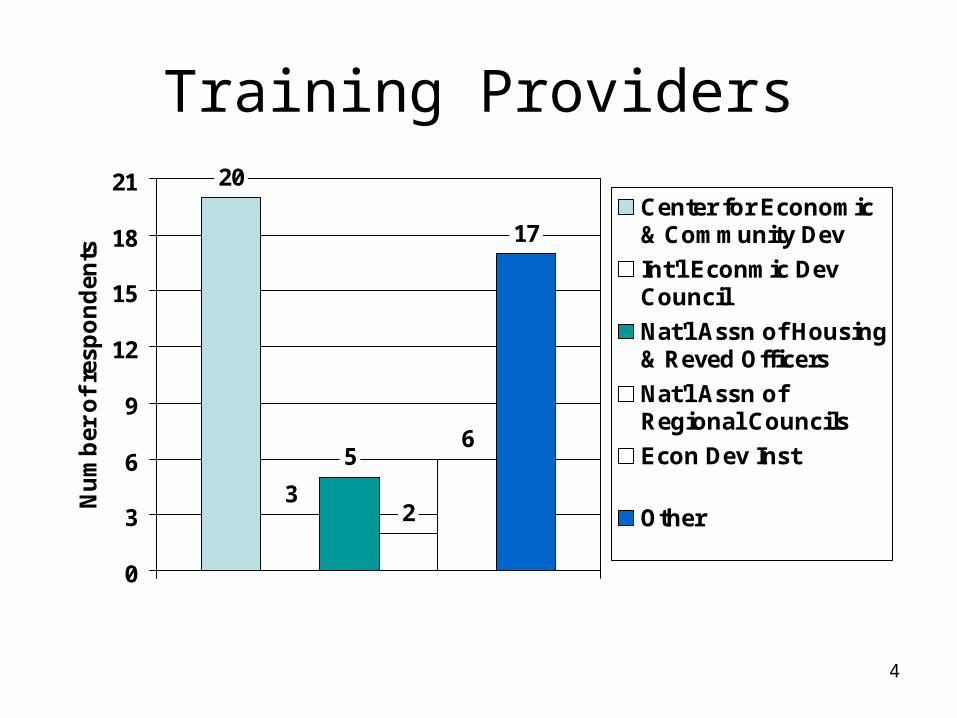
Training Providers20
3
5
2
6
17
0
3
6
9
12
15
18
21
Nu
mb
er o
f re
spo
nd
ents
Center for Economic& Community Dev
Int'l Econmic DevCouncil
Nat'l Assn of Housing& Reved Officers
Nat'l Assn ofRegional Councils
Econ Dev Inst
Other
5
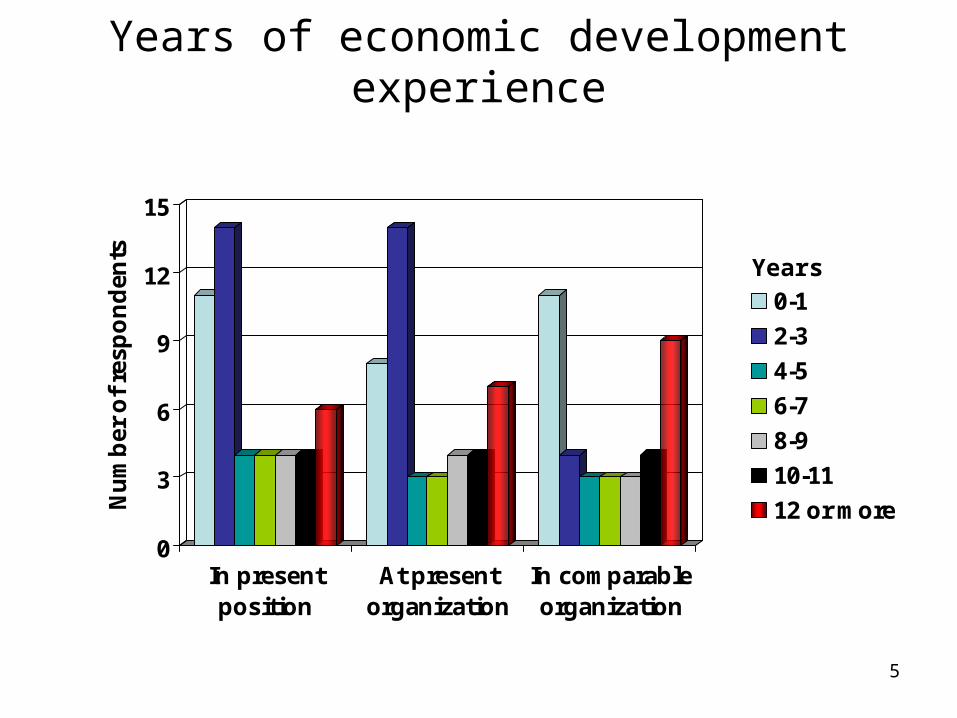
Years of economic development experience
0
3
6
9
12
15
Nu
mb
er o
f re
spo
nd
ents
In presentposition
At presentorganization
In comparableorganization
0-1
2-3
4-5
6-7
8-9
10-11
12 or more
Years
6
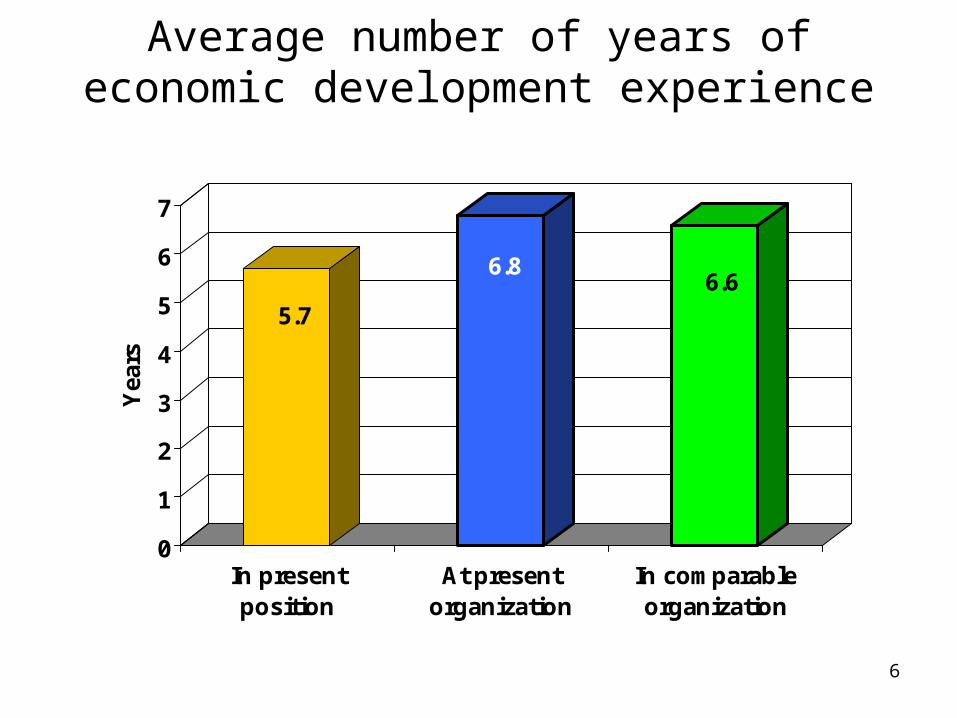
Average number of years of economic development experience
5.7
6.86.6
0
1
2
3
4
5
6
7
Yea
rs
In presentposition
At presentorganization
In comparableorganization

7
Percent of respondents with less than five years of economic development experience
55%53%
41%
0%
10%
20%
30%
40%
50%
60%
Per
cen
t
In presentposition
At presentorganization
In comparableorganization
8
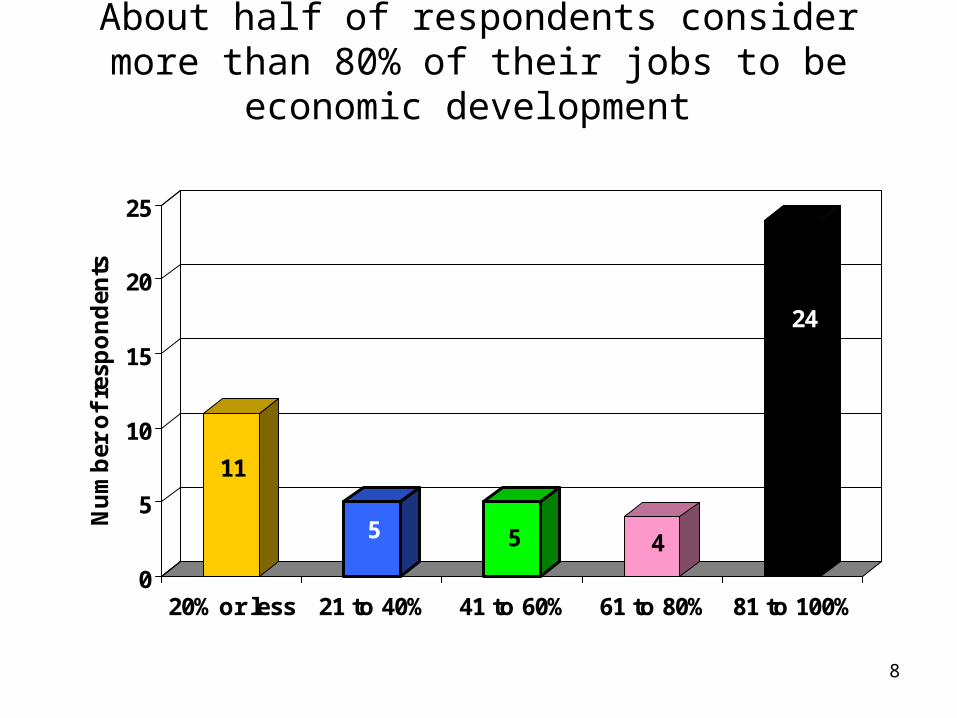
About half of respondents consider more than 80% of their jobs to be economic development
11
5 5 4
24
0
5
10
15
20
25
Nu
mb
er o
f re
spo
nd
ents
20% or less 21 to 40% 41 to 60% 61 to 80% 81 to 100%
9
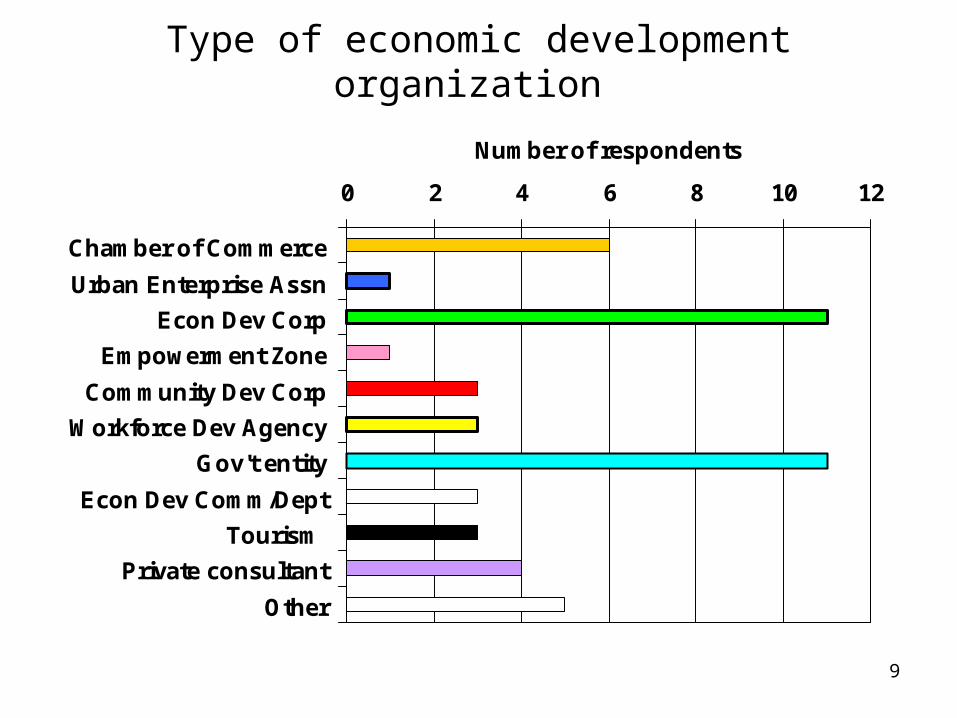
Type of economic development organization
0 2 4 6 8 10 12
Chamber of Commerce
Urban Enterprise Assn
Econ Dev Corp
Empowerment Zone
Community Dev Corp
Workforce Dev Agency
Gov't entity
Econ Dev Comm/Dept
Tourism
Private consultant
Other
Number of respondents
10
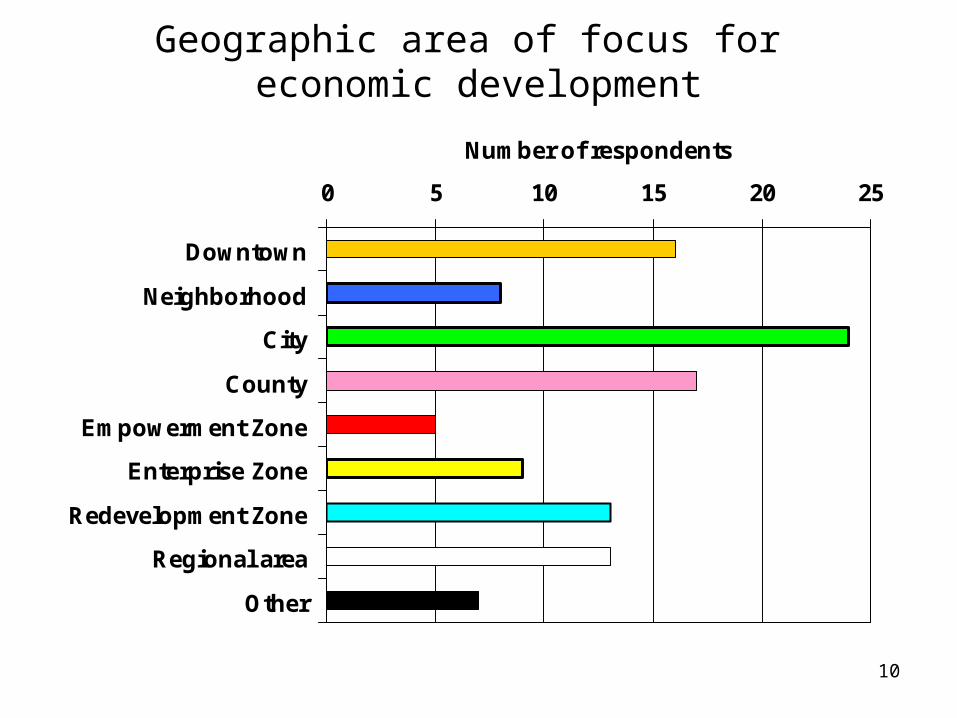
Geographic area of focus for economic development
0 5 10 15 20 25
Downtown
Neighborhood
City
County
Empowerment Zone
Enterprise Zone
Redevelopment Zone
Regional area
Other
Number of respondents
11
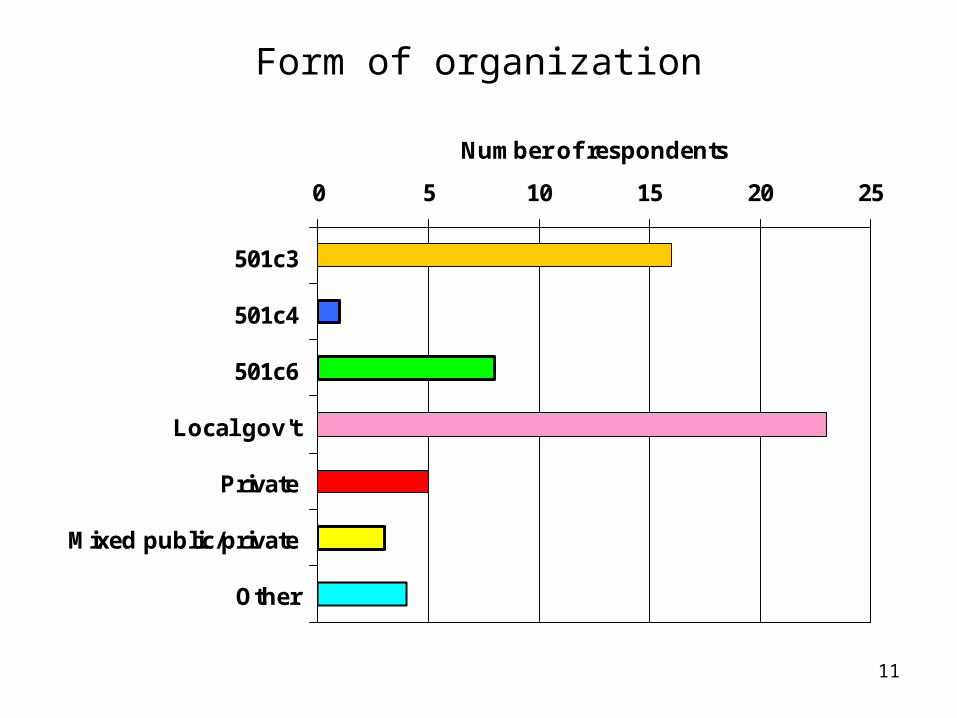
Form of organization
0 5 10 15 20 25
501c3
501c4
501c6
Local gov't
Private
Mixed public/private
Other
Number of respondents
12
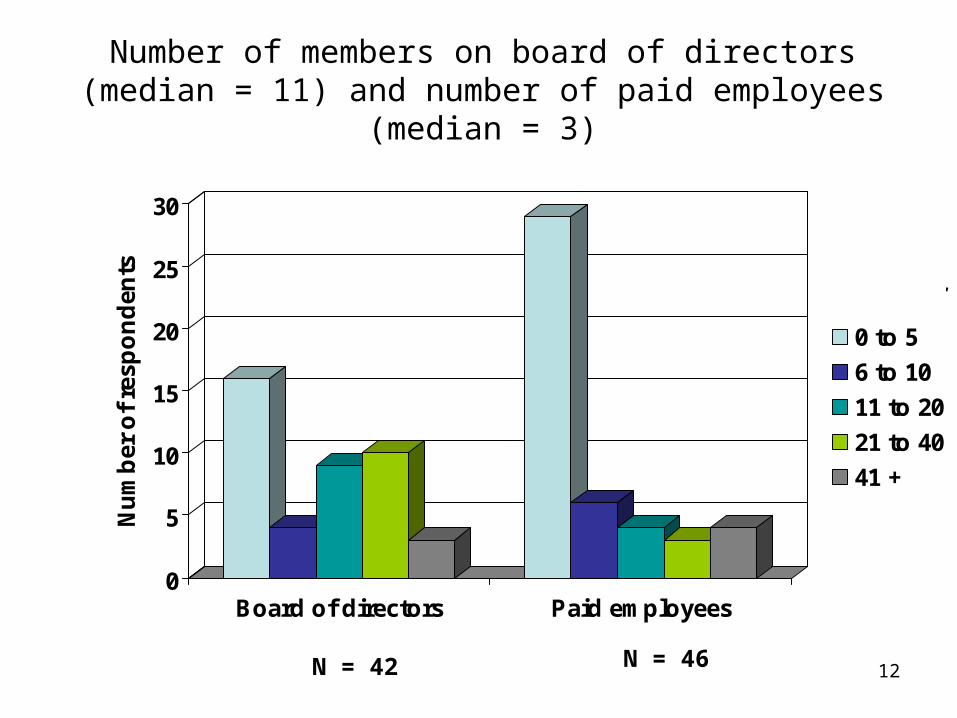
Number of members on board of directors (median = 11) and number of paid employees (median = 3)
0
5
10
15
20
25
30
Nu
mb
er o
f re
spo
nd
ents
Board of directors Paid employees
0 to 5
6 to 10
11 to 20
21 to 40
41 +
Number
N = 42 N = 46
13
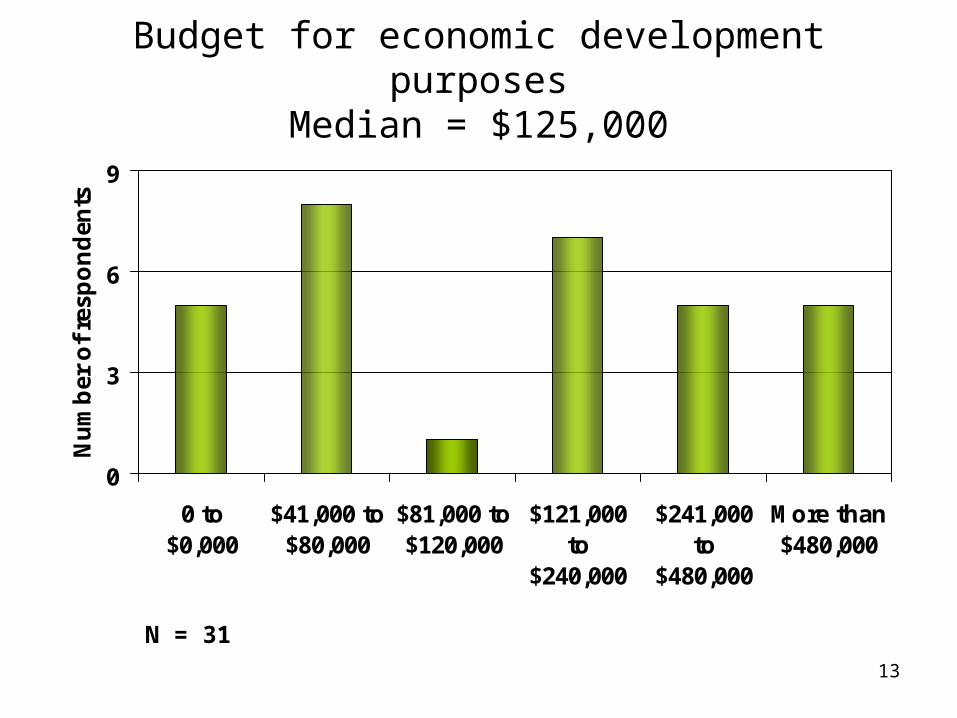
Budget for economic development purposesMedian = $125,000
0
3
6
9
0 to$0,000
$41,000 to$80,000
$81,000 to$120,000
$121,000to
$240,000
$241,000to
$480,000
More than$480,000
Nu
mb
er o
f re
spo
nd
ents
N = 31
14
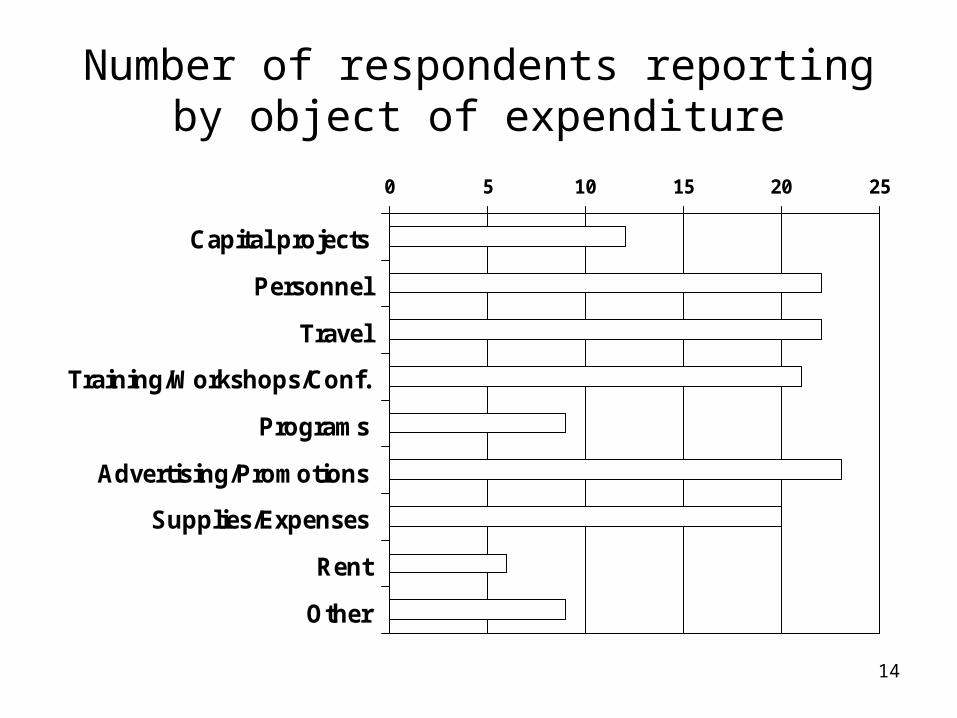
Number of respondents reporting by object of expenditure
0 5 10 15 20 25
Capital projects
Personnel
Travel
Training/Workshops/Conf.
Programs
Advertising/Promotions
Supplies/Expenses
Rent
Other
15
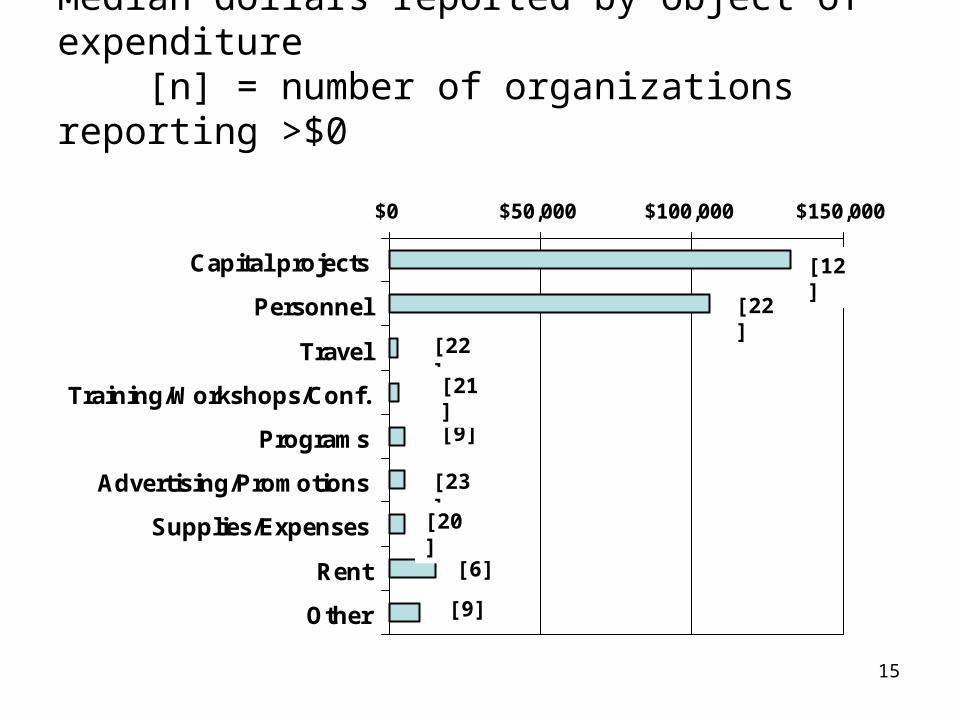
Median dollars reported by object of expenditure [n] = number of organizations reporting >$0
$0 $50,000 $100,000 $150,000
Capital projects
Personnel
Travel
Training/Workshops/Conf.
Programs
Advertising/Promotions
Supplies/Expenses
Rent
Other
[12]
[22]
[22]
[9]
[9]
[23]
[20]
[6]
[21]
16
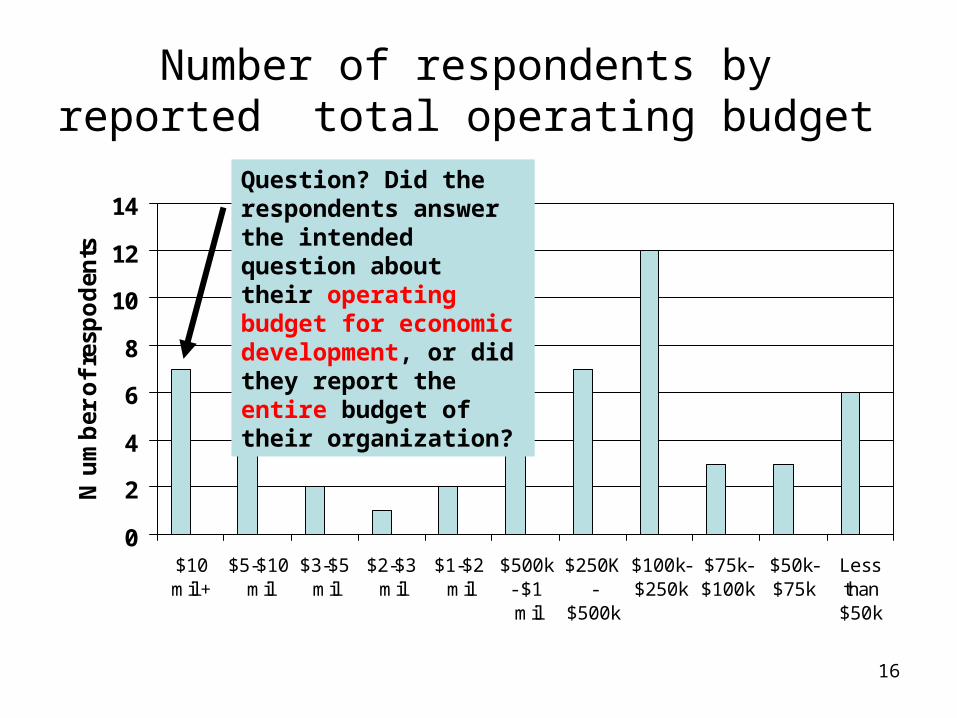
Number of respondents by reported total operating budget
0
2
4
6
8
10
12
14
$10mil +
$5-$10mil
$3-$5mil
$2-$3mil
$1-$2mil
$500k- $1mil
$250K-
$500k
$100k-$250k
$75k-$100k
$50k-$75k
Lessthan$50k
N u
mb
er o
f re
spo
den
ts
Question? Did the respondents answer the intended question about their operating budget for economic development, or did they report the entire budget of their organization?
17
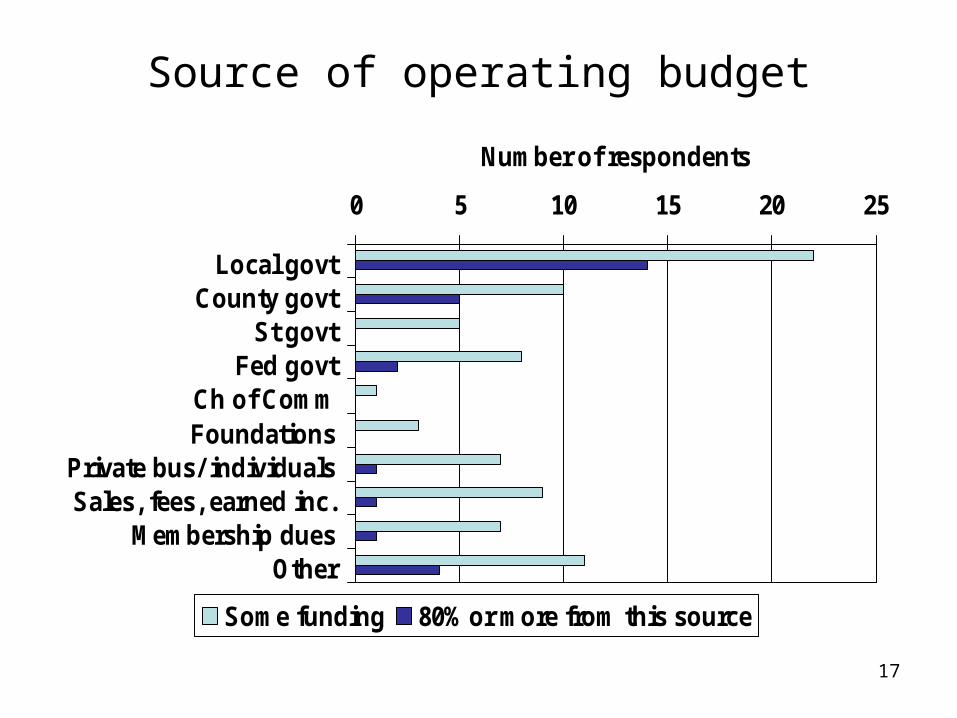
Source of operating budget
0 5 10 15 20 25
Local govtCounty govt
St govtFed govt
Ch of CommFoundations
Private bus/ individualsSales, fees, earned inc.
Membership duesOther
Number of respondents
Some funding 80% or more from this source
18
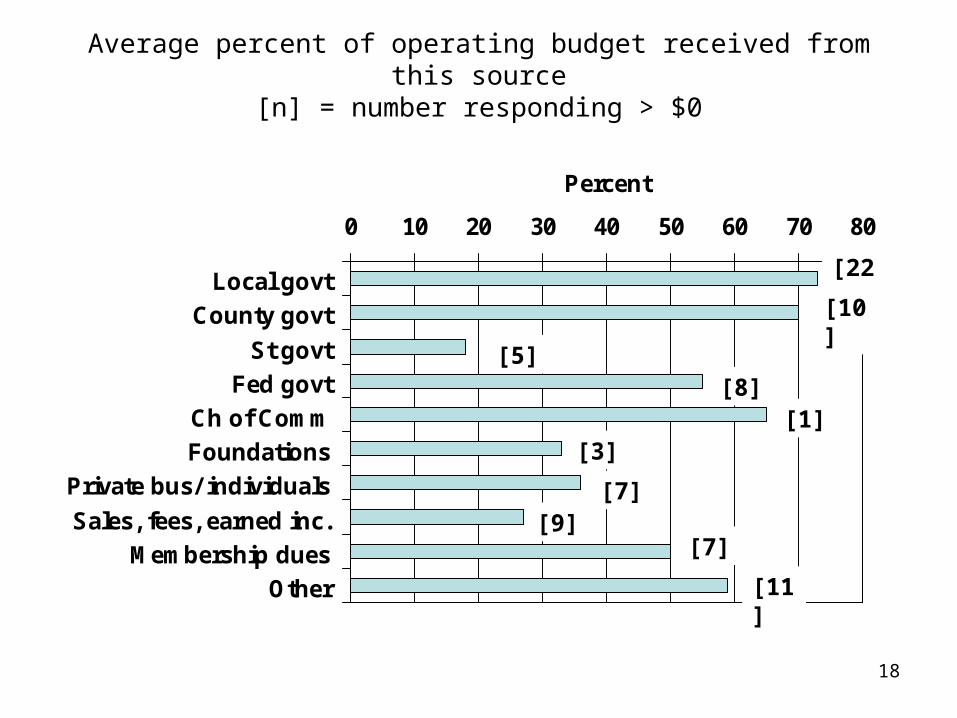
Average percent of operating budget received from this source[n] = number responding > $0
0 10 20 30 40 50 60 70 80
Local govt
County govt
St govt
Fed govt
Ch of Comm
Foundations
Private bus/ individuals
Sales, fees, earned inc.
Membership dues
Other
Percent
[22]
[10]
[5][8]
[1][3]
[7][9]
[7]
[11]
19
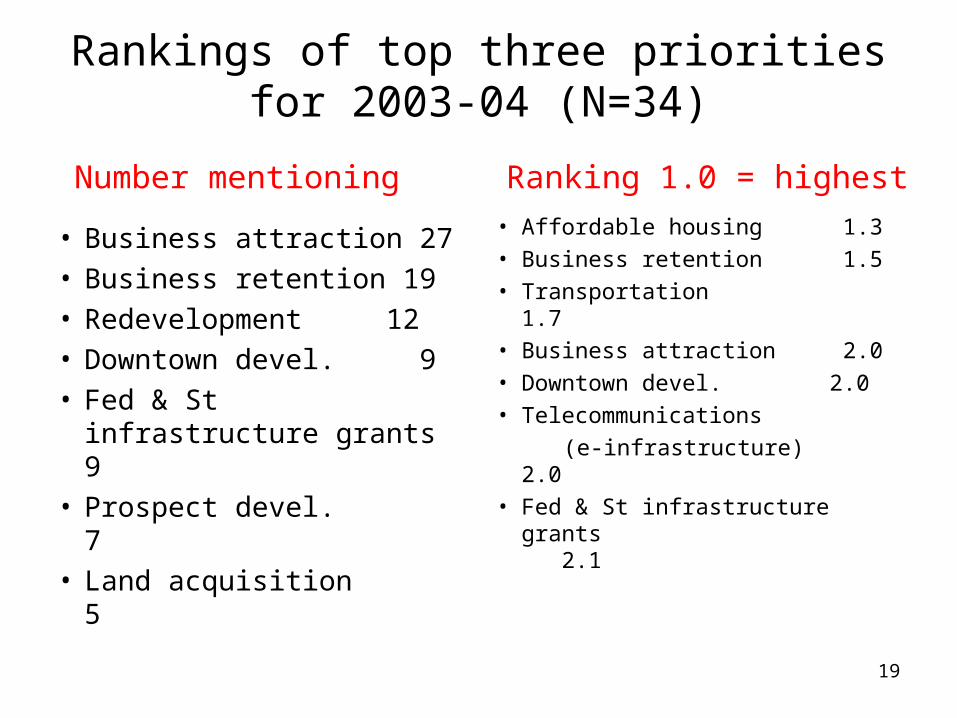
Rankings of top three priorities for 2003-04 (N=34)
• Business attraction 27• Business retention 19• Redevelopment 12• Downtown devel. 9• Fed & St
infrastructure grants 9• Prospect devel. 7• Land acquisition 5
• Affordable housing 1.3• Business retention 1.5• Transportation 1.7• Business attraction 2.0• Downtown devel. 2.0• Telecommunications
(e-infrastructure) 2.0• Fed & St infrastructure
grants 2.1
Number mentioning Ranking 1.0 = highest
20
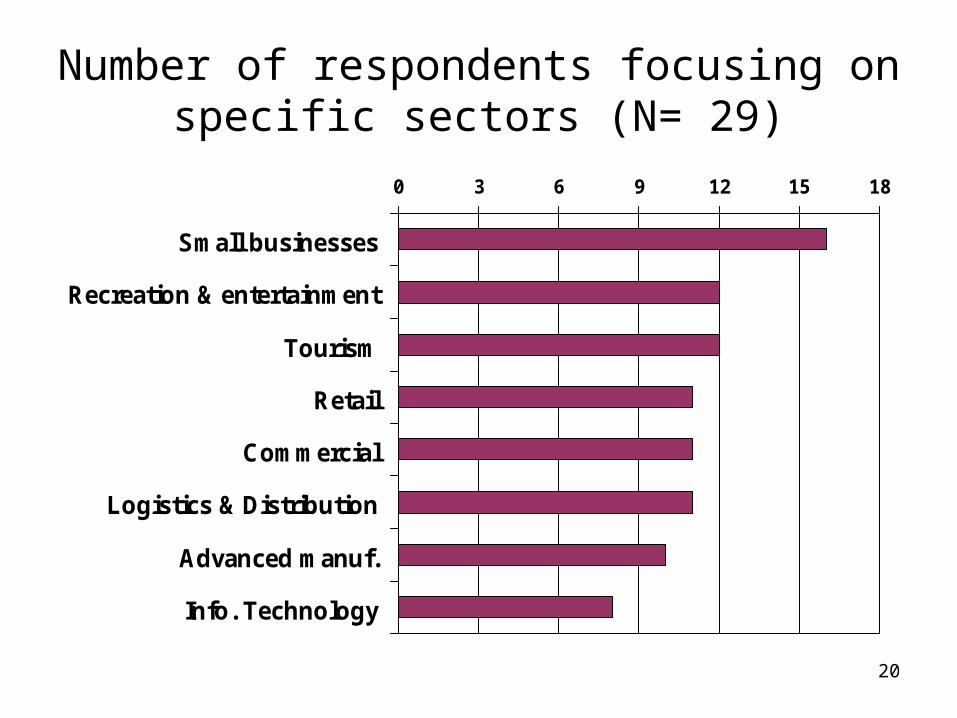
Number of respondents focusing on specific sectors (N= 29)
0 3 6 9 12 15 18
Small businesses
Recreation & entertainment
Tourism
Retail
Commercial
Logistics & Distribution
Advanced manuf.
Info. Technology
21
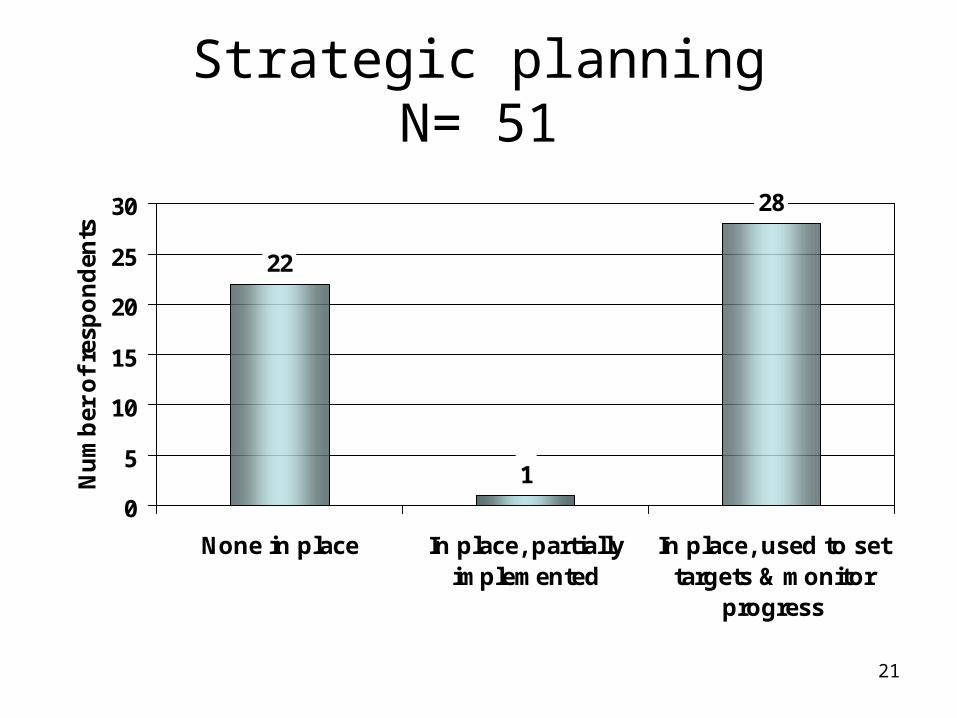
Strategic planningN= 51
22
1
28
0
5
10
15
20
25
30
None in place In place, partiallyimplemented
In place, used to settargets & monitor
progress
Nu
mb
er o
f re
spo
nd
ents

22
Organizational involvement (N=49)
• Ch of Commerce 44• NIRPC 30• IN Dept Commerce 30• NIPSCO 30• NW Ind Forum 29• County Convention &
Visitors Bureau 23• Northwest Initiative 20• Workforce Dev
Agency 20
• Other 19• Quality of Life Council 16• Urban Enterprise Assn 16• Ind Econ Dev Assn 15• Empowerment Zone 12• U.S Dept. Commerce 11• Construction Advancement
Foundation 8• Ind Econ Dev Council 7
Number mentioning Number mentioning
23
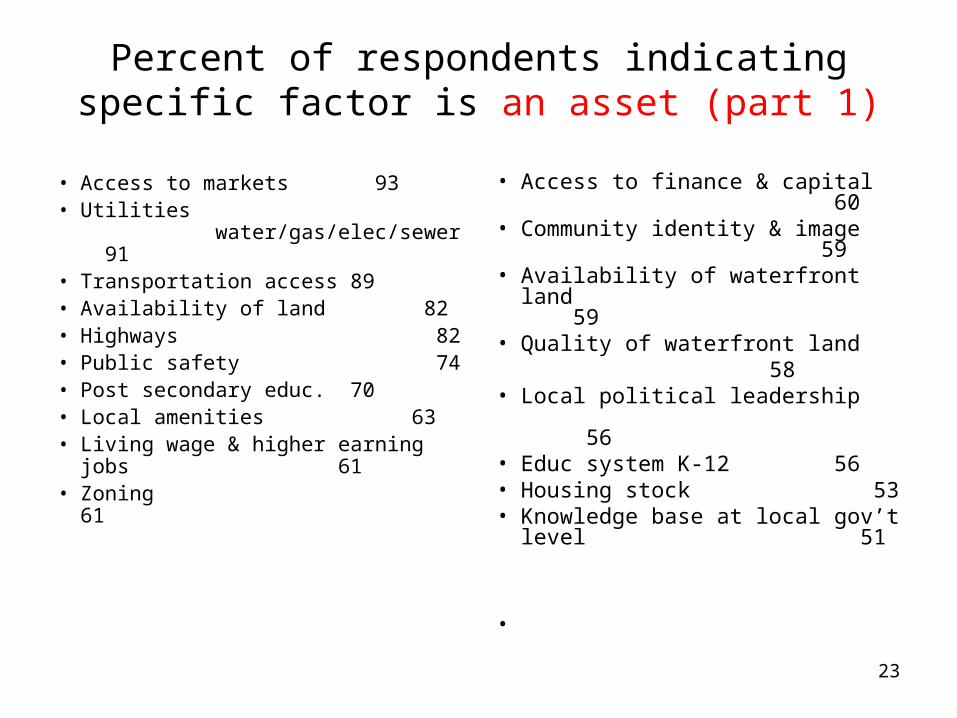
Percent of respondents indicating specific factor is an asset (part 1)
• Access to markets 93• Utilities
water/gas/elec/sewer 91• Transportation access 89• Availability of land 82• Highways 82• Public safety 74• Post secondary educ. 70• Local amenities 63• Living wage & higher earning jobs
61• Zoning 61
• Access to finance & capital 60
• Community identity & image 59
• Availability of waterfront land 59
• Quality of waterfront land 58
• Local political leadership 56
• Educ system K-12 56• Housing stock 53• Knowledge base at local gov’t
level 51
•
24
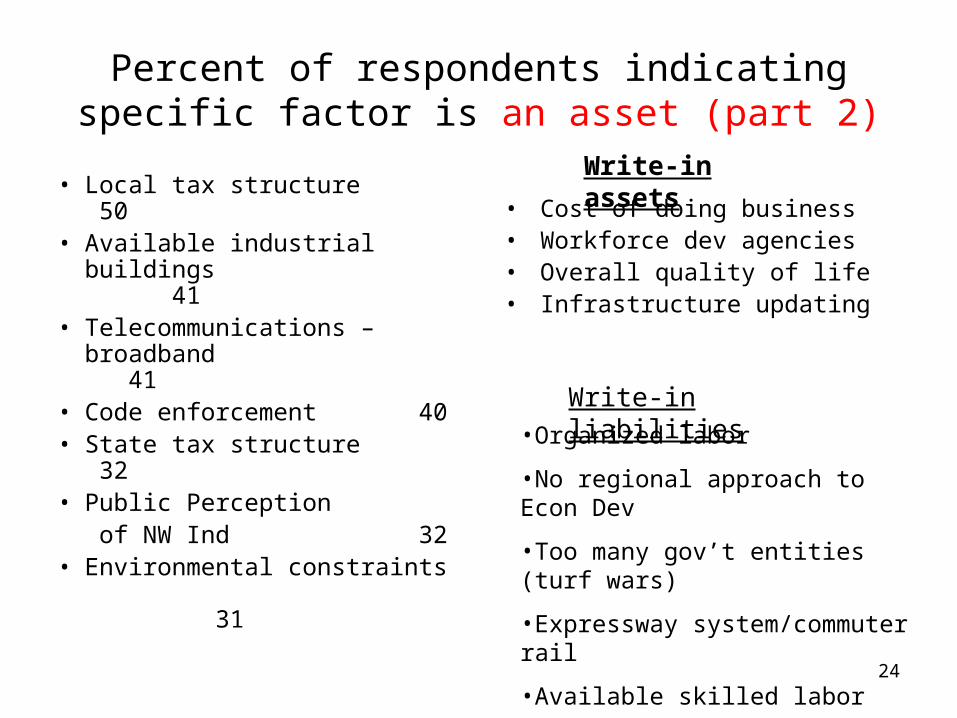
Percent of respondents indicating specific factor is an asset (part 2)
• Local tax structure 50• Available industrial
buildings 41• Telecommunications –
broadband 41• Code enforcement 40• State tax structure 32• Public Perception
of NW Ind 32
• Environmental constraints 31
• Cost of doing business• Workforce dev agencies• Overall quality of life• Infrastructure updating
Write-in assets
Write-in liabilities•Organized labor
•No regional approach to Econ Dev
•Too many gov’t entities (turf wars)
•Expressway system/commuter rail
•Available skilled labor
•No long range planning.
25
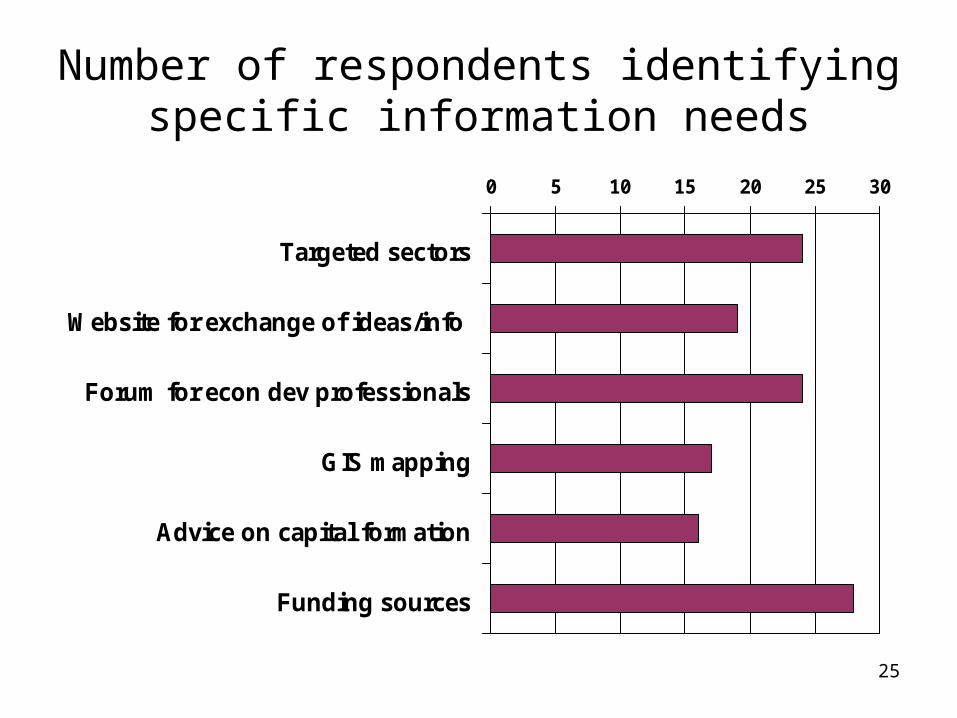
Number of respondents identifying specific information needs
0 5 10 15 20 25 30
Targeted sectors
Website for exchange of ideas/info
Forum for econ dev professionals
GIS mapping
Advice on capital formation
Funding sources

Northwest Indiana Interviews
Summary of responses from informal discussions with several economic
development leaders regarding obstacles to – and opportunities for – both localized and regional economic
development.
27
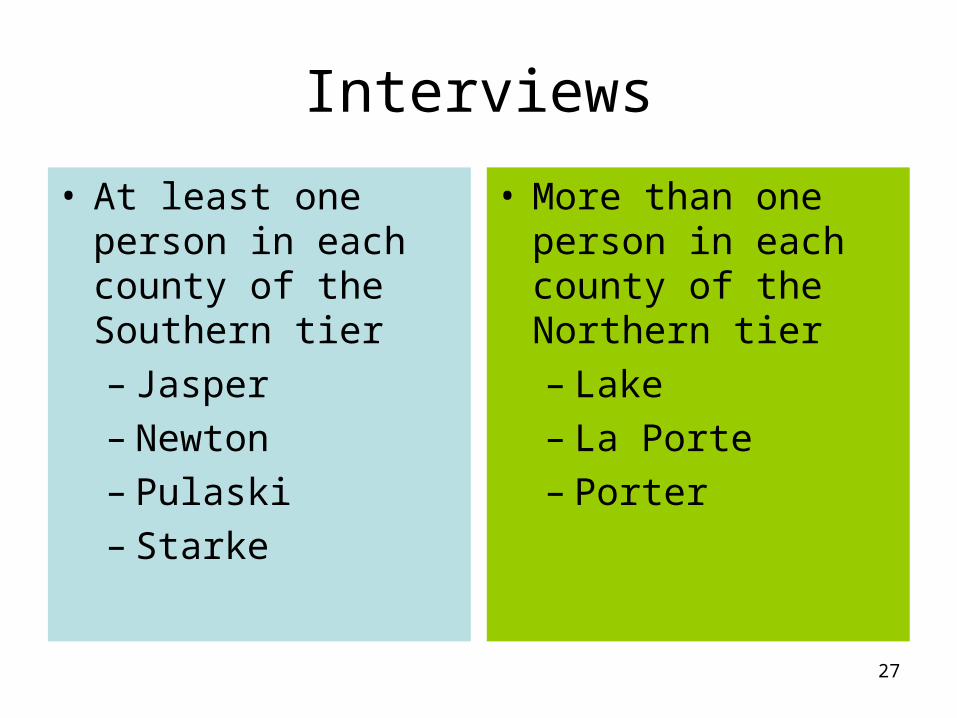
Interviews
• At least one person in each county of the Southern tier– Jasper– Newton– Pulaski– Starke
• More than one person in each county of the Northern tier– Lake– La Porte– Porter
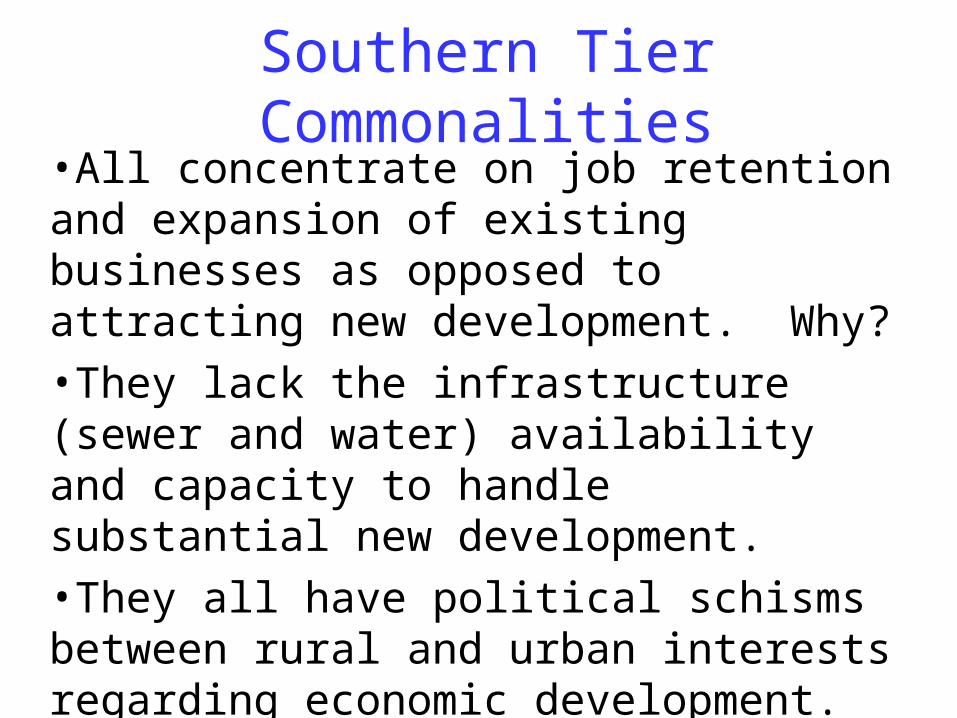
Southern Tier Commonalities•All concentrate on job retention and expansion of existing businesses as opposed to attracting new development. Why?
•They lack the infrastructure (sewer and water) availability and capacity to handle substantial new development.
•They all have political schisms between rural and urban interests regarding economic development.
Southern Tier Commonalities continued
•K-12 schools are “OK” but not particularly aggressive about advanced classes or educational innovation.•Absentee ownership means local managers have limited interest in community growth and leadership.•All see development of affordable housing as a necessity, but none do housing development themselves.•Being the only non-profit economic developer in their respective county they enjoy the advantage of concentrating on work at hand rather than dealing with competitive efforts within their areas.
30
Northern Tier Commonalities
•The Northern Tier non-profit developer spends about an equal amount of time on job retention and business expansion as on attracting new development.•Property tax uncertainties have hindered potential growth.•The relationship between non-profit economic development entities is generally good in spite of overlapping agendas.•There is considerable communication between them and a willingness to help one another when possible.•The casinos are viewed as a positive – they don’t have a negative image to those considering bringing business to the region and will ultimately bring business development in around them.
31
Northern Tier Commonalities continued
•Biggest problems in development:1. A deep resistance to change and2. Elected leaders with fragmented and hidden agendas.
•Biggest obstacles in attracting new businesses:1. The stigma of industrial pollution and2. The stigma of political corruption.
•There should be a comprehensive plan for Brownfield cleanup and redevelopment rather than the present “hit or miss” approach. State government needs a push.•Everybody is jealous of Porter County…when theyare not concentrating upon their own north-south or east-west local spats.

32
Suggestions for Facilitating Change
1. Create a dialogue with the building trades so they might better understand their role in economic development and the need - from time to time – to consider concessions.
2. It would be helpful if an independent entity (perhaps a combined effort by IU and Purdue?) would offer training for local elected officials in the areas of EDIT, tax abatement usage and priority budgeting.
3. It would be helpful if an independent entity would offer training for local elected officials on the concept of “student-servant leadership” – putting personal agendas aside and thinking about their responsibilities to their communities as a whole. (Getting them to attend might be a challenge!)