ECONOMIC DEVEL OPME NT DEP ARTME NT ANNUAL...
180
ANNUAL REPORT 2015 / 2016 ECONOMIC DEVELOPMENT DEPARTMENT
Transcript of ECONOMIC DEVEL OPME NT DEP ARTME NT ANNUAL...
ANNUAL REPORT2015 / 2016
E CO NO MI C D E V E LO PME NT D E PA RTME NT
RP294/2016ISBN: 978-0-621-44879-5
1Economic Development Department I ANNUAL REPORT 2015 / 2016
ANNUAL REPORT 2015/2016 FINANCIAL YEARECONOMIC DEVELOPMENT DEPARTMENT - VOTE NO: 25
Economic Development Department I ANNUAL REPORT 2015 / 20162
Part A: General Information 4
1. Department General Information....................................................................................................................62. List of Abbreviations/Acronyms......................................................................................................................73. 2015/16 Economy Highlights..........................................................................................................................8 4. EDD and Agency Highlights............................................................................................................................9 5. Foreword by the Minister................................................................................................................................106. Deputy Minister Statement...........................................................................................................................147. ReportoftheAccountingOfficer...................................................................................................................168. StatementofResponsibilityandConfirmationofAccuracyfortheAnnualReport.......................................229. Strategic Overview.......................................................................................................................................23 9.1. Vision...................................................................................................................................................23 9.2. Mission................................................................................................................................................23 9.3. Values..................................................................................................................................................2310. Legislative and Other Mandates...................................................................................................................2411. Organisational Structure...............................................................................................................................2512. Entities Reporting to the Minister..................................................................................................................26
Part B: Performance Information 37
1. Auditor-General’s Report: Predetermined Objectives...................................................................................382. Overview of Departmental Performance......................................................................................................38 2.1 Service Delivery Environment..............................................................................................................38 2.2 Service Delivery Improvement Plan (SDIP).........................................................................................38 2.3 Organisational Environment.................................................................................................................40 2.4 Key Policy Developments and Legislative Changes............................................................................413. Strategic Outcome Oriented Goals...............................................................................................................414. Performance Information by Programme.....................................................................................................42 4.1 Programme 1: Administration..............................................................................................................42 4.2 Programme 2: Growth Path and Social Dialogue................................................................................43 4.3 Programme 3: Investment, Competition and Trade.............................................................................475. Transfer Payments.......................................................................................................................................53
5.1. Transfer Payments To Public Entities..................................................................................................53 5.2. Transfer Payments To All Organisations Other Than Public Entities...................................................54
6. Conditional Grants........................................................................................................................................54 6.1. Conditional Grants and Earmarked Funds Paid...................................................................................54 6.2. Conditional Grants and Earmarked Funds Received...........................................................................547. Donor Funds.......................................................................................................................................................54 7.1. Donor Funds Received - Employment Creation Fund – European Union (EU)...................................548. Capital Investment........................................................................................................................................55 8.1. Capital Investment, Maintenance and Asset Management Plan .........................................................55
TABLE OF CONTENTS
Economic Development Department I ANNUAL REPORT 2015 / 2016 3
Part C: Governance 57
1. Introduction..................................................................................................................................................582. Risk Management........................................................................................................................................583. Fraud and Corruption...................................................................................................................................584. MinimisingConflictofInterest.......................................................................................................................585. Code of Conduct..........................................................................................................................................596. Health Safety and Environmental Issues.....................................................................................................597. Portfolio Committees....................................................................................................................................598. Scopa Resolutions.........................................................................................................................................599. PriorModificationstoAuditReports.............................................................................................................5910. Internal Control Unit......................................................................................................................................5911. Internal Audit and Audit Committees.............................................................................................................5912. Audit Committee Report...............................................................................................................................60
Part D: Human Resource Management 63
1. Introduction...................................................................................................................................................642. Overview of Human Resources....................................................................................................................643. Human Resources Oversight Statistics........................................................................................................64
Part E: Financial Information 93
1. Annual Financial Statements.............................................................................................................................96

Economic Development Department I ANNUAL REPORT 2015 / 20164
PART A – General Information

Economic Development Department I ANNUAL REPORT 2015 / 2016 5
PART A – General Information
PART AGeneral Information
Economic Development Department I ANNUAL REPORT 2015 / 20166
PART A – General Information
1. Department General Information
PRETORIA PHYSICAL ADDRESS: 3rd Floor, Block Athe dti Campus 77 Mentjies Street Sunnyside Pretoria 0002
POSTAL ADDRESS:Private Bag X149Pretoria 0001
TELEPHONE NUMBER/S:012 394 3747
FAX NUMBER: 012 394 0255
EMAIL ADDRESS: [email protected] WEBSITE ADDRESS: www.economic.gov.za
CAPE TOWN
PHYSICAL ADDRESS: 15th Floor 120 Plein Street Parliament Cape Town 8000
POSTAL ADDRESS: Private Bag X9047Cape Town 8000 TELEPHONE NUMBER/S: 021 466 9800/1
FAX NUMBER: 021 461 0428

Economic Development Department I ANNUAL REPORT 2015 / 2016 7
PART A – General Information
2. List of Abbreviations/Acronyms
AGSA Auditor-General of South AfricaAO AccountingOfficerB-BBEE Broad-Based Black Economic EmpowermentBrics Brazil, Russia, India, China and South AfricaCC Competition Commission CFO ChiefFinancialOfficerCT Competition Tribunal DFI Development Finance Institution EU European UnionHOD Head of DepartmentIDC Industrial Development CorporationITAC International Trade Administration Commission of South Africa Manco Management CommitteeMEC Member of Executive CouncilMPAT Management Performance Assessment Tool MTBPS Medium-Term Budget Policy StatementMTEF Medium-Term Expenditure FrameworkMTSF Medium-Term Strategic FrameworkNDP National Development Plan NGP New Growth Path PFMA Public Finance Management ActPICC Presidential Infrastructure Coordinating CommissionSBU Strategic Business Unit SCM Supply Chain ManagementSDIP Service Delivery Improvement PlanSMME Small, Medium and Micro Enterprises TR Treasury RegulationsUSA United States of AmericaWTO World Trade Organisation
Economic Development Department I ANNUAL REPORT 2015 / 20168
PART A – General Information
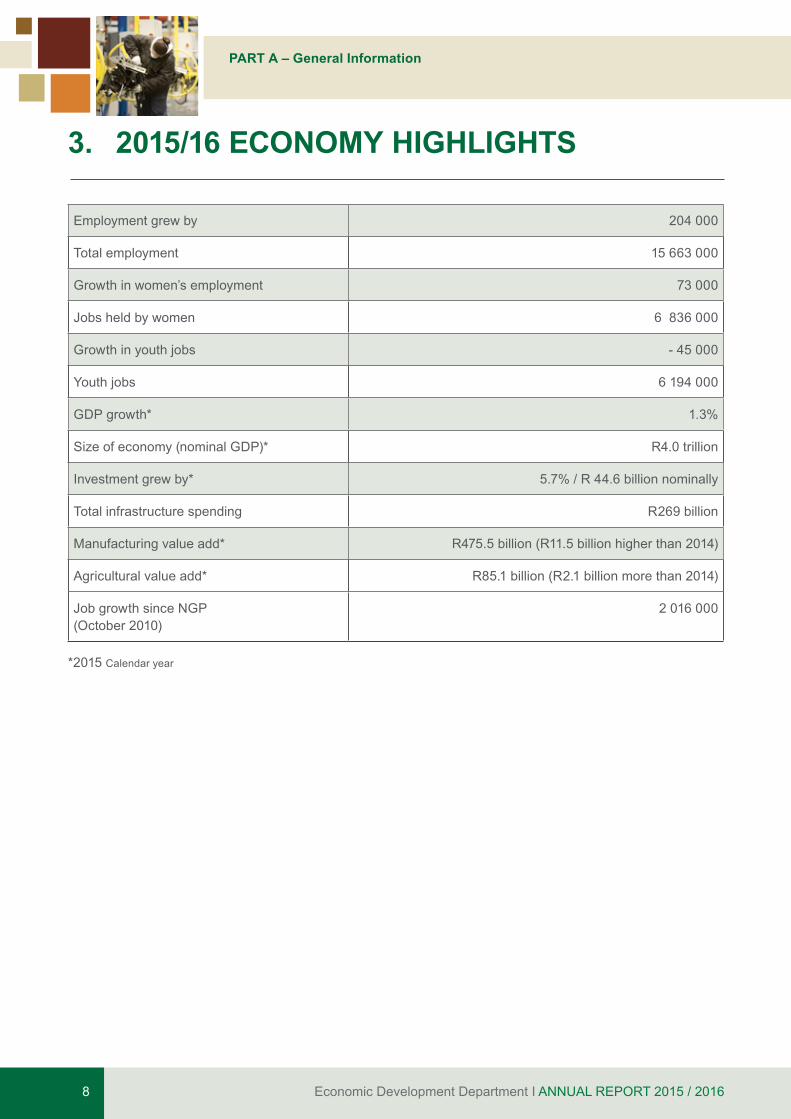
Employment grew by 204 000
Total employment 15 663 000
Growth in women’s employment 73 000
Jobs held by women 6 836 000
Growth in youth jobs - 45 000
Youth jobs 6 194 000
GDP growth* 1.3%
Size of economy (nominal GDP)* R4.0 trillion
Investment grew by* 5.7% / R 44.6 billion nominally
Total infrastructure spending R269 billion
Manufacturing value add* R475.5 billion (R11.5 billion higher than 2014)
Agricultural value add* R85.1 billion (R2.1 billion more than 2014)
Job growth since NGP (October 2010)
2 016 000
*2015 Calendar year
3. 2015/16 ECONOMY HIGHLIGHTS
Economic Development Department I ANNUAL REPORT 2015 / 2016 9
PART A – General Information
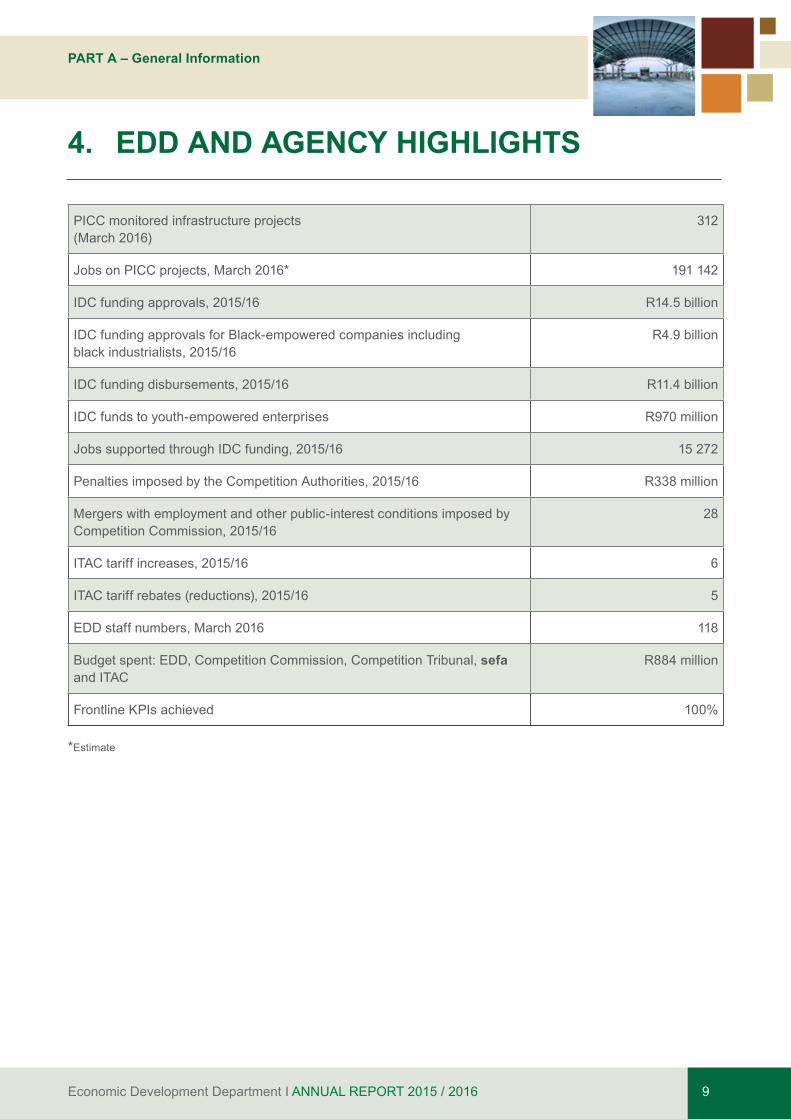
PICC monitored infrastructure projects (March 2016)
312
Jobs on PICC projects, March 2016* 191 142
IDC funding approvals, 2015/16 R14.5 billion
IDC funding approvals for Black-empowered companies including black industrialists, 2015/16
R4.9 billion
IDC funding disbursements, 2015/16 R11.4 billion
IDC funds to youth-empowered enterprises R970 million
Jobs supported through IDC funding, 2015/16 15 272
Penalties imposed by the Competition Authorities, 2015/16 R338 million
Mergers with employment and other public-interest conditions imposed by Competition Commission, 2015/16
28
ITAC tariff increases, 2015/16 6
ITAC tariff rebates (reductions), 2015/16 5
EDD staff numbers, March 2016 118
Budget spent: EDD, Competition Commission, Competition Tribunal, sefa and ITAC
R884 million
Frontline KPIs achieved 100%
*Estimate
4. EDD AND AGENCY HIGHLIGHTS
Economic Development Department I ANNUAL REPORT 2015 / 201610
PART A – General Information
5.1 OVERVIEW AND ECONOMIC PERFORMANCE
Global growth remained subdued in the period under review and South Africa’s own growth rates were below the levels required to achieve our national goals. Given these more challenging economic conditions, EDD worked with other parts of government and the private sector to seek to avoid a recession and to promote job creation.
ThisAnnualReport reflectsmore specifically on thework of the Department against its Annual Performance Plan submitted to parliament last year.
In this foreword I draw attention to the broader context and to developments after the period covered in the Report that are relevant to the work reported on herein.
The Department crafted an economic strategy in 2010 to recover jobs lost during the global economic downturn and to begin to place the economy on a more sustainable growth path. Since the adoption of the New Growth Path framework by Cabinet in October 2010,
to the end of this reporting period, roughly 2 million more people have found employment. During 2015, the country’sGDPreachedtheR4trillionmarkforthefirsttime.
However, our attempts to accelerate job creation have faced stronger headwinds in the last year and performance has slowed. In the 12 months to March 2016, 204 000 jobs were created, but the number of unemployed grew by 179 000 as a result of more people looking for work than the number of new jobs created. By March 2016, unemployment was 26.7% and the total number of employed was 15,6 million.
The economic strategy to address this was summed up in six i’s:
• Infrastructuredevelopment tobringenergy,water,transport logistics and ICT facilities on-stream
• Industrialisation to support and enhance theproductive sectors of the economy
• Investment promotion to increase the levels ofproductive assets
• Innovationeffortstoenablescienceandtechnologyto shape new products and services
• Inclusion to bring young people, women, blackindustrialists and small businesses into the economic mainstream and to enable growth through improving the lives of people
• IntegrationoftheeconomiesontheAfricancontinent.
In the past year and in the current period, more attention is needed on three i’s, namely
• Integrity in our economic dealings, covering theconduct of public officials, tender arrangementsand contract management – in short, acting against corruption as well as action against cartels and price-fixing;
• Institution-building, to ensure well-managed publicinstitutions and well-run state-owned companies and moredynamic,effectiveprivateenterprises;and
• Implementation, which includes better and fasterconverting policy-goals into delivery, particularly within the state.
5.2 COMPETITION AND TRADE REGULATION
The EDD is responsible for overseeing the competition authorities. Given South Africa’s highly concentrated
Mr. Ebrahim PatelMinister of Economic Development
5. FOREWORD BY THE MINISTER
Economic Development Department I ANNUAL REPORT 2015 / 2016 11
PART A – General Information
economy and a legacy of collusive practices, vigorous enforcement of competition policy is essential. More competition, combined with effective small business support and enhanced developmental financing, iscrucial to the job-creating industrialisation we need.
In the year under review, the authorities investigated cartels in a range of sectors, including steel, auto-components, glass products and in agriculture supply chains.
A recent World Bank study on competition in South Africa documented the damaging effects of cartel behaviour in the economy and noted that “in the case of four cartels in maize, wheat, poultry and pharmaceuticals – products which make up 15.6% of the consumption basket of the poorest 10 per cent – conservative estimates indicate that around 200 000 people stood to be lifted above the poverty line by tackling cartel overcharges”.
In advancing our work on combatting corruption, cartels and anti-competitive conduct, the EDD has been reviewing sections of the Competition Act. Changes were gazetted that now make it a criminal offence for directors or managers of a firm to collude withtheircompetitors tofixprices,dividemarketsamongthemselves or collude in tenders or to acquiesce in collusion. If found guilty of such behaviour, they expose themselves to the risk of up to 10 years in jail.
The Department focussed on a number of competition mattersduringthefinancialyear,someofwhichwerefinalisedshortlyaftertheendofthereportingperiod.Anumberoftheseresultedinsignificantcommitmentsfromcompanies on jobs, industrialisation and development.
In the acquisition of SABMiller by AB InBev, the engagements between AB InBev, the Ministry and the competition authorities set a new benchmark with respect to safeguarding South African jobs, guaranteeing total employment levels for a period offiveyearsandcommitting tonot retrenchworkersas a result of the merger. In addition, the company committed to spend an additional R1 billion to support the emergence of more than 800 new emerging farmers, create 2 600 new jobs and open fridge space to smaller competitors in company-owned cooling facilities in taverns.
In the case of the merger of three bottling operations for Coca-Cola to form the largest bottling company
in Africa, the EDD’s engagement with the parties contributed to commitments on employment and localisation of the purchase of production inputs as well as a new Fund to support emerging farmers. The company also agreed to open 10% of fridge-space in cooling units that it owns or sponsored at retail outlet level, to small bottlers. The Appletiser brand would continue to have strong South African links through equity and commitments to maintain local production.
The EDD oversees the International Trade Administration Commission (ITAC) which implements trade policy. Last year, South African exports and imports both totalled about R1 trillion. Exports make up 31% of our GDP, and imports are equivalent to 32% of our GDP. Given this context, the governance of trade is more important than ever.
The Ministry managed the appointment of six new commissioners and re-appointed three serving commissioners to form a new ITAC Commission in 2015.
One key challenge facing South Africa during the past year has been the effect of the global over-supply of steel production, on local companies. A careful balance has to be maintained between securing primary steel manufacturing capabilities in South Africa and avoiding ruinous price increases on downstream producers. As part of its support to the steel industry, ITAC processed 10 applications for tariff increases on primary steel within a very short time-period.
Other tariff investigations completed by ITAC, which resulted in tariff adjustments to give support to domestic producers, included increases on lead-acid batteries and polyurethane prepolymers. Rebates were also provided to lower the cost of inputs. For example, rebates were provided for certain components used in the manufacture of electricity meters, for panels used tomanufactureraisedflooringsystems,acrylicsheetused for plastic sanitary ware, and certain polyester fabrics used in making furniture.
During the period, I have issued a Trade Directive, setting out what factors ITAC must consider when evaluating tariff applications. We want to ensure that companies do not rely only on tariff amendments to weather storms – they need to invest, innovate, train workers, improve their productivity and grow their market share.
Economic Development Department I ANNUAL REPORT 2015 / 201612
PART A – General Information
5.3 INFRASTRUCTURE
Infrastructure has been a success story overall, providing new public assets, creating jobs and helping to keep the economy out of recession. The current infrastructure investment programme is the largest in South Africa’s history and on the African continent. We invested R1 billion per working day in infrastructure during the past year. This public investmenthasmadeasignificantimpactonprovidingcritical economic and social infrastructure for the country, from energy and roads to schools, clinics and student accommodation. The National Infrastructure Plan has 18 Strategic Integrated Projects (SIPs) that combines 100s of projects for better coordination and implementation and results in more than 200 000 direct jobs in the past year.
The Presidential Infrastructure Coordinating Commission (PICC) drives and coordinates the public infrastructure programme. I wish to point to a number of key achievements.
The first is the technical work on legislation to combat cable and metal theft from public infrastructure. The theft of copper cable and metal from infrastructure poses a risk to, amongst others, public safety, electricity supply, provision of water, communications and transportation and has a severe negative impact on the South African economy. The PICC successfully coordinated the technical work on the matters covered in the Criminal Matters Amendment Act (2015), which has stricter provisions for the granting of bail, and the sentencing of offenders (a minimum of 15 years). The law also creates a new offence that criminalises damage to, tampering with, and destruction of essential infrastructure.
The second is the work on fast-tracking build projects and addressing funding gaps.
The PICC Technical Unit worked with the Departments of Water and Sanitation (DWS) and Environmental Affairs (DEA) to facilitate the granting of various Strategic Integrated Projects (SIP) Water Use Licenses and Environmental Authorisations. Since April 2015 to date, 22 successful interventions were made.
In the current economic conditions, funding of catalytic projects has been constrained. The PICC successfully
engaged with the BRICS National Development Bank to enable funding for Eskom transmission lines to support the Independent Power Producers programme.
Work done by the PICC Technical Unit, which falls within the EDD, contributed to Cabinet approving a list of 20 priority projects in energy; water; highereducation and transport logistics.
These projects will be receiving the attention of the PICCinthenewfinancialyeartorealisejobcreation.
In the new economic context we must change pace, scale and how we work – ramp up infrastructure investment, unblock and fast-track projects, introduce innovative funding and build approaches and develop a new social compact and partnership.
5.4 INDUSTRIAL FUNDING AND INVESTMENT
Recognising the need to continue with counter-cyclical policies in order to stimulate the economy, the Department worked with the IDC to support the development of new industries and businesses. In the year under review, the IDC approved R14,5 billion new funding and disbursed R11,4 billion to partner companies. This funding has created and saved more than 15 000 jobs. It is also attracting further private sector capital into industries such as green energy, tourism, agro-processing, automotive components, and steel.
Theyearalsosawtwosignificantagreementssignedby the IDC: to co-finance construction of a newautomobile plant in South Africa and to set up a joint investment fund with a R10 billion pledge by the China Construction Bank.
The EDD has supported projects facing challenges as well as unblocked and promoted major investments.
Examples of these activities that were undertaken during the year include:
• A localnoodle factory that receivedgrant fundingto improve its competitiveness and now supplies Massmart
• AnewfilmstudiothatwassupportedinJohannesburg

Economic Development Department I ANNUAL REPORT 2015 / 2016 13
PART A – General Information
• Redrafting tender specifications in the NorthernCape to ensure they were aligned with local industrial capacity
• SupportingafruitcanningoperationintheWesternCape to obtain electricity during power shortages so thatitcouldfulfilexportordersandsave2000jobs.
5.5 SOCIAL DIALOGUE
Over the past number of years, EDD has facilitated national social accords which have forged partnerships in education, skills, the green economy, local procurement and youth employment. These accords came from the recognition that true development cannot be the result of merely technocratic solutions, but must harness the energy of social partners in an active democracy.
During the past year, we have supported efforts to achieve the goals of these accords as well as foster social dialogue on areas of national concern.
5.6 ORGANISATIONAL CONTEXT AND OUTCOMES
TheEDDhasfulfilledthe2015/16AnnualPerformancePlan’s targets – exceeding them in many instances. For the EDD, emphasis has been on the real impact that we have had on people’s lives. We have attempted, through the year, to become more of a problem-solving department than only generating policy-proposals.
One of the matters that will require more attention is the appropriate formulation of Annual Performance Plan (APP) targets. In the past, the APP’s of the Department were simple and easily measurable, but not necessarily of value as a target that measures outcomes. For example, in the previous APP, a number of KPI’s simply required a set number of meetings to be held.
In the current APP, we are pursuing a more outcome-based approach and spelling out the strategic goals of the activities.
The Auditor-General is concerned about measurability as well as the source information to be available.
Clearly, performance-auditing (as distinct from financial-auditing)isnewandwillrequireprotocolsto
be developed that balances effective target-setting with simplicity and measurability and the source information requirements should be well-defined so that theExecutive Authority, AGSA, Parliament and the South African public can see the extent of performance.
As part of the EDD’s commitment to efficiency,support for state institutions, and developing a smart management system, the EDD has drawn on partnerships with the University of Johannesburg, the University of the Witwatersrand and the IDC. We have also collaborated closely on projects with other departments, provincial governments, international universities and development organisations. This has allowed us to expand our access to technical expertise, support and research.
We are grateful for the support provided by other departments, agencies and partners.
5.7 CONCLUSION
TheEDDachievedanunqualifiedauditin2015/16,metand exceeded many of its Key Performance Indicators (KPIs). Our work has assisted to lay a foundation in building a more inclusive economy. However, given strong global headwinds, we must do more.
The work done in the period covered by this report was managed by Mr Kumaran Naidoo, who was the acting Director General. He passed away on 12 April 2016 and I wish to pay tribute to a person of integrity, a pillar of strength, andafineexampleofwhatapublicservantshouldbe.
I wish to thank the Deputy Minister who led our work at provincial and municipal level as well as the employees of the IDC, the Competition Commission and Tribunal and ITAC as well as the work of Acting DG Simpson in compiling this Report, and the efforts of staff of the Department.
___________Mr Ebrahim Patel, MP Minister of Economic Development 31 July 2016
Economic Development Department I ANNUAL REPORT 2015 / 201614
PART A – General Information
In 2015 South Africa managed to avoid the recession and achieved growth rate of 1.3% in the midst of serious global economic challenges. It is my firmbelief that as a country we will turn the tide if all of us (government, private sector, labour and civil society) put our shoulders to the wheel and support the government’s Nine Point Plan to reignite economic growth, and address blockages to employment and investment.
The 2014-2019 MTSF remains government’s programme for the first five-year building block of the NationalDevelopment Plan (NDP). Government’s Nine Point Plan supports MTSF outcomes and is a set of interventions in key strategic areas that must be implemented at a scale sufficienttoigniteeconomicgrowth.
The Nine Point Plan allows for the Economic Sectors Employment and Infrastructure Development (ESEID) Cluster to follow a coordinated approach through re-prioritisation to support increased economic growth and development in key economic sectors.
Ourworkforthepastfinancialyearinvolvedengagingprovinces around the Nine Point Plan to provide provinces with the necessary support to align and integrate the Plan into their key programmes. We are encouraged by the fact that vertical co-ordination of economic development has now gained traction and that, to an extent, its importance recognised by ESEID. Towards the end of the year the Cluster convened a workshop attended by the Cluster DGs and the provincial Heads of Departments for Economic Development, to ensure active involvement of all provinces in the implementation of the Nine Point Plan. Our work, in collaboration with the provinces of Limpopo, Mpumalanga and Free State, has moved beyond ensuring alignment of the provincial plans to national economic development goals and plans. We have worked on identifying provincial priorities including key value chains and sectors.
Other critical provincial work included discussion on integrated development funding for growth and job creation. A stakeholder working session with the Free State Department of Economic, Small Business Development, Tourism and Environmental Affairs, the Industrial Development Corporation (IDC), Small Enterprise Finance Agency (sefa) and the National Empowerment Fund (NEF) was held on the 29th of February 2016 in Bloemfontein.
This session exchanged views on the economic and industrial projects for possible support. It also provided a platform for the Development Finance Institutions (DFIs) to foster closer relations with the province and its people to be able to improve their footprints in the province.
The support provided by the Economic Development Department (EDD) to Mpumalanga Provincial Government Economic Cluster Departments in identifying priority projects and sectors that have a high impact on economic growth, poverty alleviation and job creation, has now been taken to municipal level. For example, EDD assisted with the planning and participation in the Nkangala District Municipality’s Investment Summit and ensured that targeted projects for investment were clear in terms of their economic impact (job creation, growth and poverty alleviation) and alignment between municipal plans as well as the Revitalisation of the Mining Towns Programme.
Mr. Madala MasukuDeputy Minister of Economic Development
6. DEPUTY MINISTER STATEMENT

Economic Development Department I ANNUAL REPORT 2015 / 2016 15
PART A – General Information
I personally headed an intervention in a strike torn eMalahleni municipality that resulted in a decision to revive the local economic forums in response to the challenges of unemployment and low economic activities in those communities. Efforts are being made to address challenges faced by the youth. Commissionstoaddressissuesofgoodgovernance;SMMEs, cooperatives and community development andempowerment; economic sector growth; aswellas infrastructure development and basic service delivery were set up to work on a continuous basis. The municipality is to now drive the processes assisted by both the province and the district municipality
Lessons learnt from eMalahleni Local Municipality were later used in the intervention in Ba-Phalaborwa municipality where the process resulted in the establishment of an all-inclusive Local Economic Development Forum and transparent procurement and supplier development by both FOSKOR and Phalaborwa Mining Company. The IDC invested in the rehabilitation of the smelting plant to increase capacity of the iron plant and other equipment and plant at the mining company.
In our engagement with provinces, we also included interaction with social partners and stakeholders. The indications are that the following still remain a big challenge: • Accesstofundingforsocialenterprises• Thereisaneedtoentrenchsocialentrepreneurship
as part of the curriculum in schools (primary and high school level)
• Skillsdevelopmentiskeyinbuildingandsustainingsocial enterprises
• Community engagement is critical in establishingstrong support and relations in driving social entrepreneurshipandcommunitybuy-in;and
• Leadership and excellence were emphasised asfundamental attributes in building successful and impactful social enterprises.
Going forward, we will support re-prioritisation of key catalytic projects by provinces as well as addressing blockages to growth, employment and investment. This will be through a structured partnership endorsed at the political level that will result in a harmonious coordinated approach for a set of interventions to achieve increased economic growth and development in key economic sectors.
Our focus in support of the Youth and National Skills Accords was on the introduction of a process in collaboration with the Department of Higher Education and Training (DHET), towards the establishment of an ideal TVET College targeting Mpumalanga. During the reporting period, Ehlanzeni TVET College hosted the 1st Symposium on Nurturing Public Private Partnerships attended by delegates from the public and private sectors. This has resulted in a process of drafting MOU’s with various companies starting with RCL foods. In the coming year we will continue to monitor this development.
We also worked in collaboration with other departments to unblock or facilitate locally initiated projects and programmes to help ensure their successful implementation. These include, for instance, working with the Department of Rural Development and Land Reform (DRDLR) to unblock challenges following their exit from the NARYSEC Youth Programme. EDD and DRDLR developed a proposal detailing initiatives to strengthen the programme. In Limpopo, two exhibitions were hosted by EDD in collaboration with the Department of Small Business Development (DSBD).
I would like to thank the Minister for his continued leadership and support afforded to me as well as to the Economic Development Department’s entire family. Thanks indeed to the staff of EDD and agencies for the efforts you have put around these achievements in thispastfinancialyear.
Lastly I would like to pay homage to the late Acting Director General Mr Kumaran Naidoo, who passed on the 12 April 2016. He was critical in the delivery of the departmental annual performance plan. Through his leadership, the Department managed to exceed its targetsfor2015/16financialyearandlaidgroundworkfor the 2016/17 departmental annual performance plan. As a result, his work will always be treasured and we will remain indebted to him.
-----------------------------------------Mr Madala Masuku, MPDeputy Minister of Economic Development31 July 2016
Economic Development Department I ANNUAL REPORT 2015 / 201616
PART A – General Information
Mr. Malcolm Simpson Accounting Officer
7. REPORT OF THE ACCOUNTING OFFICER
7.1 OVERVIEW OF DEPARTMENTAL PERFORMANCE
In the past year, the Economic Development Department (EDD) continued in fulfilling its coremandate in support of job creation, inclusive growth, industrialisation and social inclusion through policy development and facilitating major investments and unblocking. Support was provided to the alignment of
the state through integration and coordination between departments and spheres of government, as well as the provision of strategic direction on competition policy, trade administration matters and development financeinstitutions.
We are proud of the achievements that the Department has made. The Department has gone far toward its organisational development, and implementing key elements of economic and infrastructure development since its inception in 2009.
TheEDDhasconsistentlyachievedunqualifiedauditopinions, achieved its annual targets and spent almost its entire annual allocated budget. In the past year, the EDD strengthened its institutional capacity, corporate governance, reviewed policies and streamlined administrative systems.
In this reporting period, the EDD spent 99,8% of its allocated budget, and met its performance targets from the 23 indicators included in the Annual Performance Plan (APP). The total planned targets for the year under review were 164 and these were fully achieved. An additional 68 targets were delivered to complement and support the achievement of the indicators.
The nature of the economy is dynamic, subject to shocks and forever changing. Whilst it is not always possible to plan specific quantitative and detailedprojects upfront, it is possible to make broad allocations and agile plans that aptly respond to the dynamic and ever-changing economy.
7.
Performance against indicators 2015/16
KPI 1 2 3 4 5 6 7 8 9 10 11 12 13 14 15 16 17 18 19 20 21 22 23 Total
Target 1 1 5 2 2 2 8 3 60 8 4 30 4 2 10 3 4 5 1 2 2 2 3 164Achieved 1 1 5 10 3 4 9 4 72 22 8 30 4 8 16 3 6 8 2 2 4 3 7 232Exceeded 0 0 0 8 1 2 1 1 12 14 4 0 0 6 6 0 2 3 1 0 2 1 4 68
Economic Development Department I ANNUAL REPORT 2015 / 2016 17
PART A – General Information
7.2 ORGANISATIONAL DEVELOPMENT
Key to the success in delivering on the Department’s objectives has been ensuring appropriate human resource allocation. A continuous assessment of the Human Resources complement is necessary for an organisation’s service delivery. In this respect, the Department reviewed the cross-functional management model aimed at strengthening organisational capacity. The Department’s organisational structure had been approved by the Minister of Economic Development with the concurrence of the Minister of the Public Service and Administration in 2009 with core business branches having a total of 265 posts. The structure has been funded incrementally over the MTEF, reaching a total of 164 funded posts in FY2014/15. The EDD reduced the number of funded posts to 140 funded as at 31 March 2016. This was due to budget reprioritisation in the October 2015 Medium-Term Budget Policy Statement (MTBPS). During the year116ofthe140postswerefilledwithtwoadditionalpostscontractedadditionaltotheestablishment.TheEDDwillcontinuetorecruitappropriatespecialistskillstofulfilitsdevelopmentalmandate.
During 2015/16, the EDD drew on the strong expertise and research capabilities of the entities reporting to the Department. It will continue to work with Expert Advisory Panels and use Memoranda of Understanding (MOU) toattractspecialistskillsfromotheragenciesandtertiaryeducationinstitutionse.g.theCouncilforScientificandIndustrial Research (CSIR) and the University of the Witwatersrand.
In addition, the Department will continue to review its organisational structure and facilitate alignment between theapprovedstructureandthereportingmodel.Adrafthasbeenfinalisedandtheconsultationprocesshascommenced.
The EDD’s governance structures met regularly to ensure compliance with legislative prescripts. MPAT scores continue to be monitored and there has been improvement in the average score from 2.28 in 2014/15 to 2.55 in thisfinancialyear.TheEDDwillcontinuetousethistooltoimprovescoresinMPATcomponents.
7.3 DEVELOPMENT FINANCE INSTITUTIONS
Industrial Development Corporation (IDC)
TheIDCgeneratesthebulkofthefundingrequiredfor investmentthroughinternalprofitabilityandborrowingfunds. A portion of funding utilised for investment is funds managed on behalf of government departments such as the Economic Development Department (e.g. Agro-processing Competitiveness Scheme) and the Department of Trade and Industry (e.g. Manufacturing Competitiveness Enhancement Scheme, Clothing and Textiles Competitiveness Programme, etc).
In 2015/16, the IDC celebrated 75 years of existence with approvals of R14.5 billion. This brings IDC’s total approvalsoverthepastfiveyears(2011/12to2015/16)toR67billion.Thisfive-yearperiodofapprovalswas54%higherthantheR43billionapprovedinthepreviousfive-yearperiod(2006/07to2010/11).R11.4billionworthoffunds were disbursed in 2015/16. More details are provided in the body of this report.
7.4 COMPETITION AUTHORITIES
The Competition Commission (CC) held various hearings related to the Private Healthcare Market Inquiry (HMI) andLiquidPetroleumGasInquiry(LPG)andisabouttoenterthefinalphaseofeachoftheseinquiries.Italsolaunched the Grocery Retail Inquiry during 2015/16.
Economic Development Department I ANNUAL REPORT 2015 / 201618
PART A – General Information
BelowareafewhighlightsandexamplesoftheworkoftheCompetitionCommissioninthisfinancialyear:
Cases dealt with during 2015/16 include, inter alia:
Murray & Roberts paid a settlement of R64 million for collusive conduct in the construction industry.In the ‘Bread Cartel’, the Supreme Court of Appeal of South Africa upheld an appeal brought by PremierFoodsandfoundthattheTribunalcannotissueasection65certificateagainstPremier,which would have enabled the victims of the bread cartel to institute civil claims against Premier Foods for loss or damages suffered as a result of cartel conduct. However, the CC lodged an application for leave to appeal to the Constitutional Court.The Competition Appeal Court (CAC) found that Sasol was not guilty of abuse of dominance by charging excessive prices for propylene and polypropylene from 2004 to 2007. The Constitutional Court refused the CC’s application for leave to appeal.
The Competition Commission focussed on setting employment related merger conditions that led to firmscommitting to create 3 137 new jobs and to save 7 857 existing jobs. A total of 1 399 jobs were lost due to mergers during 2015/16. The net number of jobs created and saved was 9 595.
TheCompetitionTribunaldecidedonthelargestnumberofmergersinonefinancialyearsinceitsinceptionin1999. It cleared a total of 124 large mergers and imposed employment conditions on 19 of these mergers.
TheCompetitionTribunalfurtherimposedfinesofR338million.
Cases decided on include :
Media 24 was found to have engaged in predatory pricing in the community newspaper market againstasmallerrival.ThisisthefirsttimesuchafindingwasmadeinthehistoryoftheCompetition Act.The Telkom/BCX transaction was conditionally approved by the Competition Tribunal. The merger between Pioneer Foods and Futurelife Health Products was approved subject to conditions to ensure that the joint venture is managed by Futurelife founder and Chief Executive Officer.Foodsbusinesswhodealwithcompetingproductsbepreventedandthattheinvestmentin the Pro-Nutro brand is maintained for two years after the merger.The objections raised by the Ministers of Economic Development, and Telecommunications and PostalServicesintheproposedVodacom/NeotelmergerresultedinVodacomfirstofferinganew deal to its competitors and later withdrawing the transaction and the attempted acquisition of Neotel.
Lastly, the EDD and the Competition Authorities successfully co-hosted the BRICS International Competition Conference on 12 and 13 November 2015 at the International Convention Centre (ICC) in Durban. The conference discussed, amongst others, the input provided by the Minister on public interest on competition policy and its implications for employment and competition for developing countries after mergers.
7.5 TRADE REGULATIONS
The International Trade Administration Commission of South Africa (ITAC) amended a number of trade regulations and conducted a number of tariff investigations in the period under review. These were intended to promote economic development and imporove regulation in the administration of import and export control. The EDD continued to do oversight of ITAC’s work in relation to its implementation of the International Trade Administration (ITA) Act. During the year, ITAC undertook a number of investigations in relation to tariffs as well as trade remedies. These are reported in more detail later in this Annual Report.
Economic Development Department I ANNUAL REPORT 2015 / 2016 19
PART A – General Information
7.6 EDD BUDGET
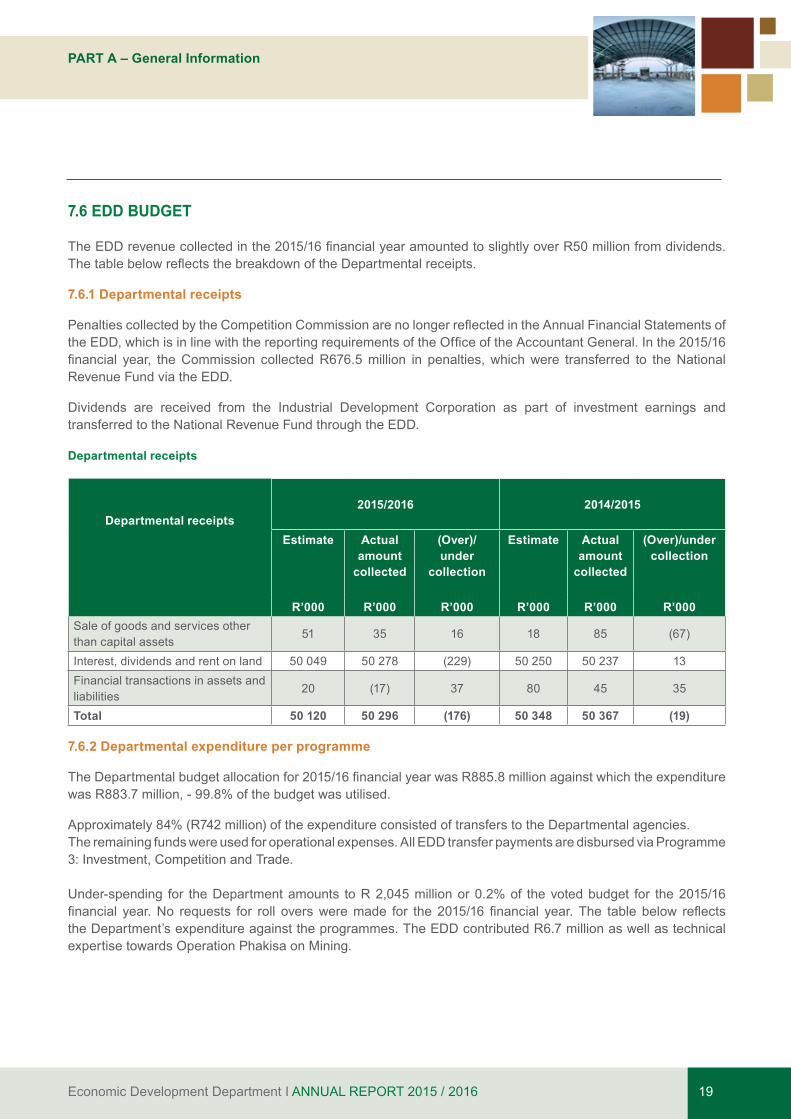
TheEDDrevenuecollectedinthe2015/16financialyearamountedtoslightlyoverR50millionfromdividends.ThetablebelowreflectsthebreakdownoftheDepartmentalreceipts.
7.6.1 Departmental receipts
PenaltiescollectedbytheCompetitionCommissionarenolongerreflectedintheAnnualFinancialStatementsoftheEDD,whichisinlinewiththereportingrequirementsoftheOfficeoftheAccountantGeneral.Inthe2015/16financial year, theCommission collectedR676.5million in penalties,whichwere transferred to theNationalRevenue Fund via the EDD.
Dividends are received from the Industrial Development Corporation as part of investment earnings and transferred to the National Revenue Fund through the EDD.
Departmental receipts
Departmental receipts2015/2016 2014/2015
Estimate Actualamount
collected
(Over)/ under
collection
Estimate Actualamount
collected
(Over)/under collection
R’000 R’000 R’000 R’000 R’000 R’000Sale of goods and services other than capital assets
51 35 16 18 85 (67)
Interest, dividends and rent on land 50 049 50 278 (229) 50 250 50 237 13Financial transactions in assets and liabilities
20 (17) 37 80 45 35
Total 50 120 50 296 (176) 50 348 50 367 (19)
7.6.2 Departmental expenditure per programme
TheDepartmentalbudgetallocationfor2015/16financialyearwasR885.8millionagainstwhichtheexpenditurewas R883.7 million, - 99.8% of the budget was utilised.
Approximately 84% (R742 million) of the expenditure consisted of transfers to the Departmental agencies. The remaining funds were used for operational expenses. All EDD transfer payments are disbursed via Programme 3: Investment, Competition and Trade.
Under-spending for the Department amounts to R 2,045 million or 0.2% of the voted budget for the 2015/16 financial year.No requests for roll oversweremade for the2015/16 financial year. The table below reflectsthe Department’s expenditure against the programmes. The EDD contributed R6.7 million as well as technical expertise towards Operation Phakisa on Mining.
Economic Development Department I ANNUAL REPORT 2015 / 201620
PART A – General Information
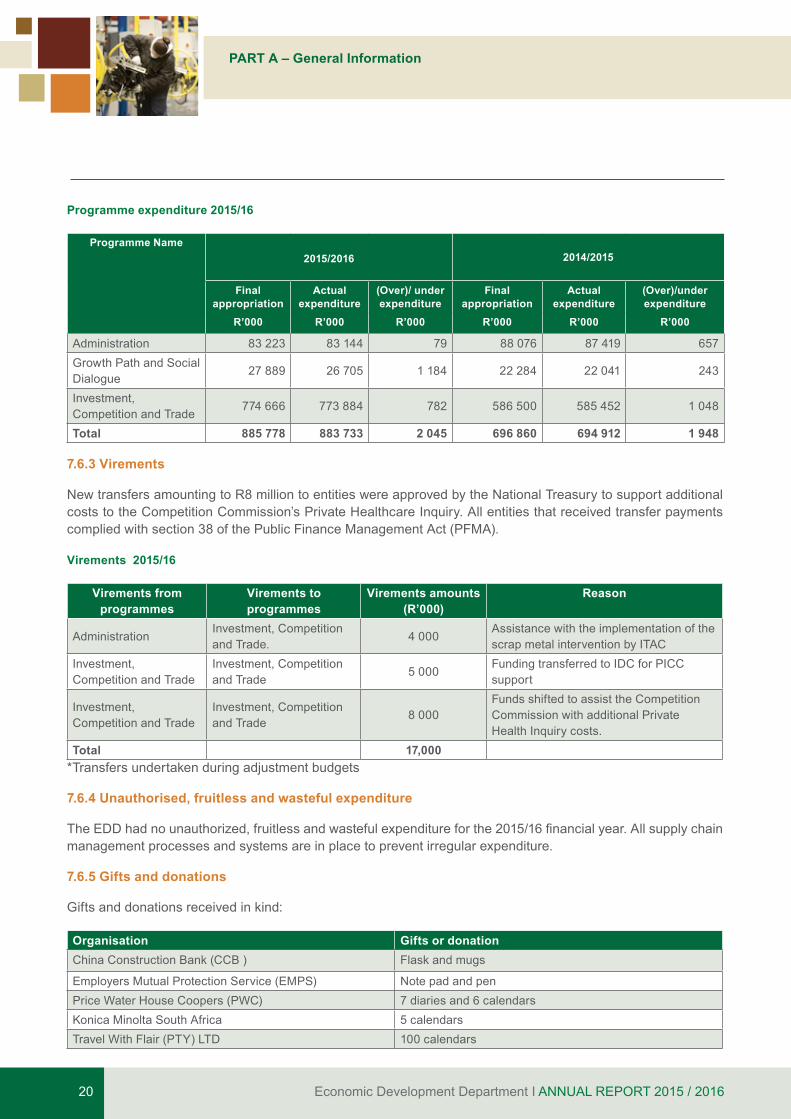
Programme expenditure 2015/16
Programme Name2015/2016 2014/2015
Final appropriation
Actual expenditure
(Over)/ under expenditure
Final appropriation
Actual expenditure
(Over)/under expenditure
R’000 R’000 R’000 R’000 R’000 R’000
Administration 83 223 83 144 79 88 076 87 419 657Growth Path and Social Dialogue
27 889 26 705 1 184 22 284 22 041 243
Investment, Competition and Trade
774 666 773 884 782 586 500 585 452 1 048
Total 885 778 883 733 2 045 696 860 694 912 1 948
7.6.3 Virements
New transfers amounting to R8 million to entities were approved by the National Treasury to support additional costs to the Competition Commission’s Private Healthcare Inquiry. All entities that received transfer payments complied with section 38 of the Public Finance Management Act (PFMA).
Virements 2015/16
Virements from programmes
Virements to programmes
Virements amounts (R’000)
Reason
AdministrationInvestment, Competition and Trade.
4 000Assistance with the implementation of the scrap metal intervention by ITAC
Investment, Competition and Trade
Investment, Competition and Trade
5 000Funding transferred to IDC for PICC support
Investment, Competition and Trade
Investment, Competition and Trade
8 000Funds shifted to assist the Competition Commission with additional Private Health Inquiry costs.
Total 17,000*Transfers undertaken during adjustment budgets
7.6.4 Unauthorised, fruitless and wasteful expenditure
TheEDDhadnounauthorized,fruitlessandwastefulexpenditureforthe2015/16financialyear.Allsupplychainmanagement processes and systems are in place to prevent irregular expenditure.
7.6.5 Gifts and donations
Gifts and donations received in kind:
Organisation Gifts or donation China Construction Bank (CCB ) Flask and mugs
Employers Mutual Protection Service (EMPS) Note pad and penPrice Water House Coopers (PWC) 7 diaries and 6 calendarsKonica Minolta South Africa 5 calendars Travel With Flair (PTY) LTD 100 calendars
Economic Development Department I ANNUAL REPORT 2015 / 2016 21
PART A – General Information
7.6.6 Exemptions and deviations received from the National Treasury
No exemptions were requested and/or approved for the Department in terms of the Public Finance Management Act (PFMA) and Treasury Regulations.
7.6.7 Events after the reporting date
No events took place after the reporting date of 31 March2016thatwouldimpactonthefinancialpositionof the EDD.
7.7 FUTURE PLANS
TheEDDwillfocusonfillingtheremainingmanagerial,andspecialistpositionsasapriorityandfillingexecutivelevel posts.
7.8 CONCLUSION
The Minister, Deputy Minister, entities reporting to the Ministry, Strategic Integrated Projects (SIPs) coordinators, Cluster members and all the staff of the EDD are acknowledged for their continuous and dedicated commitment and collaboration.
Lastly, I must take this opportunity to also thank my predecessor, the late acting Director-General, Mr Kumaran Naidoo, for having played a crucial role in leading the Department this past year and setting up systems that will continue to strengthen the Department.
_________________Mr Malcolm Simpson AccountingOfficer31 July 2016
Economic Development Department I ANNUAL REPORT 2015 / 201622
PART A – General Information
Tothebestofmyknowledgeandbelief,Iconfirmthefollowing:
All information and amounts disclosed throughout the Annual Report are consistent.
The Annual Report is complete, accurate and is free from any omissions.
The Annual Report has been prepared in accordance with the guidelines on the Annual Report as issued by National Treasury.
TheAnnualFinancialStatements(PartE)havebeenpreparedinaccordancewiththemodifiedcashstandardand the relevant frameworks and guidelines issued by the National Treasury.
The Accounting Officer is responsible for the preparation of the Annual Financial Statements and for thejudgments made in this information.
TheAccountingOfficerisresponsibleforestablishing,andimplementingasystemofinternalcontrolthathasbeen designed to provide reasonable assurance as to the integrity and reliability of the Performance Information, the Human Resources Information and the Annual Financial Statements.
The external auditors are engaged to express an independent opinion on the Annual Financial Statements.
In my opinion, the Annual Report fairly reflects the operations, the Performance Information, the HumanResourcesInformationandthefinancialaffairsoftheDepartmentforthefinancialyearended31March2016.
Yours faithfully
___________________ Mr Malcolm Simpson AccountingOfficer31 July 2016
8. STATEMENT OF RESPONSIBILITY AND CONFIRMATION OF ACCURACY FOR THE ANNUAL REPORT
Economic Development Department I ANNUAL REPORT 2015 / 2016 23
PART A – General Information
9.1 VISION
Creating decent work for all through meaningful economic transformation and inclusive growth.
9.2 MISSION
The Economic Development Department (EDD) aims to:• Co-ordinate the contributions of government
departments, state entities and civil society to effect economic development
• Improve alignment between economic policies,plans of the state, its agencies, government’s political and economic objectives and mandate;and
• Promotegovernment’sgoalofadvancingeconomicdevelopment via the creation of decent work opportunities.
9.3 VALUES
The EDD promotes the Constitution, with special reference to the chapters on human rights, cooperative governance and public administration, including these key basic values and principles governing public administration as set out in section 195(1).
EDD upholds the following values:• Promotionofdecentworkforallcitizens(opportunity
to work and quality of employment)• Socialpartnershipanddialogue• Equityanddevelopmentand• Sustainability(environment,socialandeconomic).
9. STRATEGIC OVERVIEW

Economic Development Department I ANNUAL REPORT 2015 / 201624
PART A – General Information
10. LEGISLATIVE AND OTHER MANDATES
The EDD was established in 2009 when the state conducted a macro-reorganisation of state institutions under Schedule 1 of the Public Service Act of 1994 (as amended by the Public Service Amendment Act 30 of 2007). It acts in accordance with the following legislations, government policies and strategies, and social accords.
The EDD administers the following legislation:• TheIndustrialDevelopmentCorporationAct,1940,
(Act No. 22 of 1940)• TheCompetitionAct,1998,(ActNo.89of1998)• The Competition Amendment Act, 2009, promul-
gated 1 April 2013 (Act No. 1 of 2009) • The International Trade Administration Act, 2002,
(Act No. 71 of 2002)• From2014,theEDDalsohadresponsibilitiesunder
the Infrastructure Development Act No. 23 of 2014.
The following policy frameworks guide the Annual Performance Plan of the Department:• StateoftheNationAddress• NationalDevelopmentPlan• NewGrowthPath• NationalInfrastructurePlan• IndustrialPolicyActionPlan• AgriculturePolicyActionPlan• Medium-TermStrategicFramework2014-2019• Delivery Agreement on Outcome 4: Decent
employment through inclusive economic growth• Delivery Agreement on Outcome 5: Skilled and
capable workforce to support inclusive growth
• Delivery Agreement on Outcome 6: Efficient,competitive and responsive infrastructure
• Delivery Agreement on Outcome 7: Vibrant,equitable, sustainable rural communities, and
• Framework for South Africa’s Response to theInternational Economic Crisis (2010).
Accords that the Department facilitated and monitors:• BasicEducationAccord• NationalSkillsAccord• LocalProcurementAccord• GreenEconomyAccord• October2012SocialAccord,and• YouthEmploymentAccord.
The EDD participates in, supports or convenes the following coordinating structures:• TheEDDcoordinates,integratesandprovides
technical support, monitoring and evaluation functions, secretariat services and inter-governmental coordination to the PICC
• TheEDD,togetherwiththe dti, convenes the MinMec/Technical MinMec with provincial Members of the Executive Council (MECs) and economic development departments
• TheEDDsupportsthe dti in its convening of the Outcome 4, Technical Implementation Forum
• TheEDDisamemberoftheEconomicSectors,Employment and Infrastructure Development Cluster.
Economic Development Department I ANNUAL REPORT 2015 / 2016 25
PART A – General Information
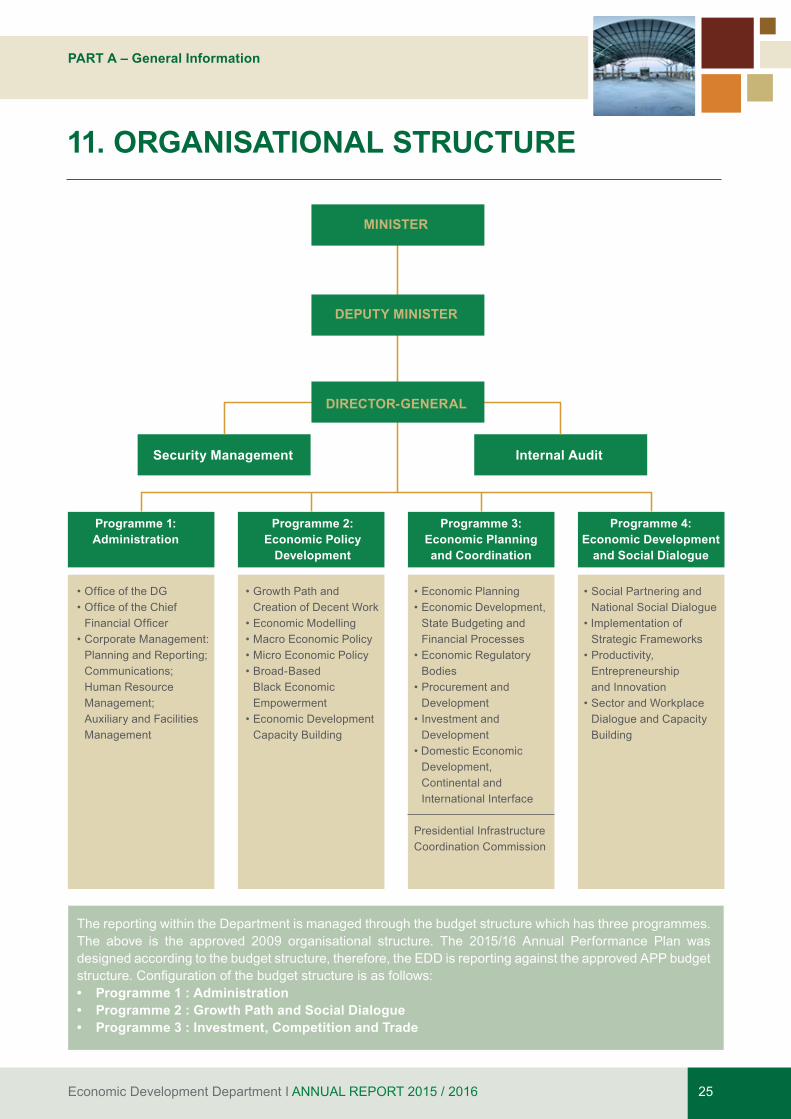
11. ORGANISATIONAL STRUCTURE
MINISTER
DEPUTY MINISTER
DIRECTOR-GENERAL
•OfficeoftheDG•OfficeoftheChief FinancialOfficer•CorporateManagement: PlanningandReporting; Communications; Human Resource Management;
Auxiliary and Facilities Management
•GrowthPathandCreation of Decent Work
•EconomicModelling•MacroEconomicPolicy•MicroEconomicPolicy•Broad-Based Black Economic Empowerment•EconomicDevelopment
Capacity Building
•EconomicPlanning•EconomicDevelopment, State Budgeting and
Financial Processes•EconomicRegulatory
Bodies•Procurementand
Development•Investmentand
Development•DomesticEconomic
Development, Continental and International Interface
Presidential InfrastructureCoordination Commission
•SocialPartneringandNational Social Dialogue
•ImplementationofStrategic Frameworks
•Productivity, Entrepreneurship and Innovation•SectorandWorkplace Dialogue and Capacity
Building
Programme 1: Administration
Programme 2: Economic Policy
Development
Programme 3: Economic Planningand Coordination
Programme 4: Economic Development
and Social Dialogue
Internal Audit
The reporting within the Department is managed through the budget structure which has three programmes. The above is the approved 2009 organisational structure. The 2015/16 Annual Performance Plan was designed according to the budget structure, therefore, the EDD is reporting against the approved APP budget structure.Configurationofthebudgetstructureisasfollows:• Programme 1 : Administration• Programme 2 : Growth Path and Social Dialogue • Programme 3 : Investment, Competition and Trade
Security Management
Economic Development Department I ANNUAL REPORT 2015 / 201626
PART A – General Information
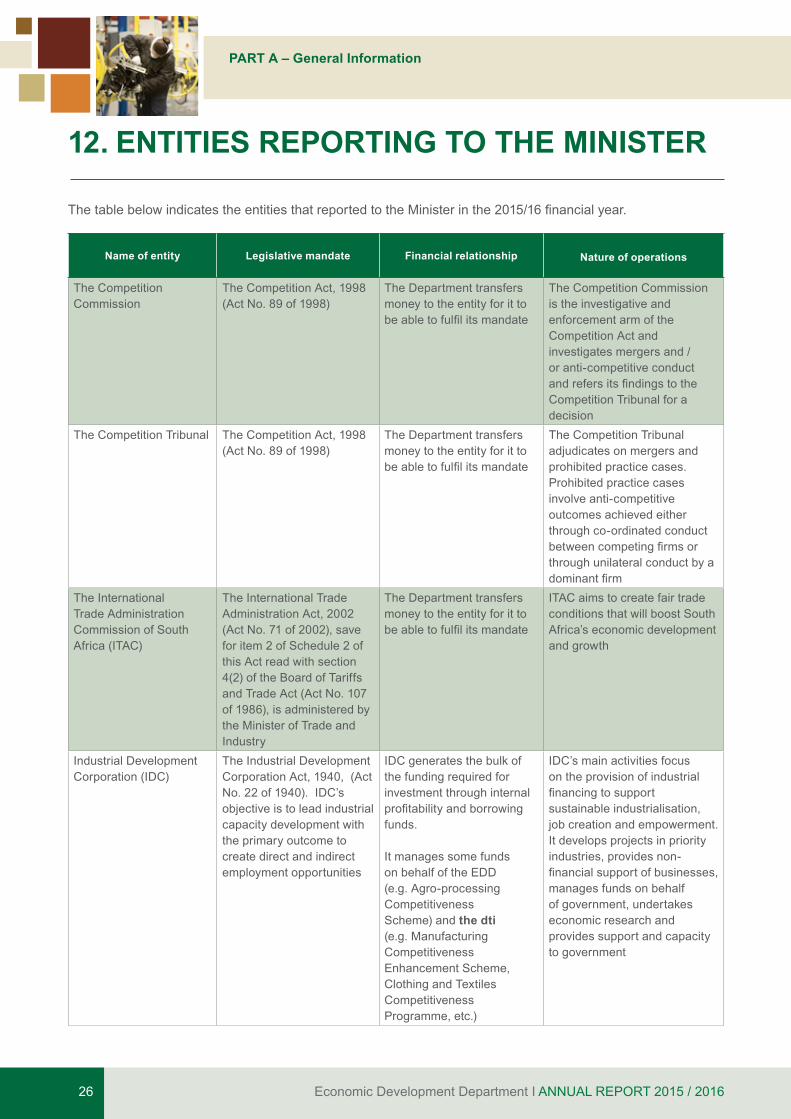
12. ENTITIES REPORTING TO THE MINISTER
ThetablebelowindicatestheentitiesthatreportedtotheMinisterinthe2015/16financialyear.
Name of entity Legislative mandate Financial relationship Nature of operations
The Competition Commission
The Competition Act, 1998 (Act No. 89 of 1998)
The Department transfers money to the entity for it to beabletofulfilitsmandate
The Competition Commission is the investigative and enforcement arm of the Competition Act and investigates mergers and / or anti-competitive conduct andrefersitsfindingstotheCompetition Tribunal for a decision
The Competition Tribunal The Competition Act, 1998 (Act No. 89 of 1998)
The Department transfers money to the entity for it to beabletofulfilitsmandate
The Competition Tribunal adjudicates on mergers and prohibited practice cases. Prohibited practice cases involve anti-competitive outcomes achieved either through co-ordinated conduct betweencompetingfirmsorthrough unilateral conduct by a dominantfirm
The International Trade Administration Commission of South Africa (ITAC)
The International Trade Administration Act, 2002 (Act No. 71 of 2002), save for item 2 of Schedule 2 of this Act read with section 4(2) of the Board of Tariffs and Trade Act (Act No. 107 of 1986), is administered by the Minister of Trade and Industry
The Department transfers money to the entity for it to beabletofulfilitsmandate
ITAC aims to create fair trade conditions that will boost South Africa’s economic development and growth
Industrial Development Corporation (IDC)
The Industrial Development Corporation Act, 1940, (Act No. 22 of 1940). IDC’s objective is to lead industrial capacity development with the primary outcome to create direct and indirect employment opportunities
IDC generates the bulk of the funding required for investment through internal profitabilityandborrowingfunds.
It manages some funds on behalf of the EDD (e.g. Agro-processing Competitiveness Scheme) and the dti (e.g. Manufacturing Competitiveness Enhancement Scheme, Clothing and Textiles Competitiveness Programme, etc.)
IDC’s main activities focus on the provision of industrial financingtosupportsustainable industrialisation, job creation and empowerment. It develops projects in priority industries, provides non-financialsupportofbusinesses,manages funds on behalf of government, undertakes economic research and provides support and capacity to government
Economic Development Department I ANNUAL REPORT 2015 / 2016 27
PART A – General Information
12.1 HIGHLIGHTS OF AGENCY PERFORMANCE IN 2015/16
Competition Commission
The EDD provides strategic direction to the competition authorities’ efforts to break up cartels and guide competition and merger cases to encourage job creation and development. Through the year under review, the EDD’s engagements with the Competition Commission and Competition Tribunal, and the work of thecompetitionauthoritieshaveresultedinsignificantadvances in relation to economic development. Highlightsarebrieflysetoutbelow.
Public interest issues
South Africa’s Competition Act provides that, in the case of a merger, the competition authorities have to evaluate both the impact of a proposed merger on competition as well as its social impacts. Social impacts include the impact of a proposed merger on employment, the region or industry, SMMEs and B-BBEE. Where the competitionauthoritiesfindtherewillbenegativesocialimpacts, they may take a number of actions, including prohibiting the merger; or imposing conditions toremedy the impact. For example, the competition authorities may set a condition that the merged entity may not retrench for three years, following the merger.
Inthe2015/16financialyear,theCompetitionCommissionimposed employment related merger conditions resulted in the saving of 7 857 existing jobs and the creation of 3 137 new jobs. However, 1 399 jobs were lost in mergers reviewed during this period. The new impact on jobs as a result of the Commissions interventions in mergers was thus a positive net effect of 6 458.
Abuse of dominance
The Competition Act does not prohibit a firm fromholding a dominant position. However, the Act does prohibitafirmfromabusingitsdominantpositioninamarket. Such behaviour may include excessive pricing, denying competitors access to an essential facility, unjustifiably charging customers different prices forgoods or services or other exclusionary acts.
Media 24 had created a brand, named ‘Forum’, to drive a competitor out of the market of community
newspapers. The Competition Commission challenged Media 24’s abuse of its dominant position and its predatory pricing practices. The Competition Tribunal found that Media 24 had engaged in predatory pricing by significantly lowering its advertising prices whichresulted in reduced competition in the market and the exclusion of a competitor. In addition, advertisers had fewer lost the choice of an alternative newspaper.
Market inquiries
Conclusion of the Private Healthcare and Liquid Petroleum Gas Market Inquiries and launch of the Grocery Retail Inquiry
The Minister of Economic Development introduced changes to the Competition Act, (which were promulgated in April 2013), relating to the introduction of market inquiries. These changes allow the Commission to undertake “a formal inquiry in respect of the general state of competition in a market for particular goods or services, without necessarily referring to the conduct oractivitiesofanyparticularfirm.”(Chapter4A,43A)
The Commission is in the process of conducting three marketinquiries–havingfinalisedthebankinginquiry.The Commission initiated a market inquiry into the Liquid Petroleum Gas (LPG) sector in September 2014, because it believed there were features that were preventing, distorting or restricting competition. It is currentlyinthefinalphaseofitsinquiryinconcludingindustry stakeholder consultations on its preliminary findings.Findingsatthisstageincludetheviewsthatstructural impediments to competition may hinder the growth of the LPG industry and that bottlenecks in the regulatory environment restrict the ability of potential competitorstoenterand/orexpand.Thefinalreportisduetowardstheendofthe2016/17financialyearandwill make recommendations to address the challenges in this important energy market.
On 31 May 2014, the Commission established an inquiry into the healthcare sector, publishing a statement of issues and administrative guidelines for public comment, in order to ‘implement measures to increase market transparency’ and to ‘advise and receive advice from any regulatory authority’ (Section 21 of the Competition [Amendment] Act). The Commission initiated an inquiry into the healthcare sector as it had reason to believe that there are features that prevent, distort or restrict competition.
Economic Development Department I ANNUAL REPORT 2015 / 201628
PART A – General Information
TheCommission isabout toenter thefinalphaseofthe Health Market Inquiry. By the end of the 2015/16 financialyeartheHealthMarketInquiryhadreceiveddata from some 144 stakeholders and held in excess of 100 separate stakeholder engagements. The first rounds of public hearings were held in Pretoriaand Cape Town in February and March 2016, with representations from various stakeholders, including the Minister of Health, Dr Aaron Motsoaledi, the World Health Organisation (WHO) and other civil society groupings. Initial information suggests that South Africa’s private healthcare expenditure is comparatively highandthatprivatehealthcareinflationishigherthangeneral inflation. TheCommissionwill complete thepublic hearings consultations across the country, and is expected to conclude the inquiry by the revised date of 15 December 2016.
Lastly, the Commission initiated a market inquiry into the retail grocery sector on 27 November 2015. The Grocery Retail Market Inquiry will explore several market dynamics, including:
• Theimpactoftheexpansion,diversificationandconsolidation of national supermarket chains on small and independent retailers
• The impact of long term exclusive leases on competition in the sector
• The dynamics of competition between local and foreign owned small and independent retailers
• The impact of regulations on small and independent retailers
• The impact of buyer groups on small and independent retailers, and
• Theimpactofcertainidentifiedvaluechainsonthe operations of small and independent retailers.
The terms of reference cover important market features which have an impact on South African small business and consumers, particularly the poor.
BRICS International Competition Conference
The EDD and Competition Commission co-hosted the BRICS International Competition Conference, on 12 and 13 November 2015 at the International Convention Centre (ICC) in Durban. Themed “Competition and InclusiveGrowth”,itwasthefirstmajorconferencethatglobally placed employment at the heart of competition policy. It showcased the South African Competition Act.
The Ministry provided a policy framework for public interest in competition policy, drawing on local examples. It set out the argument for competition policies that are grounded in realities of developing countries, moving away from simply applying policy frameworks that emerged in Europe and United States. This led to a discussiononthespecificchallengesfacedintheglobalsouth. The forum brought together 508 delegates from competition agencies, practitioners and stakeholders from BRICS and other African Countries, as well as bilateral engagements with competition practitioners and experts and delegates from the European Union (EU) and United States of America (USA).
AFGRI
The EDD had made submissions to the Competition Commission / Tribunal on public interest in the merger between AgriGroupe Holdings (Pty) Ltd and AFGRI Ltd in 2014. As a result of the EDDs submissions and engagement with the parties an agreement was reached and proposed to the Competition Commission, and subsequently made an order by the Competition Tribunal.
The EDD’s engagement resulted in an agreement that boosted development funding for agriculture and emerging farmer development as well as lowered the cost of storage facilities for emerging farmers. The specific provisions set up a R60 million emergingfarmer development program, set aside an additional R30 million on other development projects, established a R120 million loan facility at the Land Bank for farmers and lastly, provided for a 40% storage discount for emerging farmers storing less than 10 tons. A finalcommitment made by AFGRI was that no retrenchments would be undertaken by the newly merged entity as a result of the merger.
The EDD has monitored the implementation of these imposed conditions post the merger, together with the dti, the Department of Agriculture, Forestry and Fisheries (DAFF) and the Department of Rural Development and Land Affairs (DRDLR). Since the merger had been granted two years ago, this monitoring has been done through an Advisory Board together with representatives of the company. The EDD has also met with emerging farmers, done its own independent research and undertaken site visits to gather further information and deepen its analysis.

Economic Development Department I ANNUAL REPORT 2015 / 2016 29
PART A – General Information
Key results achieved thus far include R28 million of the R60 million of the farmer development programme being spent training 98 farming entities from Danhouse, Hammanskraal, Krugersdorp, Mamelodi, Marble Hall, Maubane and Rust-de-Winter. Around 254 members benefitted from this training. In addition, 255 microfarming entities (that is farming less than 100 hectares) were supported.
R10.4 million of the R30 million for projects was spent on projects including 13 educational centres, eight poverty alleviation projects, water and food security at eight schools and nine employee community initiatives.
Eleven farming entities have taken up the Land Bank facilities to the value of R29.6 million. Lastly, storage discounts of R42 000 have been used.
Competition Tribunal
Duringthepastfinancialyear,theCompetitionTribunalissued orders for 124 large mergers, an increase of 27% from 98 in 2014/2015. This is the highest number oflargemergersdecidedbytheTribunalinonefinancialyear since its inception in 1999. The Competition Tribunal also issued orders for nine intermediate mergers – more than double that of four in 2014/15. Employment conditions were imposed in 19 of these mergers. Below are three examples of mergers that the Competition Tribunal dealt with.
Pioneer Foods/ Futurelife Health Products
The Tribunal heard evidence in the merger between Pioneer Foods and Futurelife Health Products over a period of six days in October 2015. The Commission had recommended an unconditional approval of the merger. However, the Tribunal, after allowing Pioneer’s main competitor, Kellogg South Africa, to intervene in the proceedings, approved the transaction subject to conditions.
The key issues raised during the hearing were the competitive relationship between Pioneer Foods’ ProNutro products and Futurelife’s nutrient-dense health food product, and whether these products were part of a broader breakfast food/functional market or a narrow ready-to-eat porridge market.
The conditions, which all the parties had agreed to, will ensure that:
• The joint venture will be managed and run on daily basis by Futurelife founder and CEO, PaulSaad;Theflowofinformationfromthejoint venture to employees in Pioneer Foods business dealing with competing products will be prevented, and
• Investment in the ProNutro brand will be maintained at its current levels for two years after the merger.
Telkom/Business Connection
In August 2015, the Competition Tribunal heard argument in relation to the proposed merger between Telkom and BCX. The proposed transaction involved Telkom acquiring the entire issued share capital of BCX (a publiclly-listed company). Once acquired, BCX would delist from the Johannesburg Stock Exchange (JSE) and become a Telkom subsidiary. The Competition Commission had conditionally approved this large merger with conditions.
At the Competition Tribunal proceedings, additional concerns were raised by a competitor to the merging parties as well as concerns related to the adequacy of the conditions proposed by the Competition Commission. During the course of the Tribunal hearing the parties were able to submit a set of revised conditions to which all parties agreed. The Tribunal considered these conditions and approved the merger on such basis.
Examples of concerns and revised conditions include:
• The competitor alleged that they were unable to obtain service level agreements (SLA) from Telkom Wholesale and were thus forced to purchase from Telkom Retail in order to get an SLA
• There was a concern that the post-merger entity could subsidise its retail business by charging lower prices in retail while raising prices in the upstreammarketforwholesalefixedleasedlines
Economic Development Department I ANNUAL REPORT 2015 / 201630
PART A – General Information
• Conditions to address the concerns include:• To the extent that Telkom Wholesale supplies
any SLA on common components to Telkom retail, it will offer a SLA on common components to other OLO’s on a non-discriminatory basis
• A transfer pricing programme to ensure that Telkom Wholesale will:• Price network services for common
components on a non-discriminatory basis to both OLOs and Telkom Retail
• Price non-common components to OLOs at no more than cost plus a reasonable return
• Price non-common components to Telkom retail at no less than cost plus a reasonable return.
The effect of the Tribunal’s conditions is that Telkom charges its own downstream operations the same prices that it charges its competitors in the downstream – thus maintaining fair competition. In addition, the Tribunal also imposed public interest conditions – limiting the number of jobs to be lost to a maximum 60 jobs overall. These job losses are further limited to a maximum of 20 employees per year in each of the three years.
Vodacom/Neotel merger
Vodacom (the dominant cellphone company in South Africa) sought to buy Neotel in order to obtain control of its spectrum that is used to carry cellphone and emailtrafficandtoacquireitslandlinesfortelephoneservices. The Competition Commission recommended that the transaction be approved, subject to a two-year delay in the use of the spectrum.
The Minister of the Economic Development commissioned a study by an independent expert on the implications of the deal. Access to Neotel’s spectrum would, in the opinion of the Minister’s experts, have entrenched Vodacom’s dominance in the market and given it an insurmountable advantage against competitors.
It would have limited opportunities for new entrants in the market. This could have a harmful effect on consumers and businesses. Together with the Minister of Telecommunications and Postal Services, the EDD objected and requested that the spectrum either be available on fair terms to all competitors or be returned
to ICASA. Other objections were forwarded by virtually the whole industry, including MTN, Cell C and Telkom.
Theobjectionsresultedinthecompanyfirstofferinganew deal to its competitors and later withdrawing the transaction and the attempted acquisition of Neotel.
Fines
The Tribunal imposed fines of R338 million in thecourseoftheyearon20firms.Thebulkofthesefines(R337million)wereimposedon19firmsforcollusion.A remaining amount of R750 000 was imposed on onefirmfor failing tocomplywithmergernotificationprocedures.
The International Trade Administration Commission of South Africa (ITAC)
ITAC’s aim “is to foster economic growth and development in order to raise incomes and promote investment and employment in South Africa and within the Common Customs Union Area by establishing an efficient and effective system for the administrationof international trade subject to this Act and the Southern African Customs Union (SACU) Agreement” (International Trade Administration Act, 2002, Act No. 71 of 2002). ITAC comprises three core business units, namely Tariff Investigations, Trade Remedy Investigations, and Import and Export Control.
Tariff investigations
As enunciated in the New Growth Path and the Trade Policy and Strategic Framework, the Commission follows a developmental or strategic approach to tariff setting with the objective of promoting domestic manufacturing activity, employment retention and creation, and international competitiveness.
An increase in customs duties is considered, on a case-by-case basis, to support domestic producers, particularly those that are important from an employment or value-addition perspective, that are experiencing threatening import competition.
On a case-by-case basis, tariffs for mature resource-based capital-intensive upstream industries are selectively reviewed and in some cases reduced or removed in the interest of lowering input costs into labour-intensive employment creating downstream activities.

Economic Development Department I ANNUAL REPORT 2015 / 2016 31
PART A – General Information
Over the past year, the steel industry across the world has experienced an oversupply of steel and a decrease in demand from China. This has placed steel producers across the world under pressure – including producers in South Africa. One of remedies government was able to use was raised tariffs on steel – during the year under review ITAC recommended raising tariffs on the following products:
ITAC recommended changes in steel tariffs in 2015/16
Product Change in tariff1 Galvanised/coated and painted flat
steelFrom free to duty to 10% ad valorem
2 Certain large bore steel pipes From free of duty to 10% to 15% ad valorem3 Wire rod and re-enforcing bar (rebar) From free of duty to 10% ad valorem4 Structural steel From free of duty to 10% ad valorem (suspended until the local industry
starts manufacturing the product) 5 Semi-finishedsteel,coldrolledsteel,
steel sections, steel plates From free of duty to 10% ad valorem
6 Aluminium rolled products Application for an increase was rejected
Source: ITAC
The majority of tariff applications for the steel industry were processed in under four months to assist the sector in distress. Other applications for tariff changes are captured in the table below. Applications are assessed on a case-by-case basis. As is evident below, cases may result in an increase or decrease in the tariff – as necessitated by industrial policy considerations and the facts of each case.
Changes in non-steel tariffs
Product Change in tariff1 Polyurethane pre-polymer From free of duty to 10% ad valorem2 Adhesive bandages From free of duty to 10% ad valorem
3 Sugar From 304.0c/kg to 245c/kg using the variable tariff formula4 Mussels in airtight metal containers Reduction from 25% to free5 Lithium batteries Reduction from 10% to free6 Polish No change – the application to reduce tariff was rejected
Source: ITAC
In addition, a number of rebate of duty provisions have been recommended and implemented over the past year, toreducethecostofproductionforlocalmanufacturingfirmsandincreasetheirinternationalcompetitiveness.Rebates recommended by ITAC during the year include:
• Barepanelsforthemanufactureofraisedaccessflooringsystems• Certain components excluding populated or mounted circuit boards used to manufacture electricity meters• Knitted pile polyester fabrics used to manufacture furniture• Amending wording of rebate for fabric used in the manufacture of upholstered furniture to support local
industry• Acrylic sheet for plastic sanitary ware• Woven fabric for school shirts.
Economic Development Department I ANNUAL REPORT 2015 / 201632
PART A – General Information
The rebate for components used to manufacture television sets was withdrawn.
The application for a rebate provision on bangles used for the manufacturing of jewellery was rejected by the Commission.
Following a review, the Commission decided to maintain the semi-knocked down rebate provision for the assembly of monitors.
Case studies
1. Fabrics for upholstered furniture (amendment): The Textile Federation of South Africa (Texfed) applied for an amendment of wording of qualifying fabrics for manufacturing upholstered furniture. The rebate provides for a rebate of the full duty on certain fabrics to enable furniture manufacturers to import intermediate inputs that are not locally manufactured. ITAC found that the local textile sector produces a range of fabrics that meet the current rebate provisions. ITAC amended the wording of qualifying to support the local fabric manufacturers.
2. Creation of a rebate facility for panels used to manufactureraisedaccessflooringsystemsafterevaluating an application by Pentalfloor AccessFlooring (Pty) Ltd. During its investigation, ITAC found no local manufacturers of the panels in the SACU region. It recommended a rebate facility be created for steel panels with an inner core of Portland cement as the current duty has an unnecessary cost raising impact and duty would improve the applicant’s competitive position in the face of stiff competition from firms importing thecompleteflooringsystem.
3. Reduction in the customs duty on sugar in terms of the existing variable tariff formula: The 20-day moving average of the London No.5 settlement price on sugar triggered a tariff adjustment when sugar prices reached US$391.70/ton on 9 November 2015. In terms of the variable tariff formula for sugar, conditions for a downward adjustment in the tariff were met and the South African Sugar Association (SASA) as well as Cargill Sugar RSA (Pty) Ltd forwarded letters of confirmation. ITACrecommended reducing the rate of customs duty on sugar from 304.0c/kg to 245c/kg.
4. Temporary rebate of the full anti-dumping duty of bone-in cuts of frozen imported chicken from or originating in the United States of America (USA). The Minister of Economic Development directed ITAC to investigate the creation of a rebate provision of full anti-dumping duty on bone-in cuts of frozen imported chicken pieces from or originating in the USA.
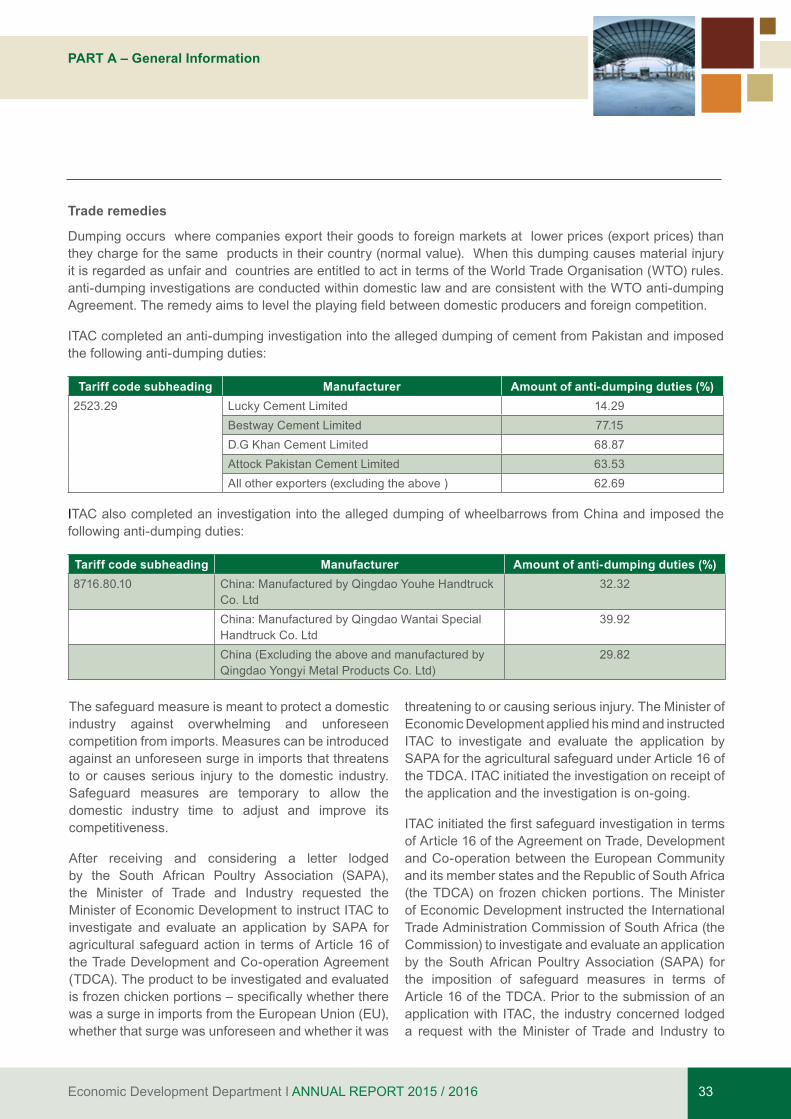
Economic Development Department I ANNUAL REPORT 2015 / 2016 33
PART A – General Information
The safeguard measure is meant to protect a domestic industry against overwhelming and unforeseen competition from imports. Measures can be introduced against an unforeseen surge in imports that threatens to or causes serious injury to the domestic industry. Safeguard measures are temporary to allow the domestic industry time to adjust and improve its competitiveness.
After receiving and considering a letter lodged by the South African Poultry Association (SAPA), the Minister of Trade and Industry requested the Minister of Economic Development to instruct ITAC to investigate and evaluate an application by SAPA for agricultural safeguard action in terms of Article 16 of the Trade Development and Co-operation Agreement (TDCA). The product to be investigated and evaluated isfrozenchickenportions–specificallywhethertherewas a surge in imports from the European Union (EU), whether that surge was unforeseen and whether it was
threatening to or causing serious injury. The Minister of Economic Development applied his mind and instructed ITAC to investigate and evaluate the application by SAPA for the agricultural safeguard under Article 16 of the TDCA. ITAC initiated the investigation on receipt of the application and the investigation is on-going.
ITACinitiatedthefirstsafeguardinvestigationintermsof Article 16 of the Agreement on Trade, Development and Co-operation between the European Community and its member states and the Republic of South Africa (the TDCA) on frozen chicken portions. The Minister of Economic Development instructed the International Trade Administration Commission of South Africa (the Commission) to investigate and evaluate an application by the South African Poultry Association (SAPA) for the imposition of safeguard measures in terms of Article 16 of the TDCA. Prior to the submission of an application with ITAC, the industry concerned lodged a request with the Minister of Trade and Industry to
Trade remedies
Dumping occurs where companies export their goods to foreign markets at lower prices (export prices) than they charge for the same products in their country (normal value). When this dumping causes material injury it is regarded as unfair and countries are entitled to act in terms of the World Trade Organisation (WTO) rules. anti-dumping investigations are conducted within domestic law and are consistent with the WTO anti-dumping Agreement.Theremedyaimstoleveltheplayingfieldbetweendomesticproducersandforeigncompetition.
ITAC completed an anti-dumping investigation into the alleged dumping of cement from Pakistan and imposed the following anti-dumping duties:
Tariff code subheading Manufacturer Amount of anti-dumping duties (%)2523.29 Lucky Cement Limited 14.29
Bestway Cement Limited 77.15D.G Khan Cement Limited 68.87Attock Pakistan Cement Limited 63.53All other exporters (excluding the above ) 62.69
ITAC also completed an investigation into the alleged dumping of wheelbarrows from China and imposed the following anti-dumping duties:
Tariff code subheading Manufacturer Amount of anti-dumping duties (%)8716.80.10 China: Manufactured by Qingdao Youhe Handtruck
Co. Ltd32.32
China: Manufactured by Qingdao Wantai Special Handtruck Co. Ltd
39.92
China (Excluding the above and manufactured by Qingdao Yongyi Metal Products Co. Ltd)
29.82
Economic Development Department I ANNUAL REPORT 2015 / 201634
PART A – General Information
invoke the remedies under Article 16 of the TDCA. After consideration, the Minister of Trade and Industry requested the Minister of Economic Development to instruct the Commission, in terms of Section 16(d)(i) of the International Trade Administration Act, 2002 (Act 71 of 2002) (ITA Act) to investigate and evaluate an application for agricultural safeguard action in terms of Article 16 of the TDCA. The investigation is on-going.
A safeguard investigation on hot rolled steel was also initiated after an application was received from the South African Iron and Steel Institute (SAISI). This investigation is on-going.
Export control
The Commission also published proposed amendments to the current guidelines to further strengthen the administration of the Preferential Price System (PPS), for public comment, on 6 December 2015.
Out of over seven thousand tariff lines in the South African version of the international Harmonised Commodity Description and Coding System, 121 tariff heading numbers subject to import control measures and 133 tariff heading numbers as listed in the export Regulations. These import and export control measures aim to enforce health, environmental, safety and security, and technical standards. A range of measures also aim to promote the domestic industry’s manufacturing and value addition while preventing the erosion of the domestic industry thereby protecting jobs. Import control therefore plays an important role in curbing illegal and fraudulent imports, as well as limiting imports of second-hand goods. Export control supportsinitiativessuchasmineralbeneficiation.
During the 2015/16 year under review, ITAC issued 17 188 import permits and 14 657 export permits. The majority of the import permits issued by ITAC (3 246 permits) were for importing capital goods – that is machinery, mechanical appliances and equipment. Permitswerealso issued for items suchas fishandfishproducts,tyres,armsandammunitionandmineralfuels to provide a few more examples of items subject to import control measures.
The majority of export permits (6 181) issued by ITAC were for the exportation of used cars. Permits were also issued for ferrous and non-ferrous scrap, chemicals, and mineral fuels.
Enforcement is a critical component of the Import and Export Control Unit’s activities. The Unit works to detect contraventions of the ITA Act as well as the import and export control regulations. It also monitors compliance with the conditions and terms in import, export and rebate permits. During the year, the EDD enhanced ITAC’s capacity to enforce the PPS by providing additional resources to hire four additional inspectors.
During the 2015/16 year, ITAC conducted 853 scheduled inspections, 551 unscheduled inspections and 16 investigations. The key industry sectors inspected included the scrap metal export sector, clothing and textiles, used automotive parts and pneumatic tyres.
SA Metal Group vs ITAC & the EDD
On 10 May 2013, the Minister had published a policy directive on the export of ferrous and non-ferrous waste and scrap metals. The directive provided that ferrous and non-ferrous waste and scrap metal had to firstbe offered to domestic users of scrap at a discounted price, before it was allowed to be exported. On 2 August 2013, ITAC published export control guidelines to give effect to the Minister’s Directive and amended them on 12 September 2014.
SA Metal Group (Pty) Ltd, one of the largest scrap dealers in South Africa, was refused export permits to export scrap metal from South Africa by ITAC. As a result it brought a court application to have the decision set aside and substituted with a decision that granted it export permits. In 2015, the Minister of Economic Development opposed the application and successfully defended the price preference system in the Western Cape High Court in the court action brought by the SA Metal Group.
The Industrial Development Corporation
In 2015/16, the IDC celebrated 75 years of existence with its highest level of funding approvals - R14.5 billion approved. Unlike previous years where IDC was able to achieve such high levels of funding, this was not done on the back of any new projects related to the renewable energy programme. This brings the IDC’s total approvals overthepastfiveyears(2011/12to2015/16)toR67billion,54% higher than the R43 billion approved in the previous five-yearperiod(2006/07to2010/11).R11.4billionworthof funds were disbursed in 2015/16.
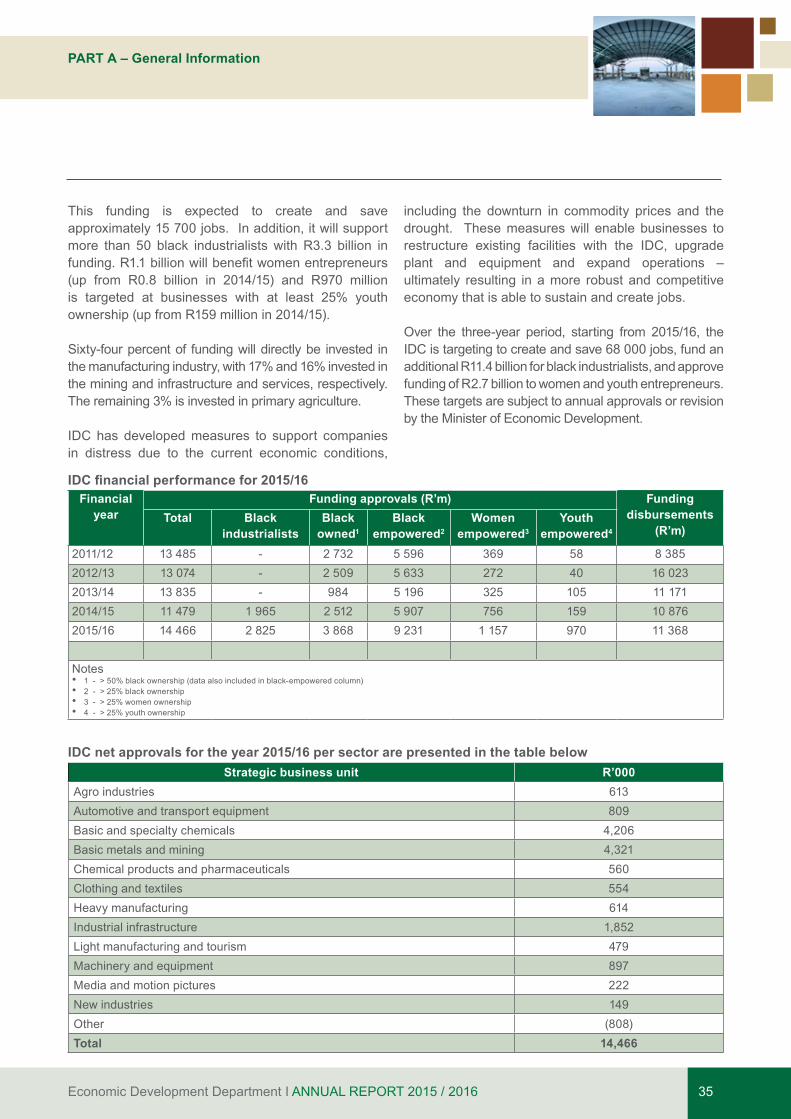
Economic Development Department I ANNUAL REPORT 2015 / 2016 35
PART A – General Information
This funding is expected to create and save approximately 15 700 jobs. In addition, it will support more than 50 black industrialists with R3.3 billion in funding.R1.1billionwillbenefitwomenentrepreneurs(up from R0.8 billion in 2014/15) and R970 million is targeted at businesses with at least 25% youth ownership (up from R159 million in 2014/15).
Sixty-four percent of funding will directly be invested in the manufacturing industry, with 17% and 16% invested in the mining and infrastructure and services, respectively. The remaining 3% is invested in primary agriculture.
IDC has developed measures to support companies in distress due to the current economic conditions,
including the downturn in commodity prices and the drought. These measures will enable businesses to restructure existing facilities with the IDC, upgrade plant and equipment and expand operations – ultimately resulting in a more robust and competitive economy that is able to sustain and create jobs.
Over the three-year period, starting from 2015/16, the IDC is targeting to create and save 68 000 jobs, fund an additional R11.4 billion for black industrialists, and approve funding of R2.7 billion to women and youth entrepreneurs. These targets are subject to annual approvals or revision by the Minister of Economic Development.
IDC financial performance for 2015/16Financial
yearFunding approvals (R’m) Funding
disbursements (R’m)
Total Black industrialists
Black owned1
Black empowered2
Women empowered3
Youth empowered4
2011/12 13 485 - 2 732 5 596 369 58 8 3852012/13 13 074 - 2 509 5 633 272 40 16 0232013/14 13 835 - 984 5 196 325 105 11 1712014/15 11 479 1 965 2 512 5 907 756 159 10 8762015/16 14 466 2 825 3 868 9 231 1 157 970 11 368
Notes• 1 - > 50% black ownership (data also included in black-empowered column)• 2 - > 25% black ownership• 3 - > 25% women ownership• 4 - > 25% youth ownership
IDC net approvals for the year 2015/16 per sector are presented in the table belowStrategic business unit R’000
Agro industries 613Automotive and transport equipment 809Basic and specialty chemicals 4,206Basic metals and mining 4,321Chemical products and pharmaceuticals 560Clothing and textiles 554Heavy manufacturing 614Industrial infrastructure 1,852Light manufacturing and tourism 479Machinery and equipment 897Media and motion pictures 222New industries 149Other (808)Total 14,466

Economic Development Department I ANNUAL REPORT 2015 / 201636
PART A – General Information
Economic Development Department I ANNUAL REPORT 2015 / 2016 37
PART A – General Information
PART BPerfomance Information
Economic Development Department I ANNUAL REPORT 2015 / 201638
PART B – Performance Information
1. AUDITOR-GENERAL’S REPORT: PREDETERMINED OBJECTIVES
2. OVERVIEW OF DEPARTMENTAL PERFORMANCE
The Auditor-General of South Africa (AGSA) has conducted certain audit procedures on the performance information to provide reasonable assurance in the form of an audit conclusion. The audit conclusions on the performance against predetermined objectives is included in the report to management, with material
findings being reported under the PredeterminedObjectives heading in the Report on other legal and regulatory requirements section of the auditor’s report.
RefertoPartEonfinancialinformationfortheAuditor-General’s report.
2.1 SERVICE DELIVERY ENVIRONMENT
The EDD as a coordinating department is tasked with catalysing the transformation of the South African economic landscape with the New Growth Path (NGP) as the key policy in this regard. A key feature of the NGP is that economic growth needs to be underpinned by employment creation and greater equity in the distribution of socio-economic benefitsand opportunities.
Oureffortstofulfilthiscommitmentareaffectedbytheongoing uncertainties in the global economy. In these conditions, it is important to unlock the opportunities in domestic and regional markets, including thorough and more effective coordination by public entities as well as greater crowding of investment. That will require
strong initiatives to address key challenges, notably around electricity and labour relations, while taking forward the overall strategy of driving the infrastructure build programme and realising the potential of the job driversidentifiedinourpolicyframework
2.2 SERVICE DELIVERY IMPROVEMENT PLAN (SDIP)
The EDD has completed a Service Delivery Improvement Plan which was submitted to the Department of Public Service and Administration (dpsa)forthe2015/16financialyear.
The tables below highlight the service delivery plan and the achievements to date.
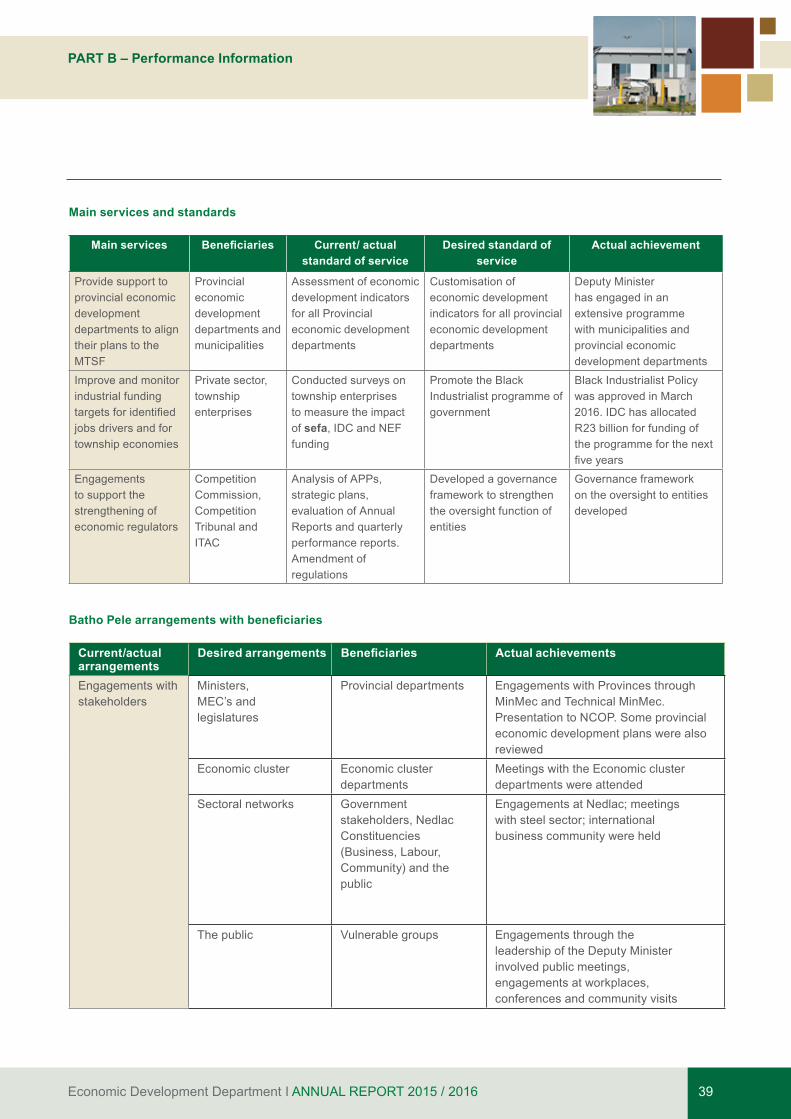
Economic Development Department I ANNUAL REPORT 2015 / 2016 39
PART B – Performance Information
Main services and standards
Main services Beneficiaries Current/ actual standard of service
Desired standard of service
Actual achievement
Provide support to provincial economic development departments to align their plans to the MTSF
Provincial economic development departments and municipalities
Assessment of economic development indicators for all Provincial economic development departments
Customisation of economic development indicators for all provincial economic development departments
Deputy Minister has engaged in an extensive programme with municipalities and provincial economic development departments
Improve and monitor industrial funding targetsforidentifiedjobs drivers and for township economies
Private sector, township enterprises
Conducted surveys on township enterprises to measure the impact of sefa, IDC and NEF funding
Promote the Black Industrialist programme of government
Black Industrialist Policy was approved in March 2016. IDC has allocated R23 billion for funding of the programme for the next fiveyears
Engagements to support the strengthening of economic regulators
Competition Commission,Competition Tribunal and ITAC
Analysis of APPs, strategic plans, evaluation of Annual Reports and quarterly performance reports.Amendment of regulations
Developed a governance framework to strengthen the oversight function of entities
Governance framework on the oversight to entities developed
Batho Pele arrangements with beneficiaries
Current/actual arrangements
Desired arrangements Beneficiaries Actual achievements
Engagements with stakeholders
Ministers, MEC’s and legislatures
Provincial departments Engagements with Provinces through MinMec and Technical MinMec. Presentation to NCOP. Some provincial economic development plans were also reviewed
Economic cluster Economic cluster departments
Meetings with the Economic cluster departments were attended
Sectoral networks Government stakeholders, Nedlac Constituencies (Business, Labour, Community) and the public
EngagementsatNedlac;meetingswithsteelsector;internationalbusiness community were held
The public Vulnerable groups Engagements through the leadership of the Deputy Minister involved public meetings, engagements at workplaces, conferences and community visits
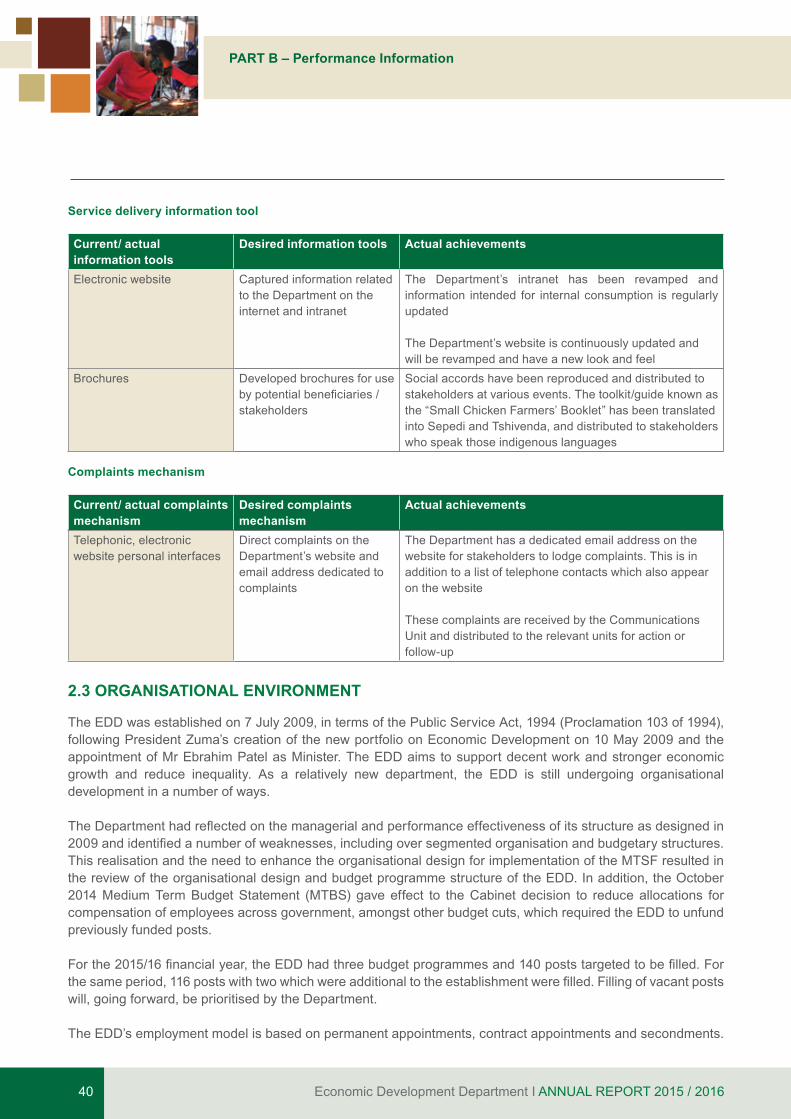
Economic Development Department I ANNUAL REPORT 2015 / 201640
PART B – Performance Information
Service delivery information tool
Current/ actual information tools
Desired information tools Actual achievements
Electronic website Captured information related to the Department on the internet and intranet
The Department’s intranet has been revamped and information intended for internal consumption is regularly updated
The Department’s website is continuously updated and will be revamped and have a new look and feel
Brochures Developed brochures for use bypotentialbeneficiaries/stakeholders
Social accords have been reproduced and distributed to stakeholders at various events. The toolkit/guide known as the “Small Chicken Farmers’ Booklet” has been translated into Sepedi and Tshivenda, and distributed to stakeholders who speak those indigenous languages
Complaints mechanism
Current/ actual complaints mechanism
Desired complaints mechanism
Actual achievements
Telephonic, electronic website personal interfaces
Direct complaints on the Department’s website and email address dedicated to complaints
The Department has a dedicated email address on the website for stakeholders to lodge complaints. This is in addition to a list of telephone contacts which also appear on the website
These complaints are received by the Communications Unit and distributed to the relevant units for action or follow-up
2.3 ORGANISATIONAL ENVIRONMENT
The EDD was established on 7 July 2009, in terms of the Public Service Act, 1994 (Proclamation 103 of 1994), following President Zuma’s creation of the new portfolio on Economic Development on 10 May 2009 and the appointment of Mr Ebrahim Patel as Minister. The EDD aims to support decent work and stronger economic growth and reduce inequality. As a relatively new department, the EDD is still undergoing organisational development in a number of ways.
TheDepartmenthadreflectedonthemanagerialandperformanceeffectivenessofitsstructureasdesignedin2009andidentifiedanumberofweaknesses,includingoversegmentedorganisationandbudgetarystructures.This realisation and the need to enhance the organisational design for implementation of the MTSF resulted in the review of the organisational design and budget programme structure of the EDD. In addition, the October 2014 Medium Term Budget Statement (MTBS) gave effect to the Cabinet decision to reduce allocations for compensation of employees across government, amongst other budget cuts, which required the EDD to unfund previously funded posts.
Forthe2015/16financialyear,theEDDhadthreebudgetprogrammesand140poststargetedtobefilled.Forthesameperiod,116postswithtwowhichwereadditionaltotheestablishmentwerefilled.Fillingofvacantpostswill, going forward, be prioritised by the Department.
The EDD’s employment model is based on permanent appointments, contract appointments and secondments.
Economic Development Department I ANNUAL REPORT 2015 / 2016 41
PART B – Performance Information
The contract appointments and secondments are project focused and time bound. This meant that during this period the EDD received support through secondmentsofofficials fromotherdepartmentsandacross the state to support the work of the PICC.
The Department uses the dti for some Information and Communications Technology (ICT) services and infrastructure. The EDD is on the dti network and the dti provides services such as network, email system, backup, ICT security and telephony. The EDD is responsible for its own information technology desktop support services and has an Information Management Plan.
2.4 KEY POLICY DEVELOPMENTS AND LEGISLATIVE CHANGES
Cable and metal theft
The Presidential Infrastructure Coordinating Commis-sion (PICC) noted the very damaging consequences of cable and metal theft from public institutions which results in damage to critical public infrastructure. Most of this criminal activity has targeted non-ferrous metals such as copper. Increasingly, ferrous metals such as steel and iron affecting transport and electricity infra-structure are also being targeted. Often damage caused by theft far outweighs the actual value of the material stolen. These indirect
costs include loss of income, disruption of essential services, diversion of scarce resources as well as social instability. Following a discussion, the PICC Council adopted recommendations to strengthen existing legislation by introducing more stringent measures. The EDD and PICC teams provided legal and other support to the drafting of the amendments. Cabinet and Parliament approved the Criminal Matters Amendment Act 18 of 2015, “To amend the Criminal Procedure Act, 1977, so as to regulate the bail in respect of essential infrastructure-relatedoffences;toamendtheCriminalLaw Amendment Act,1997, so as to regulate the imposition of discretionary minimum sentences for essential infrastructure; to amend the Preventionof Organised Crime Act,1998, so as to insert a new offence inSchedule 1 to theAct; and to provide formatters connected therewith”.
The amendments, create a special category of offence for theft from public infrastructure, with tougher bail conditions, minimum jail sentences when one is found guilty, sentences of up to 30 years for theft from essential facilitiesandfinesofup toR100million forcompanies who collude with thieves and greater onus on the accused to explain where they obtained copper cables and scrap metal.
3. STRATEGIC OUTCOME ORIENTED GOALS
The EDD’s strategic oriented goals are:1. Promote decent work through meaningful economic transformation and inclusive growth.2. Provideparticipatory,coherentandcoordinatedeconomicpolicy,planninganddialogueforthebenefitofall
South Africans.
These goals have been given greater detail through the various Outcomes that the Presidency introduced, which include Outcome 4: Decent employment through inclusive growth. Other Outcomes that are also relevant to thegoalsoftheDepartmentincludeOutcome5:Askilledandcapableworkforcetosupportinclusivegrowth;Outcome 6: Efficient competitive and responsive economic infrastructure network; andOutcome 7: Vibrant,equitable sustainable rural communities.
Economic Development Department I ANNUAL REPORT 2015 / 201642
PART B – Performance Information
ITAC made changes to regulations in relation to the Automotive Production and Development Programme (APDP) regulations and issued amendments to Export Control Regulations. These are discussed in more detail in Programme 3 “Investment, Competition and Trade”.
The EDD, supports the dti as the coordinating department for Outcome 4, and works with the dti and the National Treasury to manage the monitoring system of the outcome to provide analysis of the impact achieved by the Cluster departments.
PROGRAMME 1: ADMINISTRATION
Performance indicator Actual achievement
2014/2015
Planned target
2015/2016
Actual achievement
2015/2016
Deviation from planned
target to actual achievement for 2015/2016
Comment on
deviations
KPI1:Unqualifiedauditreport New KPI 1 1 - -
KPI 2: Measured improvement in support services to Strategic Objectives 2, 3, 4, 5 and 6 and the Ministryasquantifiedbyusers
New KPI 1 1 - -
Changes to planned targets
There were no in-year changes to planned targets and indicators for the period under review. The EDD implemented its 2015/16 APP as tabled in Parliament.
Linking performance with budgets
R83.1 million or 99.9% of the Administration’s programme budget of R83.2 million was spent during the 2015/16 financialyear.
4. PERFORMANCE INFORMATION BY PROGRAMME
4.1 PROGRAMME 1: ADMINISTRATION
Purpose: Provide strategic leadership, management and support services to the Department
Strategic Objective 1: Provide strategic guidance to the Department, technical and administrative support to the Ministry as well as to the Department to achieve Strategic Objectives 2, 3, 4, 5 and 6.
Sub-programmes• Ministry• OfficeoftheDirector-General• FinancialManagement• CorporateManagement.
Strategic objectives, performance indicators, planned targets and actual achievements
Programme 1, “Administration”, has two Key Performance Indicators which aim to ensure that the Department achieves an unqualified audit opinionand measures improvement in support services to the Ministry and Department. While all Key Performance Indicators have been achieved in this programme, a highlight for the period under review is that the Departmenthasreceivedanunqualifiedauditopinion.
Apilotsurveywasundertakenwithspecificdivisionsin the Department to measure ‘internal client service satisfaction levels’. The survey’s findings andrecommendations are being implemented to improve processes and systems within Human Resources Management Unit.

Economic Development Department I ANNUAL REPORT 2015 / 2016 43
PART B – Performance Information
Programme 1: Expenditure
Sub- programme name
2015/16 2014/15
Final appropriation
Actualexpenditure
(Over)/ under expenditure
Final appropriation
Actualexpenditure
(Over)/ under expenditure
R’000 R’000 R’000 R’000 R’000 R’000
Ministry 20 162 20 160 2 20 421 19 828 593
Officeofthe Director General
14 579 14 578 1 12 611 12 583 28
Corporate Management Services
36 618 36 618 - 55 044 55 008 36
Financial Management
11 864 11 788 76 - - -
Total 83 223 83 144 79 88 076 87 419 657
4.2 PROGRAMME 2: GROWTH PATH AND SOCIAL DIALOGUE
Programme 2 “Growth Path and Social Dialogue” has six Key Performance Indicators and 22 products. Its purpose is to strengthen government’s economic development capacity; review, develop and proposethe alignment of economic policies; and, developpolicies aimed at broadening participation in the economy and creating decent work opportunities. Key areas of its work include:• Providing support for the New Growth Path’s jobs
drivers through initiatives such as responding to challenges in the steel industry to providing support and input to the Mining Phakisa
• Coordinating and aligning economic development through, as examples, the work in the PICC working with other departments and the Presidency to promote more effective industrial relations;participation in the Industrial Policy Action Plan (IPAP) and the ESEIDCluster; and coordinatingthe social economy jobs drivers
• Facilitating increased access to employment and entrepreneurship for black women and youth
• Gathering information and developing a dashboard on agriculture to assist policy makers
• Promoting inclusive growth through, for example, evaluating youth employment and
promoting implementation of the Youth Accord;implementation of spatial, local and provincial initiatives to promote employment, empowerment anddevelopment;coordinatingworkonthesocialeconomy;andprovidingstrategicsupport for thejobs drivers
• Supporting provincial development through numerous engagements with provinces.
Purpose: Strengthen the economic development capacity of government. Review and develop the alignment of economic development policies aimed at broadening participation in the economy to create decent work opportunities Strategic Objective 2: Coordinate jobs drivers and implementation of the New Growth Path economic strategy in support of the National Development Plan
Strategic Objective 3: Facilitate social dialogue and implementation of social accords
Sub-programmes • GrowthPathJobsDrivers• SocialDialogue,ProductivityandInnovation
Economic Development Department I ANNUAL REPORT 2015 / 201644
PART B – Performance Information
Strategic objectives, performance indicators, planned targets and actual achievements
During the period under review, the Department worked onandhelpeddeveloptwosignificantlegalinstruments.The first was the Criminal Matters Amendment Billwhere the Department worked in partnership with the Department of Justice and the PICC (reported on in more detail in Programme 3). Over the course of the year,theDepartmentalsodidsignificantresearchandconsulted on proposed amendments to the Amended Competition Act. A Memorandum was produced for the President as a result of the work undertaken, on 1 May 2016, the government gazetted a Presidential Proclamation that brought into effect certain sections of the Competition Amendment Act. It makes it a criminal offence for directors or managers of a firmto colludewith their competitors or fix prices, dividemarkets among themselves or collude in tenders or to acquiesce in collusion. They expose themselves to jail time if they are convicted.
The Department promoted trade and investment through a number of initiatives. These included the Minister’s participation in the Presidential Business Working Group; hosting investor meetings with arange of sectors and promoting investments in road showswiththeIDCleadership;engagementwithBlackIndustrialistshostedbytheGautengPremier;meetinginternational investorsabroad;approving investmentsin the rest of the African continent, among others. In addition to the work undertaken by the Minister, the Department undertook work on unblocking investment, supporting the green industry and indigenous chicken subsector in agriculture and supporting the steel industry (addressed in more detail below).
At the time when there were heightened attacks on foreign owned businesses, the EDD commissioned research on trade in the region and hosted a stakeholder symposium with over 100 participants, including youth, parliamentarians, academics, students, workers and businesspeople.ItaddressedthebenefitsthatSouthAfrica got from trade and investment from the region (including the research findings such as one out ofevery five Ford Ranger bakkies made in Roslyn,Pretoria, is sold elsewhere on the continent).
The EDD also engaged workers and communities on these issues to gain a shared commitment to tell the African story more consistently in South Africa.
Other activities that were held where the EDD provided thought leadership included a workshop, hosted by the Minister in Durban, on “Measuring Well-being and Development in Africa”. Here participants from around the world, including the United Nations and the Organisation for Economic Co-operation and Development (OECD), joined in a debate on how best to measure economic welfare. They examined the challenges with GDP and measuring economic welfare, statistical services on the continent and identifiedpossible solutions. The EDD also co-hosted a BRICS Competition Conference together with the Competition Commission on “Competition and Inclusive Growth”. Itwas thefirstmajorconferenceglobally thatplacedemployment at the heart of competition policy. The conference, which brought together 508 delegates from competition agencies, practitioners and stakeholders from BRICS and other African countries as well as experts from the US and EU, led to rich discussion on thespecificchallengesfacedintheglobalsouth.
The EDD’s commitment to inclusive growth was pursued through a variety of initiatives. Highlights included the efforts, together with the dti, to support the steel industry while it faces the steel surplus worldwide. The initiatives undertaken include the Minister’s meeting with industry and unions to get feedback on government’s proposed policy interventions; ITAC’sraising of a range of steel tariffs; the establishmentof a task team on steel to negotiate a developmental priceforsteel;andestablishingadditionalcapacityforthe International Trade Administration Commission of South Africa (ITAC) to monitor the implementation of the scrap metal policy.
An indaba on social entrepreneurship was held in the Free State attended by 300 participants from social entrepreneurs, policy makers, academics and civil society. The indaba dealt with issues such as access to funding for social enterprises that remains a challenge. The need to entrench social entrepreneurship as part of the curriculum in schools (primary and high school level) and skills development are key means to build and sustain social enterprises.
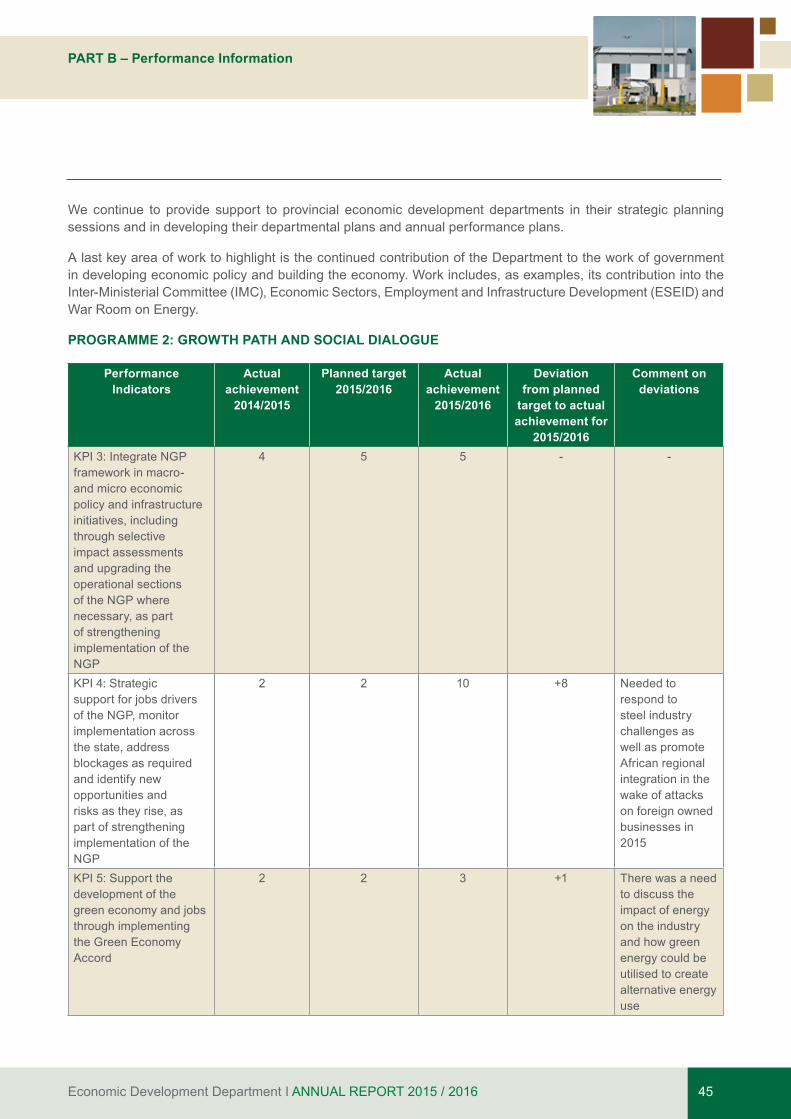
Economic Development Department I ANNUAL REPORT 2015 / 2016 45
PART B – Performance Information
We continue to provide support to provincial economic development departments in their strategic planning sessions and in developing their departmental plans and annual performance plans.
A last key area of work to highlight is the continued contribution of the Department to the work of government in developing economic policy and building the economy. Work includes, as examples, its contribution into the Inter-Ministerial Committee (IMC), Economic Sectors, Employment and Infrastructure Development (ESEID) and War Room on Energy.
PROGRAMME 2: GROWTH PATH AND SOCIAL DIALOGUE
Performance Indicators
Actual achievement
2014/2015
Planned target2015/2016
Actual achievement
2015/2016
Deviation from planned
target to actual achievement for
2015/2016
Comment ondeviations
KPI 3: Integrate NGP framework in macro-and micro economic policy and infrastructure initiatives, including through selective impact assessments and upgrading the operational sections of the NGP where necessary, as part of strengthening implementation of the NGP
4 5 5 - -
KPI 4: Strategic support for jobs drivers of the NGP, monitor implementation across the state, address blockages as required and identify new opportunities and risks as they rise, as part of strengthening implementation of the NGP
2 2 10 +8 Needed to respond to steel industry challenges as well as promote African regional integration in the wake of attacks on foreign owned businesses in 2015
KPI 5: Support the development of the green economy and jobs through implementing the Green Economy Accord
2 2 3 +1 There was a need to discuss the impact of energy on the industry and how green energy could be utilised to create alternative energy use

Economic Development Department I ANNUAL REPORT 2015 / 201646
PART B – Performance Information
Performance Indicators
Actual achievement
2014/2015
Planned target2015/2016
Actual achievement
2015/2016
Deviation from planned
target to actual achievement for
2015/2016
Comment ondeviations
KPI 6: Facilitate increased access to employment and entrepreneurship for black women and youth in the context of stronger support of emerging and smaller enterprise overall
4 2 4 +2 Two exhibitions at Thaba Moshate and the University of Venda were undertaken to promote youth month, and show case what opportunities are there for young people
KPI 7: Number of spatial, local and provincial initiatives to promote employment, empowerment and development
3 8 9 +1 Additional work on provincial plans was undertaken to align provincial plans to national plans and policies
KPI 8 : Development and support programmes for more effective industrial relations and support for implementation of social accords
4 3 4 +1 Additional work to support and monitor the implementation of social accords
Note: KPI numbering changed in 2015/16 compared to 2014/15
Changes to planned targets
There were no in-year changes to planned targets and indicators for the period under review.
The EDD implemented its APP 2015/16 as tabled in Parliament.
Linking performance with budgets
Expenditure for Programme 2 amounted to R26.7 million or 95.8% of the adjusted programme budget of R27.9 million.
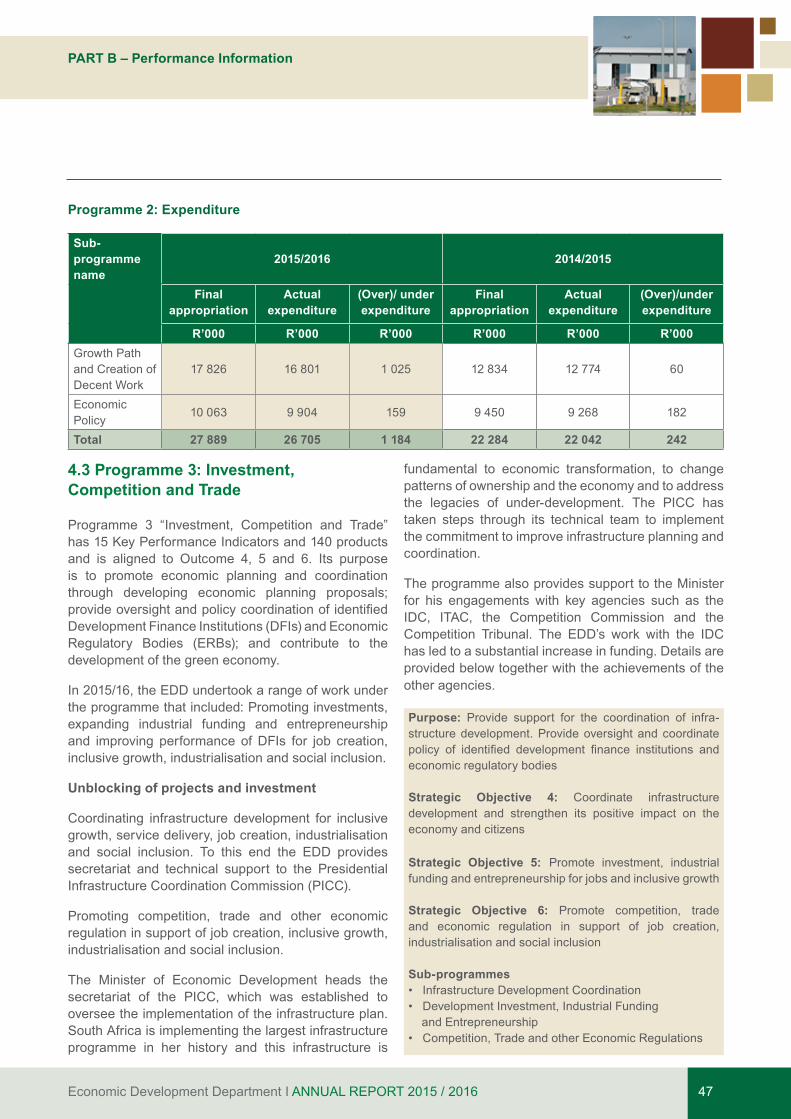
Economic Development Department I ANNUAL REPORT 2015 / 2016 47
PART B – Performance Information
Programme 2: Expenditure
Sub- programme name
2015/2016 2014/2015
Final appropriation
Actualexpenditure
(Over)/ under expenditure
Final appropriation
Actualexpenditure
(Over)/under expenditure
R’000 R’000 R’000 R’000 R’000 R’000Growth Path and Creation of Decent Work
17 826 16 801 1 025 12 834 12 774 60
Economic Policy
10 063 9 904 159 9 450 9 268 182
Total 27 889 26 705 1 184 22 284 22 042 242
4.3 Programme 3: Investment, Competition and Trade
Programme 3 “Investment, Competition and Trade” has 15 Key Performance Indicators and 140 products and is aligned to Outcome 4, 5 and 6. Its purpose is to promote economic planning and coordination through developing economic planning proposals;provideoversightandpolicycoordinationofidentifiedDevelopment Finance Institutions (DFIs) and Economic Regulatory Bodies (ERBs); and contribute to thedevelopment of the green economy.
In 2015/16, the EDD undertook a range of work under the programme that included: Promoting investments, expanding industrial funding and entrepreneurship and improving performance of DFIs for job creation, inclusive growth, industrialisation and social inclusion.
Unblocking of projects and investment
Coordinating infrastructure development for inclusive growth, service delivery, job creation, industrialisation and social inclusion. To this end the EDD provides secretariat and technical support to the Presidential Infrastructure Coordination Commission (PICC).
Promoting competition, trade and other economic regulation in support of job creation, inclusive growth, industrialisation and social inclusion.
The Minister of Economic Development heads the secretariat of the PICC, which was established to oversee the implementation of the infrastructure plan. South Africa is implementing the largest infrastructure programme in her history and this infrastructure is
fundamental to economic transformation, to change patterns of ownership and the economy and to address the legacies of under-development. The PICC has taken steps through its technical team to implement the commitment to improve infrastructure planning and coordination.
The programme also provides support to the Minister for his engagements with key agencies such as the IDC, ITAC, the Competition Commission and the Competition Tribunal. The EDD’s work with the IDC has led to a substantial increase in funding. Details are provided below together with the achievements of the other agencies.
Purpose: Provide support for the coordination of infra-structure development. Provide oversight and coordinate policy of identified development finance institutions andeconomic regulatory bodies Strategic Objective 4: Coordinate infrastructure development and strengthen its positive impact on the economy and citizens
Strategic Objective 5: Promote investment, industrial funding and entrepreneurship for jobs and inclusive growth
Strategic Objective 6: Promote competition, trade and economic regulation in support of job creation, industrialisation and social inclusion
Sub-programmes •InfrastructureDevelopmentCoordination•DevelopmentInvestment,IndustrialFunding and Entrepreneurship•Competition,TradeandotherEconomicRegulations
Economic Development Department I ANNUAL REPORT 2015 / 201648
PART B – Performance Information
Strategic objectives, performance indicators, planned targets and actual achievements
Strategic Objective 4
The Department, through the technical task team of the PICC provided support for the implementation of the National Infrastructure Plan through its work with the Secretariat of the PICC. The PICC drives and coordinates the public infrastructure programme. The EDD support to the PICC in the past year included:
• Technical work on legislation to combat cable and metal theft from public infrastructure
• Facilitating the approval of an USD $180 million loan from the Brazil, Russia, India, China and South Africa (BRICS) New Development Bank to lay transmission lines for the renewable energy plants
• Unblocking, fast-tracking or facilitating the unblocking of 22 infrastructure projects and addressing funding gaps
• The team compiling 72 Cabinet level progress reports on Strategic Integrated Projects
• Providing secretariat and coordination functions for the PICC and 30 Council, Secretariat and Manco meetings
• The team implementing 8 Cabinet decisions related to the rollout of infrastructure, and
• Conductingsitevisitsandverifications.
Strategic Objective 5
The Department promotes investment, industrial funding and entrepreneurship for jobs and inclusive growth.
The EDD prepared an evaluative report on the IDC funding and turnaround times as well as a baseline report on the levels of government and DFI industrial funding. In addition, the Department made the IDC and sefa aware of the results of the research it had undertakenon township enterprisesand the specificfunding requirements they had in relation to DFIs.
The Minister held a number of engagements with IDC’s management and board in order to provide input on its corporate plan and policies; and gave strategicguidanceandensuredimprovementinitsefficiencies.He initiated a meeting with the Chairman of China
Construction Bank that ultimately resulted in the joint investment by the IDC. Lastly, the Minister also attended the IDC’s public release of its Annual Report.
In the 2015/16 year, the IDC approved R14.5 billion (net) of 180 transactions and disbursed R11.4 billion total funding. This marks a record level of approvals for the IDC, and the funding for the year saved and created 15 272 jobs. There has also been a qualitative shift in IDC’s funding – funding for Black Industrialists has increased to R2.9 billion for the year under review fromR2billionthepreviousfinancialyear.Fundingforyouth and women entrepreneurs has tripled from the previousfinancialyeartoR970millionandR1.2billion,respectively.
The IDC signed two important agreements during the year, one for a R10 billion pledge by the China Construction Bank and the second was an agreement with BAIC (Beijing Automotive International Group) to establish an automobile plant in South Africa, which, when it meets its feasibility study criteria, will be the first new light passenger assembly plant to be builtin South Africa in more than 40 years, with an initial capacity to produce about 50 000 cars, trucks and Sport Utility Vehicles (SUVs).
In addition to the work done by the Minister and IDC to promote investment, the Minister and the EDD undertook a range of initiatives to promote and unblock investment. In one high level intervention, the South African Government received H.E. Eng. Sultan bin Saeed Al Mansouri, the Minister of the Economy of the United Arab Emirates (UAE), for meetings between 10 and 12 June, 2015 on the invitation extended to him by the Minister of Economic Development, Mr Ebrahim Patel. Both the UAE and South Africa consider each other to be a strategic trading partner and the visit was intended to help increase levels of trade and investment between the two countries. Minister Mansouri was accompanied by a business delegation consisting of company CEOs, representatives from the UAE ruling families’ business offices and government officials.In addition to meetings between the two Ministers, business-to-business bilaterals were held as well as a CEO roundtable meeting in which the two Ministers had the opportunity to address CEOs of leading South African and the UAE companies.
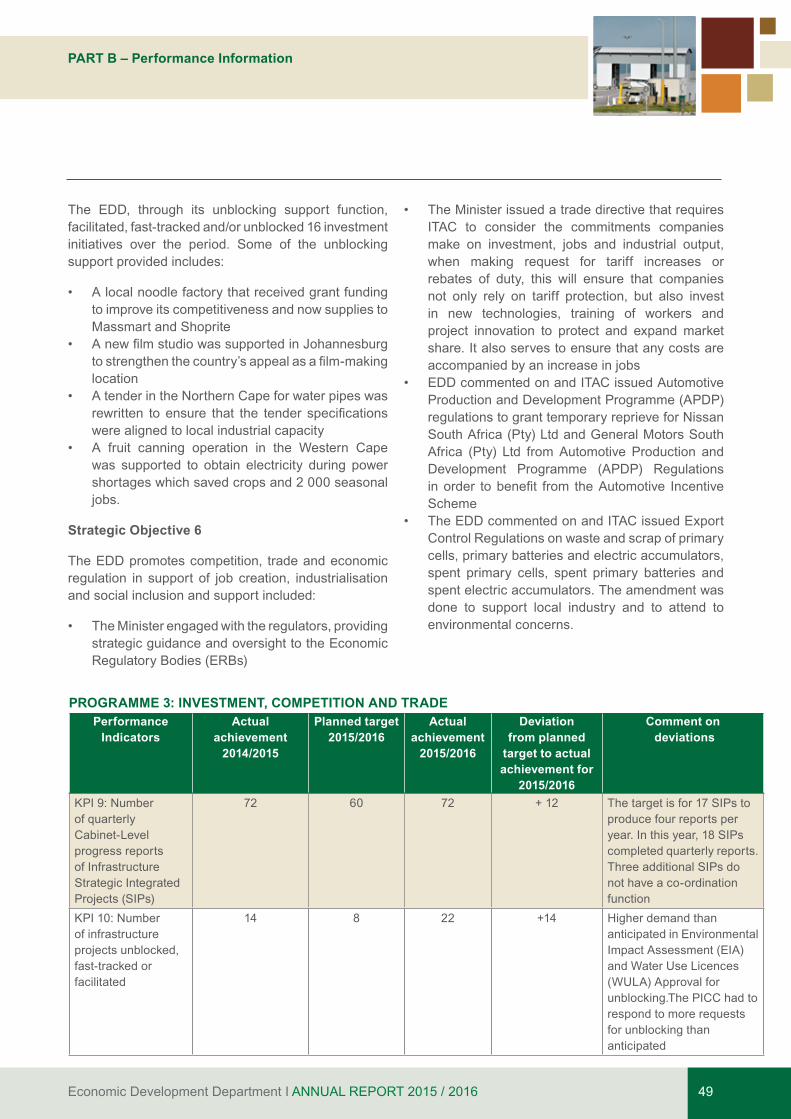
Economic Development Department I ANNUAL REPORT 2015 / 2016 49
PART B – Performance Information
The EDD, through its unblocking support function, facilitated, fast-tracked and/or unblocked 16 investment initiatives over the period. Some of the unblocking support provided includes:
• A local noodle factory that received grant funding to improve its competitiveness and now supplies to Massmart and Shoprite
• AnewfilmstudiowassupportedinJohannesburgtostrengthenthecountry’sappealasafilm-makinglocation
• A tender in the Northern Cape for water pipes was rewritten to ensure that the tender specificationswere aligned to local industrial capacity
• A fruit canning operation in the Western Cape was supported to obtain electricity during power shortages which saved crops and 2 000 seasonal jobs.
Strategic Objective 6
The EDD promotes competition, trade and economic regulation in support of job creation, industrialisation and social inclusion and support included:
• The Minister engaged with the regulators, providing strategic guidance and oversight to the Economic Regulatory Bodies (ERBs)
• The Minister issued a trade directive that requires ITAC to consider the commitments companies make on investment, jobs and industrial output, when making request for tariff increases or rebates of duty, this will ensure that companies not only rely on tariff protection, but also invest in new technologies, training of workers and project innovation to protect and expand market share. It also serves to ensure that any costs are accompanied by an increase in jobs
• EDD commented on and ITAC issued Automotive Production and Development Programme (APDP) regulations to grant temporary reprieve for Nissan South Africa (Pty) Ltd and General Motors South Africa (Pty) Ltd from Automotive Production and Development Programme (APDP) Regulations inorder tobenefit from theAutomotive IncentiveScheme
• The EDD commented on and ITAC issued Export Control Regulations on waste and scrap of primary cells, primary batteries and electric accumulators, spent primary cells, spent primary batteries and spent electric accumulators. The amendment was done to support local industry and to attend to environmental concerns.
PROGRAMME 3: INVESTMENT, COMPETITION AND TRADE Performance
IndicatorsActual
achievement 2014/2015
Planned target2015/2016
Actual achievement
2015/2016
Deviation from planned
target to actual achievement for
2015/2016
Comment on deviations
KPI 9: Number of quarterly Cabinet-Level progress reports of Infrastructure Strategic Integrated Projects (SIPs)
72 60 72 + 12 The target is for 17 SIPs to produce four reports per year. In this year, 18 SIPs completed quarterly reports.Three additional SIPs do not have a co-ordination function
KPI 10: Number of infrastructure projects unblocked, fast-tracked or facilitated
14 8 22 +14 Higher demand than anticipated in Environmental Impact Assessment (EIA) and Water Use Licences (WULA) Approval for unblocking.The PICC had to respond to more requests for unblocking than anticipated
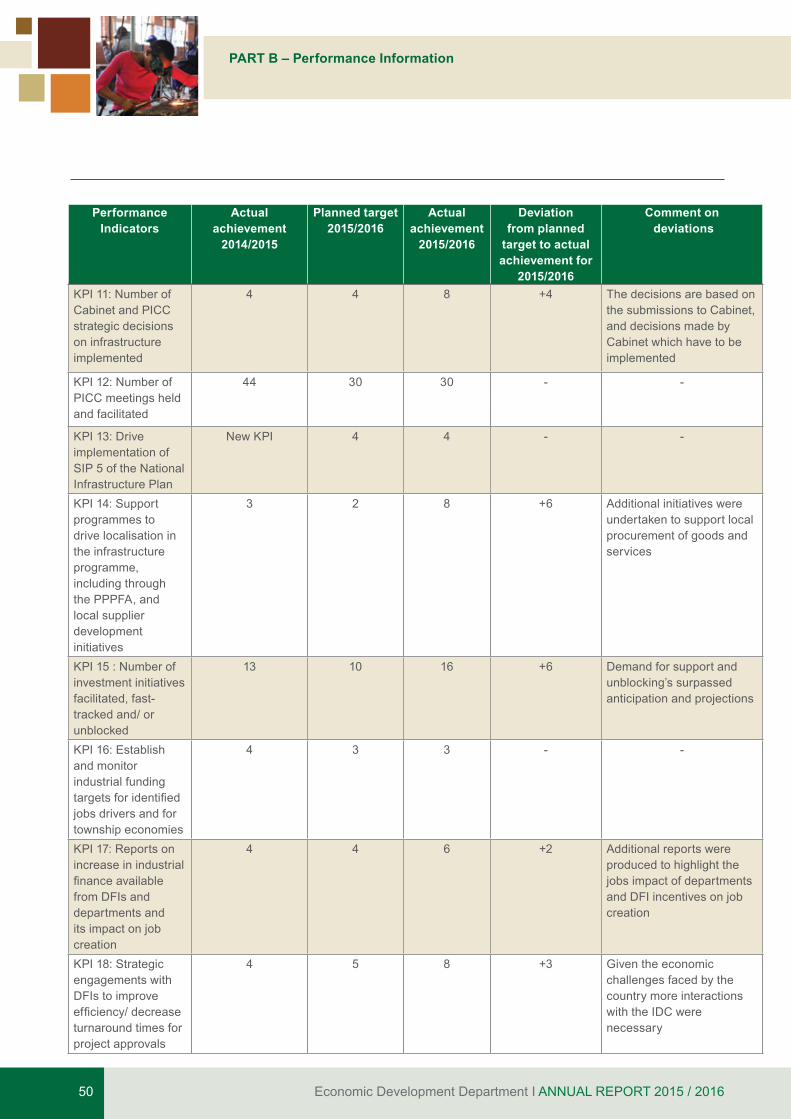
Economic Development Department I ANNUAL REPORT 2015 / 201650
PART B – Performance Information
Performance Indicators
Actual achievement
2014/2015
Planned target2015/2016
Actual achievement
2015/2016
Deviation from planned
target to actual achievement for
2015/2016
Comment on deviations
KPI 11: Number of Cabinet and PICC strategic decisions on infrastructure implemented
4 4 8 +4 The decisions are based on the submissions to Cabinet, and decisions made by Cabinet which have to be implemented
KPI 12: Number of PICC meetings held and facilitated
44 30 30 - -
KPI 13: Drive implementation of SIP 5 of the National Infrastructure Plan
New KPI 4 4 - -
KPI 14: Support programmes to drive localisation in the infrastructure programme, including through the PPPFA, and local supplier development initiatives
3 2 8 +6 Additional initiatives were undertaken to support local procurement of goods and services
KPI 15 : Number of investment initiatives facilitated, fast-tracked and/ or unblocked
13 10 16 +6 Demand for support and unblocking’s surpassed anticipation and projections
KPI 16: Establish and monitor industrial funding targetsforidentifiedjobs drivers and for township economies
4 3 3 - -
KPI 17: Reports on increase in industrial financeavailablefrom DFIs and departments and its impact on job creation
4 4 6 +2 Additional reports were produced to highlight the jobs impact of departments and DFI incentives on job creation
KPI 18: Strategic engagements with DFIs to improve efficiency/decreaseturnaround times for project approvals
4 5 8 +3 Given the economic challenges faced by the country more interactions with the IDC were necessary
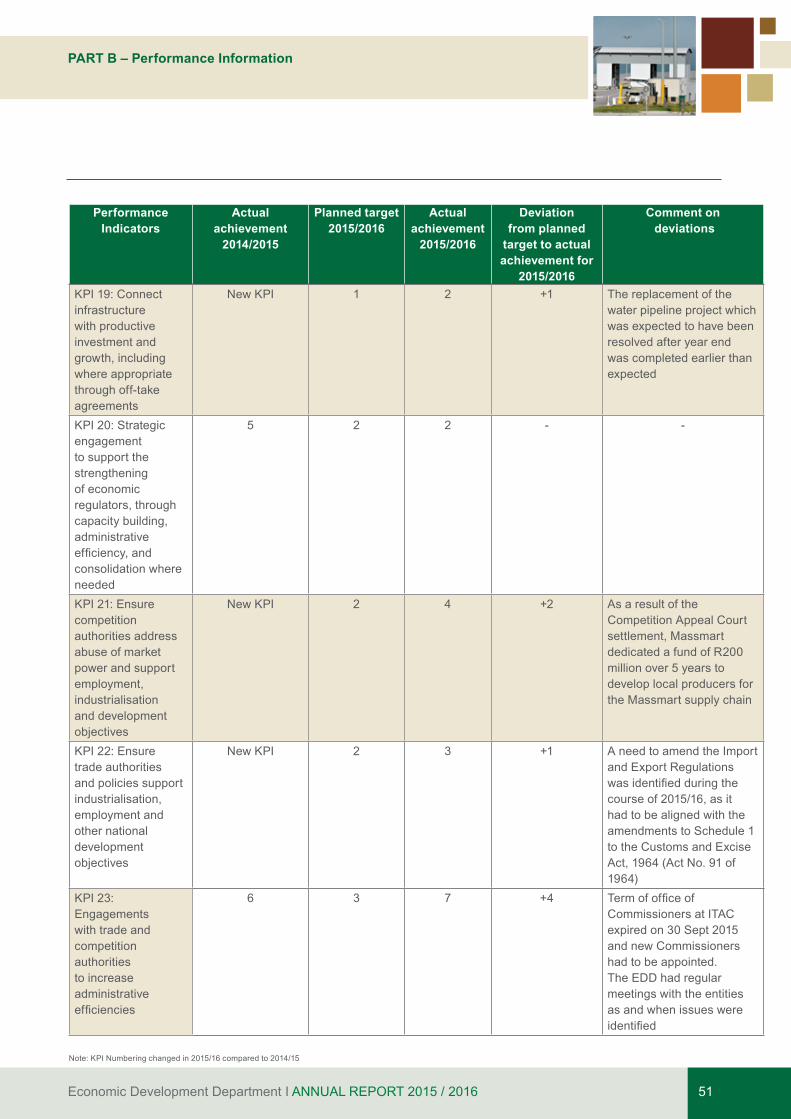
Economic Development Department I ANNUAL REPORT 2015 / 2016 51
PART B – Performance Information
Performance Indicators
Actual achievement
2014/2015
Planned target2015/2016
Actual achievement
2015/2016
Deviation from planned
target to actual achievement for
2015/2016
Comment on deviations
KPI 19: Connect infrastructure with productive investment and growth, including where appropriate through off-take agreements
New KPI 1 2 +1 The replacement of the water pipeline project which was expected to have been resolved after year end was completed earlier than expected
KPI 20: Strategic engagement to support the strengthening of economic regulators, through capacity building, administrative efficiency,andconsolidation where needed
5 2 2 - -
KPI 21: Ensure competition authorities address abuse of market power and support employment, industrialisation and development objectives
New KPI 2 4 +2 As a result of the Competition Appeal Court settlement, Massmart dedicated a fund of R200 million over 5 years to develop local producers for the Massmart supply chain
KPI 22: Ensure trade authorities and policies support industrialisation, employment and other national development objectives
New KPI 2 3 +1 A need to amend the Import and Export Regulations wasidentifiedduringthecourse of 2015/16, as it had to be aligned with the amendments to Schedule 1 to the Customs and Excise Act, 1964 (Act No. 91 of 1964)
KPI 23: Engagements with trade and competition authorities to increase administrative efficiencies
6 3 7 +4 TermofofficeofCommissioners at ITAC expired on 30 Sept 2015 and new Commissioners had to be appointed. The EDD had regular meetings with the entities as and when issues were identified
Note: KPI Numbering changed in 2015/16 compared to 2014/15
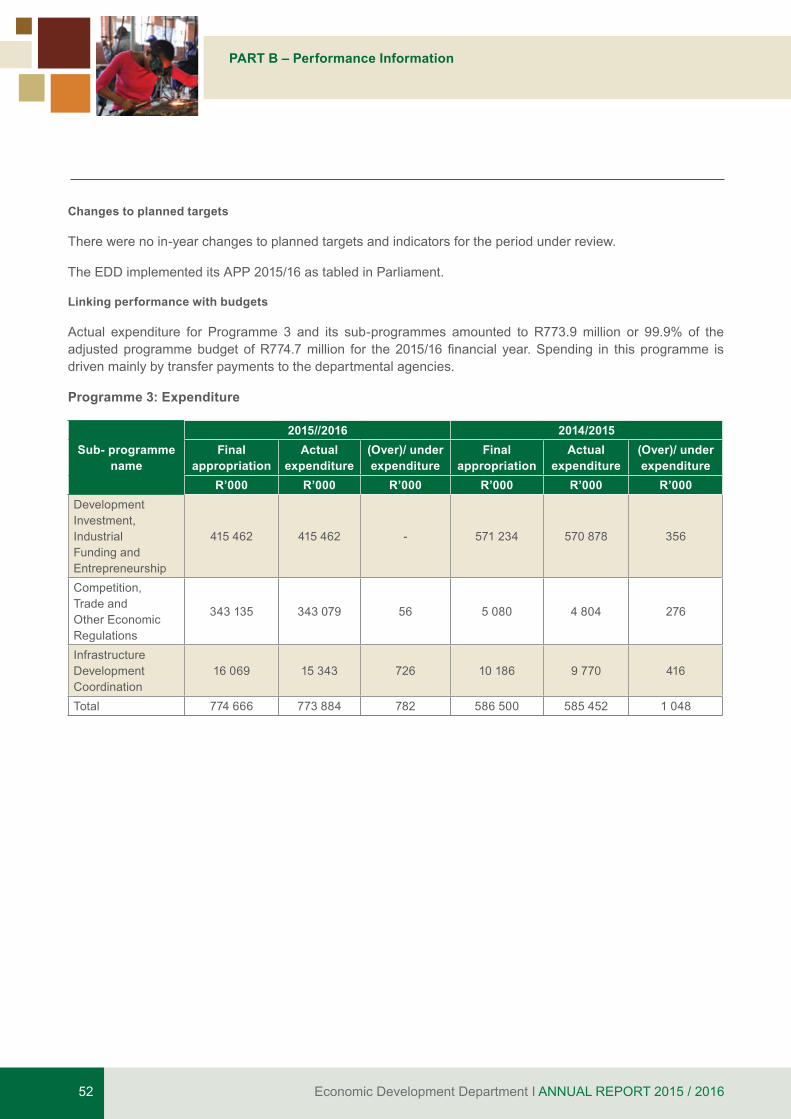
Economic Development Department I ANNUAL REPORT 2015 / 201652
PART B – Performance Information
Changes to planned targets
There were no in-year changes to planned targets and indicators for the period under review.
The EDD implemented its APP 2015/16 as tabled in Parliament.
Linking performance with budgets
Actual expenditure for Programme 3 and its sub-programmes amounted to R773.9 million or 99.9% of the adjustedprogrammebudgetofR774.7million for the2015/16financial year.Spending in thisprogramme isdriven mainly by transfer payments to the departmental agencies.
Programme 3: Expenditure
2015//2016 2014/2015Sub- programme
nameFinal
appropriationActual
expenditure(Over)/ under expenditure
Final appropriation
Actualexpenditure
(Over)/ under expenditure
R’000 R’000 R’000 R’000 R’000 R’000Development Investment, Industrial Funding and Entrepreneurship
415 462 415 462 - 571 234 570 878 356
Competition, Trade and Other Economic Regulations
343 135 343 079 56 5 080 4 804 276
Infrastructure Development Coordination
16 069 15 343 726 10 186 9 770 416
Total 774 666 773 884 782 586 500 585 452 1 048
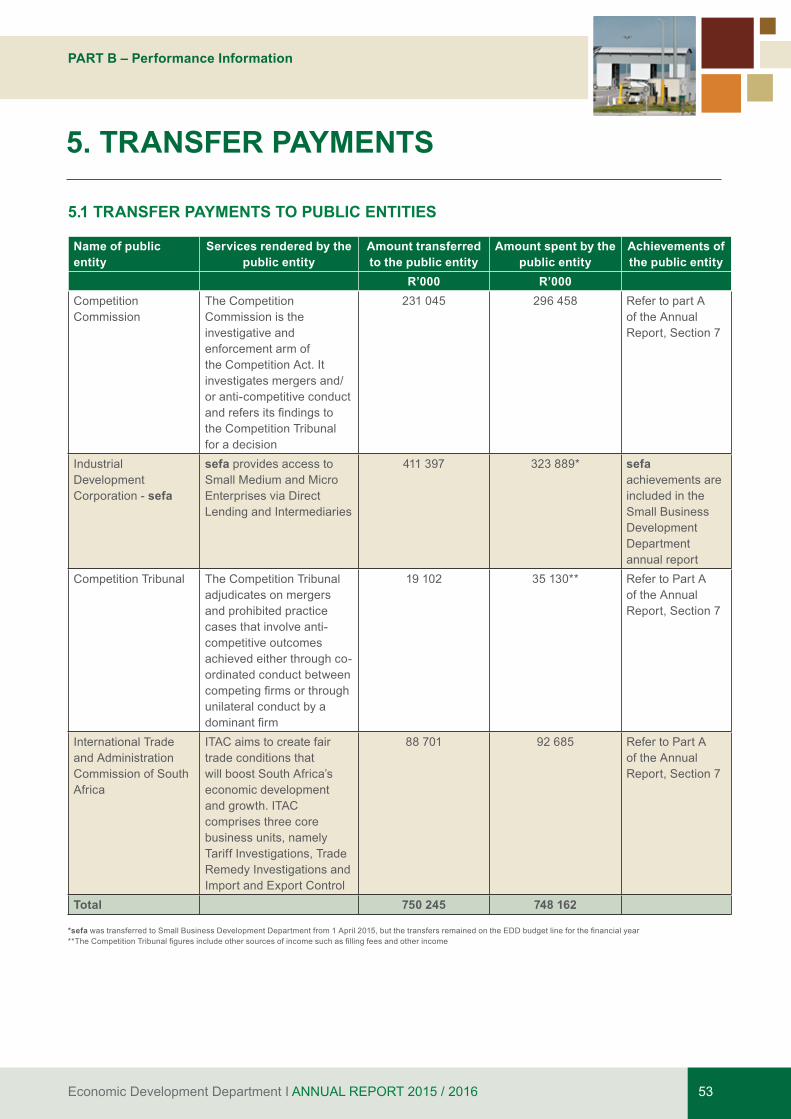
Economic Development Department I ANNUAL REPORT 2015 / 2016 53
PART B – Performance Information
5.1 TRANSFER PAYMENTS TO PUBLIC ENTITIES
Name of public entity
Services rendered by the public entity
Amount transferred to the public entity
Amount spent by the public entity
Achievements of the public entity
R’000 R’000Competition Commission
The Competition Commission is the investigative and enforcement arm of the Competition Act. It investigates mergers and/ or anti-competitive conduct andrefersitsfindingstothe Competition Tribunal for a decision
231 045 296 458 Refer to part A of the Annual Report, Section 7
Industrial Development Corporation - sefa
sefa provides access to Small Medium and Micro Enterprises via Direct Lending and Intermediaries
411 397 323 889* sefa achievements are included in the Small Business Development Department annual report
Competition Tribunal The Competition Tribunal adjudicates on mergers and prohibited practice cases that involve anti-competitive outcomes achieved either through co-ordinated conduct between competingfirmsorthroughunilateral conduct by a dominantfirm
19 102 35 130** Refer to Part A of the Annual Report, Section 7
International Trade and Administration Commission of South Africa
ITAC aims to create fair trade conditions that will boost South Africa’s economic development and growth. ITAC comprises three core business units, namely Tariff Investigations, Trade Remedy Investigations and Import and Export Control
88 701 92 685 Refer to Part A of the Annual Report, Section 7
Total 750 245 748 162
*sefawastransferredtoSmallBusinessDevelopmentDepartmentfrom1April2015,butthetransfersremainedontheEDDbudgetlineforthefinancialyear**TheCompetitionTribunalfiguresincludeothersourcesofincomesuchasfillingfeesandotherincome
5. TRANSFER PAYMENTS
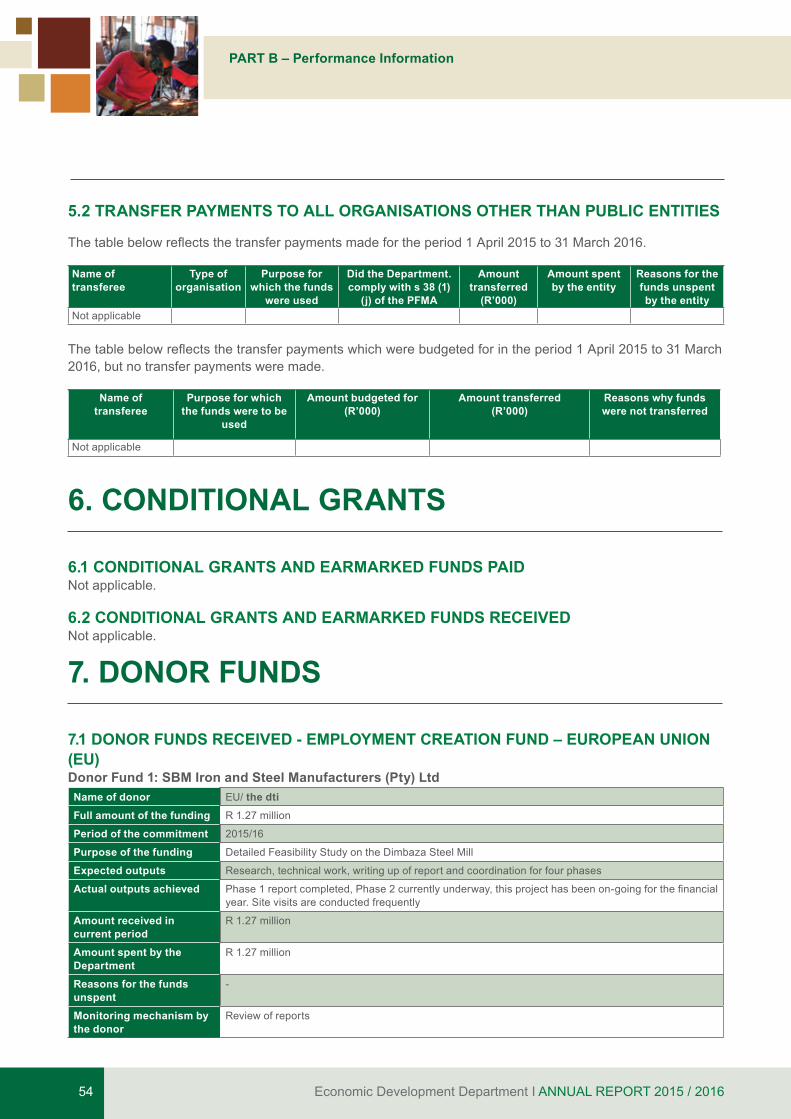
Economic Development Department I ANNUAL REPORT 2015 / 201654
PART B – Performance Information
5.2 TRANSFER PAYMENTS TO ALL ORGANISATIONS OTHER THAN PUBLIC ENTITIES
Thetablebelowreflectsthetransferpaymentsmadefortheperiod1April2015to31March2016.
Name of transferee
Type of organisation
Purpose for which the funds
were used
Did the Department. comply with s 38 (1)
(j) of the PFMA
Amount transferred
(R’000)
Amount spent by the entity
Reasons for the funds unspent by the entity
Not applicable
Thetablebelowreflectsthetransferpaymentswhichwerebudgetedforintheperiod1April2015to31March2016, but no transfer payments were made.
Name of transferee
Purpose for which the funds were to be
used
Amount budgeted for(R’000)
Amount transferred (R’000)
Reasons why funds were not transferred
Not applicable
6. CONDITIONAL GRANTS
6.1 CONDITIONAL GRANTS AND EARMARKED FUNDS PAIDNot applicable.
6.2 CONDITIONAL GRANTS AND EARMARKED FUNDS RECEIVED Not applicable.
7. DONOR FUNDS
7.1 DONOR FUNDS RECEIVED - EMPLOYMENT CREATION FUND – EUROPEAN UNION (EU) Donor Fund 1: SBM Iron and Steel Manufacturers (Pty) LtdName of donor EU/ the dtiFull amount of the funding R 1.27 million
Period of the commitment 2015/16
Purpose of the funding Detailed Feasibility Study on the Dimbaza Steel Mill
Expected outputs Research, technical work, writing up of report and coordination for four phases
Actual outputs achieved Phase1reportcompleted,Phase2currentlyunderway,thisprojecthasbeenon-goingforthefinancialyear. Site visits are conducted frequently
Amount received in current period
R 1.27 million
Amount spent by the Department
R 1.27 million
Reasons for the funds unspent
-
Monitoring mechanism by the donor
Review of reports
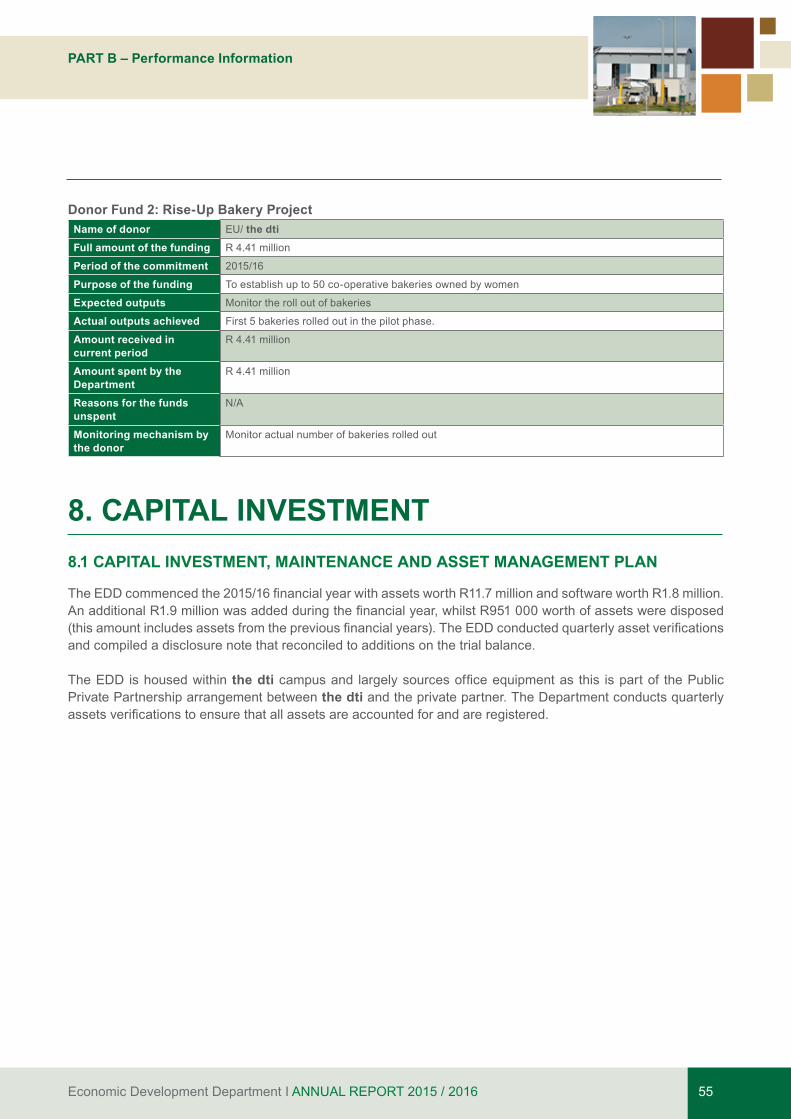
Economic Development Department I ANNUAL REPORT 2015 / 2016 55
PART B – Performance Information
Donor Fund 2: Rise-Up Bakery ProjectName of donor EU/ the dtiFull amount of the funding R 4.41 million
Period of the commitment 2015/16
Purpose of the funding To establish up to 50 co-operative bakeries owned by women
Expected outputs Monitor the roll out of bakeries
Actual outputs achieved First 5 bakeries rolled out in the pilot phase.
Amount received in current period
R 4.41 million
Amount spent by the Department
R 4.41 million
Reasons for the funds unspent
N/A
Monitoring mechanism by the donor
Monitor actual number of bakeries rolled out
8. CAPITAL INVESTMENT 8.1 CAPITAL INVESTMENT, MAINTENANCE AND ASSET MANAGEMENT PLAN
TheEDDcommencedthe2015/16financialyearwithassetsworthR11.7millionandsoftwareworthR1.8million.AnadditionalR1.9millionwasaddedduringthefinancialyear,whilstR951000worthofassetsweredisposed(thisamountincludesassetsfromthepreviousfinancialyears).TheEDDconductedquarterlyassetverificationsand compiled a disclosure note that reconciled to additions on the trial balance.
The EDD is housed within the dti campusand largelysourcesofficeequipmentas this ispartof thePublicPrivate Partnership arrangement between the dti and the private partner. The Department conducts quarterly assetsverificationstoensurethatallassetsareaccountedforandareregistered.

Economic Development Department I ANNUAL REPORT 2015 / 201656
PART B – Performance Information

Economic Development Department I ANNUAL REPORT 2015 / 2016 57
PART B – Performance Information
PART CGovernance

Economic Development Department I ANNUAL REPORT 2015 / 201658
PART C – Governance
1. INTRODUCTION
The commitment by the Department to maintain the highest standards of governance is fundamental to the management of public finances and resources.Users want assurance that the Department has good governancestructuresinplacetoeffectively,efficientlyand economically utilise state resources.
During the period, the EDD introduced systems and processes to enhance its governance processes and ensure that it complied with government policies and regulations. These systems were also meant to assist the Department in addressing audit issues and reduce thenumberoffindings.Theserangedfromcomplianceand administrative processes that were introduced especially within the human resource management as a directorate.
2. RISK MANAGEMENT
The Department has a Risk Management Strategy, a Risk Management Policy which includes procedures and methodologies aligned to the Risk Management Strategy. A Risk Management Implementation Plan is in place as approved by the Director-General during the period under review. The above risk management documents have been aligned to best practice standards, and are applied continuously throughout the Department to improve the risk management culture within the Department. The risk management documentsfurtherenhancetheproactiveidentificationand management of risks as well as the effective implementation of transparent systems for risk management.
The Department’s Risk Management Committee is chaired by an external person from the Department of Trade and Industry and it operates separately from the Audit Committee. Its meetings are held on a quarterly basis. All the critical issues that arise from the Risk Management Committee meetings are escalated and broughttotheattentionoftheAccountingOfficeronaregular basis by the chairperson.
The Department’s Audit Committee continues to play an oversight role regarding risk management processes and systems. It independently monitors management’s implementation of the risk management processes and
systems based on reports it receives from the Risk Management Committee.
The Department continues to manage the risks emanating from its strategic choices, and noticeable progress has been seen through the achievement of targetsandkeyperformanceindicatorsidentifiedintheAnnual Performance Plan. 3. FRAUD AND CORRUPTION
The EDD has an approved fraud prevention plan as well as related fraud prevention policies and procedures in place. These are implemented on an on-going basis throughout the Department.
The EDD has a Whistle-blowing Policy in place which is communicated to all officials during the inductionprogramme in the Department to make them aware of the procedures to be followed when making confidential disclosures or reporting suspected fraudand corruption incidents. The policy provides that disciplinary procedures be instituted against defaulters if they are found guilty of fraud.
4. MINIMISING CONFLICT OF INTEREST
Employeesaregivencopiesofthefinancialdisclosureforms to complete and these form part of the employee appointment pack. Senior Management Service (SMS) members are also required to submit financiale-disclosuresinAprilofeachyear.Financiale-disclosures are analysed, verified against theCompanies and Intellectual Property Commission (CIPC)database.Wherediscrepanciesareidentified,relevant employees are requested to provide reasons in writing for the discrepancies for the Minister’s decision.
All employees (SMS and Non-SMS) are also advised during the induction programme to apply for remunerative work outside the public service when they contemplate doing so. Senior Management Services members are also required to disclose their contemplation of doing other remunerative work when submitting their e-disclosures in April of each year.
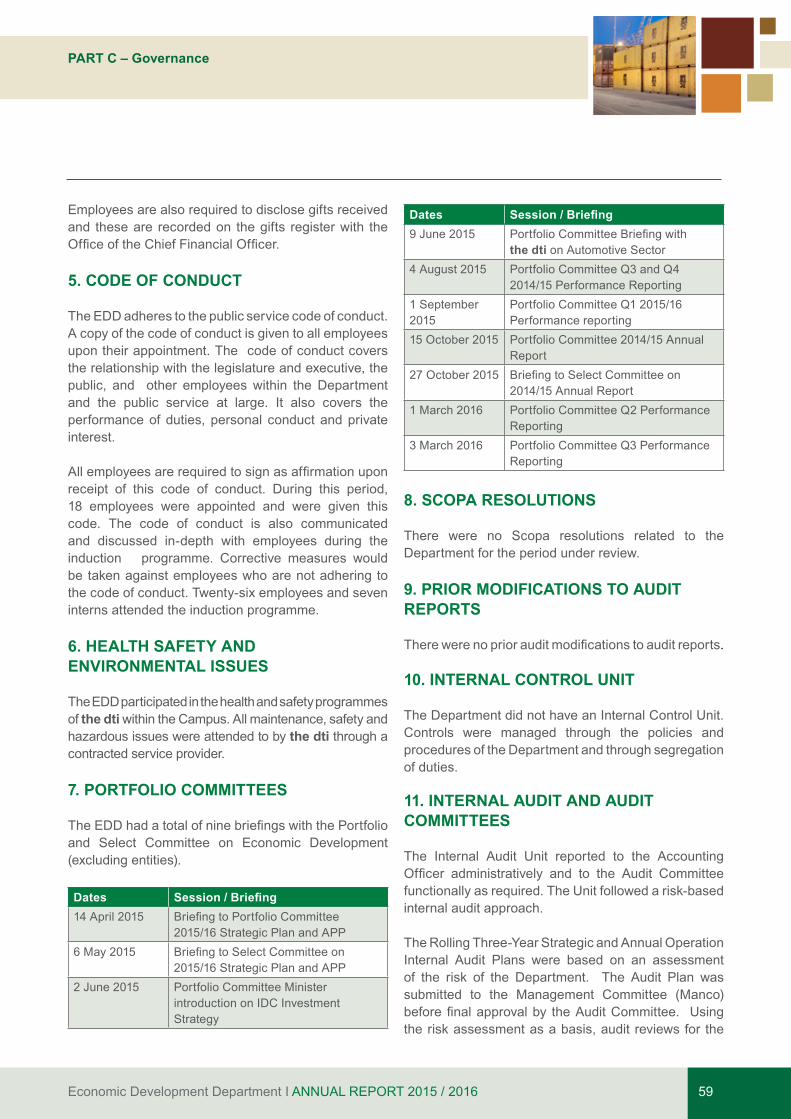
Economic Development Department I ANNUAL REPORT 2015 / 2016 59
PART C – Governance
Employees are also required to disclose gifts received and these are recorded on the gifts register with the OfficeoftheChiefFinancialOfficer.
5. CODE OF CONDUCT
The EDD adheres to the public service code of conduct. A copy of the code of conduct is given to all employees upon their appointment. The code of conduct covers the relationship with the legislature and executive, the public, and other employees within the Department and the public service at large. It also covers the performance of duties, personal conduct and private interest.
Allemployeesarerequiredtosignasaffirmationuponreceipt of this code of conduct. During this period, 18 employees were appointed and were given this code. The code of conduct is also communicated and discussed in-depth with employees during the induction programme. Corrective measures would be taken against employees who are not adhering to the code of conduct. Twenty-six employees and seven interns attended the induction programme. 6. HEALTH SAFETY AND ENVIRONMENTAL ISSUES
The EDD participated in the health and safety programmes of the dti within the Campus. All maintenance, safety and hazardous issues were attended to by the dti through a contracted service provider.
7. PORTFOLIO COMMITTEES
TheEDDhadatotalofninebriefingswiththePortfolioand Select Committee on Economic Development (excluding entities). Dates Session / Briefing 14 April 2015 BriefingtoPortfolioCommittee
2015/16 Strategic Plan and APP6 May 2015 BriefingtoSelectCommitteeon
2015/16 Strategic Plan and APP2 June 2015 Portfolio Committee Minister
introduction on IDC Investment Strategy
Dates Session / Briefing 9 June 2015 PortfolioCommitteeBriefingwith
the dti on Automotive Sector4 August 2015 Portfolio Committee Q3 and Q4
2014/15 Performance Reporting1 September 2015
Portfolio Committee Q1 2015/16 Performance reporting
15 October 2015 Portfolio Committee 2014/15 Annual Report
27 October 2015 BriefingtoSelectCommitteeon2014/15 Annual Report
1 March 2016 Portfolio Committee Q2 Performance Reporting
3 March 2016 Portfolio Committee Q3 Performance Reporting
8. SCOPA RESOLUTIONS
There were no Scopa resolutions related to the Department for the period under review. 9. PRIOR MODIFICATIONS TO AUDIT REPORTS
Therewerenopriorauditmodificationstoauditreports. 10. INTERNAL CONTROL UNIT
The Department did not have an Internal Control Unit. Controls were managed through the policies and procedures of the Department and through segregation of duties.
11. INTERNAL AUDIT AND AUDIT COMMITTEES
The Internal Audit Unit reported to the Accounting Officer administratively and to the Audit Committeefunctionally as required. The Unit followed a risk-based internal audit approach.
The Rolling Three-Year Strategic and Annual Operation Internal Audit Plans were based on an assessment of the risk of the Department. The Audit Plan was submitted to the Management Committee (Manco) beforefinalapprovalby theAuditCommittee. Usingthe risk assessment as a basis, audit reviews for the
Economic Development Department I ANNUAL REPORT 2015 / 201660
PART C – Governance
12. AUDIT COMMITTEE REPORT
Wearepleasedtopresentourreportforthefinancialyear ended 31 March 2016.
Audit Committee Members and Attendance
The Audit Committee is required to meet at least four times per annum as per its approved terms of reference. During the year under review, four (4) meetings were held.
Audit Committee Responsibility
The Audit Committee reports that it has complied with its responsibilities arising from section 38(1)(a) of the PFMA and Treasury Regulations 3.1.13. The Audit Committee also reports that it has appropriate Terms of Reference as its Audit Committee Charter, has regulated its affairs in compliance with this Charter and has discharged all its responsibilities as contained therein. The Audit Committee reports that, during the year under review, it was presented with regular quarterly management reports to enable them to:• Monitortheintegrity,accuracyandreliabilityofthe
Department’sfinancialinformation;and
• Review all material information presented to theCommittee.
For the financial year ended 31 March 2016, theAudit Committee was presented with the following information for review:
• TheAnnualFinancialStatements,andmadecertainrecommendations for improvement
• AllquarterlyFinancialStatements• Unaudited Annual Financial Statements before
submission to the Auditor-General South Africa (AGSA) on 31 May 2016
• The management letter of the AGSA related tothe audit of the final 2015/16 Annual FinancialStatements
• The appropriateness of accounting policies,practices and potential changes
• Theeffectivenessofthesystemofriskmanagement,including emerging risks
• Compliancewithrelevantlawsandregulations• TheAnnualReport andpredeterminedobjectives
prior to submission to the AGSA and finalpublication, and
year included performance information, operational, financial,complianceandfollow-upauditreviews.
The Audit Committee comprised three (3) independent non-executive members, who operated in accordance with their approved charter. The Audit Committee had four (4) meetings during the year under review and
played an essential part in the Department’s corporate reporting processes in relation to both financial andnon-financial performance reporting. The Auditor-General South Africa, National Treasury, Internal Audit and the Accounting Officer were invited, amongstothers, to attend the meetings.
The table below discloses relevant information on the audit committee members:Name Qualifications Internal or
externalIf internal,
position in the department
Date appointed
No. of Meetings attended
Mr S Simelane •B.Com(Accounting)•B.Com(Hons)•MBA
External N/A 03/03/2014 4
Prof. DP van der Nest
•B.Comm(Accountancy)•B.Com(Hons)Economics•M.Com(Economics)•DoctorTechnologiae
External N/A 03/03/2014 4
Mr M Dukander •B.Com(Accounting)•B.Compt(Hons)•PostGraduateDiplomainAuditing
External N/A 03/03/2014 3
Economic Development Department I ANNUAL REPORT 2015 / 2016 61
PART C – Governance
• Theplans,workand reportsof InternalAuditandthe AGSA. The Audit Committee also conducted several independent meetings with the assurance providers.
The Effectiveness of Internal Control
The systems of internal control are designed to provide cost effective assurance that assets are safeguarded and that liabilities and working capital are efficientlymanaged.
Internal Audit provides the Audit Committee and management with assurance that the controls are appropriate and effective. This is achieved by means of an appropriate quarterly reporting process, as well astheidentificationofcorrectiveactionandsuggestedenhancements to the controls and processes. Risk Management Committee monitors and oversees the controlofriskidentificationthroughouttheDepartment.Risk management is a standing agenda item in the Audit Committee meetings and the Chair of the Risk Management Committee provides feedback on this process.
The system of internal control and the concomitant control environment were reasonably effective as attested by the various Internal Audit reports and those of the AGSA. There has also been some improvement within Human Resources, however more work is required within the areas of Supply Chain Management, Information Technology and the drafting of predetermined objectives and performance information included in the Annual Performance Plan. The Information Communication Technology (ICT) Steering Committee continued its work during the year. An ICT Framework, Charter and Policy were drafted and approved during the year and progress in terms of compliance will be monitored and reported on to further increase improvement in the ICT control environment.The Audit Committee has considered management’s
responses to address matters and to facilitate corrective actions, improvements and monitoring the controls and procedures where findings wereidentified.Implementationofsuchcorrectiveactionsismonitored through an audit heat map report and the follow-up reports submitted to the Audit Committee on a regular basis.
Internal Audit
The Committee has ensured that the Internal Audit function was independent and had necessary resources, standing and authority within the Department to enable it to effectively and efficientlydischarge its duties and that it has addressed the risks pertinent to the Department in its audit assignments. Furthermore, the Committee oversaw cooperation between the Internal Audit and External Auditors.
Evaluation of Financial Statements
The Audit Committee has evaluated the Department’s financial statements for the year ended 31 March2016 and concluded that there were no material misstatements, and this concurs with and accepts the conclusion of the AGSA on the Annual Financial Statements.
Prepared by:
Mr Sakhiseni SimelaneChairperson of the Audit Committee31 July 2016
Economic Development Department I ANNUAL REPORT 2015 / 201662
PART B – Performance Information
Economic Development Department I ANNUAL REPORT 2015 / 2016 63
PART B – Performance Information
PART DHuman Resource Management
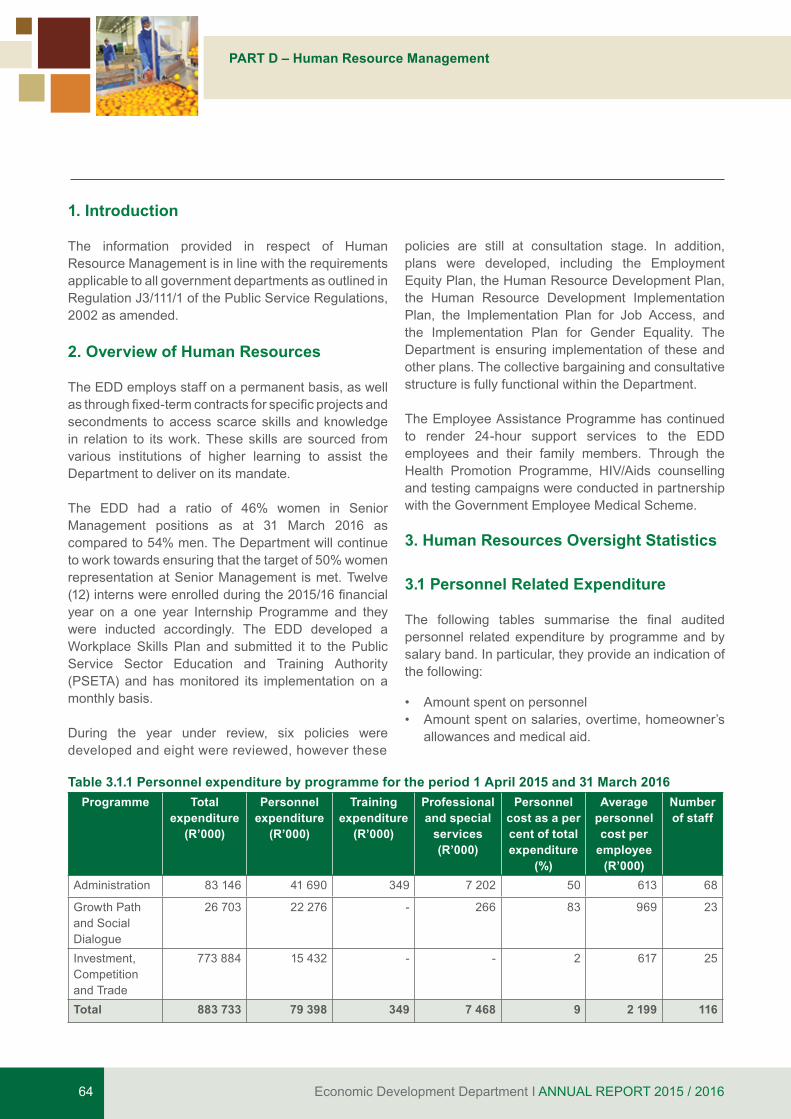
Economic Development Department I ANNUAL REPORT 2015 / 201664
PART D – Human Resource Management
1. Introduction
The information provided in respect of Human Resource Management is in line with the requirements applicable to all government departments as outlined in Regulation J3/111/1 of the Public Service Regulations, 2002 as amended.
2. Overview of Human Resources
The EDD employs staff on a permanent basis, as well asthroughfixed-termcontractsforspecificprojectsandsecondments to access scarce skills and knowledge in relation to its work. These skills are sourced from various institutions of higher learning to assist the Department to deliver on its mandate.
The EDD had a ratio of 46% women in Senior Management positions as at 31 March 2016 as compared to 54% men. The Department will continue to work towards ensuring that the target of 50% women representation at Senior Management is met. Twelve (12)internswereenrolledduringthe2015/16financialyear on a one year Internship Programme and they were inducted accordingly. The EDD developed a Workplace Skills Plan and submitted it to the Public Service Sector Education and Training Authority (PSETA) and has monitored its implementation on a monthly basis.
During the year under review, six policies were developed and eight were reviewed, however these
policies are still at consultation stage. In addition, plans were developed, including the Employment Equity Plan, the Human Resource Development Plan, the Human Resource Development Implementation Plan, the Implementation Plan for Job Access, and the Implementation Plan for Gender Equality. The Department is ensuring implementation of these and other plans. The collective bargaining and consultative structure is fully functional within the Department.
The Employee Assistance Programme has continued to render 24-hour support services to the EDD employees and their family members. Through the Health Promotion Programme, HIV/Aids counselling and testing campaigns were conducted in partnership with the Government Employee Medical Scheme.
3. Human Resources Oversight Statistics
3.1 Personnel Related Expenditure
The following tables summarise the final auditedpersonnel related expenditure by programme and by salary band. In particular, they provide an indication of the following:
• Amountspentonpersonnel• Amountspentonsalaries,overtime,homeowner’s
allowances and medical aid.
Table 3.1.1 Personnel expenditure by programme for the period 1 April 2015 and 31 March 2016Programme Total
expenditure (R’000)
Personnel expenditure
(R’000)
Training expenditure
(R’000)
Professional and special
services (R’000)
Personnel cost as a per cent of total expenditure
(%)
Average personnel cost per
employee (R’000)
Number of staff
Administration 83 146 41 690 349 7 202 50 613 68
Growth Path and Social Dialogue
26 703 22 276 - 266 83 969 23
Investment, Competition and Trade
773 884 15 432 - - 2 617 25
Total 883 733 79 398 349 7 468 9 2 199 116

Economic Development Department I ANNUAL REPORT 2015 / 2016 65
PART D – Human Resource Management
Table 3.1.2 Personnel costs by salary band for the period 1 April 2015 and 31 March 2016Salary bands Personnel
expenditure (R’000)
% of total personnel costs
Average personnel cost per employee
(R’000)
No of employees
Skilled (Levels 3-5) 1 231 2 205 6
Highly skilled production (Levels 6-8)
9 132 12 326 28
Highly skilled supervision (Levels 9-12)
23 859 30 645 37
Senior management (Levels 13-16)
36 142 46 1 095 33
Contract (Levels 3-5) 654 1 327 2
Contract (Levels 6-8) 744 1 248 3
Contract (Levels 9-12) 3 076 4 615 5
Contract (Levels 13-16) 4 560 6 2 280 2
Total 79 398 100 684 116
Table 3.1.3 Salaries, Overtime, Home Owners Allowance (HOA) and Medical Aid by programme for the period 1 April 2015 and 31 March 2016
Programme Salaries Overtime Home Owners Allowance
Medical assistance
Total personnel cost per
programme(R’000)
Amount (R’000)
Salaries as a % of personnel
cost
Amount (R’000)
Overtime as a % of personnel
cost
Amount (R’000)
HOA as a % of
personnel cost
Amount (R’000)
Medical assistance as a % of personnel
costAdministration 41 690 26 920 65 764 2 732 2 972 2
Growth Path and Social Dialogue
22 276 14 805 67 28 0 84 0 390 2
Investment, Competition and Trade
15 432 11 223 73 4 0.0 40 0 192 1
Total 79 398 52 948 67 796 1 856 1 1 554 2
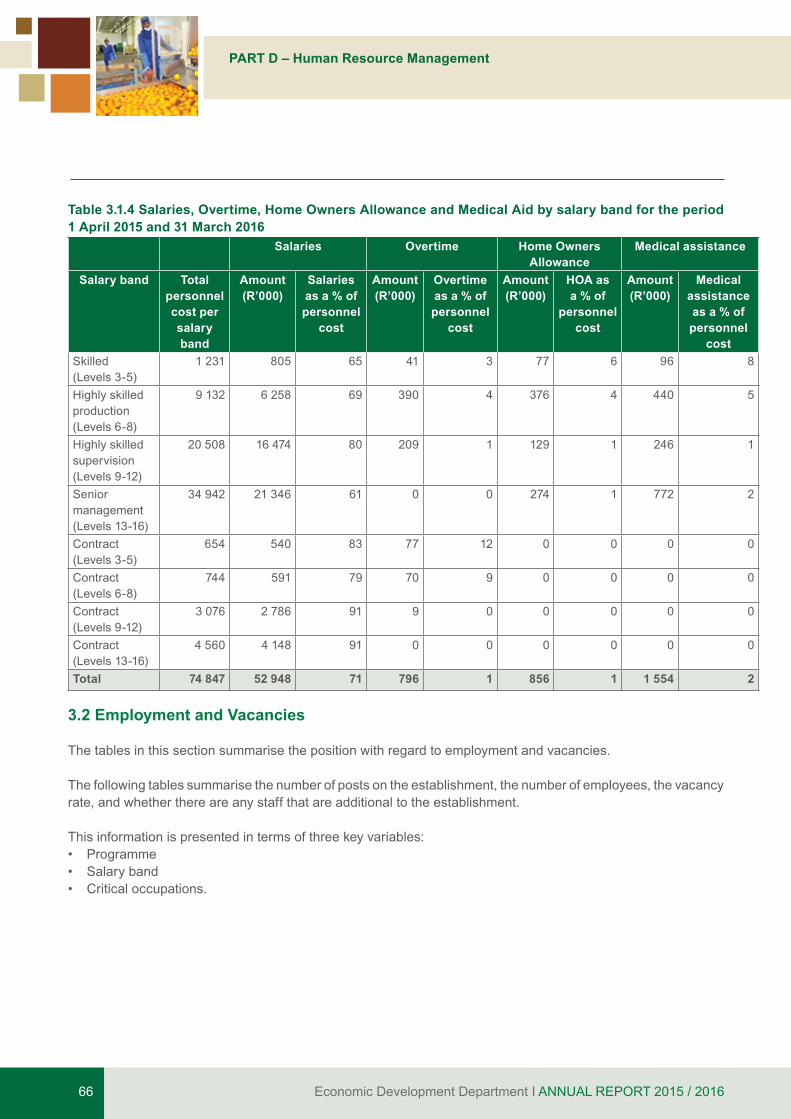
Economic Development Department I ANNUAL REPORT 2015 / 201666
PART D – Human Resource Management
Table 3.1.4 Salaries, Overtime, Home Owners Allowance and Medical Aid by salary band for the period 1 April 2015 and 31 March 2016
Salaries Overtime Home Owners Allowance
Medical assistance
Salary band Total personnel cost per salary band
Amount (R’000)
Salaries as a % of personnel
cost
Amount (R’000)
Overtime as a % of personnel
cost
Amount (R’000)
HOA as a % of
personnel cost
Amount (R’000)
Medical assistance as a % of personnel
costSkilled (Levels 3-5)
1 231 805 65 41 3 77 6 96 8
Highly skilled production (Levels 6-8)
9 132 6 258 69 390 4 376 4 440 5
Highly skilled supervision (Levels 9-12)
20 508 16 474 80 209 1 129 1 246 1
Senior management (Levels 13-16)
34 942 21 346 61 0 0 274 1 772 2
Contract (Levels 3-5)
654 540 83 77 12 0 0 0 0
Contract (Levels 6-8)
744 591 79 70 9 0 0 0 0
Contract (Levels 9-12)
3 076 2 786 91 9 0 0 0 0 0
Contract (Levels 13-16)
4 560 4 148 91 0 0 0 0 0 0
Total 74 847 52 948 71 796 1 856 1 1 554 2
3.2 Employment and Vacancies
The tables in this section summarise the position with regard to employment and vacancies.
The following tables summarise the number of posts on the establishment, the number of employees, the vacancy rate, and whether there are any staff that are additional to the establishment.
This information is presented in terms of three key variables:• Programme• Salaryband• Criticaloccupations.
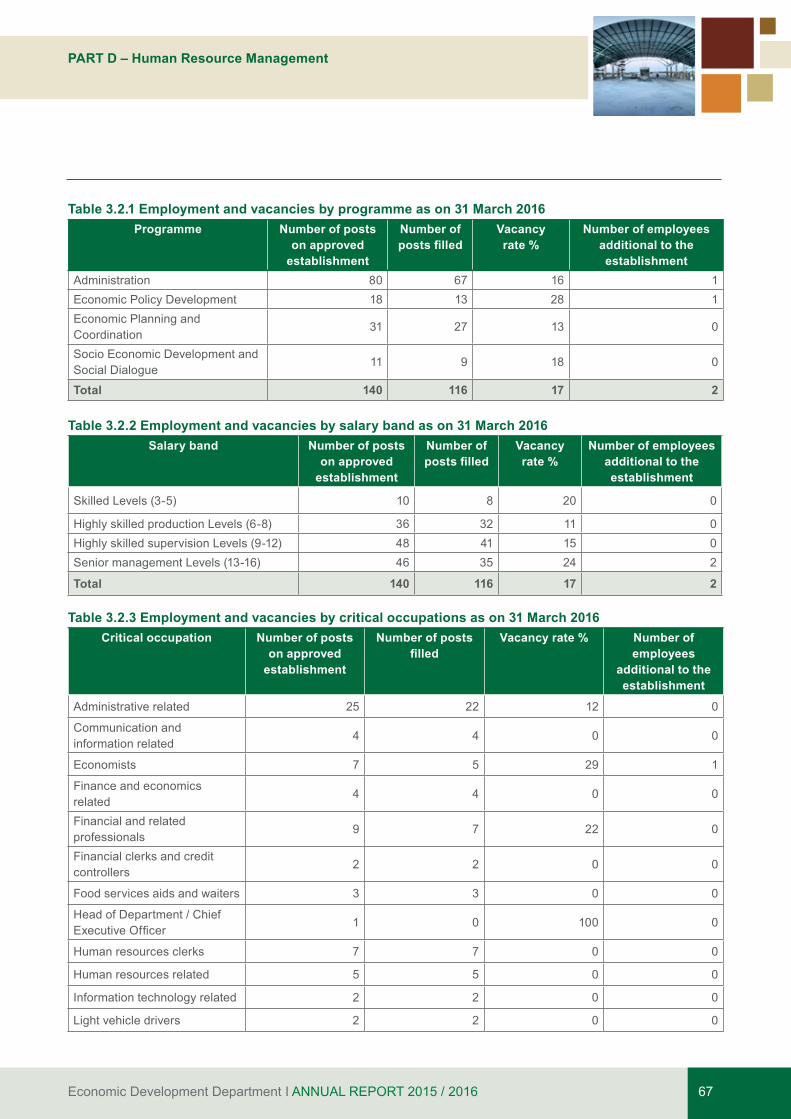
Economic Development Department I ANNUAL REPORT 2015 / 2016 67
PART D – Human Resource Management
Table 3.2.1 Employment and vacancies by programme as on 31 March 2016Programme Number of posts
on approved establishment
Number of posts filled
Vacancy rate %
Number of employees additional to the establishment
Administration 80 67 16 1Economic Policy Development 18 13 28 1Economic Planning and Coordination
31 27 13 0
Socio Economic Development and Social Dialogue
11 9 18 0
Total 140 116 17 2
Table 3.2.2 Employment and vacancies by salary band as on 31 March 2016Salary band Number of posts
on approved establishment
Number of posts filled
Vacancy rate %
Number of employees additional to the establishment
Skilled Levels (3-5) 10 8 20 0
Highly skilled production Levels (6-8) 36 32 11 0Highly skilled supervision Levels (9-12) 48 41 15 0Senior management Levels (13-16) 46 35 24 2
Total 140 116 17 2
Table 3.2.3 Employment and vacancies by critical occupations as on 31 March 2016Critical occupation Number of posts
on approved establishment
Number of posts filled
Vacancy rate % Number of employees
additional to the establishment
Administrative related 25 22 12 0
Communication and information related
4 4 0 0
Economists 7 5 29 1
Finance and economics related
4 4 0 0
Financial and related professionals
9 7 22 0
Financial clerks and credit controllers
2 2 0 0
Food services aids and waiters 3 3 0 0
Head of Department / Chief ExecutiveOfficer
1 0 100 0
Human resources clerks 7 7 0 0
Human resources related 5 5 0 0
Information technology related 2 2 0 0
Light vehicle drivers 2 2 0 0
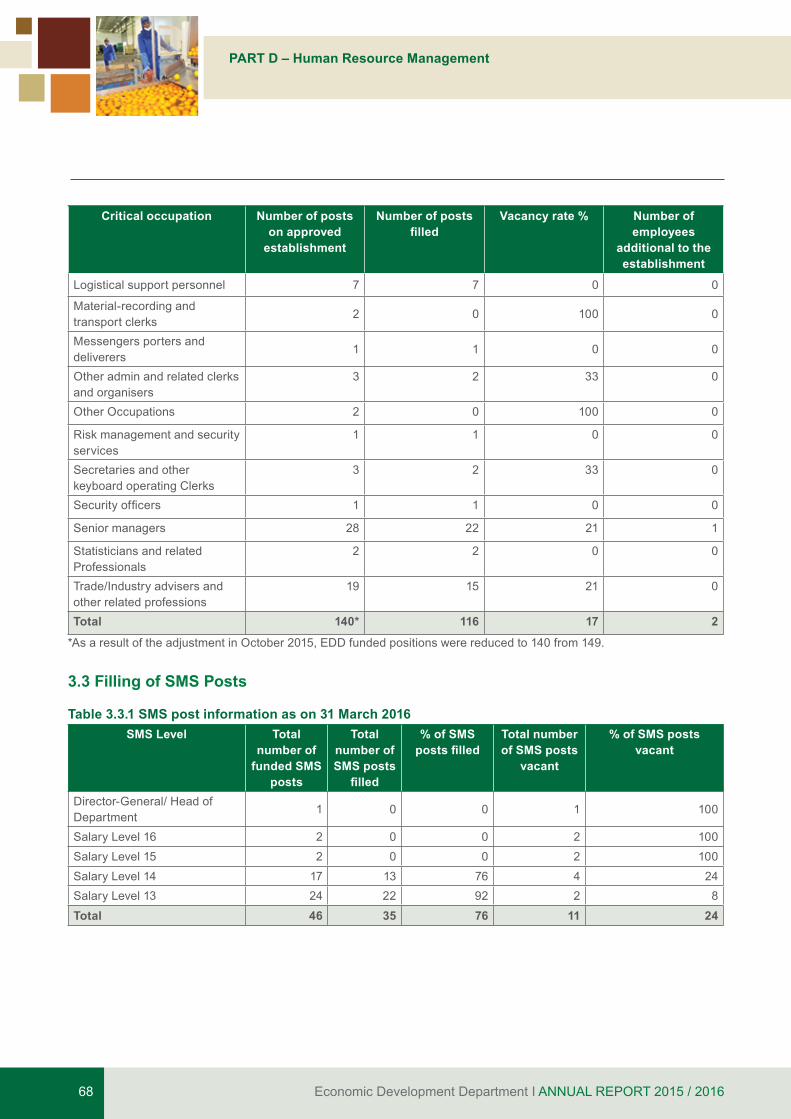
Economic Development Department I ANNUAL REPORT 2015 / 201668
PART D – Human Resource Management
Critical occupation Number of posts on approved
establishment
Number of posts filled
Vacancy rate % Number of employees
additional to the establishment
Logistical support personnel 7 7 0 0
Material-recording and transport clerks
2 0 100 0
Messengers porters and deliverers
1 1 0 0
Other admin and related clerks and organisers
3 2 33 0
Other Occupations 2 0 100 0
Risk management and security services
1 1 0 0
Secretaries and other keyboard operating Clerks
3 2 33 0
Securityofficers 1 1 0 0
Senior managers 28 22 21 1
Statisticians and related Professionals
2 2 0 0
Trade/Industry advisers and other related professions
19 15 21 0
Total 140* 116 17 2
*As a result of the adjustment in October 2015, EDD funded positions were reduced to 140 from 149.
3.3 Filling of SMS Posts
Table 3.3.1 SMS post information as on 31 March 2016SMS Level Total
number of funded SMS
posts
Total number of SMS posts
filled
% of SMS posts filled
Total number of SMS posts
vacant
% of SMS posts vacant
Director-General/ Head of Department
1 0 0 1 100
Salary Level 16 2 0 0 2 100Salary Level 15 2 0 0 2 100Salary Level 14 17 13 76 4 24Salary Level 13 24 22 92 2 8
Total 46 35 76 11 24
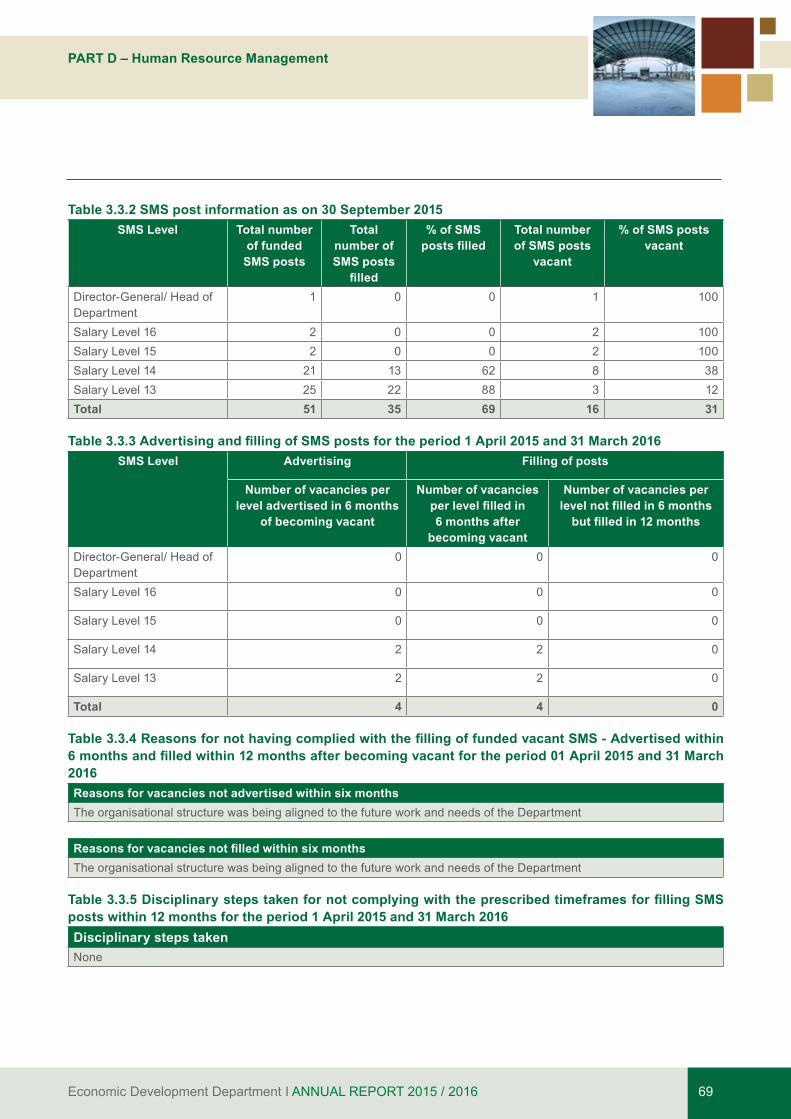
Economic Development Department I ANNUAL REPORT 2015 / 2016 69
PART D – Human Resource Management
Table 3.3.2 SMS post information as on 30 September 2015SMS Level Total number
of funded SMS posts
Total number of SMS posts
filled
% of SMS posts filled
Total number of SMS posts
vacant
% of SMS posts vacant
Director-General/ Head of Department
1 0 0 1 100
Salary Level 16 2 0 0 2 100Salary Level 15 2 0 0 2 100Salary Level 14 21 13 62 8 38Salary Level 13 25 22 88 3 12Total 51 35 69 16 31
Table 3.3.3 Advertising and filling of SMS posts for the period 1 April 2015 and 31 March 2016SMS Level Advertising Filling of posts
Number of vacancies per level advertised in 6 months
of becoming vacant
Number of vacancies per level filled in 6 months after
becoming vacant
Number of vacancies per level not filled in 6 months
but filled in 12 months
Director-General/ Head of Department
0 0 0
Salary Level 16 0 0 0
Salary Level 15 0 0 0
Salary Level 14 2 2 0
Salary Level 13 2 2 0
Total 4 4 0
Table 3.3.4 Reasons for not having complied with the filling of funded vacant SMS - Advertised within 6 months and filled within 12 months after becoming vacant for the period 01 April 2015 and 31 March 2016Reasons for vacancies not advertised within six monthsThe organisational structure was being aligned to the future work and needs of the Department
Reasons for vacancies not filled within six monthsThe organisational structure was being aligned to the future work and needs of the Department
Table 3.3.5 Disciplinary steps taken for not complying with the prescribed timeframes for filling SMS posts within 12 months for the period 1 April 2015 and 31 March 2016Disciplinary steps taken None
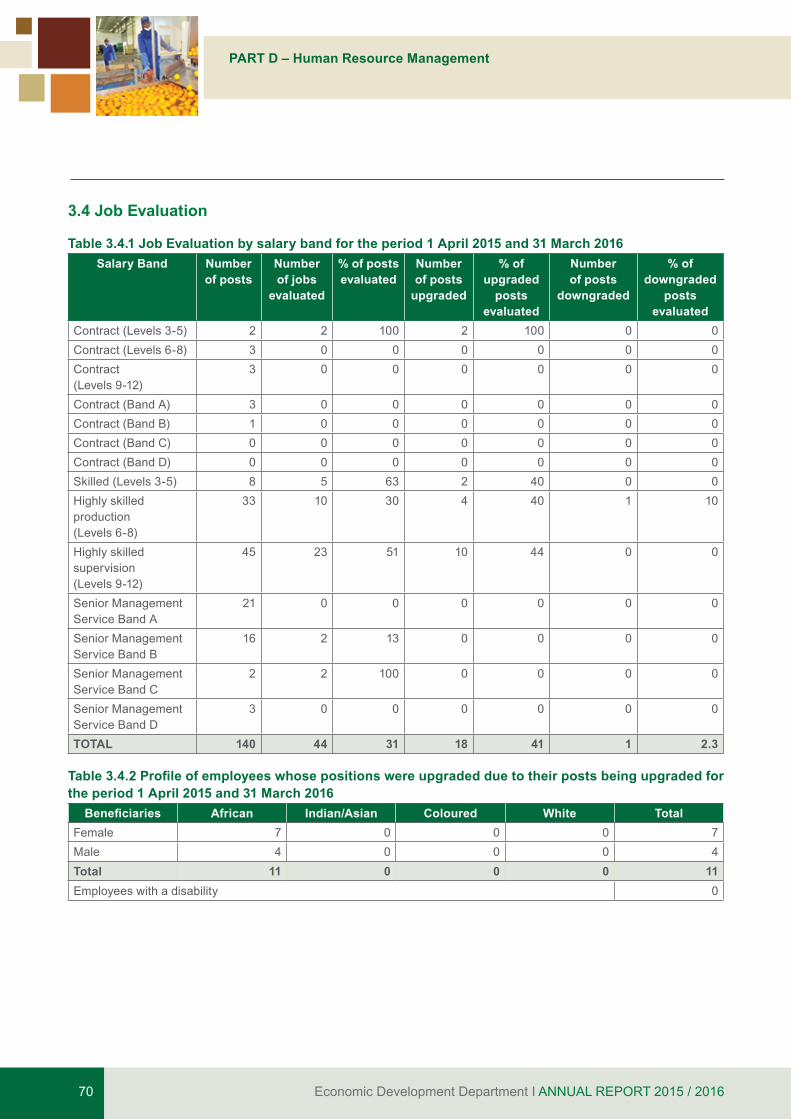
Economic Development Department I ANNUAL REPORT 2015 / 201670
PART D – Human Resource Management
3.4 Job Evaluation
Table 3.4.1 Job Evaluation by salary band for the period 1 April 2015 and 31 March 2016Salary Band Number
of postsNumber of jobs
evaluated
% of posts evaluated
Number of posts
upgraded
% of upgraded
posts evaluated
Number of posts
downgraded
% of downgraded
posts evaluated
Contract (Levels 3-5) 2 2 100 2 100 0 0Contract (Levels 6-8) 3 0 0 0 0 0 0Contract (Levels 9-12)
3 0 0 0 0 0 0
Contract (Band A) 3 0 0 0 0 0 0Contract (Band B) 1 0 0 0 0 0 0Contract (Band C) 0 0 0 0 0 0 0Contract (Band D) 0 0 0 0 0 0 0Skilled (Levels 3-5) 8 5 63 2 40 0 0Highly skilled production (Levels 6-8)
33 10 30 4 40 1 10
Highly skilled supervision (Levels 9-12)
45 23 51 10 44 0 0
Senior Management Service Band A
21 0 0 0 0 0 0
Senior Management Service Band B
16 2 13 0 0 0 0
Senior Management Service Band C
2 2 100 0 0 0 0
Senior Management Service Band D
3 0 0 0 0 0 0
TOTAL 140 44 31 18 41 1 2.3
Table 3.4.2 Profile of employees whose positions were upgraded due to their posts being upgraded for the period 1 April 2015 and 31 March 2016
Beneficiaries African Indian/Asian Coloured White TotalFemale 7 0 0 0 7Male 4 0 0 0 4Total 11 0 0 0 11Employees with a disability 0
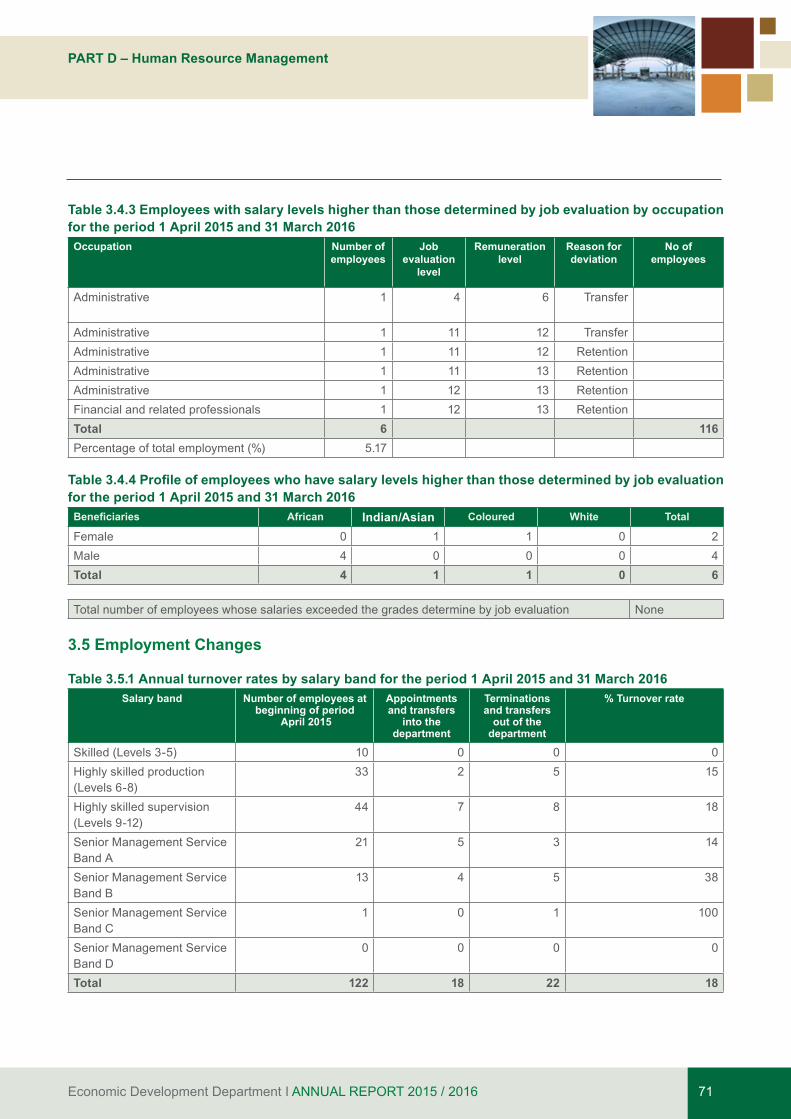
Economic Development Department I ANNUAL REPORT 2015 / 2016 71
PART D – Human Resource Management
Table 3.4.3 Employees with salary levels higher than those determined by job evaluation by occupation for the period 1 April 2015 and 31 March 2016Occupation Number of
employeesJob
evaluation level
Remuneration level
Reason for deviation
No of employees
Administrative 1 4 6 Transfer
Administrative 1 11 12 TransferAdministrative 1 11 12 RetentionAdministrative 1 11 13 RetentionAdministrative 1 12 13 RetentionFinancial and related professionals 1 12 13 RetentionTotal 6 116Percentage of total employment (%) 5.17
Table 3.4.4 Profile of employees who have salary levels higher than those determined by job evaluation for the period 1 April 2015 and 31 March 2016Beneficiaries African Indian/Asian Coloured White Total
Female 0 1 1 0 2Male 4 0 0 0 4Total 4 1 1 0 6
Total number of employees whose salaries exceeded the grades determine by job evaluation None
3.5 Employment Changes
Table 3.5.1 Annual turnover rates by salary band for the period 1 April 2015 and 31 March 2016Salary band Number of employees at
beginning of period April 2015
Appointments and transfers
into the department
Terminations and transfers
out of the department
% Turnover rate
Skilled (Levels 3-5) 10 0 0 0Highly skilled production (Levels 6-8)
33 2 5 15
Highly skilled supervision (Levels 9-12)
44 7 8 18
Senior Management Service Band A
21 5 3 14
Senior Management Service Band B
13 4 5 38
Senior Management Service Band C
1 0 1 100
Senior Management Service Band D
0 0 0 0
Total 122 18 22 18
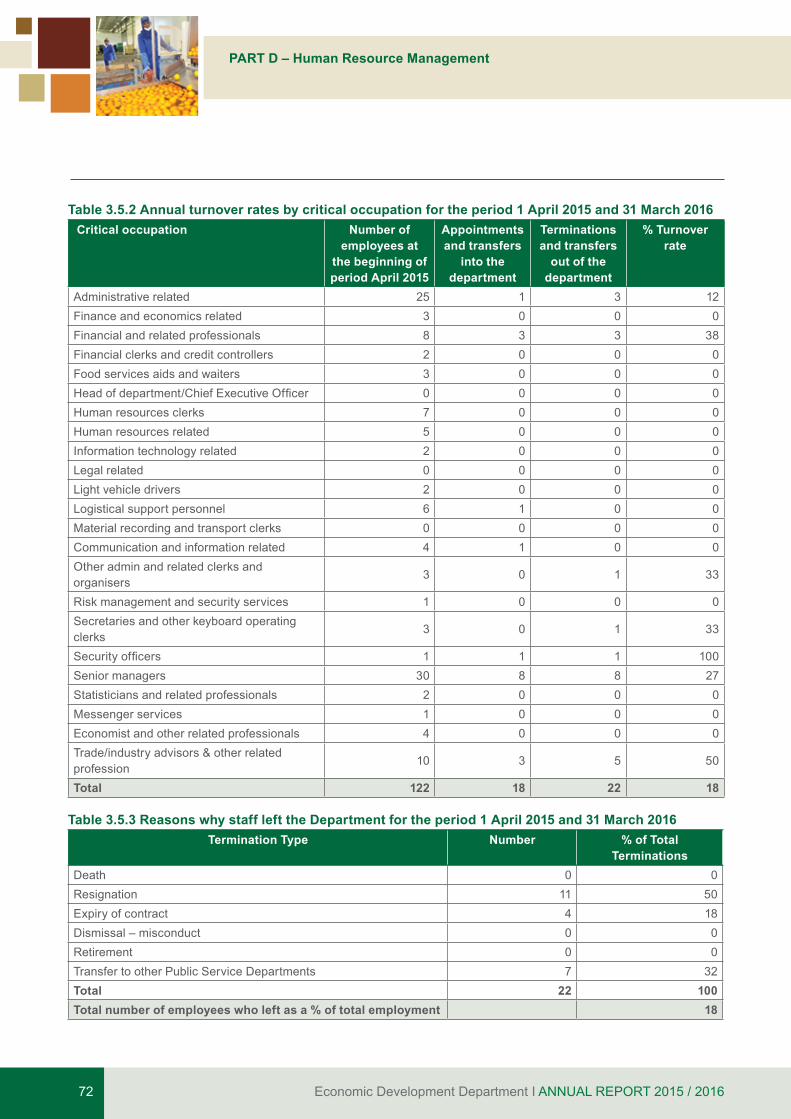
Economic Development Department I ANNUAL REPORT 2015 / 201672
PART D – Human Resource Management
Table 3.5.2 Annual turnover rates by critical occupation for the period 1 April 2015 and 31 March 2016 Critical occupation Number of
employees at the beginning of period April 2015
Appointments and transfers
into the department
Terminations and transfers
out of the department
% Turnover rate
Administrative related 25 1 3 12Finance and economics related 3 0 0 0Financial and related professionals 8 3 3 38Financial clerks and credit controllers 2 0 0 0Food services aids and waiters 3 0 0 0Headofdepartment/ChiefExecutiveOfficer 0 0 0 0Human resources clerks 7 0 0 0Human resources related 5 0 0 0Information technology related 2 0 0 0Legal related 0 0 0 0Light vehicle drivers 2 0 0 0Logistical support personnel 6 1 0 0Material recording and transport clerks 0 0 0 0Communication and information related 4 1 0 0Other admin and related clerks and organisers
3 0 1 33
Risk management and security services 1 0 0 0Secretaries and other keyboard operating clerks
3 0 1 33
Securityofficers 1 1 1 100Senior managers 30 8 8 27Statisticians and related professionals 2 0 0 0Messenger services 1 0 0 0Economist and other related professionals 4 0 0 0Trade/industry advisors & other related profession
10 3 5 50
Total 122 18 22 18
Table 3.5.3 Reasons why staff left the Department for the period 1 April 2015 and 31 March 2016Termination Type Number % of Total
TerminationsDeath 0 0Resignation 11 50Expiry of contract 4 18Dismissal – misconduct 0 0Retirement 0 0Transfer to other Public Service Departments 7 32Total 22 100Total number of employees who left as a % of total employment 18
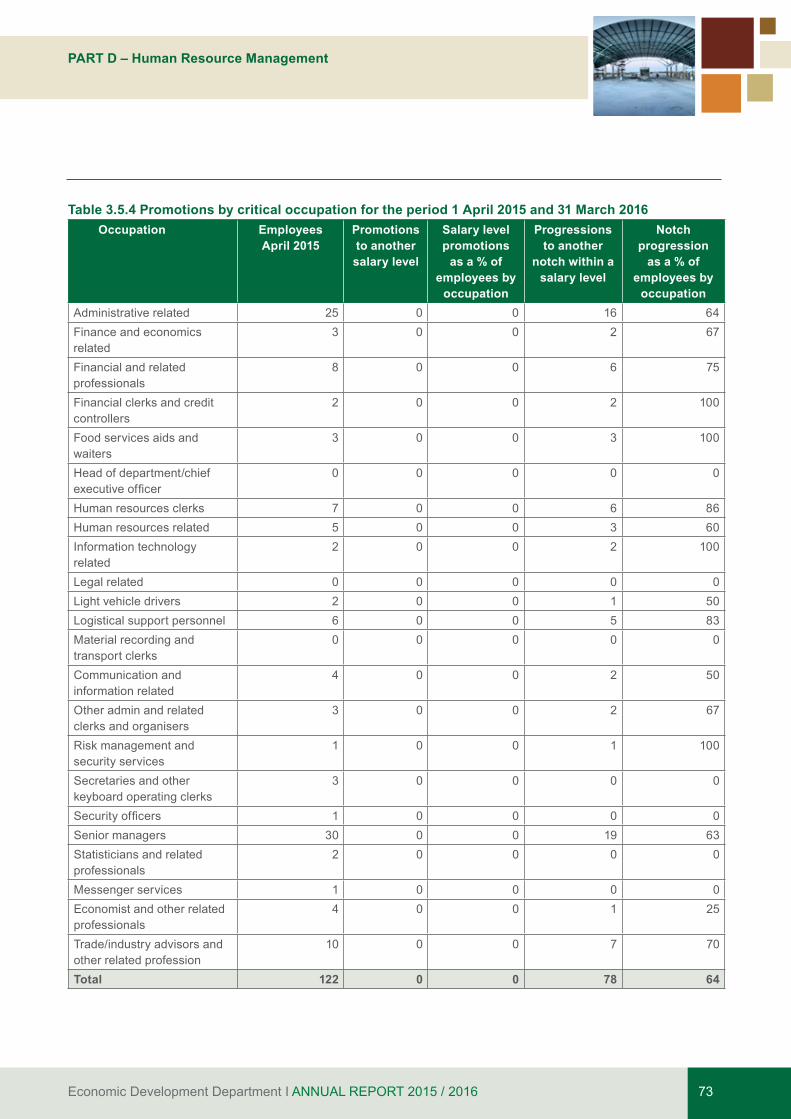
Economic Development Department I ANNUAL REPORT 2015 / 2016 73
PART D – Human Resource Management
Table 3.5.4 Promotions by critical occupation for the period 1 April 2015 and 31 March 2016 Occupation Employees
April 2015Promotions to another salary level
Salary level promotions
as a % of employees by
occupation
Progressions to another
notch within a salary level
Notch progression
as a % of employees by
occupationAdministrative related 25 0 0 16 64Finance and economics related
3 0 0 2 67
Financial and related professionals
8 0 0 6 75
Financial clerks and credit controllers
2 0 0 2 100
Food services aids and waiters
3 0 0 3 100
Head of department/chief executiveofficer
0 0 0 0 0
Human resources clerks 7 0 0 6 86Human resources related 5 0 0 3 60Information technology related
2 0 0 2 100
Legal related 0 0 0 0 0Light vehicle drivers 2 0 0 1 50Logistical support personnel 6 0 0 5 83Material recording and transport clerks
0 0 0 0 0
Communication and information related
4 0 0 2 50
Other admin and related clerks and organisers
3 0 0 2 67
Risk management and security services
1 0 0 1 100
Secretaries and other keyboard operating clerks
3 0 0 0 0
Securityofficers 1 0 0 0 0Senior managers 30 0 0 19 63Statisticians and related professionals
2 0 0 0 0
Messenger services 1 0 0 0 0Economist and other related professionals
4 0 0 1 25
Trade/industry advisors and other related profession
10 0 0 7 70
Total 122 0 0 78 64
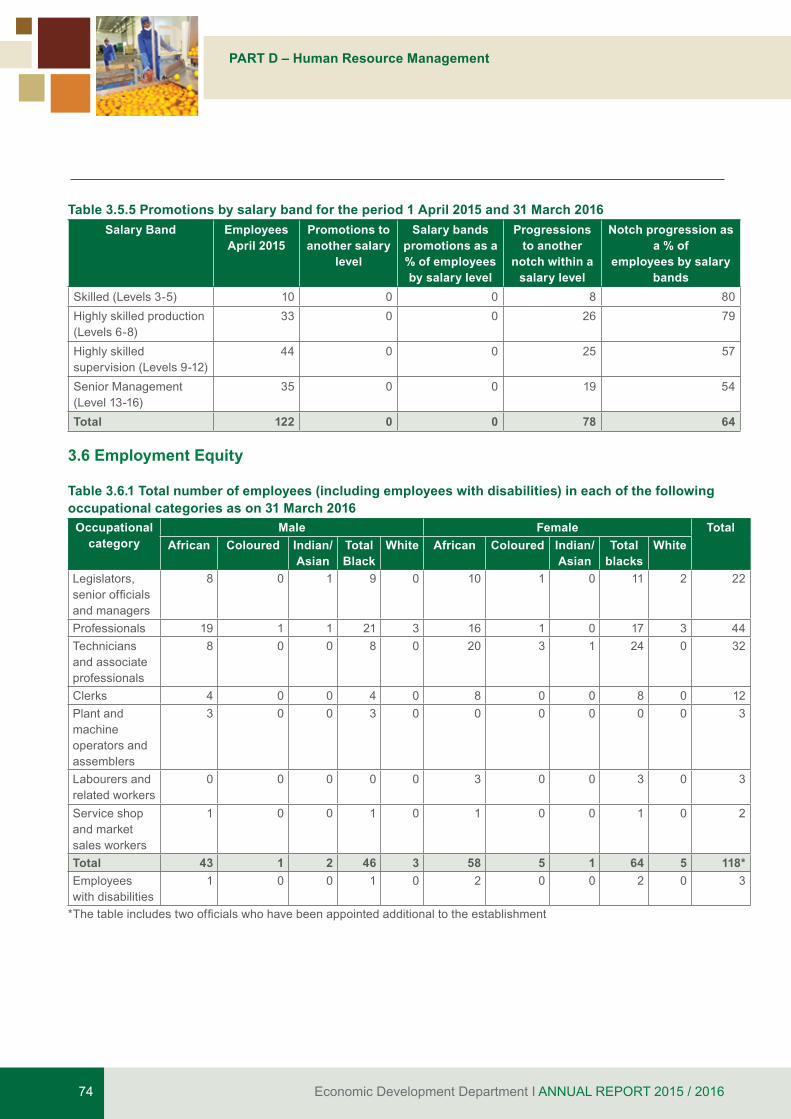
Economic Development Department I ANNUAL REPORT 2015 / 201674
PART D – Human Resource Management
Table 3.5.5 Promotions by salary band for the period 1 April 2015 and 31 March 2016Salary Band Employees
April 2015Promotions to another salary
level
Salary bands promotions as a % of employees by salary level
Progressions to another
notch within a salary level
Notch progression as a % of
employees by salary bands
Skilled (Levels 3-5) 10 0 0 8 80Highly skilled production (Levels 6-8)
33 0 0 26 79
Highly skilled supervision (Levels 9-12)
44 0 0 25 57
Senior Management (Level 13-16)
35 0 0 19 54
Total 122 0 0 78 64
3.6 Employment Equity
Table 3.6.1 Total number of employees (including employees with disabilities) in each of the following occupational categories as on 31 March 2016
Occupational category
Male Female TotalAfrican Coloured Indian/
AsianTotal Black
White African Coloured Indian/Asian
Total blacks
White
Legislators, seniorofficialsand managers
8 0 1 9 0 10 1 0 11 2 22
Professionals 19 1 1 21 3 16 1 0 17 3 44Technicians and associate professionals
8 0 0 8 0 20 3 1 24 0 32
Clerks 4 0 0 4 0 8 0 0 8 0 12Plant and machine operators and assemblers
3 0 0 3 0 0 0 0 0 0 3
Labourers and related workers
0 0 0 0 0 3 0 0 3 0 3
Service shop and market sales workers
1 0 0 1 0 1 0 0 1 0 2
Total 43 1 2 46 3 58 5 1 64 5 118*Employees with disabilities
1 0 0 1 0 2 0 0 2 0 3
*Thetableincludestwoofficialswhohavebeenappointedadditionaltotheestablishment
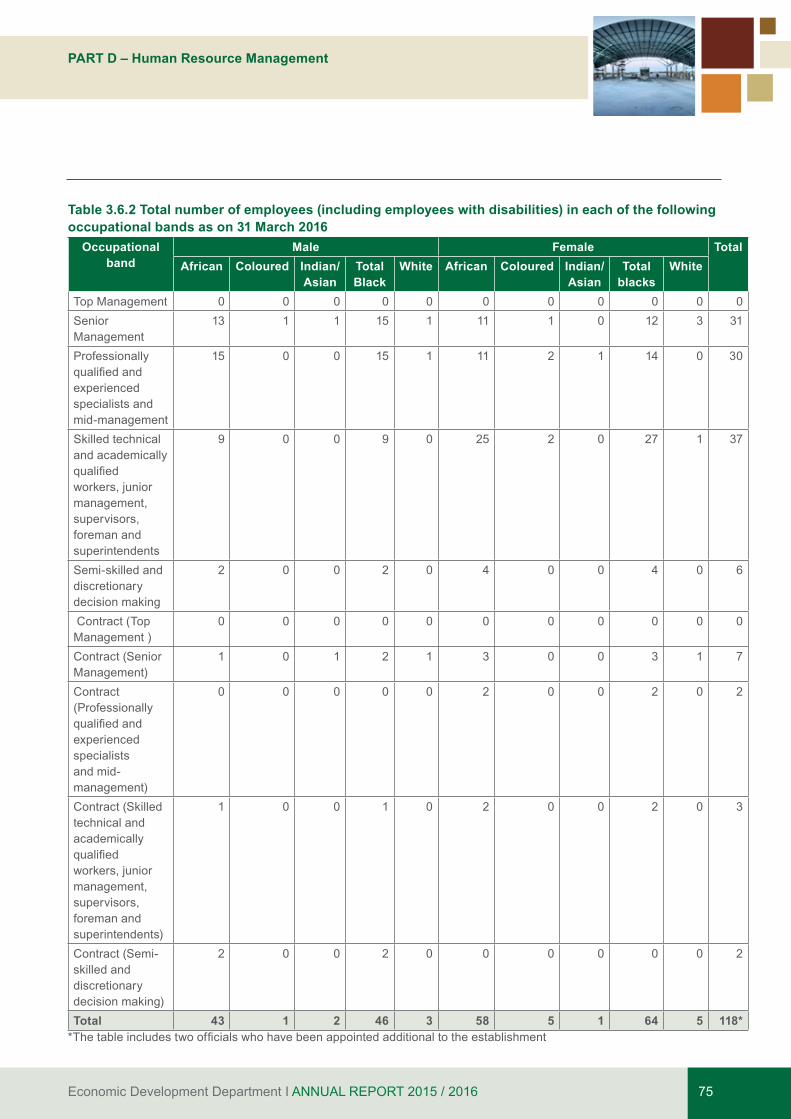
Economic Development Department I ANNUAL REPORT 2015 / 2016 75
PART D – Human Resource Management
Table 3.6.2 Total number of employees (including employees with disabilities) in each of the following occupational bands as on 31 March 2016
Occupational band
Male Female TotalAfrican Coloured Indian/
AsianTotal Black
White African Coloured Indian/Asian
Total blacks
White
Top Management 0 0 0 0 0 0 0 0 0 0 0Senior Management
13 1 1 15 1 11 1 0 12 3 31
Professionally qualifiedandexperienced specialists and mid-management
15 0 0 15 1 11 2 1 14 0 30
Skilled technical and academically qualifiedworkers, junior management, supervisors, foreman and superintendents
9 0 0 9 0 25 2 0 27 1 37
Semi-skilled and discretionary decision making
2 0 0 2 0 4 0 0 4 0 6
Contract (Top Management )
0 0 0 0 0 0 0 0 0 0 0
Contract (Senior Management)
1 0 1 2 1 3 0 0 3 1 7
Contract (Professionally qualifiedandexperienced specialists and mid-management)
0 0 0 0 0 2 0 0 2 0 2
Contract (Skilled technical and academically qualifiedworkers, junior management, supervisors, foreman and superintendents)
1 0 0 1 0 2 0 0 2 0 3
Contract (Semi-skilled and discretionary decision making)
2 0 0 2 0 0 0 0 0 0 2
Total 43 1 2 46 3 58 5 1 64 5 118**Thetableincludestwoofficialswhohavebeenappointedadditionaltotheestablishment

Economic Development Department I ANNUAL REPORT 2015 / 201676
PART D – Human Resource Management
Table 3.6.3 Recruitment for the period 1 April 2015 to 31 March 2016Occupational band Male Female Total
African Coloured Indian/Asian
Total blacks
White African Coloured Indian/Asian
Total blacks
White
Top Management 0 0 0 0 0 0 0 0 0 0 0Senior Management
4 0 1 5 1 1 0 0 1 2 9
Professionally qualifiedandexperienced specialists and mid-management
3 0 0 3 0 3 0 0 3 0 6
Skilled technical and academically qualifiedworkers, junior management, supervisors, foreman and superintendents
1 0 0 1 0 1 1 0 2 0 3
Semi-skilled and discretionary decision making
0 0 0 0 0 0 0 0 0 0 0
Unskilled and defineddecisionmaking
0 0 0 0 0 0 0 0 0 0 0
Total 8 0 1 9 1 5 1 0 6 2 18Employees with disabilities
0 0 0 0 0 1 0 0 1 0 1
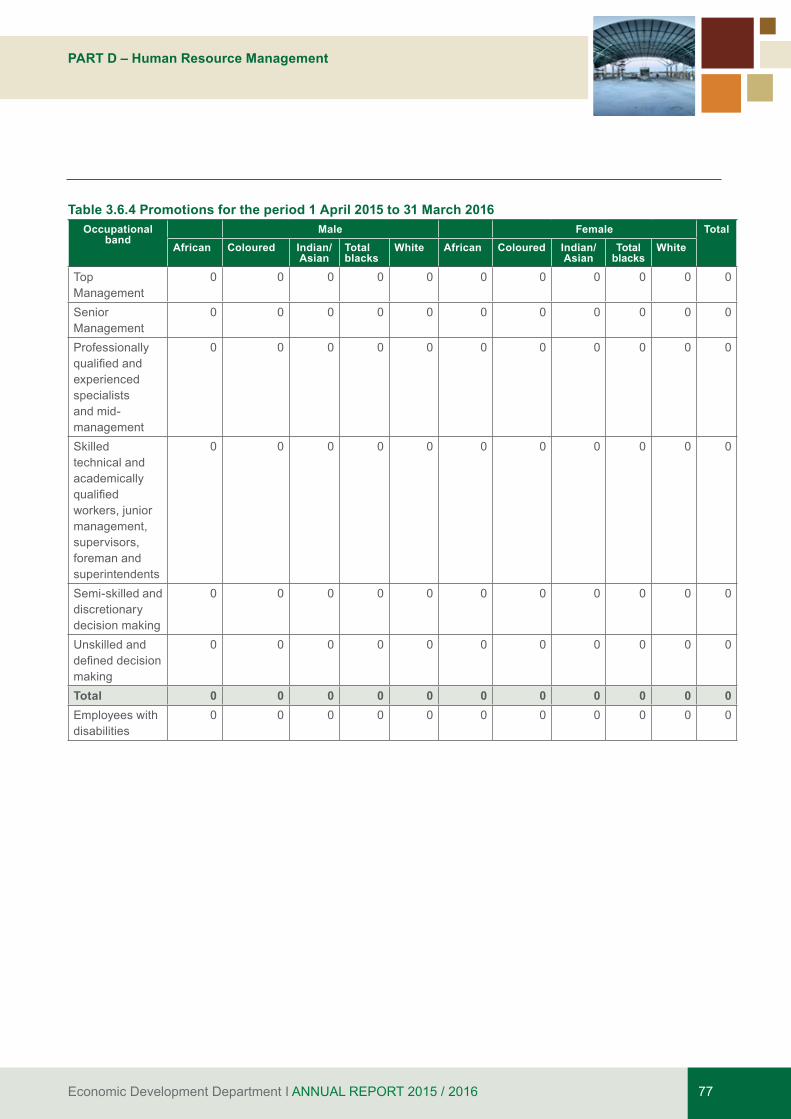
Economic Development Department I ANNUAL REPORT 2015 / 2016 77
PART D – Human Resource Management
Table 3.6.4 Promotions for the period 1 April 2015 to 31 March 2016Occupational
bandMale Female Total
African Coloured Indian/Asian
Total blacks
White African Coloured Indian/Asian
Total blacks
White
Top Management
0 0 0 0 0 0 0 0 0 0 0
Senior Management
0 0 0 0 0 0 0 0 0 0 0
Professionally qualifiedandexperienced specialists and mid-management
0 0 0 0 0 0 0 0 0 0 0
Skilled technical and academically qualifiedworkers, junior management, supervisors, foreman and superintendents
0 0 0 0 0 0 0 0 0 0 0
Semi-skilled and discretionary decision making
0 0 0 0 0 0 0 0 0 0 0
Unskilled and defineddecisionmaking
0 0 0 0 0 0 0 0 0 0 0
Total 0 0 0 0 0 0 0 0 0 0 0Employees with disabilities
0 0 0 0 0 0 0 0 0 0 0
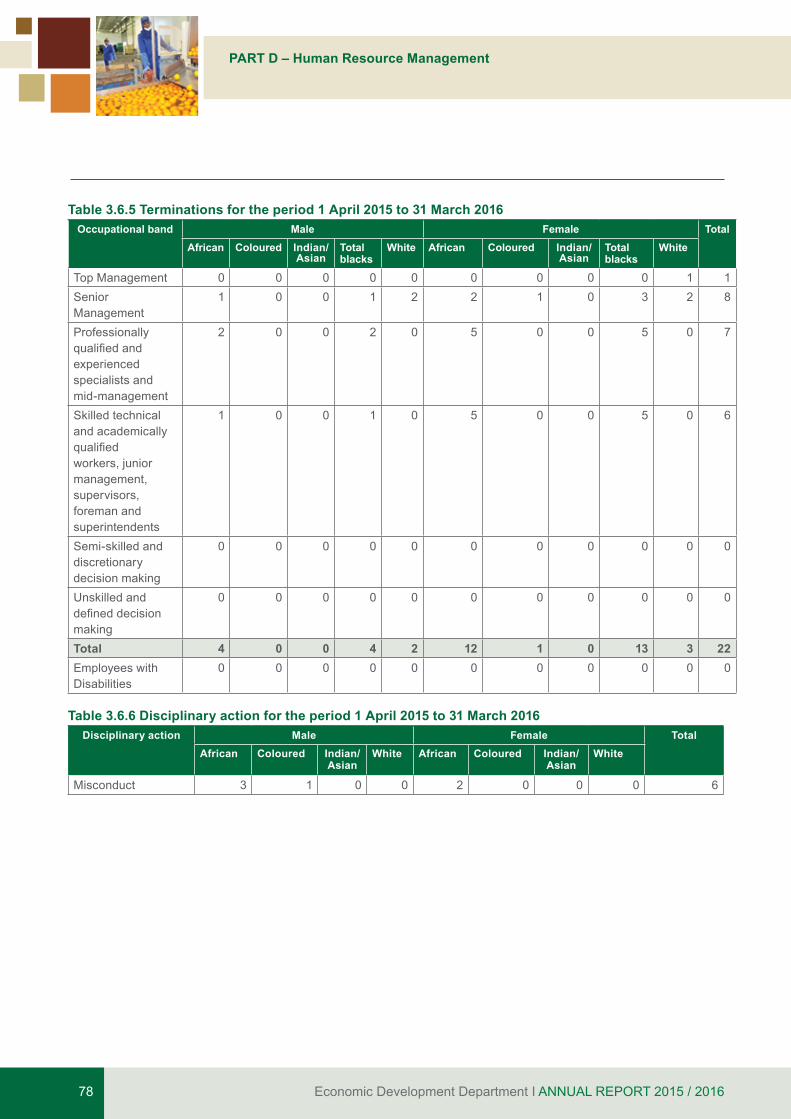
Economic Development Department I ANNUAL REPORT 2015 / 201678
PART D – Human Resource Management
Table 3.6.5 Terminations for the period 1 April 2015 to 31 March 2016Occupational band Male Female Total
African Coloured Indian/Asian
Total blacks
White African Coloured Indian/Asian
Total blacks
White
Top Management 0 0 0 0 0 0 0 0 0 1 1Senior Management
1 0 0 1 2 2 1 0 3 2 8
Professionally qualifiedandexperienced specialists and mid-management
2 0 0 2 0 5 0 0 5 0 7
Skilled technical and academically qualifiedworkers, junior management, supervisors, foreman and superintendents
1 0 0 1 0 5 0 0 5 0 6
Semi-skilled and discretionary decision making
0 0 0 0 0 0 0 0 0 0 0
Unskilled and defineddecisionmaking
0 0 0 0 0 0 0 0 0 0 0
Total 4 0 0 4 2 12 1 0 13 3 22Employees with Disabilities
0 0 0 0 0 0 0 0 0 0 0
Table 3.6.6 Disciplinary action for the period 1 April 2015 to 31 March 2016Disciplinary action Male Female Total
African Coloured Indian/Asian
White African Coloured Indian/Asian
White
Misconduct 3 1 0 0 2 0 0 0 6

Economic Development Department I ANNUAL REPORT 2015 / 2016 79
PART D – Human Resource Management
Table 3.6.7 Skills development for the period 1 April 2015 to 31 March 2016Occupational category Male Female Total
African Coloured Indian/Asian
White African Coloured Indian/Asian
White
Legislators,seniorofficialsand managers
3 0 0 0 4 0 0 0 7
Professionals 1 0 0 1 3 0 0 0 5Technicians and associate professionals
2 0 0 0 13 1 0 0 16
Clerks 2 0 0 0 3 0 0 0 5Service and sales workers 0 0 0 0 0 0 0 0 0Skilledagricultureandfisheryworkers
0 0 0 0 0 0 0 0 0
Craft and related trades workers
0 0 0 0 0 0 0 0 0
Plant and machine operators and assemblers
0 0 0 0 0 0 0 0 0
Elementary occupations 0 0 0 0 0 0 0 0 0Total 8 0 0 1 23 1 0 0 33Employees with disabilities 0 0 0 0 1 0 0 0 2
Notes:
*Three (3) Interns attended the Project Management in November 2015*Three (3) Interns attended Monitoring and Evaluation training in December 2015*One (1) Intern attended Records Management training in February 2016 *Six (6) Interns attended Excel Training in March 2016*Sixteen (16) SMS members attended the PMDS training offered by DPSA in February 2016*Twenty Seven (27) Non-SMS members attended the PMDS Training offered by the Department in collaboration with DPSA in March 2016.
3.7 Signing of Performance Agreements By Sms Members
Table 3.7.1 Signing of Performance Agreements by SMS members as on 31 May 2015SMS level Total number of
funded SMS postsTotal number of SMS
membersTotal number of
signed performance agreements
Signed performance agreements as % of total number of SMS
members
Director-General/ Head of Department
1 0 0 0
Salary Level 16 2 0 0 0Salary Level 15 2 1 1 100Salary Level 14 21 13 13 100Salary Level 13 25 21 18 86Total 51 35 32 91
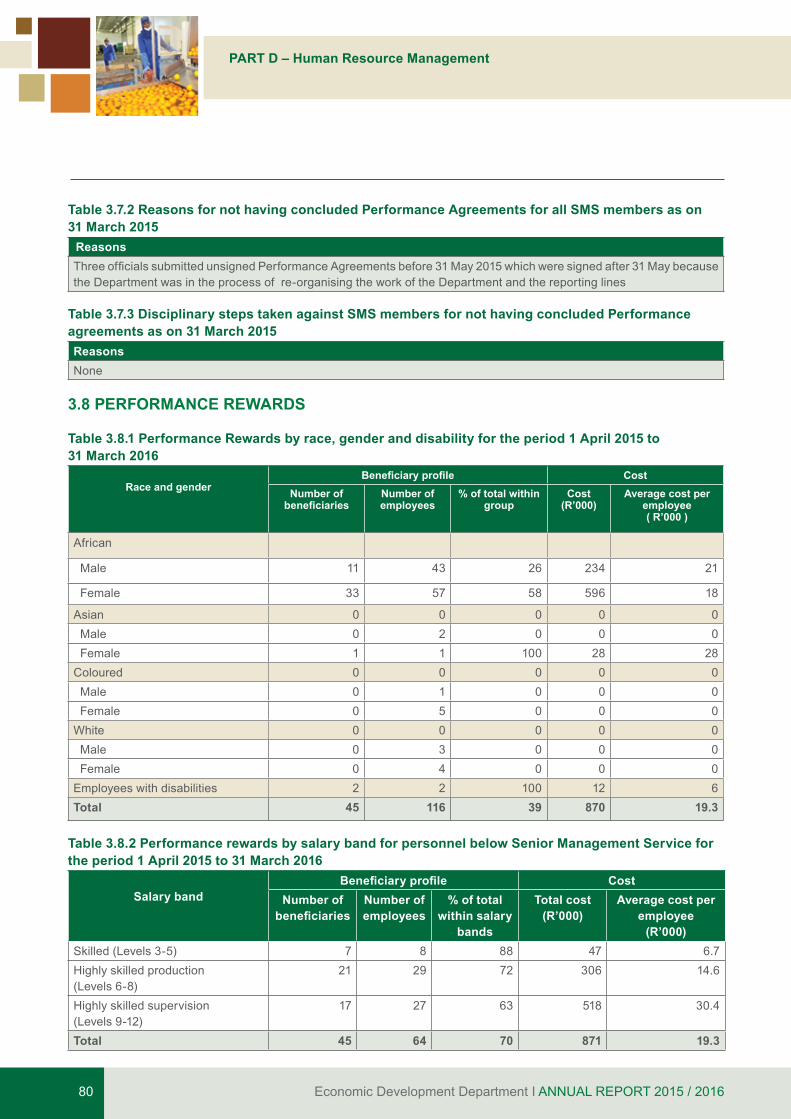
Economic Development Department I ANNUAL REPORT 2015 / 201680
PART D – Human Resource Management
Table 3.7.2 Reasons for not having concluded Performance Agreements for all SMS members as on 31 March 2015
Reasons ThreeofficialssubmittedunsignedPerformanceAgreementsbefore31May2015whichweresignedafter31Maybecausethe Department was in the process of re-organising the work of the Department and the reporting lines
Table 3.7.3 Disciplinary steps taken against SMS members for not having concluded Performance agreements as on 31 March 2015Reasons None
3.8 PERFORMANCE REWARDS
Table 3.8.1 Performance Rewards by race, gender and disability for the period 1 April 2015 to 31 March 2016
Race and genderBeneficiary profile Cost
Number of beneficiaries
Number of employees
% of total within group
Cost (R’000)
Average cost per employee( R’000 )
African
Male 11 43 26 234 21
Female 33 57 58 596 18
Asian 0 0 0 0 0 Male 0 2 0 0 0 Female 1 1 100 28 28Coloured 0 0 0 0 0 Male 0 1 0 0 0 Female 0 5 0 0 0White 0 0 0 0 0 Male 0 3 0 0 0 Female 0 4 0 0 0Employees with disabilities 2 2 100 12 6Total 45 116 39 870 19.3
Table 3.8.2 Performance rewards by salary band for personnel below Senior Management Service for the period 1 April 2015 to 31 March 2016
Salary bandBeneficiary profile Cost
Number of beneficiaries
Number of employees
% of total within salary
bands
Total cost (R’000)
Average cost per employee
(R’000)Skilled (Levels 3-5) 7 8 88 47 6.7Highly skilled production (Levels 6-8)
21 29 72 306 14.6
Highly skilled supervision (Levels 9-12)
17 27 63 518 30.4
Total 45 64 70 871 19.3
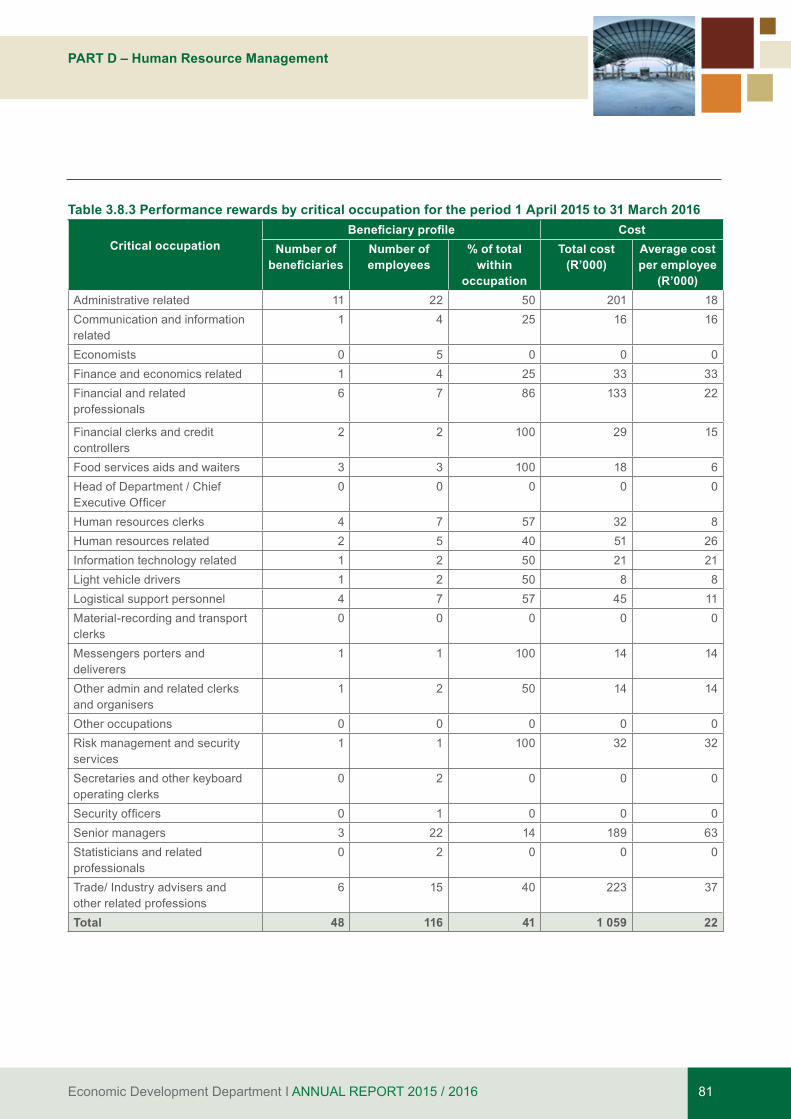
Economic Development Department I ANNUAL REPORT 2015 / 2016 81
PART D – Human Resource Management
Table 3.8.3 Performance rewards by critical occupation for the period 1 April 2015 to 31 March 2016
Critical occupationBeneficiary profile Cost
Number of beneficiaries
Number of employees
% of total within
occupation
Total cost (R’000)
Average cost per employee
(R’000)Administrative related 11 22 50 201 18Communication and information related
1 4 25 16 16
Economists 0 5 0 0 0Finance and economics related 1 4 25 33 33Financial and related professionals
6 7 86 133 22
Financial clerks and credit controllers
2 2 100 29 15
Food services aids and waiters 3 3 100 18 6Head of Department / Chief ExecutiveOfficer
0 0 0 0 0
Human resources clerks 4 7 57 32 8Human resources related 2 5 40 51 26Information technology related 1 2 50 21 21Light vehicle drivers 1 2 50 8 8Logistical support personnel 4 7 57 45 11Material-recording and transport clerks
0 0 0 0 0
Messengers porters and deliverers
1 1 100 14 14
Other admin and related clerks and organisers
1 2 50 14 14
Other occupations 0 0 0 0 0Risk management and security services
1 1 100 32 32
Secretaries and other keyboard operating clerks
0 2 0 0 0
Securityofficers 0 1 0 0 0Senior managers 3 22 14 189 63Statisticians and related professionals
0 2 0 0 0
Trade/ Industry advisers and other related professions
6 15 40 223 37
Total 48 116 41 1 059 22
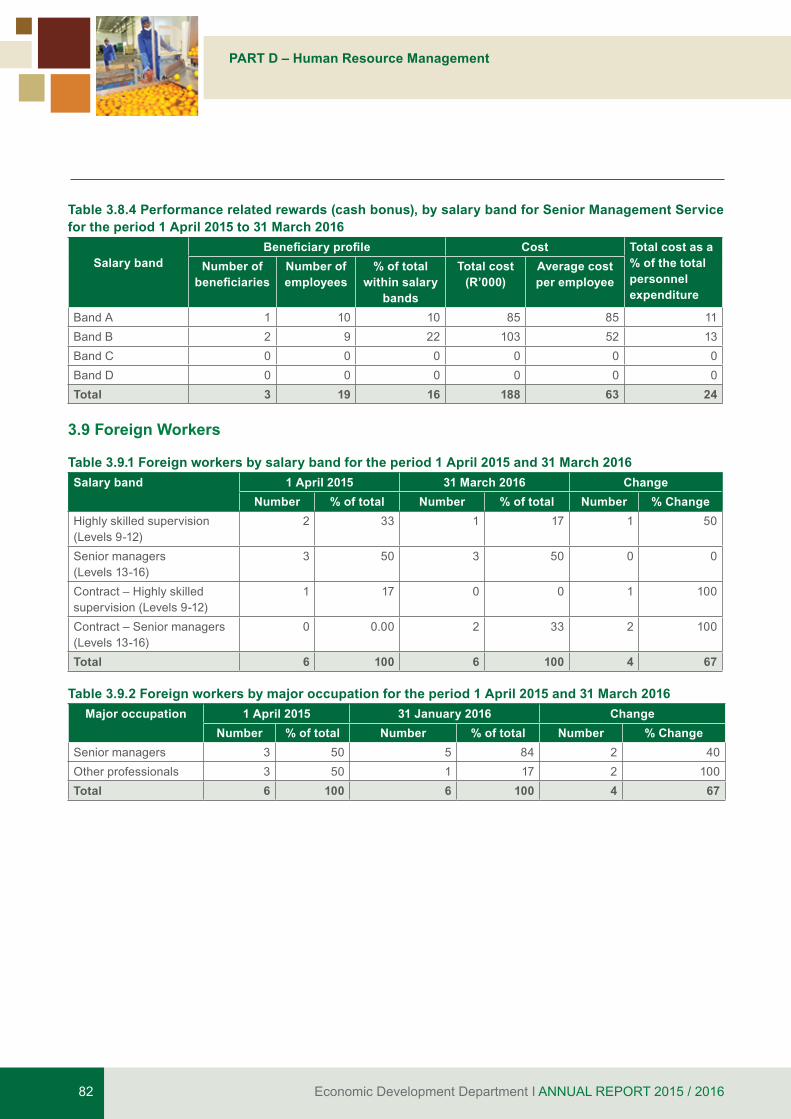
Economic Development Department I ANNUAL REPORT 2015 / 201682
PART D – Human Resource Management
Table 3.8.4 Performance related rewards (cash bonus), by salary band for Senior Management Service for the period 1 April 2015 to 31 March 2016
Salary bandBeneficiary profile Cost Total cost as a
% of the total personnel expenditure
Number of beneficiaries
Number of employees
% of total within salary
bands
Total cost (R’000)
Average cost per employee
Band A 1 10 10 85 85 11Band B 2 9 22 103 52 13Band C 0 0 0 0 0 0Band D 0 0 0 0 0 0Total 3 19 16 188 63 24
3.9 Foreign Workers
Table 3.9.1 Foreign workers by salary band for the period 1 April 2015 and 31 March 2016Salary band 1 April 2015 31 March 2016 Change
Number % of total Number % of total Number % ChangeHighly skilled supervision (Levels 9-12)
2 33 1 17 1 50
Senior managers (Levels 13-16)
3 50 3 50 0 0
Contract – Highly skilled supervision (Levels 9-12)
1 17 0 0 1 100
Contract – Senior managers (Levels 13-16)
0 0.00 2 33 2 100
Total 6 100 6 100 4 67
Table 3.9.2 Foreign workers by major occupation for the period 1 April 2015 and 31 March 2016Major occupation 1 April 2015 31 January 2016 Change
Number % of total Number % of total Number % ChangeSenior managers 3 50 5 84 2 40Other professionals 3 50 1 17 2 100Total 6 100 6 100 4 67
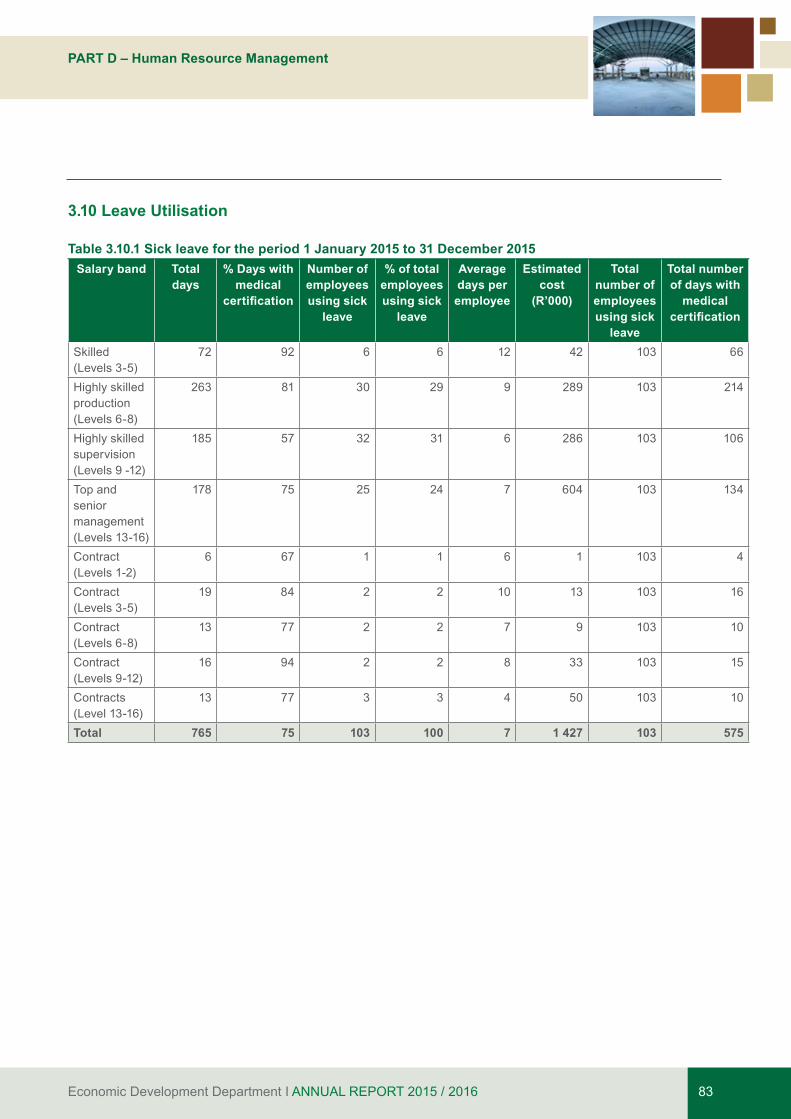
Economic Development Department I ANNUAL REPORT 2015 / 2016 83
PART D – Human Resource Management
3.10 Leave Utilisation
Table 3.10.1 Sick leave for the period 1 January 2015 to 31 December 2015Salary band Total
days% Days with
medical certification
Number of employees using sick
leave
% of total employees using sick
leave
Average days per employee
Estimated cost
(R’000)
Total number of employees using sick
leave
Total number of days with
medical certification
Skilled (Levels 3-5)
72 92 6 6 12 42 103 66
Highly skilled production (Levels 6-8)
263 81 30 29 9 289 103 214
Highly skilled supervision (Levels 9 -12)
185 57 32 31 6 286 103 106
Top and senior management (Levels 13-16)
178 75 25 24 7 604 103 134
Contract (Levels 1-2)
6 67 1 1 6 1 103 4
Contract (Levels 3-5)
19 84 2 2 10 13 103 16
Contract (Levels 6-8)
13 77 2 2 7 9 103 10
Contract (Levels 9-12)
16 94 2 2 8 33 103 15
Contracts (Level 13-16)
13 77 3 3 4 50 103 10
Total 765 75 103 100 7 1 427 103 575
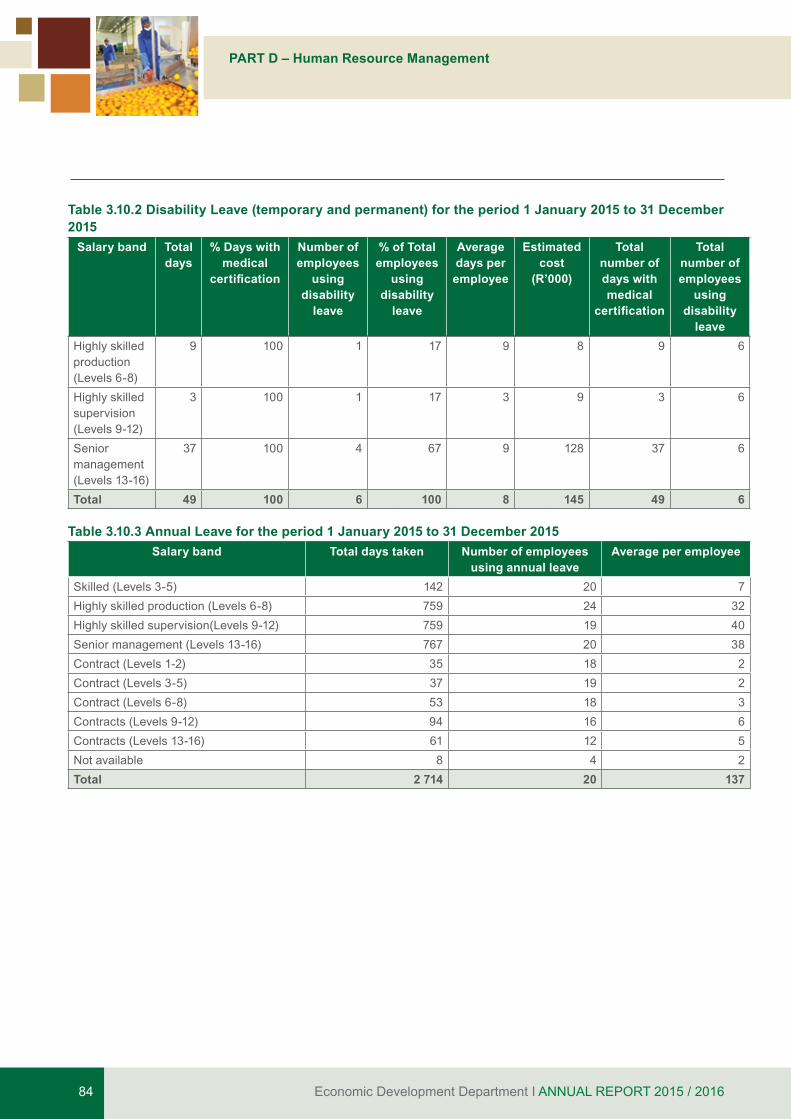
Economic Development Department I ANNUAL REPORT 2015 / 201684
PART D – Human Resource Management
Table 3.10.2 Disability Leave (temporary and permanent) for the period 1 January 2015 to 31 December 2015
Salary band Total days
% Days with medical
certification
Number of employees
using disability
leave
% of Total employees
using disability
leave
Average days per employee
Estimated cost
(R’000)
Total number of days with medical
certification
Total number of employees
using disability
leaveHighly skilled production (Levels 6-8)
9 100 1 17 9 8 9 6
Highly skilled supervision (Levels 9-12)
3 100 1 17 3 9 3 6
Senior management (Levels 13-16)
37 100 4 67 9 128 37 6
Total 49 100 6 100 8 145 49 6
Table 3.10.3 Annual Leave for the period 1 January 2015 to 31 December 2015Salary band Total days taken Number of employees
using annual leaveAverage per employee
Skilled (Levels 3-5) 142 20 7Highly skilled production (Levels 6-8) 759 24 32Highly skilled supervision(Levels 9-12) 759 19 40Senior management (Levels 13-16) 767 20 38Contract (Levels 1-2) 35 18 2Contract (Levels 3-5) 37 19 2Contract (Levels 6-8) 53 18 3Contracts (Levels 9-12) 94 16 6Contracts (Levels 13-16) 61 12 5Not available 8 4 2Total 2 714 20 137
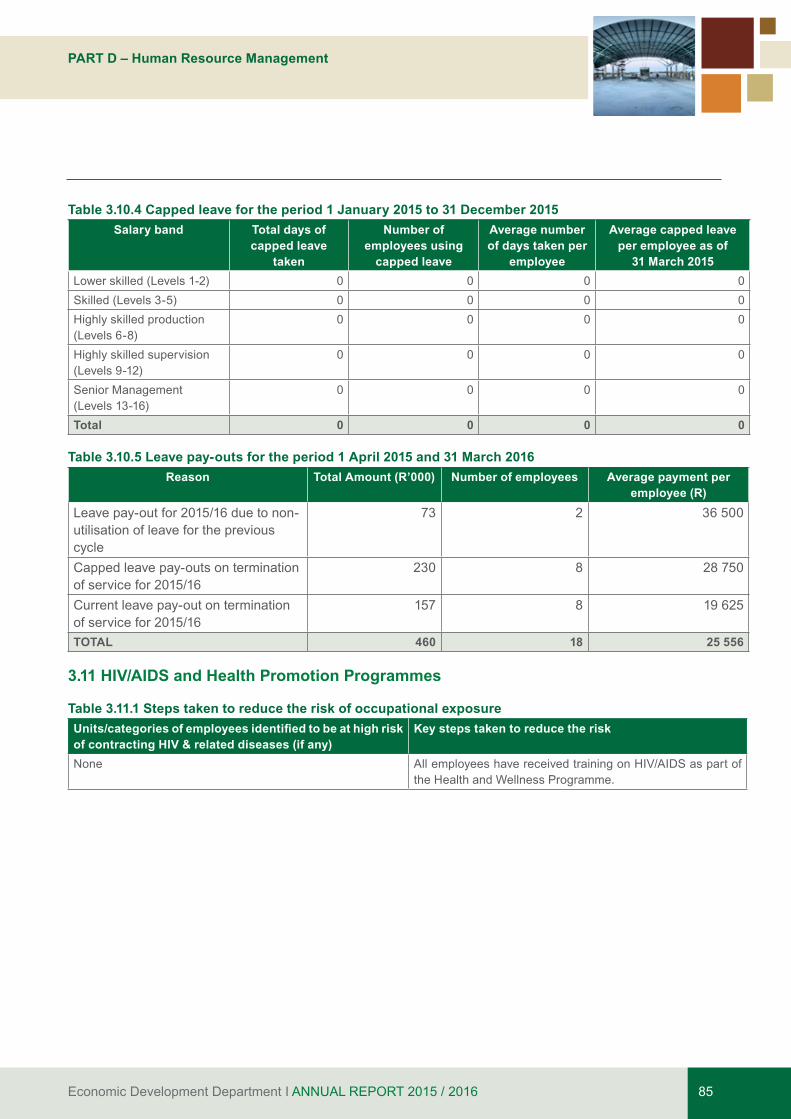
Economic Development Department I ANNUAL REPORT 2015 / 2016 85
PART D – Human Resource Management
Table 3.10.4 Capped leave for the period 1 January 2015 to 31 December 2015Salary band Total days of
capped leave taken
Number of employees using
capped leave
Average number of days taken per
employee
Average capped leave per employee as of
31 March 2015Lower skilled (Levels 1-2) 0 0 0 0Skilled (Levels 3-5) 0 0 0 0Highly skilled production (Levels 6-8)
0 0 0 0
Highly skilled supervision (Levels 9-12)
0 0 0 0
Senior Management (Levels 13-16)
0 0 0 0
Total 0 0 0 0
Table 3.10.5 Leave pay-outs for the period 1 April 2015 and 31 March 2016Reason Total Amount (R’000) Number of employees Average payment per
employee (R)Leave pay-out for 2015/16 due to non-utilisation of leave for the previous cycle
73 2 36 500
Capped leave pay-outs on termination of service for 2015/16
230 8 28 750
Current leave pay-out on termination of service for 2015/16
157 8 19 625
TOTAL 460 18 25 556
3.11 HIV/AIDS and Health Promotion Programmes
Table 3.11.1 Steps taken to reduce the risk of occupational exposureUnits/categories of employees identified to be at high risk of contracting HIV & related diseases (if any)
Key steps taken to reduce the risk
None All employees have received training on HIV/AIDS as part of the Health and Wellness Programme.
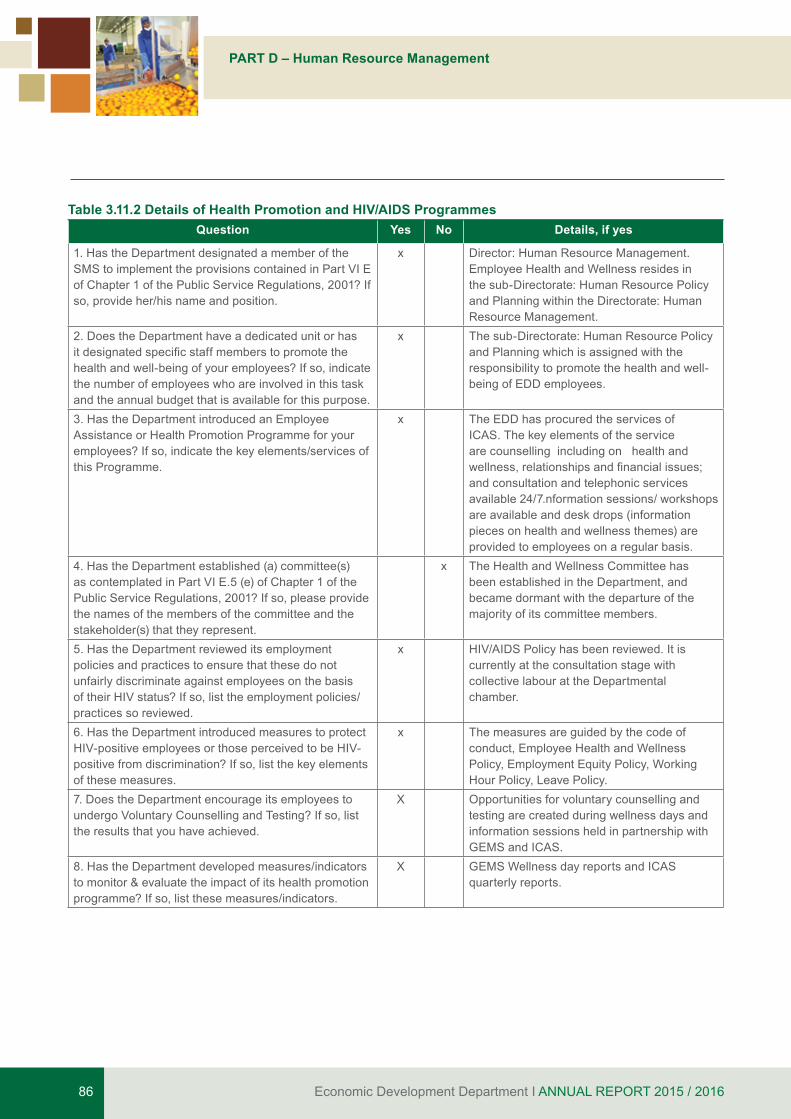
Economic Development Department I ANNUAL REPORT 2015 / 201686
PART D – Human Resource Management
Table 3.11.2 Details of Health Promotion and HIV/AIDS Programmes Question Yes No Details, if yes
1. Has the Department designated a member of the SMS to implement the provisions contained in Part VI E of Chapter 1 of the Public Service Regulations, 2001? If so, provide her/his name and position.
x Director: Human Resource Management. Employee Health and Wellness resides in the sub-Directorate: Human Resource Policy and Planning within the Directorate: Human Resource Management.
2. Does the Department have a dedicated unit or has itdesignatedspecificstaffmemberstopromotethehealth and well-being of your employees? If so, indicate the number of employees who are involved in this task and the annual budget that is available for this purpose.
x The sub-Directorate: Human Resource Policy and Planning which is assigned with the responsibility to promote the health and well-being of EDD employees.
3. Has the Department introduced an Employee Assistance or Health Promotion Programme for your employees? If so, indicate the key elements/services of this Programme.
x The EDD has procured the services of ICAS. The key elements of the service are counselling including on health and wellness,relationshipsandfinancialissues;and consultation and telephonic services available 24/7.nformation sessions/ workshops are available and desk drops (information pieces on health and wellness themes) are provided to employees on a regular basis.
4. Has the Department established (a) committee(s) as contemplated in Part VI E.5 (e) of Chapter 1 of the Public Service Regulations, 2001? If so, please provide the names of the members of the committee and the stakeholder(s) that they represent.
x The Health and Wellness Committee has been established in the Department, and became dormant with the departure of the majority of its committee members.
5. Has the Department reviewed its employment policies and practices to ensure that these do not unfairly discriminate against employees on the basis of their HIV status? If so, list the employment policies/practices so reviewed.
x HIV/AIDS Policy has been reviewed. It is currently at the consultation stage with collective labour at the Departmental chamber.
6. Has the Department introduced measures to protect HIV-positive employees or those perceived to be HIV-positive from discrimination? If so, list the key elements of these measures.
x The measures are guided by the code of conduct, Employee Health and Wellness Policy, Employment Equity Policy, Working Hour Policy, Leave Policy.
7. Does the Department encourage its employees to undergo Voluntary Counselling and Testing? If so, list the results that you have achieved.
X Opportunities for voluntary counselling and testing are created during wellness days and information sessions held in partnership with GEMS and ICAS.
8. Has the Department developed measures/indicators to monitor & evaluate the impact of its health promotion programme? If so, list these measures/indicators.
X GEMS Wellness day reports and ICAS quarterly reports.
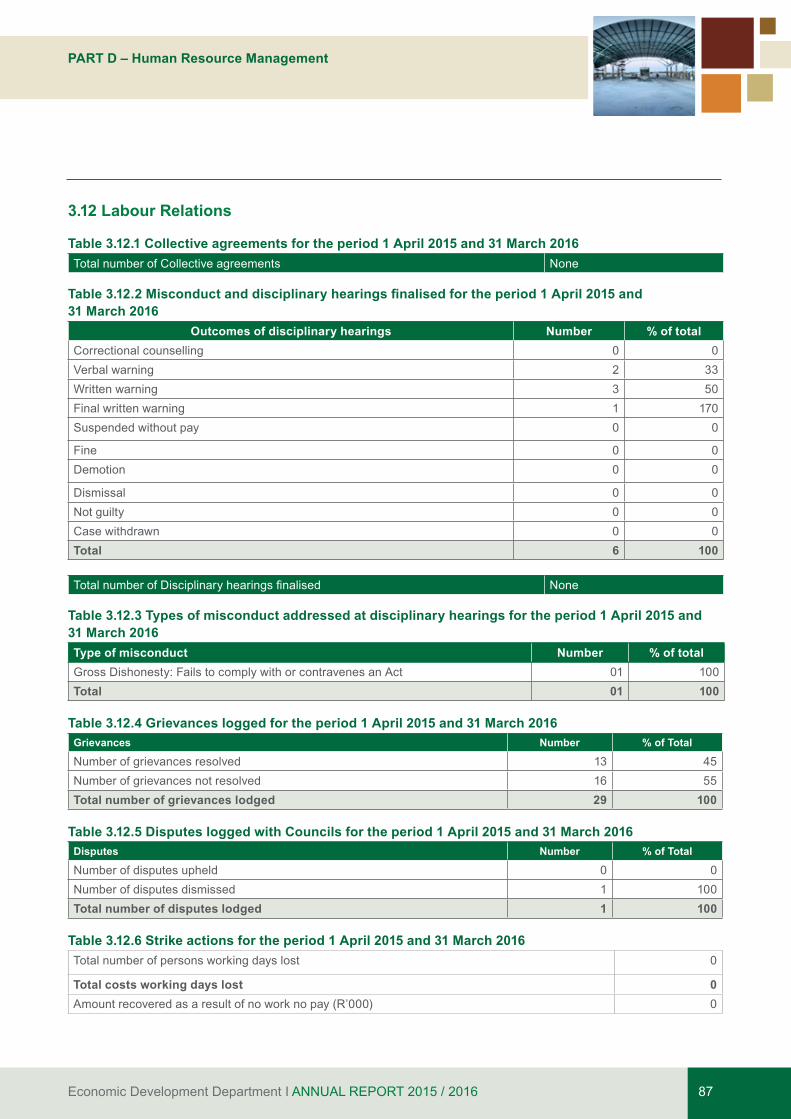
Economic Development Department I ANNUAL REPORT 2015 / 2016 87
PART D – Human Resource Management
3.12 Labour Relations
Table 3.12.1 Collective agreements for the period 1 April 2015 and 31 March 2016Total number of Collective agreements None
Table 3.12.2 Misconduct and disciplinary hearings finalised for the period 1 April 2015 and 31 March 2016
Outcomes of disciplinary hearings Number % of totalCorrectional counselling 0 0Verbal warning 2 33Written warning 3 50Final written warning 1 170Suspended without pay 0 0
Fine 0 0Demotion 0 0
Dismissal 0 0Not guilty 0 0Case withdrawn 0 0Total 6 100
TotalnumberofDisciplinaryhearingsfinalised None
Table 3.12.3 Types of misconduct addressed at disciplinary hearings for the period 1 April 2015 and 31 March 2016Type of misconduct Number % of totalGross Dishonesty: Fails to comply with or contravenes an Act 01 100Total 01 100
Table 3.12.4 Grievances logged for the period 1 April 2015 and 31 March 2016Grievances Number % of Total
Number of grievances resolved 13 45Number of grievances not resolved 16 55Total number of grievances lodged 29 100
Table 3.12.5 Disputes logged with Councils for the period 1 April 2015 and 31 March 2016Disputes Number % of Total
Number of disputes upheld 0 0Number of disputes dismissed 1 100Total number of disputes lodged 1 100
Table 3.12.6 Strike actions for the period 1 April 2015 and 31 March 2016 Total number of persons working days lost 0
Total costs working days lost 0Amount recovered as a result of no work no pay (R’000) 0
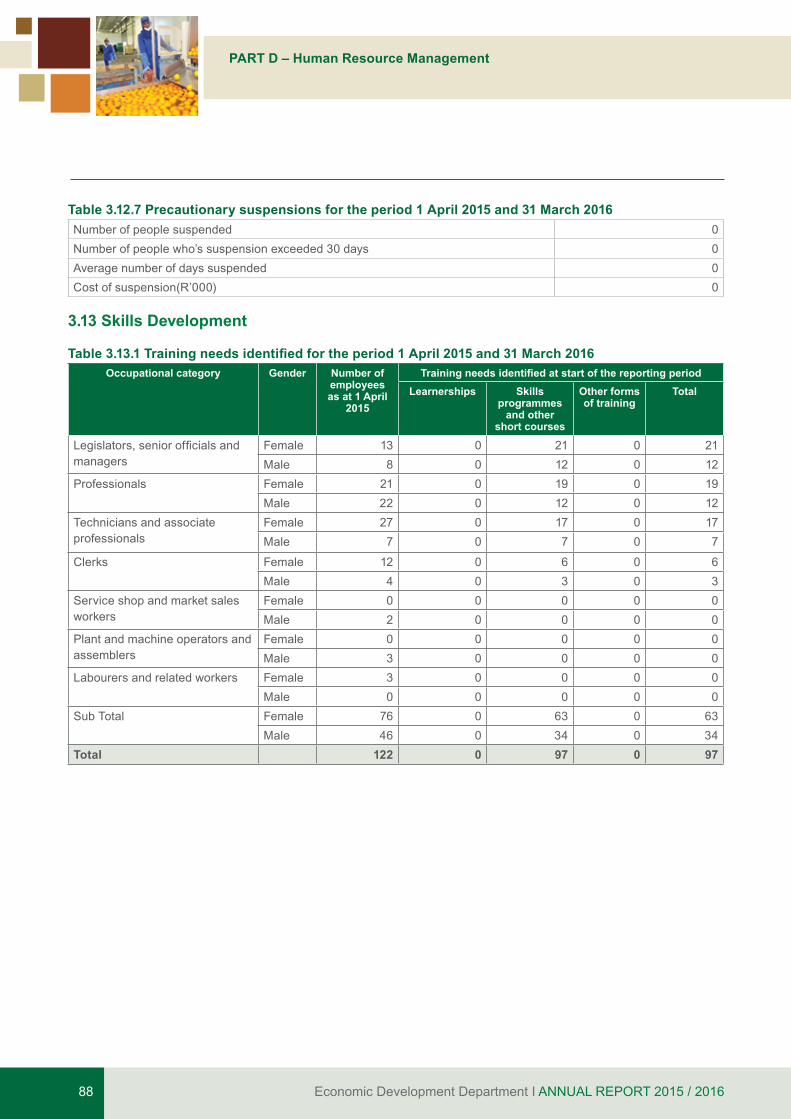
Economic Development Department I ANNUAL REPORT 2015 / 201688
PART D – Human Resource Management
Table 3.12.7 Precautionary suspensions for the period 1 April 2015 and 31 March 2016Number of people suspended 0Number of people who’s suspension exceeded 30 days 0Average number of days suspended 0Cost of suspension(R’000) 0
3.13 Skills Development
Table 3.13.1 Training needs identified for the period 1 April 2015 and 31 March 2016 Occupational category Gender Number of
employees as at 1 April
2015
Training needs identified at start of the reporting periodLearnerships Skills
programmes and other
short courses
Other forms of training
Total
Legislators,seniorofficialsandmanagers
Female 13 0 21 0 21Male 8 0 12 0 12
Professionals Female 21 0 19 0 19Male 22 0 12 0 12
Technicians and associate professionals
Female 27 0 17 0 17Male 7 0 7 0 7
Clerks Female 12 0 6 0 6Male 4 0 3 0 3
Service shop and market sales workers
Female 0 0 0 0 0Male 2 0 0 0 0
Plant and machine operators and assemblers
Female 0 0 0 0 0Male 3 0 0 0 0
Labourers and related workers Female 3 0 0 0 0Male 0 0 0 0 0
Sub Total Female 76 0 63 0 63Male 46 0 34 0 34
Total 122 0 97 0 97
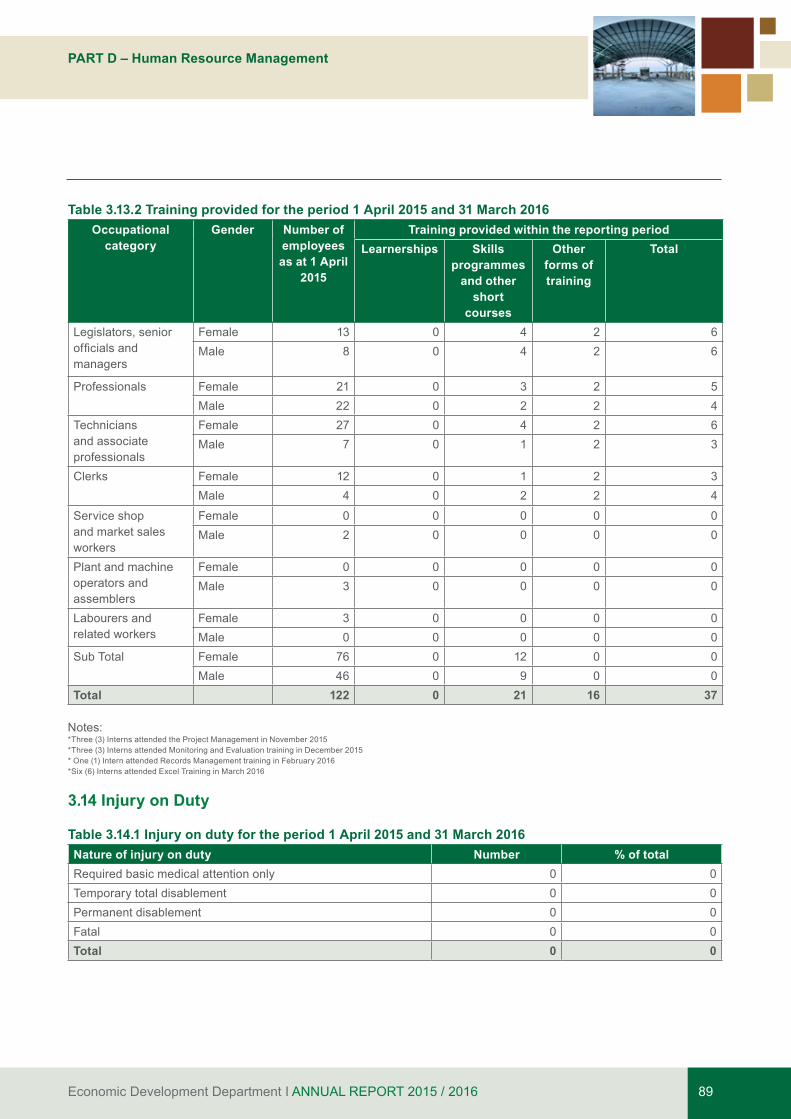
Economic Development Department I ANNUAL REPORT 2015 / 2016 89
PART D – Human Resource Management
Table 3.13.2 Training provided for the period 1 April 2015 and 31 March 2016Occupational
categoryGender Number of
employees as at 1 April
2015
Training provided within the reporting periodLearnerships Skills
programmes and other
short courses
Other forms of training
Total
Legislators, senior officialsandmanagers
Female 13 0 4 2 6Male 8 0 4 2 6
Professionals Female 21 0 3 2 5Male 22 0 2 2 4
Technicians and associate professionals
Female 27 0 4 2 6Male 7 0 1 2 3
Clerks Female 12 0 1 2 3Male 4 0 2 2 4
Service shop and market sales workers
Female 0 0 0 0 0Male 2 0 0 0 0
Plant and machine operators and assemblers
Female 0 0 0 0 0Male 3 0 0 0 0
Labourers and related workers
Female 3 0 0 0 0Male 0 0 0 0 0
Sub Total Female 76 0 12 0 0Male 46 0 9 0 0
Total 122 0 21 16 37
Notes:*Three (3) Interns attended the Project Management in November 2015*Three (3) Interns attended Monitoring and Evaluation training in December 2015* One (1) Intern attended Records Management training in February 2016 *Six (6) Interns attended Excel Training in March 2016
3.14 Injury on Duty
Table 3.14.1 Injury on duty for the period 1 April 2015 and 31 March 2016Nature of injury on duty Number % of totalRequired basic medical attention only 0 0Temporary total disablement 0 0Permanent disablement 0 0Fatal 0 0Total 0 0
Economic Development Department I ANNUAL REPORT 2015 / 201690
PART D – Human Resource Management
3.15 Utilisation of Consultants
Table 3.15.1 Report on consultant appointments using appropriated funds for the period 1 April 2015 and 31 March 2016
Project title Total number of consultants that worked on
project
Duration(work days)
Contract value inRand
Not applicable, as no consultants were appointed using appropriated funds in the year under review
- - -
Table 3.15.2 Analysis of consultant appointments using appropriated funds, in terms of Historically Disadvantaged Individuals (HDIs) for the period 1 April 2015 and 31 March 2016
Project title (%) ownership by HDI groups
(%) management by HDI groups
Number of consultants
from HDI groups that work on the
projectNot applicable, as there were no consultants appointed using appropriated funds in the year under review
- - -
Table 3.15.3 Report on consultant appointments using donor funds for the period 1 April 2015 and 31 March 2016
Project title Total Number of consultants that worked on
project
Duration(work days)
Donor and contract value in
Rand
Not applicable, as no consultants were appointed using donor funds in the year under review
- - -
Table 3.15.4 Analysis of consultant appointments using donor funds, in terms of Historically Disadvantaged Individuals (HDIs) for the period 1 April 2015 and 31 March 2016
Project title Percentage ownership by HDI groups
Percentage management by
HDI groups
Number of consultants
from HDI groups that work on the
projectNot applicable, as there were no consultants appointed using donor funds in the year under review
- - -

Economic Development Department I ANNUAL REPORT 2015 / 2016 91
PART D – Human Resource Management
3.16 Severance Packages
Table 3.16.1 Granting of employee initiated severance packages for the period 1 April 2015 and 31 March 2016
Salary band Number of applications
received
Number of applications
referred to the MPSA
Number of applications supported by
MPSA
Number of packages
approved by department
Lower skilled (Levels 1-2) 0 0 0 0Skilled (Levels 3-5) 0 0 0 0Highly skilled production (Levels 6-8) 0 0 0 0Highly skilled supervision(Levels 9-12) 0 0 0 0Senior Management (Levels 13-16) 0 0 0 0Total 0 0 0 0

Economic Development Department I ANNUAL REPORT 2015 / 201692
PART D – Human Resource Management
Economic Development Department I ANNUAL REPORT 2015 / 2016 93
PART D – Human Resource Management
PART EFinancial Information

Economic Development Department I ANNUAL REPORT 2015 / 201694
ANNUAL FINANCIAL STATEMENTS
Vote 25: For the year ended 31 March 2016
PART E – Financial Information
Economic Development Department I ANNUAL REPORT 2015 / 2016 95
TABLE OF CONTENTS
Report of the Auditor-General............................................................................................................................96
Appropriation Statements..................................................................................................................................100
Notes to the Appropriation Statements..............................................................................................................129
Statement of Financial Performance.................................................................................................................130
Statement of Financial Position.........................................................................................................................131
Statement of Changes in Net Assets.................................................................................................................132
Cash Flow Statement........................................................................................................................................133
Notes to the Annual Financial Statements (including Accounting Policies).......................................................139
Annexures.........................................................................................................................................................159
Economic Development Department I ANNUAL REPORT 2015 / 201696
PART E – Financial InformationEconomic Development Department Vote 25
Report of the Auditor-General to Parliamenton vote no. 25: Economic Development Department
Report on the financial statements
Introduction
1. I have audited the financial statements of theEconomic Development Department set out on pages 100 to 158, which comprise the appropriation statement, the statement of financial positionas at 31 March 2016, the statement of financialperformance, statement of changes in net assets, andcashflowstatement for theyear thenended,as well as the notes, comprising a summary of significantaccountingpoliciesandotherexplanatoryinformation.
Accounting officer’s responsibility for the financial statements
2. The accounting officer is responsible for thepreparation and fair presentation of these financialstatementsinaccordancewithModifiedCash Standard (MCS)prescribed by the National Treasury and the requirements of the requirements of the Public Finance Management Act of South Africa, 1999 (Act No. 1 of 1999) (PFMA), and for such internal control as the accounting officerdetermines is necessary to enable the preparation offinancialstatementsthatarefreefrommaterialmisstatement, whether due to fraud or error.
Auditor-General’s responsibility
3. My responsibility is to express an opinion on these financial statements based on myaudit. I conducted my audit in accordance with International Standards on Auditing. Those standards require that I comply with ethical requirements, and plan and perform the audit to obtain reasonable assurance about whether
the financial statements are free from materialmisstatement.
4. An audit involves performing procedures to obtain audit evidence about the amounts and disclosures in the financial statements. The proceduresselected depend on the auditor’s judgement, including the assessment of the risks of material misstatement of the financial statements,whether due to fraud or error. In making those risk assessments, the auditor considers internal control relevant to the entity’s preparation and fair presentationof thefinancialstatements inorderto design audit procedures that are appropriate in the circumstances, but not for the purpose of expressing an opinion on the effectiveness of the entity’s internal control. An audit also includes evaluating the appropriateness of accounting policies used and the reasonableness of accounting estimates made by management, as well as evaluating the overall presentation of the financialstatements.
5. I believe that the audit evidence I have obtained issufficientandappropriatetoprovideabasisformy audit opinion.
Opinion
6. In my opinion, the financial statements presentfairly,inallmaterialrespects,thefinancialpositionof the Economic Development Department as at 31March2016anditsfinancialperformanceandcashflowsfortheyearthenended,inaccordancewith the requirements of the MCS and the requirements of the PFMA.
Additional
I draw attention to the matter below. My opinion is not modifiedinrespectofthismatter.
Unaudited supplementary information
7. The supplementary information set out on pages 159 to 173 does not form part of the financialstatements and is presented as additional
Economic Development Department I ANNUAL REPORT 2015 / 2016 97
PART E – Financial InformationEconomic Development Department Vote 25
information. I have not audited this schedule and, accordingly, I do not express an opinion thereon.
Report on other legal and regulatory requirements
8. In accordance with the Public Audit Act of South Africa, 2004 (Act No. 25 of 2004) and the general notice issued in terms thereof, I have a responsibility to report findings on the reportedperformance information against predetermined objectives of selected programmes presented in the annual performance report, compliance with legislation and internal control. The objective of my tests was to identify reportable findingsas described under each subheading but not to gather evidence to express assurance on these matters. Accordingly, I do not express an opinion or conclusion on these matters.
Predetermined objectives
9. I performed procedures to obtain evidence about the usefulness and reliability of the reported performance information of the following selected programmes presented in the annual performance report of the department for the year ended 31 March 2016:
• Programmetwo(2):Growthpathandsocialdialogue on pages 43 to 47
• Programmethree(3):Investments,competitionand trade on pages 47 to 52
10. I evaluated the usefulness of the reported performance information to determine whether it was presented in accordance with the National Treasury’s annual reporting principles and whether the reported performance was consistent with the planned programmes.
I further performed tests to determine whether indicators and targets were well defined,verifiable, specific, measurable, time boundand relevant, as required by the National Treasury’s Framework for managing programme performance information(FMPPI).
11. I assessed the reliability of the reported performance information to determine whether it was valid, accurate and complete.
12. Thematerial findings in respect of the selectedprogrammes are as follows:
Programme: Growth path and social dialogue (2)
Usefulness of reported performance information
13. The FMPPI requires that performance targets should be specific in clearly identifying thenature and required level of performance and measurable.Important targets were not specificand measurable.The FMPPI also requires that performance indicators should be well definedby having clear definitions so that data can becollected consistently and is easy to understand and use. Important indicators were not well defined.
Reliability of reported performance information
14. The FMPPI requires auditees to have appropriate systems to collect, collate, verify and store performance information to ensure reliable reporting of actual achievements against planned objectives, indicators and targets. The reported performance information was not reliable when compared to the source information.
Economic Development Department I ANNUAL REPORT 2015 / 201698
PART E – Financial InformationEconomic Development Department Vote 25
Programme: Investment, competition and trade (3)
Usefulness of reported performance information
15. The FMPPI requires that performance indicators shouldbewelldefinedbyhavingcleardefinitionsso that data can be collected consistently and is easy to understand and use. Important indicators werenotwelldefined.
Reliability of reported performance information
16. The FMPPI requires auditees to have appropriate systems to collect, collate, verify and store performance information to ensure reliable reporting of actual achievements against planned objectives, indicators and targets. The reported performance information was not reliable when compared to the source information.
Additional matter
17. I draw attention to the following matter:
Achievement of planned targets
18. Refer to the annual performance report on pages 38 to 55 for information on the achievement of the planned targets for the year. This information should be considered in the context of the material findings on the usefulness and reliability of thereported performance information in paragraphs 13;14;15and16ofthisreport.
Compliance with legislation
19. I performed procedures to obtain evidence that the department had complied with applicable legislation regarding financial matters, financialmanagement and other related matters. My material findings on compliance with specific
matters in key legislation, as set out in the general notice issued in terms of the PAA, are as follows:
Financial statements, performance and annual reports
20. The financial statements submitted for auditingwere not prepared in all material respects in accordance with the prescribed reporting framework as required by section 40(1)(b) of the PFMA. Material misstatements of disclosure items identifiedbytheauditorsinthesubmittedfinancialstatements were subsequently corrected,resulting inthefinancialstatementsreceivinganunqualifiedaudit opinion.
Internal control
21. I considered internal controls relevant to my audit of the financial statements, annual performancereport and compliance with legislation. The matters reported below are limited to the significant internal control deficiencies thatresulted in the findings on annual performancereport and compliance with legislation included in this report.
Leadership
22. Cognisance is taken that it is not always possible toplanspecific,quantitativeanddetailedprojectsupfrontas a result of the dynamic nature of the economy, which has an impact on the depart-ment’s activities and performance environment. However, leadership did not exercise adequate oversight responsibility in certain instances on related internal controlsrelating to performance reporting as technical indicator descriptions and standard operating procedures were not aligned to the requirements of Framework for Strategic Plans and Annual Performance Plans.
Economic Development Department I ANNUAL REPORT 2015 / 2016 99
PART E – Financial InformationEconomic Development Department Vote 25
Financial and performance management
23. Management did not adequately implement certain internal controls to allow it to prepare regular, accurateandcompletefinancial reports thataresupported and evidenced by reliable information.
Pretoria31 July 2016
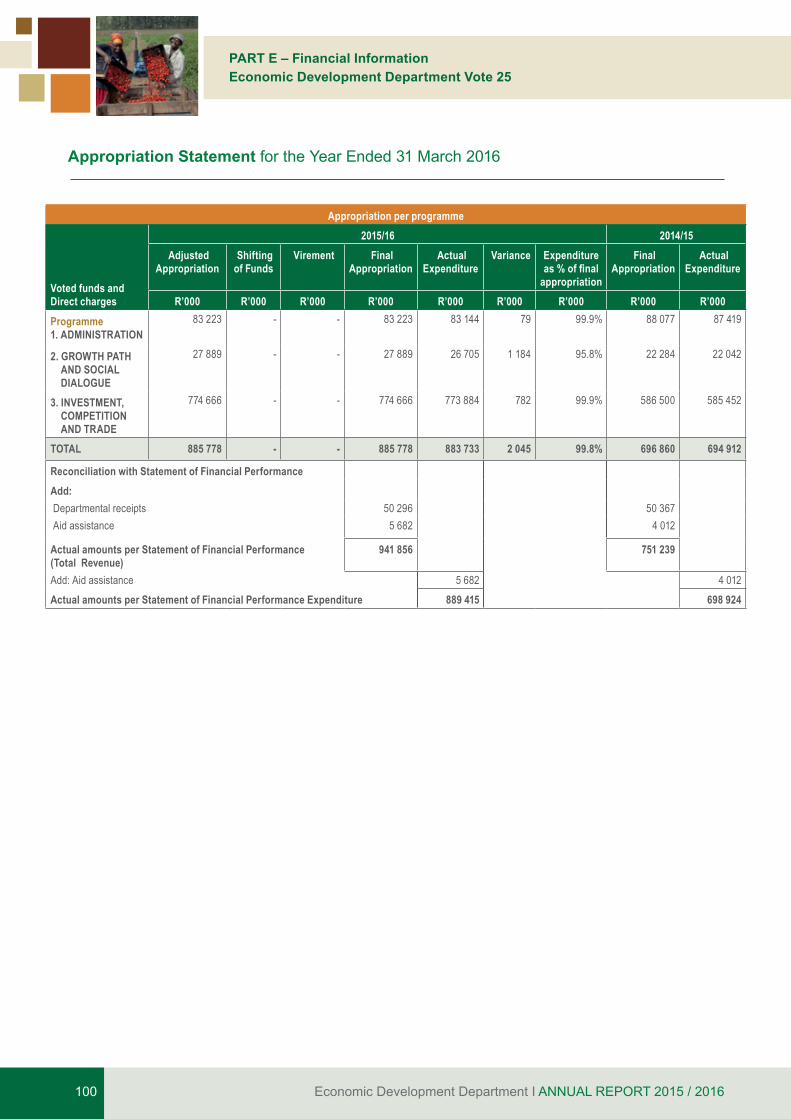
Economic Development Department I ANNUAL REPORT 2015 / 2016100
PART E – Financial InformationEconomic Development Department Vote 25
Appropriation per programme
Voted funds and Direct charges
2015/16 2014/15 Adjusted
Appropriation Shifting of Funds
Virement Final Appropriation
Actual Expenditure
Variance Expenditure as % of final
appropriation
Final Appropriation
Actual Expenditure
R’000 R’000 R’000 R’000 R’000 R’000 R’000 R’000 R’000Programme1. ADMINISTRATION
83 223 - - 83 223 83 144 79 99.9% 88 077 87 419
2. GROWTH PATH AND SOCIAL DIALOGUE
27 889 - - 27 889 26 705 1 184 95.8% 22 284 22 042
3. INVESTMENT, COMPETITION AND TRADE
774 666 - - 774 666 773 884 782 99.9% 586 500 585 452
TOTAL 885 778 - - 885 778 883 733 2 045 99.8% 696 860 694 912
Reconciliation with Statement of Financial PerformanceAdd: Departmental receipts 50 296 50 367 Aid assistance 5 682 4 012
Actual amounts per Statement of Financial Performance (Total Revenue)
941 856 751 239
Add: Aid assistance 5 682 4 012Actual amounts per Statement of Financial Performance Expenditure 889 415 698 924
Appropriation Statement for the Year Ended 31 March 2016
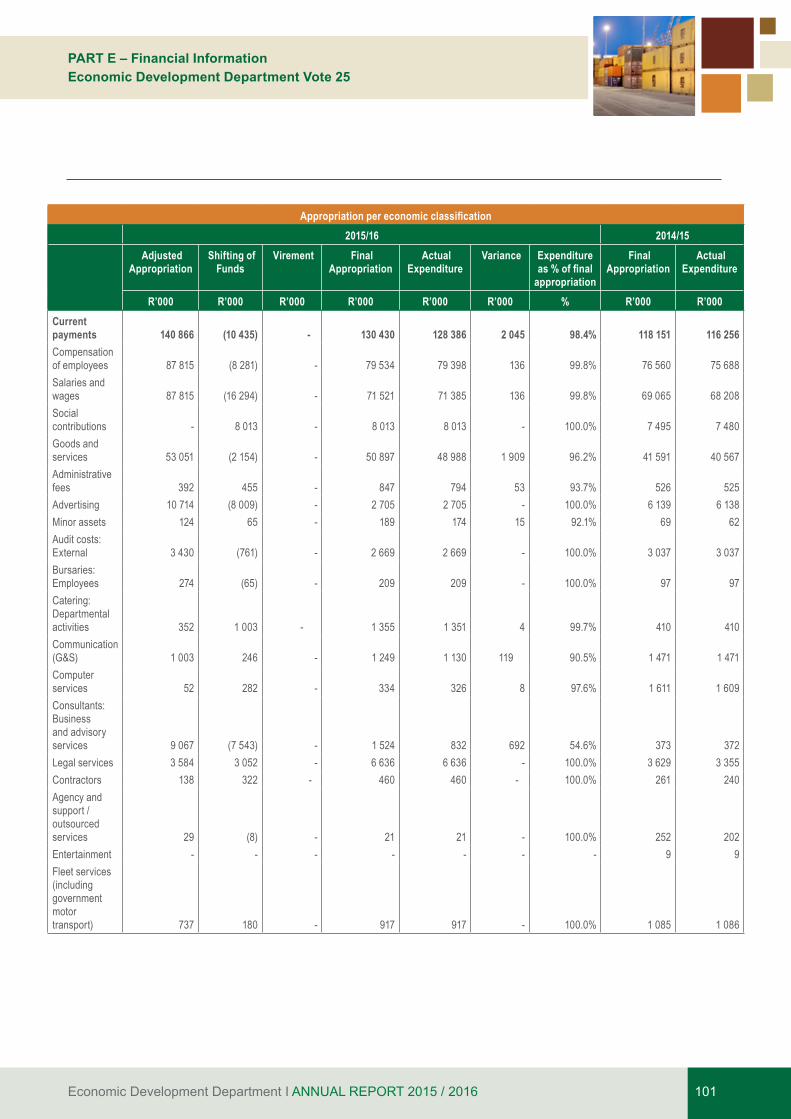
Economic Development Department I ANNUAL REPORT 2015 / 2016 101
PART E – Financial InformationEconomic Development Department Vote 25
Appropriation per economic classification 2015/16 2014/15
Adjusted
Appropriation Shifting of
Funds Virement Final
Appropriation Actual
Expenditure Variance Expenditure
as % of final appropriation
Final Appropriation
Actual Expenditure
R’000 R’000 R’000 R’000 R’000 R’000 % R’000 R’000Current payments 140 866 (10 435) - 130 430 128 386 2 045 98.4% 118 151 116 256 Compensation of employees 87 815 (8 281) - 79 534 79 398 136 99.8% 76 560 75 688 Salaries and wages 87 815 (16 294) - 71 521 71 385 136 99.8% 69 065 68 208 Social contributions - 8 013 - 8 013 8 013 - 100.0% 7 495 7 480 Goods and services 53 051 (2 154) - 50 897 48 988 1 909 96.2% 41 591 40 567 Administrative fees 392 455 - 847 794 53 93.7% 526 525 Advertising 10 714 (8 009) - 2 705 2 705 - 100.0% 6 139 6 138 Minor assets 124 65 - 189 174 15 92.1% 69 62 Audit costs: External 3 430 (761) - 2 669 2 669 - 100.0% 3 037 3 037 Bursaries: Employees 274 (65) - 209 209 - 100.0% 97 97 Catering: Departmental activities 352 1 003 - 1 355 1 351 4 99.7% 410 410 Communication (G&S) 1 003 246 - 1 249 1 130 119 90.5% 1 471 1 471 Computer services 52 282 - 334 326 8 97.6% 1 611 1 609 Consultants: Business and advisory services 9 067 (7 543) - 1 524 832 692 54.6% 373 372 Legal services 3 584 3 052 - 6 636 6 636 - 100.0% 3 629 3 355 Contractors 138 322 - 460 460 - 100.0% 261 240 Agency and support / outsourced services 29 (8) - 21 21 - 100.0% 252 202 Entertainment - - - - - - - 9 9 Fleet services (including government motor transport) 737 180 - 917 917 - 100.0% 1 085 1 086
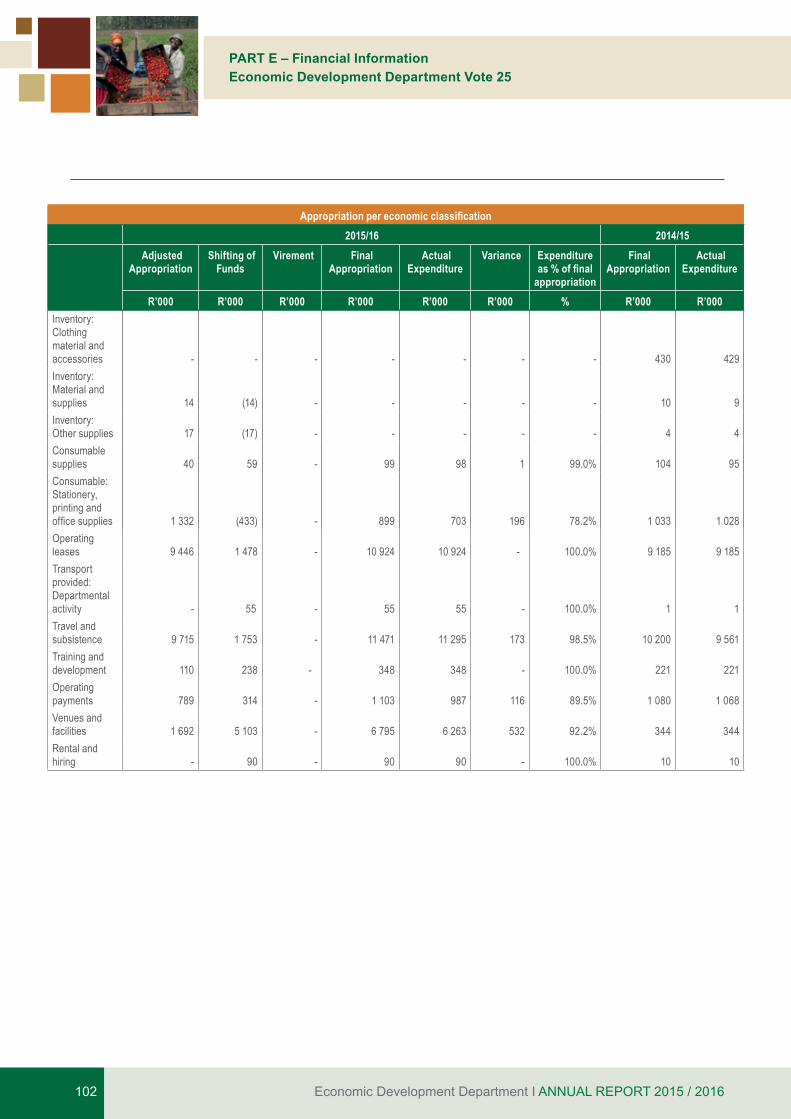
Economic Development Department I ANNUAL REPORT 2015 / 2016102
PART E – Financial InformationEconomic Development Department Vote 25
Appropriation per economic classification 2015/16 2014/15
Adjusted
Appropriation Shifting of
Funds Virement Final
Appropriation Actual
Expenditure Variance Expenditure
as % of final appropriation
Final Appropriation
Actual Expenditure
R’000 R’000 R’000 R’000 R’000 R’000 % R’000 R’000Inventory: Clothing material and accessories - - - - - - - 430 429 Inventory: Material and supplies 14 (14) - - - - - 10 9Inventory: Other supplies 17 (17) - - - - - 4 4 Consumable supplies 40 59 - 99 98 1 99.0%
104
95
Consumable: Stationery, printing and office supplies 1 332 (433) - 899 703 196 78.2% 1 033 1 028 Operating leases 9 446 1 478 - 10 924 10 924 - 100.0% 9 185 9 185 Transport provided: Departmental activity - 55 - 55 55 - 100.0% 1 1 Travel and subsistence 9 715 1 753 - 11 471 11 295 173 98.5% 10 200 9 561 Training and development 110 238 - 348 348 - 100.0% 221 221 Operating payments 789 314 - 1 103 987 116 89.5% 1 080 1 068 Venues and facilities 1 692 5 103 - 6 795 6 263 532 92.2% 344 344 Rental and hiring - 90 - 90 90 - 100.0% 10 10

Economic Development Department I ANNUAL REPORT 2015 / 2016 103
PART E – Financial InformationEconomic Development Department Vote 25
Appropriation per economic classification 2015/16 2014/15
Adjusted
Appropriation Shifting of
Funds Virement Final
Appropriation Actual
Expenditure Variance Expenditure
as % of final appropriation
Final Appropriation
Actual Expenditure
R’000 R’000 R’000 R’000 R’000 R’000 % R’000 R’000Transfers and subsidies 742 326 8 070 - 750 396 750 396 - 100.0% 575 945 575 945 Departmental agencies and accounts 330 848 8 000 - 338 848 338 848 - 100.0% 306 820 306 820 Departmental agencies (non -business entities) 330 848 8 000 - 338 848 338 848 - 100.0% 306 820 306 820 Public corporations and private enterprises 411 397 - - 411 397 411 397 - 100.0% 268 845 268 845 Public corporations 406 397 - - 406 397 406 397 - 100.0% 268 845 268 845 Other transfers to public corporations 406 397 - - 406 397 406 397 - 100.0% 268 845 268 845 Private enterprises 5 000 - - 5 000 5 000 - 100.0% - - Other transfers to private enterprises 5 000 - - 5 000 5 000 - 100.0% - - Non-profit institutions - - - - - - - 60 60 Households 81 70 - 151 151 - 100.0% 220 220 Social benefits 81 70 - 151 151 - 100.0% - - Other transfers to households - - - - - - - 220 220 Payments for capital assets 2 584 2 365 - 4 949 4 949 - 100.0% 2 764 2 712 Machinery and equipment 2 094 1 289 - 3 383 3 383 - 100.0% 2 764 2 712 Other machinery and equipment 2 094 1 289 - 3 383 3 383 - 100.0% 2 764 2 712 Software and other intangible assets 490 1 076 - 1 566 1 566 - 100.0% - - Payment for financial assets 2 - - 2 2 - 100.0% - -
885 778 - - 885 778 883 733 2 045 99.8% 696 860 694 912

Economic Development Department I ANNUAL REPORT 2015 / 2016104
PART E – Financial InformationEconomic Development Department Vote 25
Programme 1: ADMINISTRATION
2015/16 2014/15
Adjusted Appropriation
Shifting of Funds
Virement Final Appropriation
Actual Expenditure
Variance Expenditure as % of final
appropriation
Final Appropriation
Actual Expenditure
R’000 R’000 R’000 R’000 R’000 R’000 % R’000 R’000
1. MINISTRY 20 582 (419) - 20 163 20 160 3 100.0% 20 422 19 829 2. OFFICE OF THE DIRECTOR GENERAL 9 312 5 266 - 14 578 14 578 - 100.0% 12 611 12 583 3. CORPORATE MANAGEMENT SERVICES 41 523 (4 905) - 36 618 36 618 - 100.0% 55 044 55 008
4. FINANCIAL MANAGEMENT 11 806 58 - 11 864 11 788 76 99.4% - - 83 223 - - 83 223 83 144 79 99.9% 88 077 87 419
Economic classification Current payments 80 917 (805) - 80 112 80 033 79 99.9% 75,149 74 498 Compensation of employees 42 816 (1 047) - 41 769 41 690 79 99.8% 39 575 39 534 Salaries and wages 42 816 (5 455) - 37 361 37 282 79 99.8% 35 337 35 312 Social contributions - 4 408 - 4 408 4 408 - 100.0% 4 238 4 222 Goods and services 38 101 242 - 38 343 38 343 - 100.0% 35 574 34 964 Administrative fees 237 470 - 707 707 - 100.0% 246 245 Advertising 10 714 (10,223) - 491 491 - 100.0% 6 139 6 138 Minor assets 89 83 - 172 172 - 100.0% 65 62 Audit costs: External 3 430 (761) - 2 669 2 669 - 100.0% 3 037 3 037 Bursaries: Employees 274 (65) - 209 209 - 100.0% 97 97 Catering: Departmental activities 72 124 - 196 196 - 100.0% 115 115 Communication (G&S) 778 276 - 1 054 1 054 - 100.0% 1 287 1 287 Computer services 28 282 - 310 310 - 100.0% 377 375 Consultants: Business and advisory services 410 156 - 566 566 - 100.0% 352 351 Legal services 3 584 3 052 - 6 636 6 636 - 100.0% 3 355 3 355

Economic Development Department I ANNUAL REPORT 2015 / 2016 105
PART E – Financial InformationEconomic Development Department Vote 25
Programme 1: ADMINISTRATION
2015/16 2014/15
Adjusted Appropriation
Shifting of Funds
Virement Final Appropriation
Actual Expenditure
Variance Expenditure as % of final
appropriation
Final Appropriation
Actual Expenditure
R’000 R’000 R’000 R’000 R’000 R’000 % R’000 R’000Contractors 138 (31) - 107 107 - 100.0% 161 157 Agency and support / outsourced services 29 (8) - 21 21 - 100.0% 202 202 Entertainment - - - - - - - 9 9 Fleet services (including government motor transport) 723 175 - 898 898 - 100.0% 1 072 1 073 Inventory: Materials and supplies 14 (14) - - - - - 10 9 Inventory: other supplies 17 (17) - - - - - - -Consumable supplies 36 55 - 91 91 - 100.0% 97
88
Consumable: Stationery, printing and office supplies 919 (328) - 591 591 - 100.0% 971
968
Operating leases 9 446 1 478 - 10 924 10 924 - 100.0% 9 185 9 185 Travel and subsistence 6 586 2 368 - 8 954 8 954 - 100.0% 7 642 7 058 Training and development 110 238 - 348 348 - 100.0% 221
221
Operating payments 459 363 - 822 822 - 100.0% 872
871
Venues and facilities 8 2 479 - 2 489 2 489 - 100.0% 62
62
Rental and hiring - 90 - 90 90 - 100.0% - - Transfers and subsidies 60 1 - 61 61 - 100.0% 10 487 10 487 Departmental agencies and accounts - - - - - - - 10 408 10 408 Departmental agencies (non-business entities) - - - - - - - 10 408 10 408 Households 60 1 - 61 61 - 100.0% 79 79 Social benefits 60 1 - 61 61 - 100.0% - - Other transfers to households
- - - - - - - 79 79
Payments for capital assets
2 244 804 - 3 048 3 048 - 100.0% 2 441 2 434

Economic Development Department I ANNUAL REPORT 2015 / 2016106
PART E – Financial InformationEconomic Development Department Vote 25
Programme 1: ADMINISTRATION
2015/16 2014/15
Adjusted Appropriation
Shifting of Funds
Virement Final Appropriation
Actual Expenditure
Variance Expenditure as % of final
appropriation
Final Appropriation
Actual Expenditure
R’000 R’000 R’000 R’000 R’000 R’000 % R’000 R’000Machinery and equipment
1 754 1 223 - 2 977 2 977 - 100.0% 2 441 2 434
Other machinery and equipment
1 754 1 223 - 2 977 2 977 - 100.0% 2 441 2 434
Software and other intangible assets
490 (419) - 71 71 - 100.0% - -
Payment for financial assets
2 - - 2 2 - 100.0% - -
83 223 - - 83 223 83 144 79 99.9% 88 077 87 419
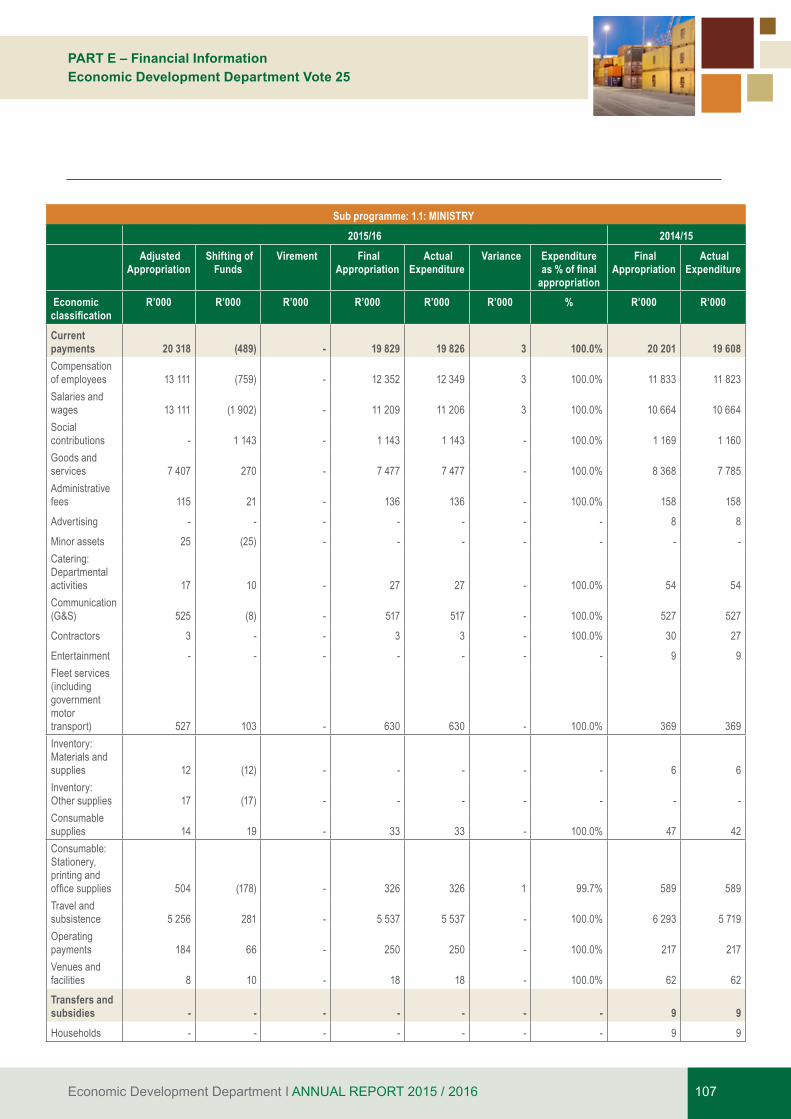
Economic Development Department I ANNUAL REPORT 2015 / 2016 107
PART E – Financial InformationEconomic Development Department Vote 25
Sub programme: 1.1: MINISTRY 2015/16 2014/15 Adjusted
Appropriation Shifting of
Funds Virement Final
Appropriation Actual
Expenditure Variance Expenditure
as % of final appropriation
Final Appropriation
Actual Expenditure
Economic classification
R’000 R’000 R’000 R’000 R’000 R’000 % R’000 R’000
Current payments 20 318 (489) - 19 829 19 826 3 100.0% 20 201 19 608Compensation of employees 13 111 (759) - 12 352 12 349 3 100.0% 11 833 11 823Salaries and wages 13 111 (1 902) - 11 209 11 206 3 100.0% 10 664 10 664Social contributions - 1 143 - 1 143 1 143 - 100.0% 1 169 1 160Goods and services 7 407 270 - 7 477 7 477 - 100.0% 8 368 7 785Administrative fees 115 21 - 136 136 - 100.0% 158 158
Advertising - - - - - - - 8 8
Minor assets 25 (25) - - - - - - -Catering: Departmental activities 17 10 - 27 27 - 100.0% 54 54Communication (G&S) 525 (8) - 517 517 - 100.0% 527 527
Contractors 3 - - 3 3 - 100.0% 30 27
Entertainment - - - - - - - 9 9Fleet services (including government motor transport) 527 103 - 630 630 - 100.0% 369 369Inventory: Materials and supplies 12 (12) - - - - - 6 6Inventory: Other supplies 17 (17) - - - - - - -Consumable supplies 14 19 - 33 33 - 100.0% 47 42Consumable: Stationery, printing and office supplies 504 (178) - 326 326 1 99.7% 589 589Travel and subsistence 5 256 281 - 5 537 5 537 - 100.0% 6 293 5 719Operating payments 184 66 - 250 250 - 100.0% 217 217Venues and facilities 8 10 - 18 18 - 100.0% 62 62Transfers and subsidies - - - - - - - 9 9Households - - - - - - - 9 9

Economic Development Department I ANNUAL REPORT 2015 / 2016108
PART E – Financial InformationEconomic Development Department Vote 25
Sub programme: 1.1: MINISTRY 2015/16 2014/15 Adjusted
Appropriation Shifting of
Funds Virement Final
Appropriation Actual
Expenditure Variance Expenditure
as % of final appropriation
Final Appropriation
Actual Expenditure
Economic classification
R’000 R’000 R’000 R’000 R’000 R’000 % R’000 R’000
Other transfers to households - - - - - - - 9 9Payments for capital assets 264 70 - 334 334 - 100.0% 212 212Machinery and equipment 264 70 - 334 334 - 100.0% 212 212Other machinery and equipment 264 70 - 334 334 - 100.0% 212 212Total 20 582 (419) - 20 163 20 160 3 100.0% 20 422 19 829
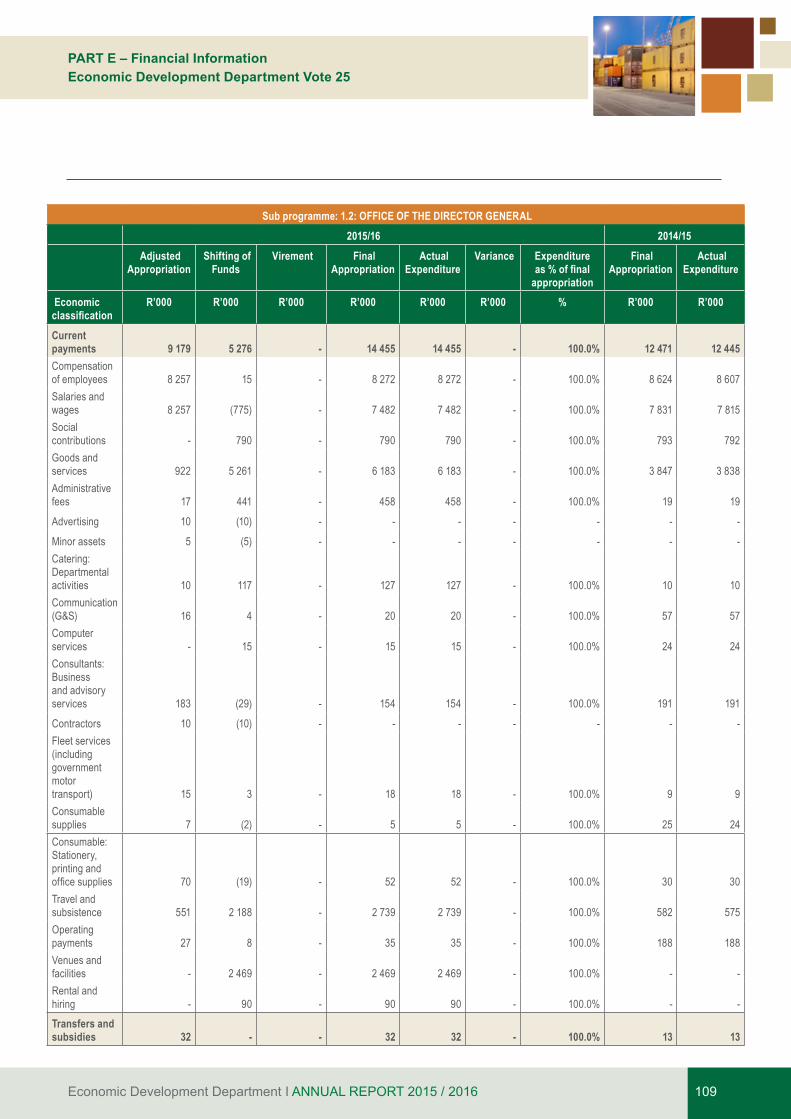
Economic Development Department I ANNUAL REPORT 2015 / 2016 109
PART E – Financial InformationEconomic Development Department Vote 25
Sub programme: 1.2: OFFICE OF THE DIRECTOR GENERAL 2015/16 2014/15 Adjusted
Appropriation Shifting of
Funds Virement Final
Appropriation Actual
Expenditure Variance Expenditure
as % of final appropriation
Final Appropriation
Actual Expenditure
Economic classification
R’000 R’000 R’000 R’000 R’000 R’000 % R’000 R’000
Current payments 9 179 5 276 - 14 455 14 455 - 100.0% 12 471 12 445Compensation of employees 8 257 15 - 8 272 8 272 - 100.0% 8 624 8 607Salaries and wages 8 257 (775) - 7 482 7 482 - 100.0% 7 831 7 815Social contributions - 790 - 790 790 - 100.0% 793 792Goods and services 922 5 261 - 6 183 6 183 - 100.0% 3 847 3 838Administrative fees 17 441 - 458 458 - 100.0% 19 19
Advertising 10 (10) - - - - - - -
Minor assets 5 (5) - - - - - - -Catering: Departmental activities 10 117 - 127 127 - 100.0% 10 10Communication (G&S) 16 4 - 20 20 - 100.0% 57 57Computer services - 15 - 15 15 - 100.0% 24 24Consultants: Business and advisory services 183 (29) - 154 154 - 100.0% 191 191
Contractors 10 (10) - - - - - - -Fleet services (including government motor transport) 15 3 - 18 18 - 100.0% 9 9Consumable supplies 7 (2) - 5 5 - 100.0% 25 24Consumable: Stationery, printing and office supplies 70 (19) - 52 52 - 100.0% 30 30Travel and subsistence 551 2 188 - 2 739 2 739 - 100.0% 582 575Operating payments 27 8 - 35 35 - 100.0% 188 188Venues and facilities - 2 469 - 2 469 2 469 - 100.0% - -Rental and hiring - 90 - 90 90 - 100.0% - -Transfers and subsidies 32 - - 32 32 - 100.0% 13 13

Economic Development Department I ANNUAL REPORT 2015 / 2016110
PART E – Financial InformationEconomic Development Department Vote 25
Sub programme: 1.2: OFFICE OF THE DIRECTOR GENERAL 2015/16 2014/15 Adjusted
Appropriation Shifting of
Funds Virement Final
Appropriation Actual
Expenditure Variance Expenditure
as % of final appropriation
Final Appropriation
Actual Expenditure
Economic classification
R’000 R’000 R’000 R’000 R’000 R’000 % R’000 R’000
Households 32 - - 32 32 - 100.0% 13 13
Social benefits 32 - - 32 32 - 100.0% - -Other transfers to households - - - - - - - 13 13Payments for capital assets 101 (10) - 91 91 - 100.0% 127 125Machinery and equipment 101 (10) - 91 91 - 100.0% 127 125Other machinery and equipment 101 (10) - 91 91 - 100.0% 127 125
Total 9 312 5 266 - 14 578 14 578 - 100.0% 12 611 12 583
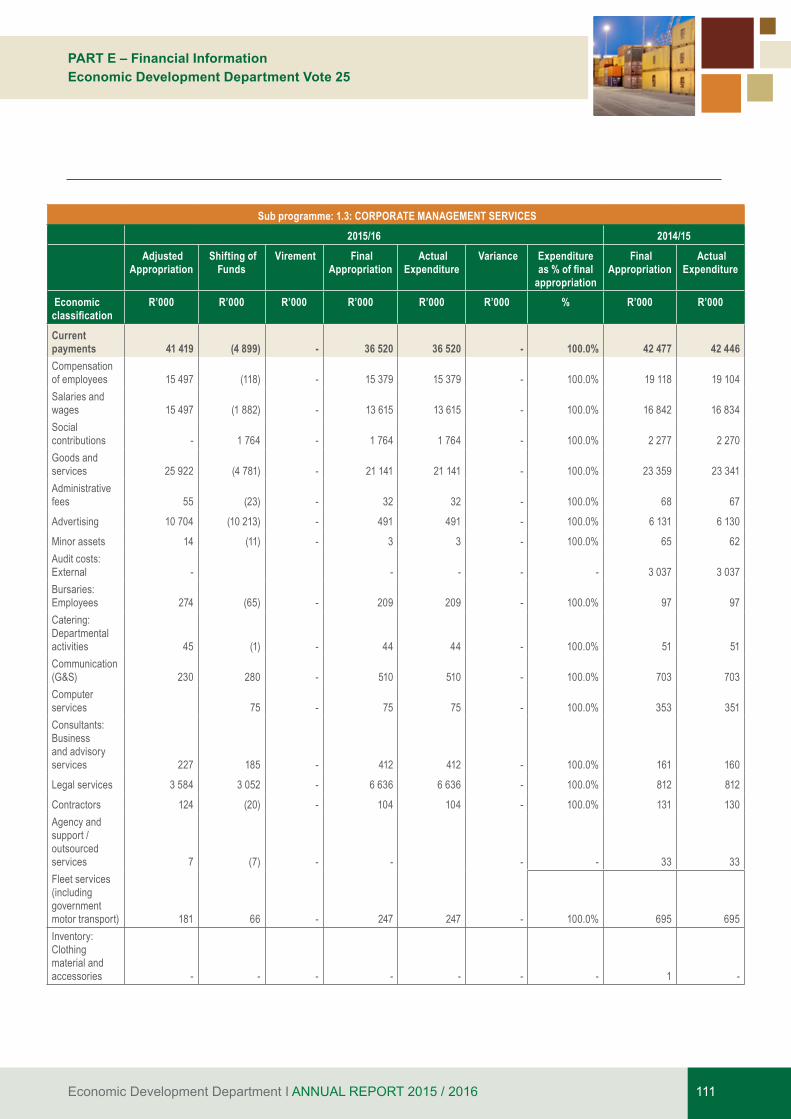
Economic Development Department I ANNUAL REPORT 2015 / 2016 111
PART E – Financial InformationEconomic Development Department Vote 25
Sub programme: 1.3: CORPORATE MANAGEMENT SERVICES 2015/16 2014/15 Adjusted
Appropriation Shifting of
Funds Virement Final
Appropriation Actual
Expenditure Variance Expenditure
as % of final appropriation
Final Appropriation
Actual Expenditure
Economic classification
R’000 R’000 R’000 R’000 R’000 R’000 % R’000 R’000
Current payments 41 419 (4 899) - 36 520 36 520 - 100.0% 42 477 42 446 Compensation of employees 15 497 (118) - 15 379 15 379 - 100.0% 19 118 19 104 Salaries and wages 15 497 (1 882) - 13 615 13 615 - 100.0% 16 842 16 834 Social contributions - 1 764 - 1 764 1 764 - 100.0% 2 277 2 270 Goods and services 25 922 (4 781) - 21 141 21 141 - 100.0% 23 359 23 341 Administrative fees 55 (23) - 32 32 - 100.0% 68 67
Advertising 10 704 (10 213) - 491 491 - 100.0% 6 131 6 130
Minor assets 14 (11) - 3 3 - 100.0% 65 62 Audit costs: External - - - - - 3 037 3 037 Bursaries: Employees 274 (65) - 209 209 - 100.0% 97 97 Catering: Departmental activities 45 (1) - 44 44 - 100.0% 51 51 Communication (G&S) 230 280 - 510 510 - 100.0% 703 703 Computer services 75 - 75 75 - 100.0% 353 351 Consultants: Business and advisory services 227 185 - 412 412 - 100.0% 161 160
Legal services 3 584 3 052 - 6 636 6 636 - 100.0% 812 812
Contractors 124 (20) - 104 104 - 100.0% 131 130 Agency and support / outsourced services 7 (7) - - - - 33 33 Fleet services (including government motor transport) 181 66 - 247 247 - 100.0% 695 695 Inventory: Clothing material and accessories - - - - - - - 1 -

Economic Development Department I ANNUAL REPORT 2015 / 2016112
PART E – Financial InformationEconomic Development Department Vote 25
Sub programme: 1.3: CORPORATE MANAGEMENT SERVICES 2015/16 2014/15 Adjusted
Appropriation Shifting of
Funds Virement Final
Appropriation Actual
Expenditure Variance Expenditure
as % of final appropriation
Final Appropriation
Actual Expenditure
Economic classification
R’000 R’000 R’000 R’000 R’000 R’000 % R’000 R’000
Inventory: Materials and supplies 2 (2) - - - - - 4 4 Consumable supplies 12 40 - 52 52 - 100.0% 24 23 Consumable: Stationery, printing and office supplies 114 (37) - 77 77 - 100.0% 352 350 Operating leases 9 446 1 478 - 10 924 10 924 - 100.0% 9 185 9 185 Travel and subsistence 593 (94) - 499 499 - 100.0% 767 764 Training and development 110 238 - 348 348 - 100.0% 221 221 Operating payments 200 278 - 478 478 - 100.0% 467 466 Transfers and subsidies 1 - - 1 1 - 100.0% 10 465 10 465 Departmental agencies and accounts - - - - - - - 10 408 10 408 Departmental agencies (non - business entities) - - - - - - - 10 408 10 408
Households 1 - - 1 1 - 100.0% 57 57
Social benefits 1 - - 1 1 - 100.0% - - Other transfers to households - - - - - - - 57 57 Payments for capital assets 104 (7) - 97 97 - 100.0% 2 102 2 097 Machinery and equipment 104 (7) - 97 97 - 100.0% 2 102 2 097 Other machinery and equipment 104 (7) - 97 97 - 100.0% 2 102 2 097
Total 41 523 (4 905) - 36 618 36 618 - 100.0% 55 044 55 008
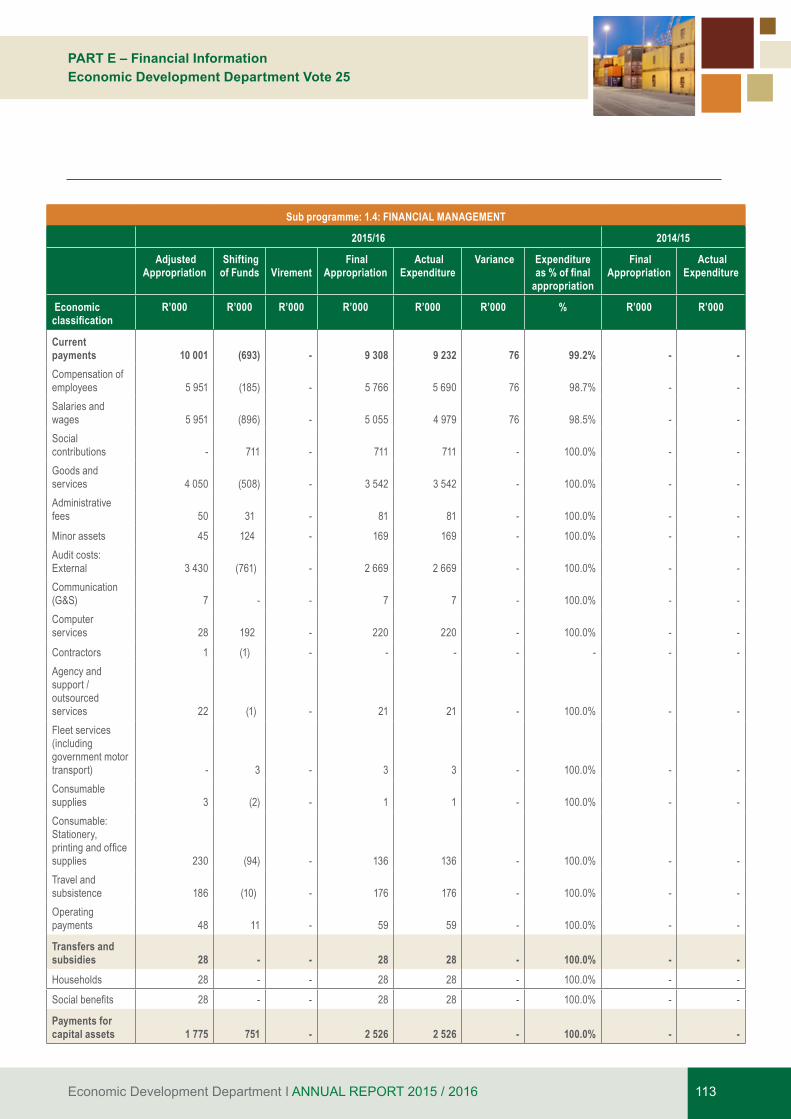
Economic Development Department I ANNUAL REPORT 2015 / 2016 113
PART E – Financial InformationEconomic Development Department Vote 25
Sub programme: 1.4: FINANCIAL MANAGEMENT
2015/16 2014/15
Adjusted Appropriation
Shifting of Funds
Virement
Final Appropriation
Actual Expenditure
Variance Expenditure as % of final
appropriation
Final Appropriation
Actual Expenditure
Economic classification
R’000 R’000 R’000 R’000 R’000 R’000 % R’000 R’000
Current payments 10 001 (693) - 9 308 9 232 76 99.2% - -Compensation of employees 5 951 (185) - 5 766 5 690 76 98.7% - -Salaries and wages 5 951 (896) - 5 055 4 979 76 98.5% - -Social contributions - 711 - 711 711 - 100.0% - -Goods and services 4 050 (508) - 3 542 3 542 - 100.0% - -Administrative fees 50 31 - 81 81 - 100.0% - -
Minor assets 45 124 - 169 169 - 100.0% - -Audit costs: External 3 430 (761) - 2 669 2 669 - 100.0% - -Communication (G&S) 7 - - 7 7 - 100.0% - -Computer services 28 192 - 220 220 - 100.0% - -
Contractors 1 (1) - - - - - - -Agency and support / outsourced services 22 (1) - 21 21 - 100.0% - -Fleet services (including government motor transport) -
3 - 3 3 - 100.0% - -
Consumable supplies 3 (2) - 1 1 - 100.0% - -Consumable: Stationery, printing and office supplies 230
(94) - 136 136 - 100.0% - -
Travel and subsistence 186 (10) - 176 176 - 100.0% - -Operating payments 48 11 - 59 59 - 100.0% - -
Transfers and subsidies 28 - - 28 28 - 100.0% - -Households 28 - - 28 28 - 100.0% - -
Social benefits 28 - - 28 28 - 100.0% - -
Payments for capital assets 1 775 751 - 2 526 2 526 - 100.0% - -
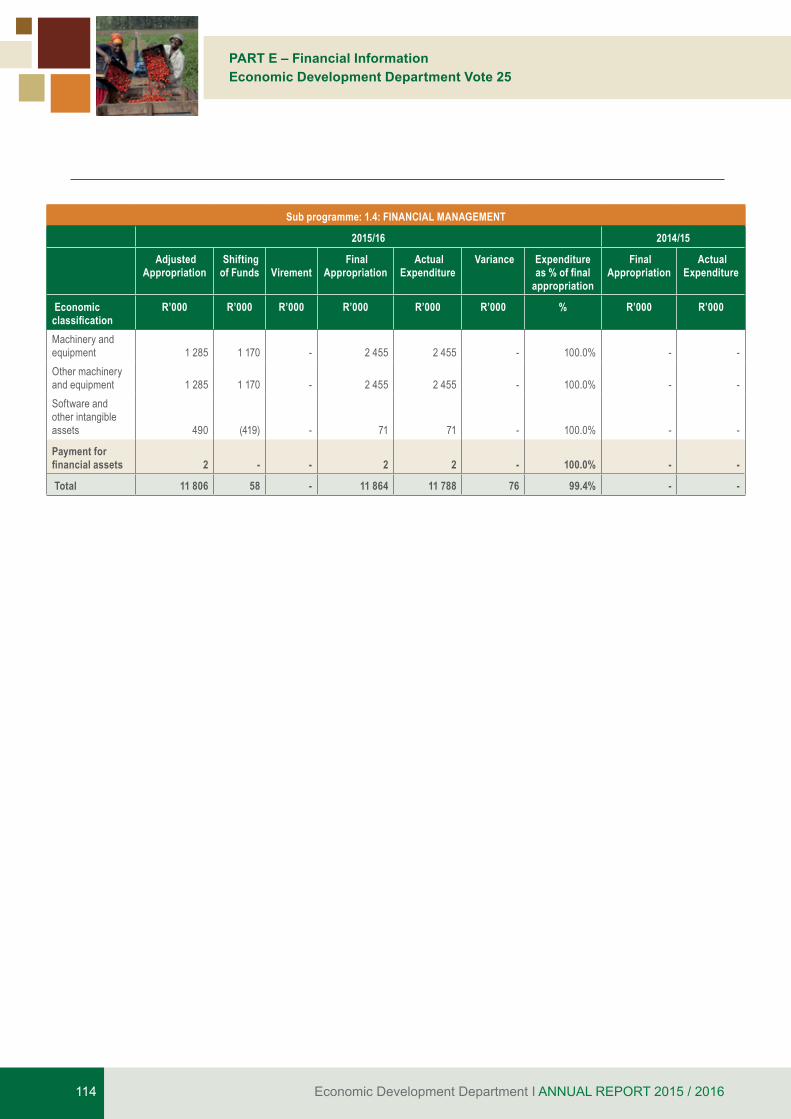
Economic Development Department I ANNUAL REPORT 2015 / 2016114
PART E – Financial InformationEconomic Development Department Vote 25
Sub programme: 1.4: FINANCIAL MANAGEMENT
2015/16 2014/15
Adjusted Appropriation
Shifting of Funds
Virement
Final Appropriation
Actual Expenditure
Variance Expenditure as % of final
appropriation
Final Appropriation
Actual Expenditure
Economic classification
R’000 R’000 R’000 R’000 R’000 R’000 % R’000 R’000
Machinery and equipment 1 285 1 170 - 2 455 2 455 - 100.0% - -Other machinery and equipment 1 285 1 170 - 2 455 2 455 - 100.0% - -Software and other intangible assets 490 (419) - 71 71 - 100.0% - -
Payment for financial assets 2 - - 2 2 - 100.0% - -
Total 11 806 58 - 11 864 11 788 76 99.4% - -
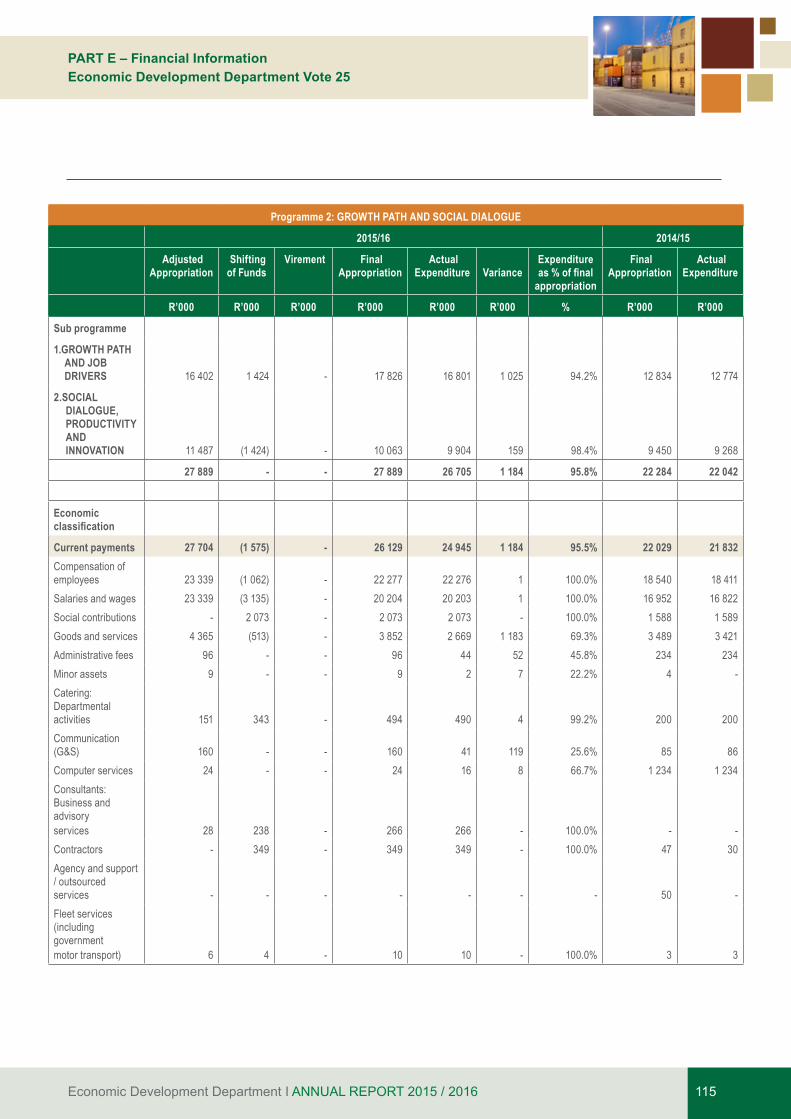
Economic Development Department I ANNUAL REPORT 2015 / 2016 115
PART E – Financial InformationEconomic Development Department Vote 25
Programme 2: GROWTH PATH AND SOCIAL DIALOGUE
2015/16 2014/15
Adjusted Appropriation
Shifting of Funds
Virement Final Appropriation
Actual Expenditure
Variance
Expenditure as % of final
appropriation
Final Appropriation
Actual Expenditure
R’000 R’000 R’000 R’000 R’000 R’000 % R’000 R’000
Sub programme
1.GROWTH PATH AND JOB DRIVERS 16 402 1 424 - 17 826 16 801 1 025 94.2% 12 834 12 774
2.SOCIAL DIALOGUE, PRODUCTIVITY AND INNOVATION 11 487 (1 424) - 10 063 9 904 159 98.4% 9 450 9 268
27 889 - - 27 889 26 705 1 184 95.8% 22 284 22 042
Economic classification
Current payments 27 704 (1 575) - 26 129 24 945 1 184 95.5% 22 029 21 832 Compensation of employees 23 339 (1 062) - 22 277 22 276 1 100.0% 18 540 18 411 Salaries and wages 23 339 (3 135) - 20 204 20 203 1 100.0% 16 952 16 822 Social contributions - 2 073 - 2 073 2 073 - 100.0% 1 588 1 589 Goods and services 4 365 (513) - 3 852 2 669 1 183 69.3% 3 489 3 421 Administrative fees 96 - - 96 44 52 45.8% 234 234 Minor assets 9 - - 9 2 7 22.2% 4 - Catering: Departmental activities 151 343 - 494 490 4 99.2% 200 200 Communication (G&S) 160 - - 160 41 119 25.6% 85 86 Computer services 24 - - 24 16 8 66.7% 1 234 1 234 Consultants: Business and advisory services 28 238 - 266 266 - 100.0% - - Contractors - 349 - 349 349 - 100.0% 47 30 Agency and support / outsourced services - - - - - - - 50 - Fleet services (including government motor transport) 6 4 - 10 10 - 100.0% 3 3

Economic Development Department I ANNUAL REPORT 2015 / 2016116
PART E – Financial InformationEconomic Development Department Vote 25
Programme 2: GROWTH PATH AND SOCIAL DIALOGUE
2015/16 2014/15
Adjusted Appropriation
Shifting of Funds
Virement Final Appropriation
Actual Expenditure
Variance
Expenditure as % of final
appropriation
Final Appropriation
Actual Expenditure
R’000 R’000 R’000 R’000 R’000 R’000 % R’000 R’000Inventory: Clothing material and accessories - - - - - - - 31 31 Consumable supplies 3 4 - 7 6 1 85.7% 5 5 Consumable: Stationery, printing and office supplies 201 - - 201 30 171 14.9% 18 18 Transport provided: Departmental activity - 55 - 55 55 - 100.0% - - Travel and subsistence 1 782 (486) - 1 296 1 123 173 86.7% 1 154 1 157 Operating payments 265 (95) - 170 54 116 31.8% 135 135 Venues and facilities 1 640 (925) - 715 183 532 25.6% 279 278 Rental and hiring - - - - - - - 10 10
Transfers and subsidies 21 69 - 90 90 - 100.0% 79 79 Households 21 69 - 90 90 - 100.0% 79 79 Social benefits 21 69 - 90 90 - 100.0% - - Other transfers to households - - - - - - - 79 79
Payments for capital assets 164 1 506 - 1 670 1 670 - 100.0% 176 130 Machinery and equipment 164 11 - 175 175 - 100.0% 176 130 Other machinery and equipment 164 11 - 175 175 - 100.0% 176 130 Software and other intangible assets - 1 495 - 1 495 1 495 - 100.0% - -
27 889 - - 27 889 26 705 1 184 95.8% 22 284 22 042

Economic Development Department I ANNUAL REPORT 2015 / 2016 117
PART E – Financial InformationEconomic Development Department Vote 25
Sub programme: 2.1: GROWTH PATH AND JOB DRIVERS
2015/16 2014/15
Adjusted Appropriation
Shifting of Funds
Virement Final Appropriation
Actual Expenditure
Variance Expenditure as % of final
appropriation
Final Appropriation
Actual Expenditure
Economic classification
R’000 R’000 R’000 R’000 R’000 R’000 % R’000 R’000
Current payments 16 301 (121) - 16 180 15 155 1 025 93.7% 12 729 12 683 Compensation of employees 13 884 365 - 14 249 14 249 - 100.0% 10 286 10 243 Salaries and wages 13 884 (969) - 12 915 12 915 - 100.0% 9 479 9 436 Social contributions - 1 334 - 1 334 1 334 - 100.0% 807 807 Goods and services 2 417 (486) - 1 931 906 1 025 46.9% 2 443 2 440 Administrative fees 70 - - 70 22 48 31.4% 214 214
Minor assets 9 - - 9 2 7 22.2% 4 Catering: Departmental activities 106 (70) - 36 32 4 88.9% 100 100 Communication (G&S) 92 - - 92 6 86 6.5% 49 50 Computer services 24 - - 24 16 8 66.7% 1 234 1 234 Consultants: Business and advisory services 28 63 - 91 91 - 100.0% - - Fleet services (including government motor transport) 3 3 - 6 6 - 100.0% 1 1 Consumable supplies 1 4 - 5 5 - 100.0% 4 4 Consumable: Stationery, printing and office supplies 140 - - 140 1 139 0.7% - - Travel and subsistence 1 302 (486) - 816 685 131 83.9% 612 612 Operating payments 99 - - 99 29 70 29.3% 1 1 Venues and facilities 543 - - 543 11 532 2.0% 224 224
Transfers and subsidies - 42 - 42 42 - 100.0% 15 15 Households - 42 - 42 42 - 100.0% 15 15

Economic Development Department I ANNUAL REPORT 2015 / 2016118
PART E – Financial InformationEconomic Development Department Vote 25
Sub programme: 2.1: GROWTH PATH AND JOB DRIVERS
2015/16 2014/15
Adjusted Appropriation
Shifting of Funds
Virement Final Appropriation
Actual Expenditure
Variance Expenditure as % of final
appropriation
Final Appropriation
Actual Expenditure
Economic classification
R’000 R’000 R’000 R’000 R’000 R’000 % R’000 R’000
Social benefits - 42 - 42 42 - 100.0% - - Other transfers to households - - - - - - - 15 15
Payments for capital assets 101 1 503 - 1 604 1 604 - 100.0% 90 75 Machinery and equipment 101 8 - 109 109 - 100.0% 90 75 Other machinery and equipment 101 8 - 109 109 - 100.0% 90 75 Software and other intangible assets - 1 495 - 1 495 1 495 - 100.0% - -
Total 16 402 1 424 - 17 826 16 801 1 025 94.2% 12 834 12 774
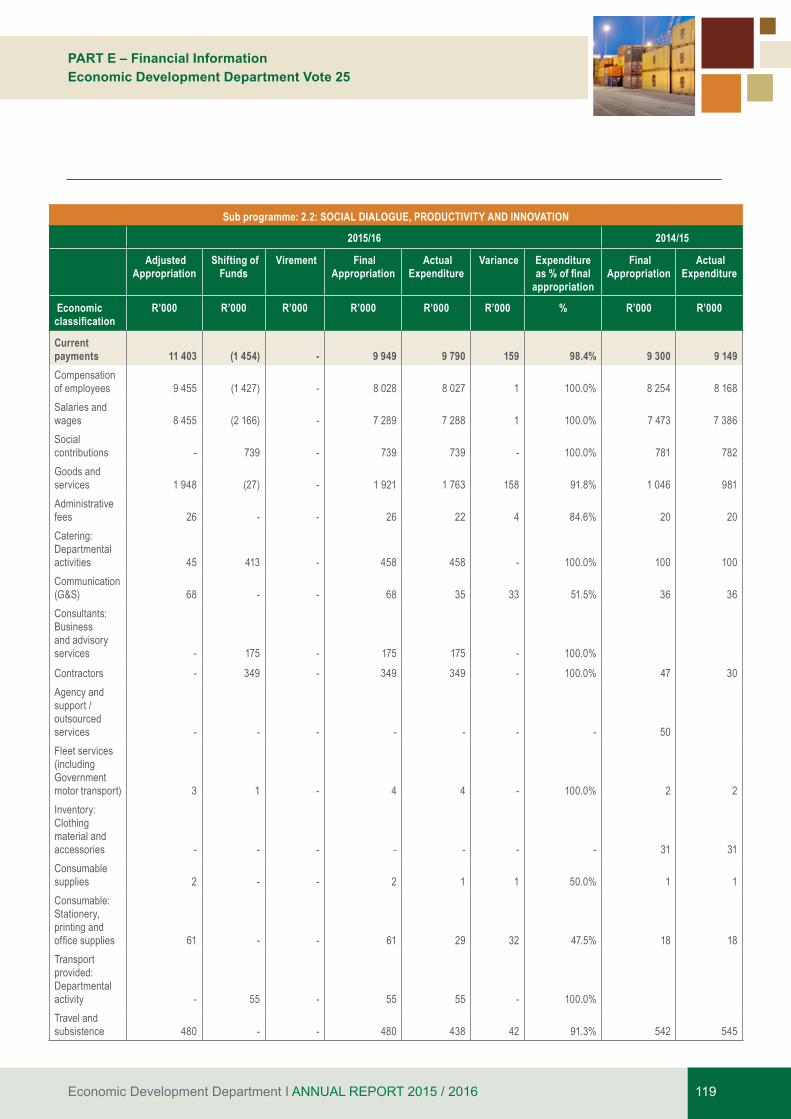
Economic Development Department I ANNUAL REPORT 2015 / 2016 119
PART E – Financial InformationEconomic Development Department Vote 25
Sub programme: 2.2: SOCIAL DIALOGUE, PRODUCTIVITY AND INNOVATION
2015/16 2014/15
Adjusted Appropriation
Shifting of Funds
Virement Final Appropriation
Actual Expenditure
Variance Expenditure as % of final
appropriation
Final Appropriation
Actual Expenditure
Economic classification
R’000 R’000 R’000 R’000 R’000 R’000 % R’000 R’000
Current payments 11 403 (1 454) - 9 949 9 790 159 98.4% 9 300 9 149 Compensation of employees 9 455 (1 427) - 8 028 8 027 1 100.0% 8 254 8 168 Salaries and wages 8 455 (2 166) - 7 289 7 288 1 100.0% 7 473 7 386 Social contributions - 739 - 739 739 - 100.0% 781 782 Goods and services 1 948 (27) - 1 921 1 763 158 91.8% 1 046 981 Administrative fees 26 - - 26 22 4 84.6% 20 20 Catering: Departmental activities 45 413 - 458 458 - 100.0% 100 100 Communication (G&S) 68 - - 68 35 33 51.5% 36 36 Consultants: Business and advisory services - 175 - 175 175 - 100.0%
Contractors - 349 - 349 349 - 100.0% 47 30 Agency and support / outsourced services - - - - - - - 50 Fleet services (including Government motor transport) 3 1 - 4 4 - 100.0% 2 2 Inventory: Clothing material and accessories - - - - - - - 31 31 Consumable supplies 2 - - 2 1 1 50.0% 1 1 Consumable: Stationery, printing and office supplies 61 - - 61 29 32 47.5% 18 18 Transport provided: Departmental activity - 55 - 55 55 - 100.0% Travel and subsistence 480 - - 480 438 42 91.3% 542 545

Economic Development Department I ANNUAL REPORT 2015 / 2016120
PART E – Financial InformationEconomic Development Department Vote 25
Sub programme: 2.2: SOCIAL DIALOGUE, PRODUCTIVITY AND INNOVATION
2015/16 2014/15
Adjusted Appropriation
Shifting of Funds
Virement Final Appropriation
Actual Expenditure
Variance Expenditure as % of final
appropriation
Final Appropriation
Actual Expenditure
Economic classification
R’000 R’000 R’000 R’000 R’000 R’000 % R’000 R’000
Operating payments 166 (95) - 71 25 46 35.2% 134 134 Venues and facilities 1 097 (925) - 172 172 - 100.0% 55 54 Rental and hiring - - - - - - - 10 10
Transfers and subsidies 21 27 - 48 48 - 100.0% 64 64 Households 21 27 - 48 48 - 100.0% 64 64
Social benefits 21 27 - 48 48 - 100.0% - - Other transfers to households - - - - - - - 64 64
Payments for capital assets 63 3 - 66 66 - 100.0% 86 55 Machinery and equipment 63 3 - 66 66 - 100.0% 86 55 Other machinery and equipment 63 3 - 66 66 - 100.0% 86 55
Total 11 487 (1 424) - 10 063 9 904 159 98.4% 9 450 9 268
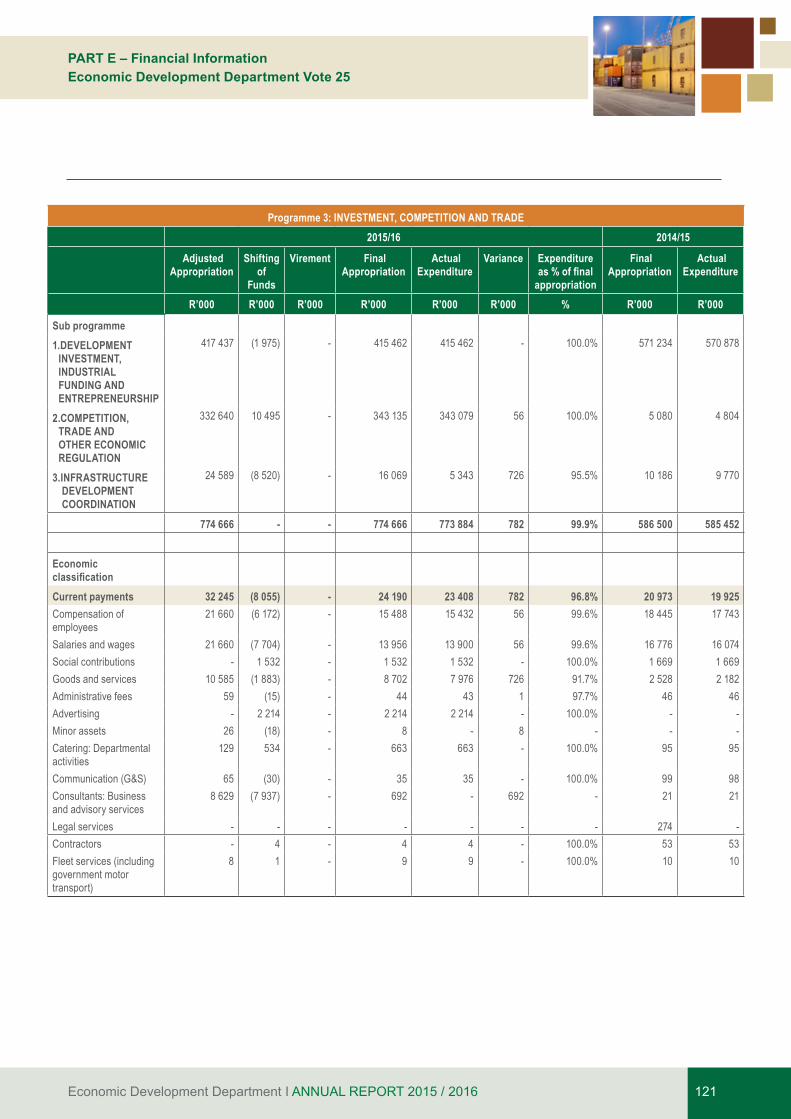
Economic Development Department I ANNUAL REPORT 2015 / 2016 121
PART E – Financial InformationEconomic Development Department Vote 25
Programme 3: INVESTMENT, COMPETITION AND TRADE
2015/16 2014/15
Adjusted Appropriation
Shifting of
Funds
Virement Final Appropriation
Actual Expenditure
Variance Expenditure as % of final
appropriation
Final Appropriation
Actual Expenditure
R’000 R’000 R’000 R’000 R’000 R’000 % R’000 R’000
Sub programme 1.DEVELOPMENT
INVESTMENT, INDUSTRIAL FUNDING AND ENTREPRENEURSHIP
417 437 (1 975) - 415 462 415 462 - 100.0% 571 234 570 878
2.COMPETITION, TRADE AND OTHER ECONOMIC REGULATION
332 640 10 495 - 343 135 343 079 56 100.0% 5 080 4 804
3.INFRASTRUCTURE DEVELOPMENT COORDINATION
24 589 (8 520) - 16 069 5 343 726 95.5% 10 186 9 770
774 666 - - 774 666 773 884 782 99.9% 586 500 585 452
Economic classification Current payments 32 245 (8 055) - 24 190 23 408 782 96.8% 20 973 19 925 Compensation of employees
21 660 (6 172) - 15 488 15 432 56 99.6% 18 445 17 743
Salaries and wages 21 660 (7 704) - 13 956 13 900 56 99.6% 16 776 16 074 Social contributions - 1 532 - 1 532 1 532 - 100.0% 1 669 1 669 Goods and services 10 585 (1 883) - 8 702 7 976 726 91.7% 2 528 2 182 Administrative fees 59 (15) - 44 43 1 97.7% 46 46 Advertising - 2 214 - 2 214 2 214 - 100.0% - - Minor assets 26 (18) - 8 - 8 - - - Catering: Departmental activities
129 534 - 663 663 - 100.0% 95 95
Communication (G&S) 65 (30) - 35 35 - 100.0% 99 98 Consultants: Business and advisory services
8 629 (7 937) - 692 - 692 - 21 21
Legal services - - - - - - - 274 - Contractors - 4 - 4 4 - 100.0% 53 53 Fleet services (including government motor transport)
8 1 - 9 9 - 100.0% 10 10
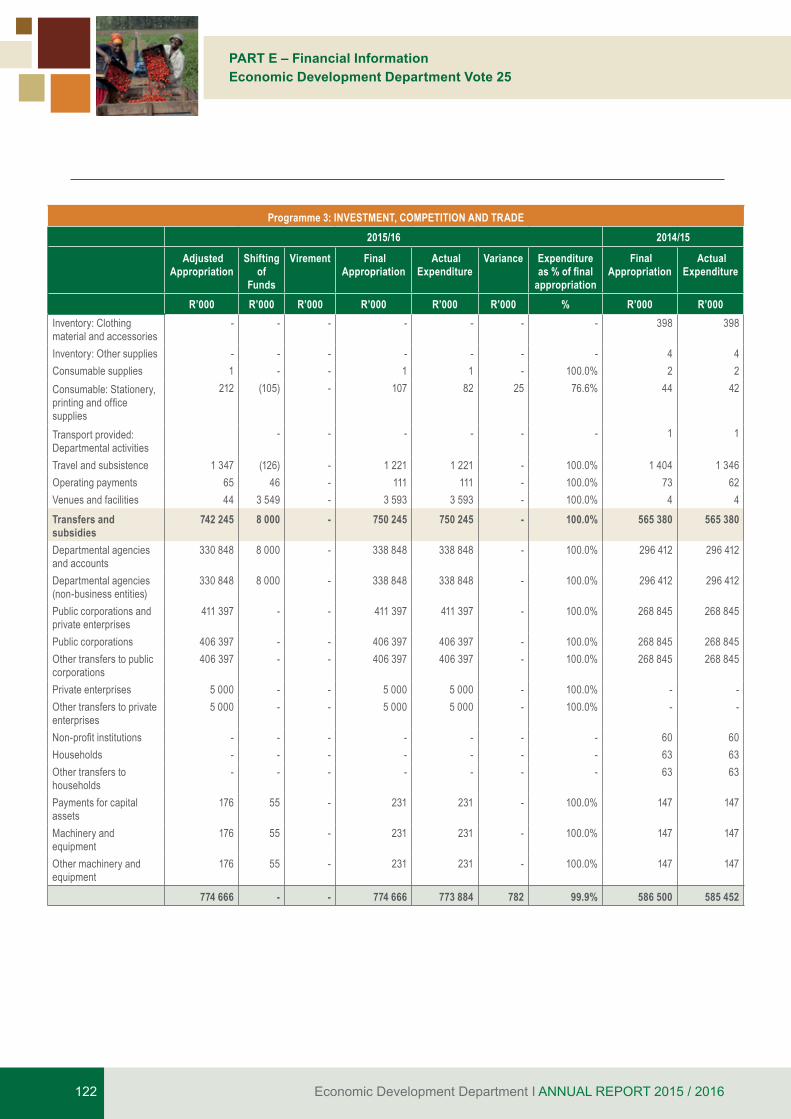
Economic Development Department I ANNUAL REPORT 2015 / 2016122
PART E – Financial InformationEconomic Development Department Vote 25
Programme 3: INVESTMENT, COMPETITION AND TRADE
2015/16 2014/15
Adjusted Appropriation
Shifting of
Funds
Virement Final Appropriation
Actual Expenditure
Variance Expenditure as % of final
appropriation
Final Appropriation
Actual Expenditure
R’000 R’000 R’000 R’000 R’000 R’000 % R’000 R’000Inventory: Clothing material and accessories
- - - - - - - 398 398
Inventory: Other supplies - - - - - - - 4 4Consumable supplies 1 - - 1 1 - 100.0% 2 2 Consumable: Stationery, printing and office supplies
212 (105) - 107 82 25 76.6% 44 42
Transport provided: Departmental activities
- - - - - - 1 1
Travel and subsistence 1 347 (126) - 1 221 1 221 - 100.0% 1 404 1 346 Operating payments 65 46 - 111 111 - 100.0% 73 62 Venues and facilities 44 3 549 - 3 593 3 593 - 100.0% 4 4 Transfers and subsidies
742 245 8 000 - 750 245 750 245 - 100.0% 565 380 565 380
Departmental agencies and accounts
330 848 8 000 - 338 848 338 848 - 100.0% 296 412 296 412
Departmental agencies (non-business entities)
330 848 8 000 - 338 848 338 848 - 100.0% 296 412 296 412
Public corporations and private enterprises
411 397 - - 411 397 411 397 - 100.0% 268 845 268 845
Public corporations 406 397 - - 406 397 406 397 - 100.0% 268 845 268 845 Other transfers to public corporations
406 397 - - 406 397 406 397 - 100.0% 268 845 268 845
Private enterprises 5 000 - - 5 000 5 000 - 100.0% - - Other transfers to private enterprises
5 000 - - 5 000 5 000 - 100.0% - -
Non-profit institutions - - - - - - - 60 60 Households - - - - - - - 63 63 Other transfers to households
- - - - - - - 63 63
Payments for capital assets
176 55 - 231 231 - 100.0% 147 147
Machinery and equipment
176 55 - 231 231 - 100.0% 147 147
Other machinery and equipment
176 55 - 231 231 - 100.0% 147 147
774 666 - - 774 666 773 884 782 99.9% 586 500 585 452
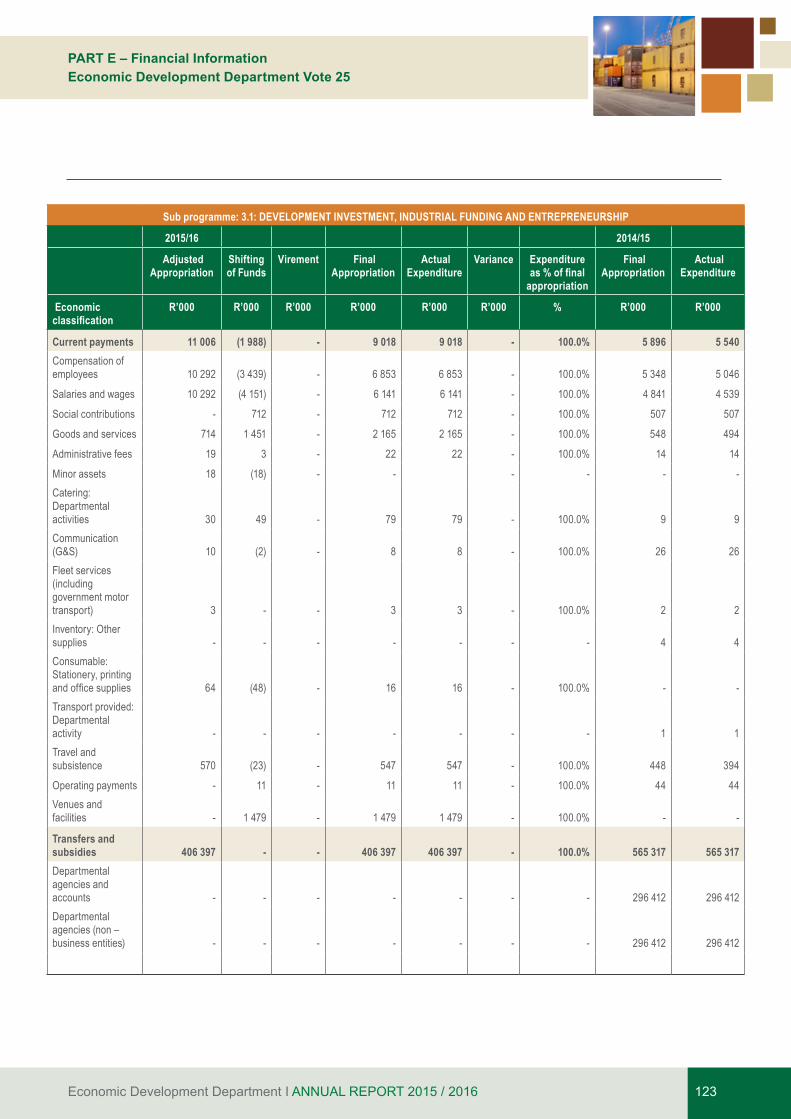
Economic Development Department I ANNUAL REPORT 2015 / 2016 123
PART E – Financial InformationEconomic Development Department Vote 25
Sub programme: 3.1: DEVELOPMENT INVESTMENT, INDUSTRIAL FUNDING AND ENTREPRENEURSHIP
2015/16 2014/15
Adjusted Appropriation
Shifting of Funds
Virement Final Appropriation
Actual Expenditure
Variance Expenditure as % of final
appropriation
Final Appropriation
Actual Expenditure
Economic classification
R’000 R’000 R’000 R’000 R’000 R’000 % R’000 R’000
Current payments 11 006 (1 988) - 9 018 9 018 - 100.0% 5 896 5 540 Compensation of employees 10 292 (3 439) - 6 853 6 853 - 100.0% 5 348 5 046
Salaries and wages 10 292 (4 151) - 6 141 6 141 - 100.0% 4 841 4 539
Social contributions - 712 - 712 712 - 100.0% 507 507
Goods and services 714 1 451 - 2 165 2 165 - 100.0% 548 494
Administrative fees 19 3 - 22 22 - 100.0% 14 14
Minor assets 18 (18) - - - - - - Catering: Departmental activities 30 49 - 79 79 - 100.0% 9 9 Communication (G&S) 10 (2) - 8 8 - 100.0% 26 26 Fleet services (including government motor transport) 3 - - 3 3 - 100.0% 2 2 Inventory: Other supplies - - - - - - - 4 4Consumable: Stationery, printing and office supplies 64 (48) - 16 16 - 100.0% - - Transport provided: Departmental activity - - - - - - - 1 1 Travel and subsistence 570 (23) - 547 547 - 100.0% 448 394
Operating payments - 11 - 11 11 - 100.0% 44 44 Venues and facilities - 1 479 - 1 479 1 479 - 100.0% - -
Transfers and subsidies 406 397 - - 406 397 406 397 - 100.0% 565 317 565 317 Departmental agencies and accounts - - - - - - - 296 412 296 412 Departmental agencies (non –business entities) - - - - - - - 296 412 296 412

Economic Development Department I ANNUAL REPORT 2015 / 2016124
PART E – Financial InformationEconomic Development Department Vote 25
Sub programme: 3.1: DEVELOPMENT INVESTMENT, INDUSTRIAL FUNDING AND ENTREPRENEURSHIP
2015/16 2014/15
Adjusted Appropriation
Shifting of Funds
Virement Final Appropriation
Actual Expenditure
Variance Expenditure as % of final
appropriation
Final Appropriation
Actual Expenditure
Economic classification
R’000 R’000 R’000 R’000 R’000 R’000 % R’000 R’000
Public corporations and private enterprises 406 397 - - 406 397 406 397 - 100.0% 268 845 268 845
Public corporations 406 397 - - 406 397 406 397 - 100.0% 268 845 268 845 Other transfers to public
corporations 406 397 - - 406 397 406 397 - 100.0% 268 845 268 845 Non-profit institutions - - - - - - - 60 60
Payments for capital assets 34 13 - 47 47 - 100.0% 21 21 Machinery and equipment 34 13 - 47 47 - 100.0% 21 21 Other machinery and equipment 34
13 - 47 47 - 100.0% 21 21
Total 417 437 (1 975) - 415 462 415 462 - 100.0% 571 234 570 878
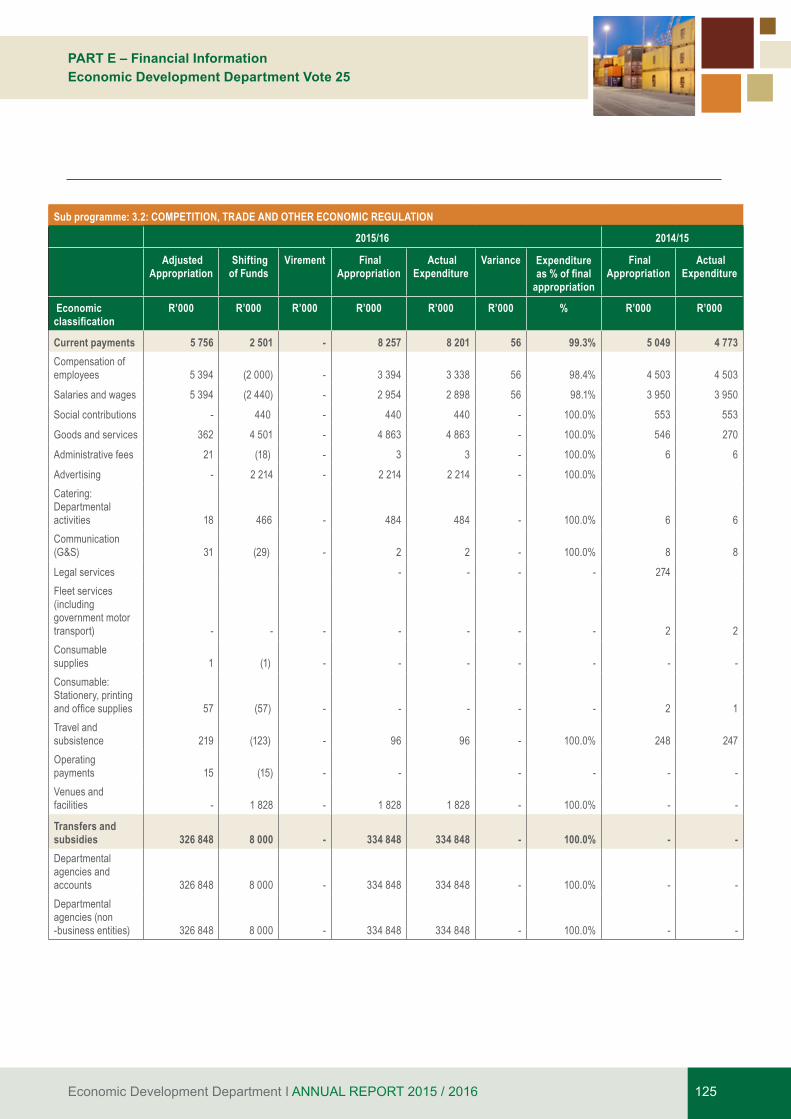
Economic Development Department I ANNUAL REPORT 2015 / 2016 125
PART E – Financial InformationEconomic Development Department Vote 25
Sub programme: 3.2: COMPETITION, TRADE AND OTHER ECONOMIC REGULATION
2015/16 2014/15
Adjusted Appropriation
Shifting of Funds
Virement Final Appropriation
Actual Expenditure
Variance Expenditure as % of final
appropriation
Final Appropriation
Actual Expenditure
Economic classification
R’000 R’000 R’000 R’000 R’000 R’000 % R’000 R’000
Current payments 5 756 2 501 - 8 257 8 201 56 99.3% 5 049 4 773 Compensation of employees 5 394 (2 000) - 3 394 3 338 56 98.4% 4 503 4 503
Salaries and wages 5 394 (2 440) - 2 954 2 898 56 98.1% 3 950 3 950
Social contributions - 440 - 440 440 - 100.0% 553 553
Goods and services 362 4 501 - 4 863 4 863 - 100.0% 546 270
Administrative fees 21 (18) - 3 3 - 100.0% 6 6
Advertising - 2 214 - 2 214 2 214 - 100.0% Catering: Departmental activities 18 466 - 484 484 - 100.0% 6 6 Communication (G&S) 31 (29) - 2 2 - 100.0% 8 8
Legal services - - - - 274 Fleet services (including government motor transport) - - - - - - - 2 2Consumable supplies 1 (1) - - - - - - - Consumable: Stationery, printing and office supplies 57 (57) - - - - - 2 1 Travel and subsistence 219 (123) - 96 96 - 100.0% 248 247 Operating payments 15 (15) - - - - - - Venues and facilities - 1 828 - 1 828 1 828 - 100.0% - -
Transfers and subsidies 326 848 8 000 - 334 848 334 848 - 100.0% - - Departmental agencies and accounts 326 848 8 000 - 334 848 334 848 - 100.0% - - Departmental agencies (non -business entities) 326 848 8 000 - 334 848 334 848 - 100.0% - -
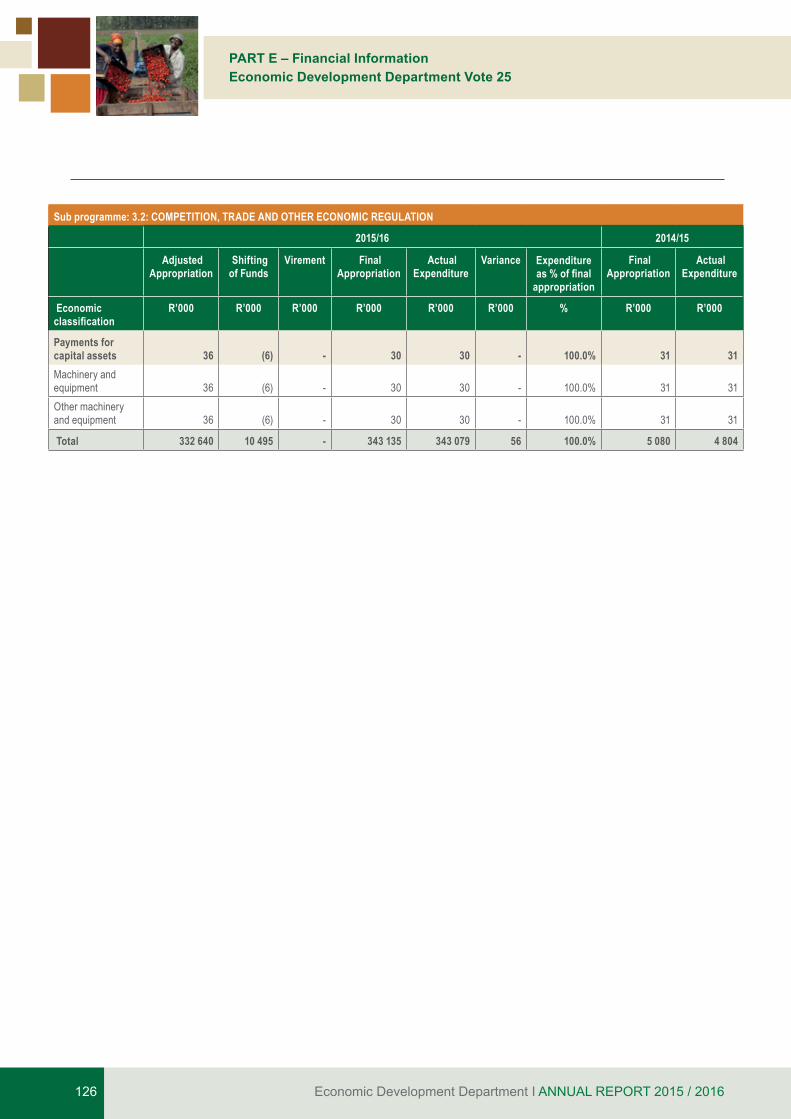
Economic Development Department I ANNUAL REPORT 2015 / 2016126
PART E – Financial InformationEconomic Development Department Vote 25
Sub programme: 3.2: COMPETITION, TRADE AND OTHER ECONOMIC REGULATION
2015/16 2014/15
Adjusted Appropriation
Shifting of Funds
Virement Final Appropriation
Actual Expenditure
Variance Expenditure as % of final
appropriation
Final Appropriation
Actual Expenditure
Economic classification
R’000 R’000 R’000 R’000 R’000 R’000 % R’000 R’000
Payments for capital assets 36 (6) - 30 30 - 100.0% 31 31 Machinery and equipment 36 (6) - 30 30 - 100.0% 31 31 Other machinery and equipment 36 (6) - 30 30 - 100.0% 31 31
Total 332 640 10 495 - 343 135 343 079 56 100.0% 5 080 4 804

Economic Development Department I ANNUAL REPORT 2015 / 2016 127
PART E – Financial InformationEconomic Development Department Vote 25
Sub programme: 3.3: INFRASTRUCTURE DEVELOPMENT COORDINATION
2015/16 2014/15
Adjusted Appropriation
Shifting of Funds
Virement Final Appropriation
Actual Expenditure
Variance Expenditure as % of final
appropriation
Final Appropriation
Actual Expenditure
Economic classification
R’000 R’000 R’000 R’000 R’000 R’000 % R’000 R’000
Current payments 15 483 (8 568) - 6 915 6 189 726 89.5% 10 028 9 612 Compensation of employees 5 974 (733) - 5 241 5 241 - 100.0% 8 594 8 194 Salaries and wages 5 974 (1 113) - 4 861 4 861 - 100.0% 7 985 7 585 Social contributions -
380 - 380 380 - 100.0% 609 609
Goods and services 9 509 (7 835) - 1 674 948 726 56.6% 1 434 1 418 Administrative fees 19 - - 19 18 1 94.7% 26 26
Minor assets 8 - - 8 8 - - - Catering: Departmental activities 81
19 - 100 100 - 100.0% 80 80
Communication (G&S) 24
1 - 25 25 - 100.0% 65 64
Consultants: Business and advisory services 8 629 (7 937) - 692 692 - 21 21
Contractors - 4 - 4 4 - 100.0% 53 53 Fleet services (including government motor transport) 5
1 - 6 6 - 100.0% 6 6
Inventory: Clothing material and accessories - - - - - - 398 398 Consumable supplies -
1 - 1 1 - 100.0% 2 2
Consumable: Stationery, printing and office supplies 91 - - 91 66 25 72.5% 42 41 Travel and subsistence 558
20 - 578 578 - 100.0% 708 705
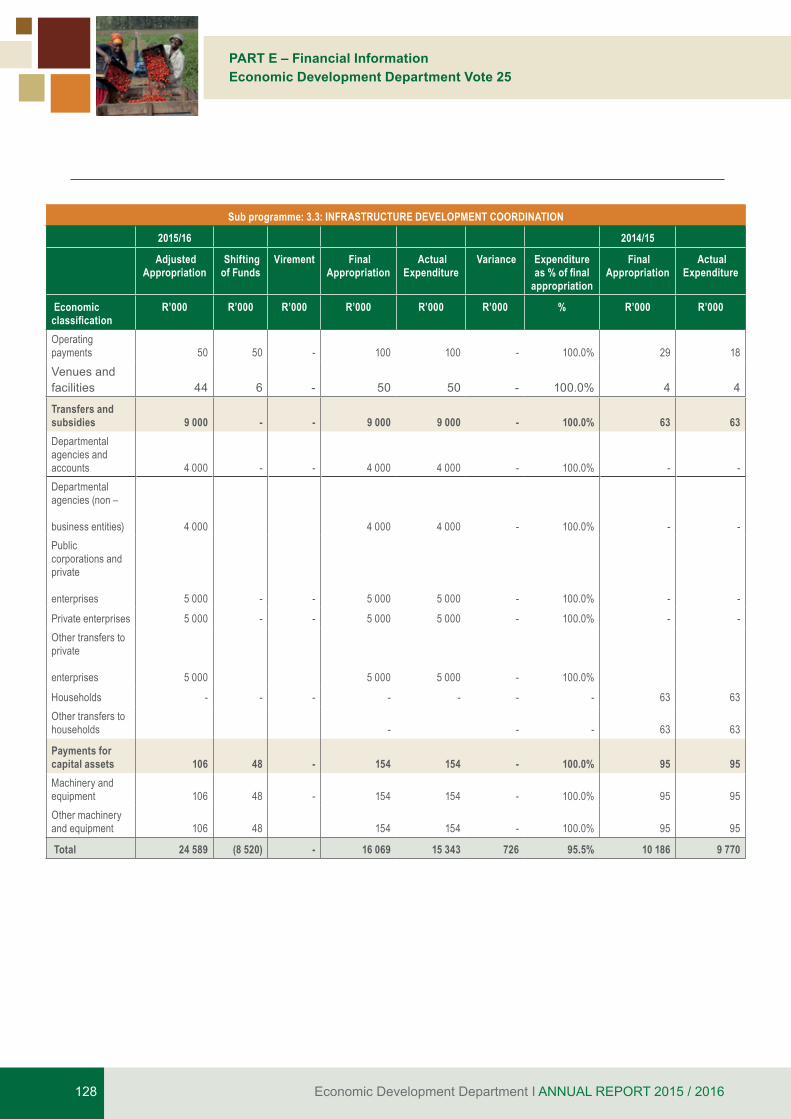
Economic Development Department I ANNUAL REPORT 2015 / 2016128
PART E – Financial InformationEconomic Development Department Vote 25
Sub programme: 3.3: INFRASTRUCTURE DEVELOPMENT COORDINATION
2015/16 2014/15
Adjusted Appropriation
Shifting of Funds
Virement Final Appropriation
Actual Expenditure
Variance Expenditure as % of final
appropriation
Final Appropriation
Actual Expenditure
Economic classification
R’000 R’000 R’000 R’000 R’000 R’000 % R’000 R’000
Operating payments 50
50 - 100 100 - 100.0% 29 18
Venues and facilities
44
6 - 50
50 - 100.0%
4
4
Transfers and subsidies 9 000 - - 9 000 9 000 - 100.0% 63 63 Departmental agencies and accounts 4 000 - - 4 000 4 000 - 100.0% - - Departmental agencies (non –
business entities) 4 000 4 000 4 000 - 100.0% - -Public corporations and private
enterprises 5 000 - - 5 000 5 000 - 100.0% - -
Private enterprises 5 000 - - 5 000 5 000 - 100.0% - - Other transfers to private
enterprises 5 000 5 000 5 000 - 100.0%
Households - - - - - - - 63 63 Other transfers to households - - - 63 63
Payments for capital assets 106 48 - 154 154 - 100.0% 95 95 Machinery and equipment 106 48 - 154 154 - 100.0% 95 95 Other machinery and equipment 106
48 154 154 - 100.0% 95 95
Total 24 589 (8 520) - 16 069 15 343 726 95.5% 10 186 9 770
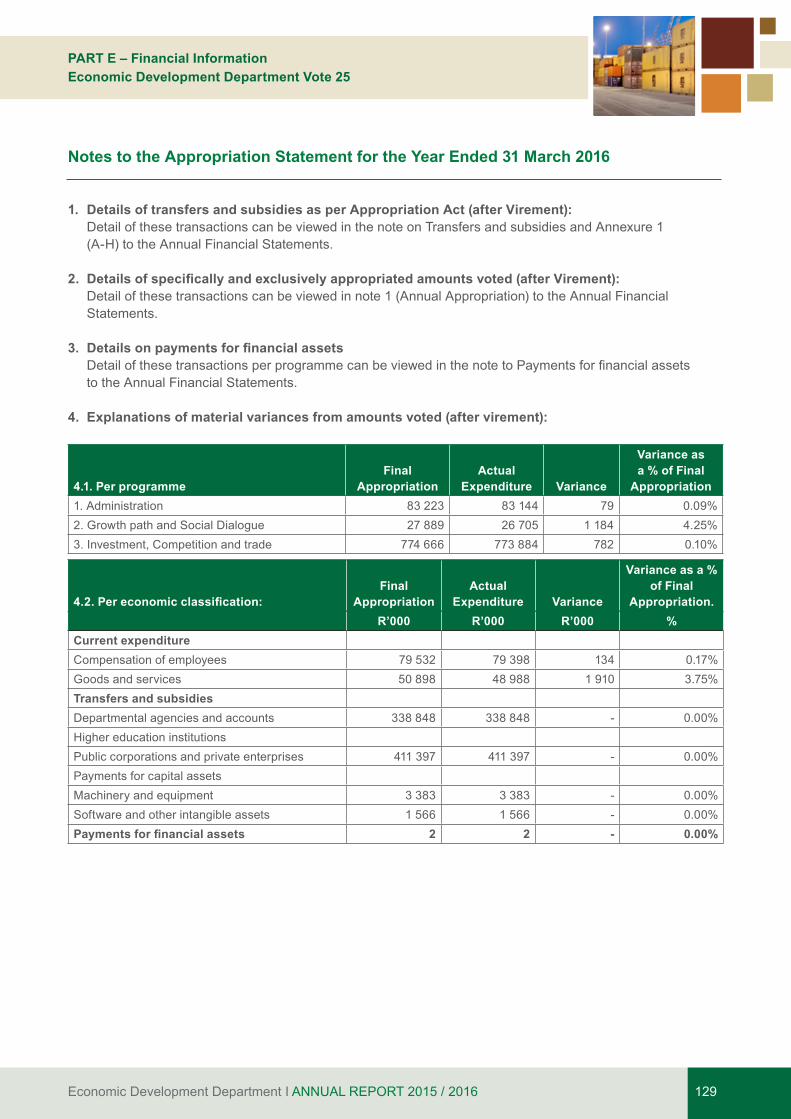
Economic Development Department I ANNUAL REPORT 2015 / 2016 129
PART E – Financial InformationEconomic Development Department Vote 25
1. Details of transfers and subsidies as per Appropriation Act (after Virement): Detail of these transactions can be viewed in the note on Transfers and subsidies and Annexure 1 (A-H) to the Annual Financial Statements.
2. Details of specifically and exclusively appropriated amounts voted (after Virement): Detail of these transactions can be viewed in note 1 (Annual Appropriation) to the Annual Financial Statements.
3. Details on payments for financial assets DetailofthesetransactionsperprogrammecanbeviewedinthenotetoPaymentsforfinancialassets to the Annual Financial Statements.
4. Explanations of material variances from amounts voted (after virement):
4.1. Per programmeFinal
AppropriationActual
Expenditure Variance
Variance as a % of Final
Appropriation1. Administration 83 223 83 144 79 0.09%2. Growth path and Social Dialogue 27 889 26 705 1 184 4.25%3. Investment, Competition and trade 774 666 773 884 782 0.10%
4.2. Per economic classification:Final
AppropriationActual
Expenditure Variance
Variance as a % of Final
Appropriation.R’000 R’000 R’000 %
Current expenditureCompensation of employees 79 532 79 398 134 0.17%Goods and services 50 898 48 988 1 910 3.75%Transfers and subsidiesDepartmental agencies and accounts 338 848 338 848 - 0.00%Higher education institutions Public corporations and private enterprises 411 397 411 397 - 0.00%Payments for capital assetsMachinery and equipment 3 383 3 383 - 0.00%Software and other intangible assets 1 566 1 566 - 0.00%Payments for financial assets 2 2 - 0.00%
Notes to the Appropriation Statement for the Year Ended 31 March 2016
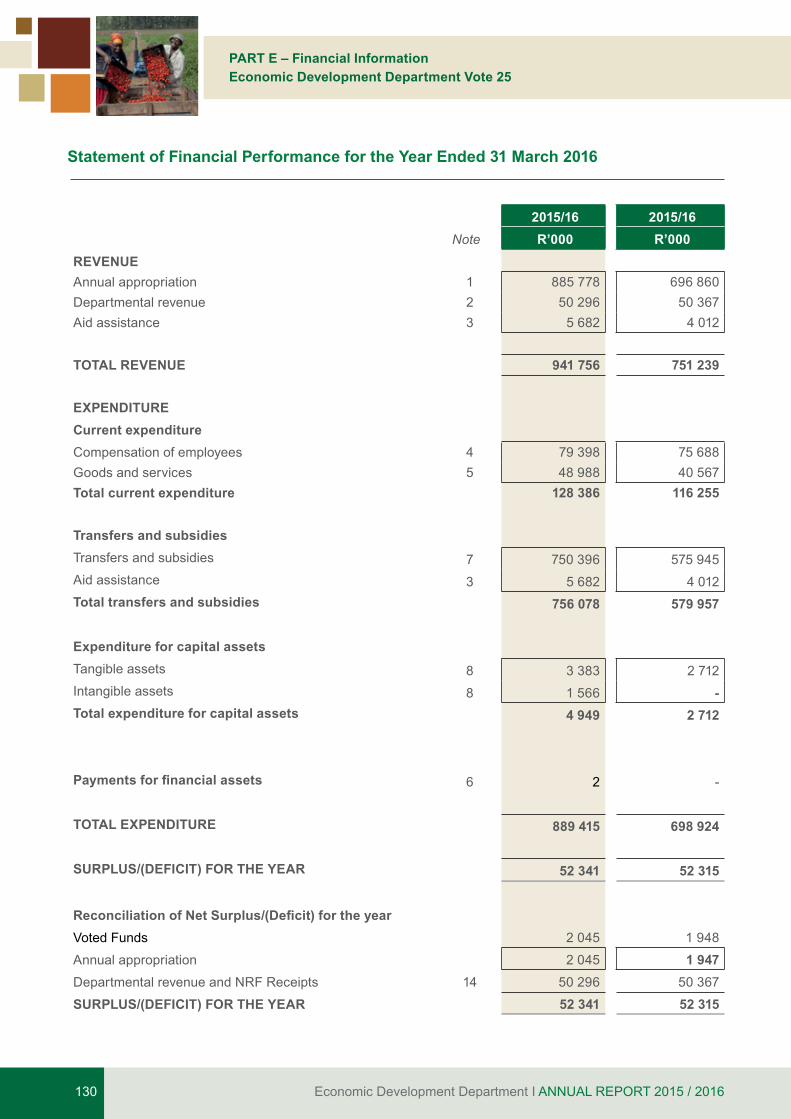
Economic Development Department I ANNUAL REPORT 2015 / 2016130
PART E – Financial InformationEconomic Development Department Vote 25
2015/16 2015/16 Note R’000 R’000
REVENUEAnnual appropriation 1 885 778 696 860 Departmental revenue 2 50 296 50 367 Aid assistance 3 5 682 4 012
TOTAL REVENUE 941 756 751 239
EXPENDITURECurrent expenditureCompensation of employees 4 79 398 75 688 Goods and services 5 48 988 40 567 Total current expenditure 128 386 116 255
Transfers and subsidiesTransfers and subsidies 7 750 396 575 945 Aid assistance 3 5 682 4 012 Total transfers and subsidies 756 078 579 957
Expenditure for capital assetsTangible assets 8 3 383 2 712 Intangible assets 8 1 566 - Total expenditure for capital assets 4 949 2 712
Payments for financial assets 6 2 -
TOTAL EXPENDITURE 889 415 698 924
SURPLUS/(DEFICIT) FOR THE YEAR 52 341 52 315
Reconciliation of Net Surplus/(Deficit) for the yearVoted Funds 2 045 1 948
Annual appropriation 2 045 1 947 Departmental revenue and NRF Receipts 14 50 296 50 367
SURPLUS/(DEFICIT) FOR THE YEAR 52 341 52 315
Statement of Financial Performance for the Year Ended 31 March 2016
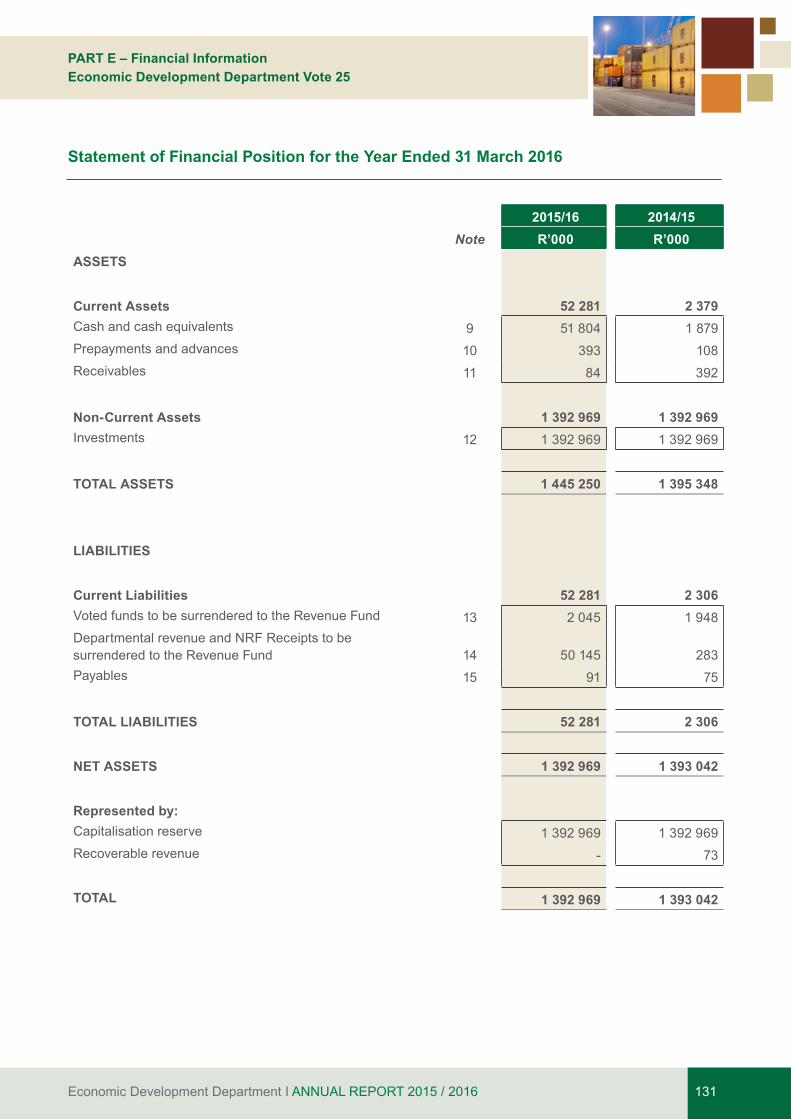
Economic Development Department I ANNUAL REPORT 2015 / 2016 131
PART E – Financial InformationEconomic Development Department Vote 25
2015/16 2014/15 Note R’000 R’000
ASSETS
Current Assets 52 281 2 379 Cash and cash equivalents 9 51 804 1 879 Prepayments and advances 10 393 108 Receivables 11 84 392
Non-Current Assets 1 392 969 1 392 969 Investments 12 1 392 969 1 392 969
TOTAL ASSETS 1 445 250 1 395 348
LIABILITIES
Current Liabilities 52 281 2 306 Voted funds to be surrendered to the Revenue Fund 13 2 045 1 948 Departmental revenue and NRF Receipts to besurrendered to the Revenue Fund 14 50 145 283 Payables 15 91 75
TOTAL LIABILITIES 52 281 2 306
NET ASSETS 1 392 969 1 393 042
Represented by:Capitalisation reserve 1 392 969 1 392 969 Recoverable revenue - 73
TOTAL 1 392 969 1 393 042
Statement of Financial Position for the Year Ended 31 March 2016
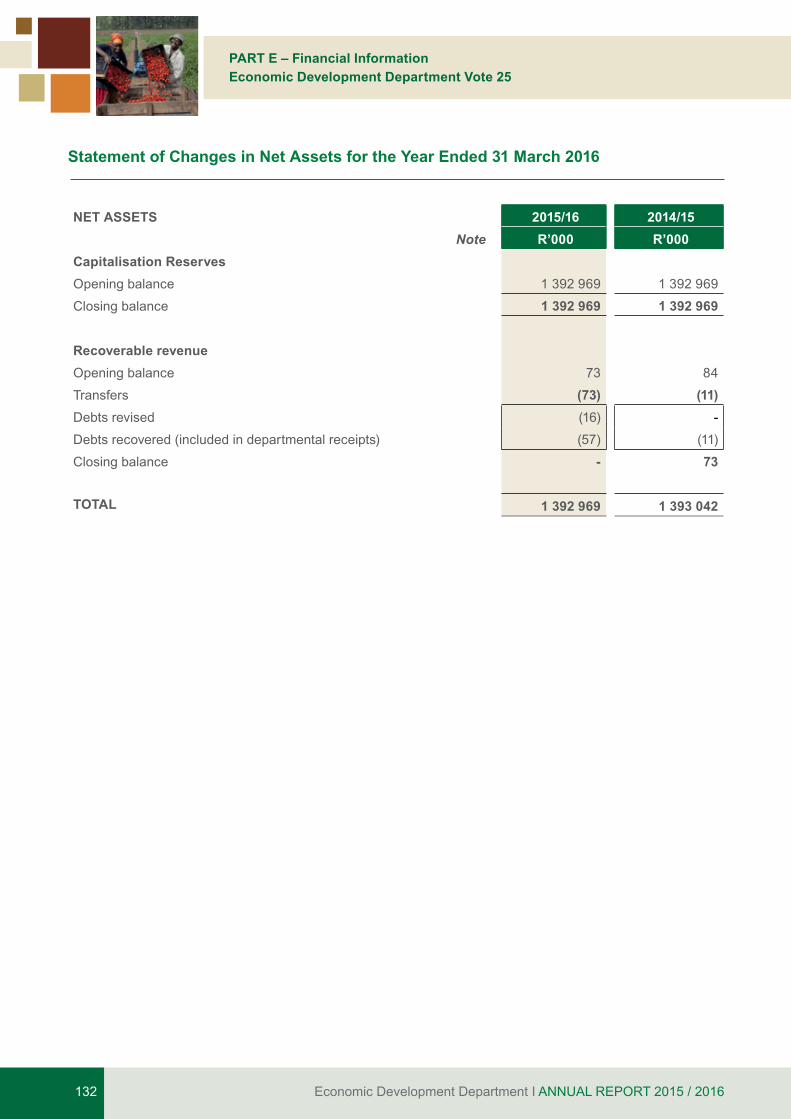
Economic Development Department I ANNUAL REPORT 2015 / 2016132
PART E – Financial InformationEconomic Development Department Vote 25
NET ASSETS 2015/16 2014/15 Note R’000 R’000
Capitalisation ReservesOpening balance 1 392 969 1 392 969
Closing balance 1 392 969 1 392 969
Recoverable revenueOpening balance 73 84
Transfers (73) (11)Debts revised (16) -
Debts recovered (included in departmental receipts) (57) (11)
Closing balance - 73
TOTAL 1 392 969 1 393 042
Statement of Changes in Net Assets for the Year Ended 31 March 2016
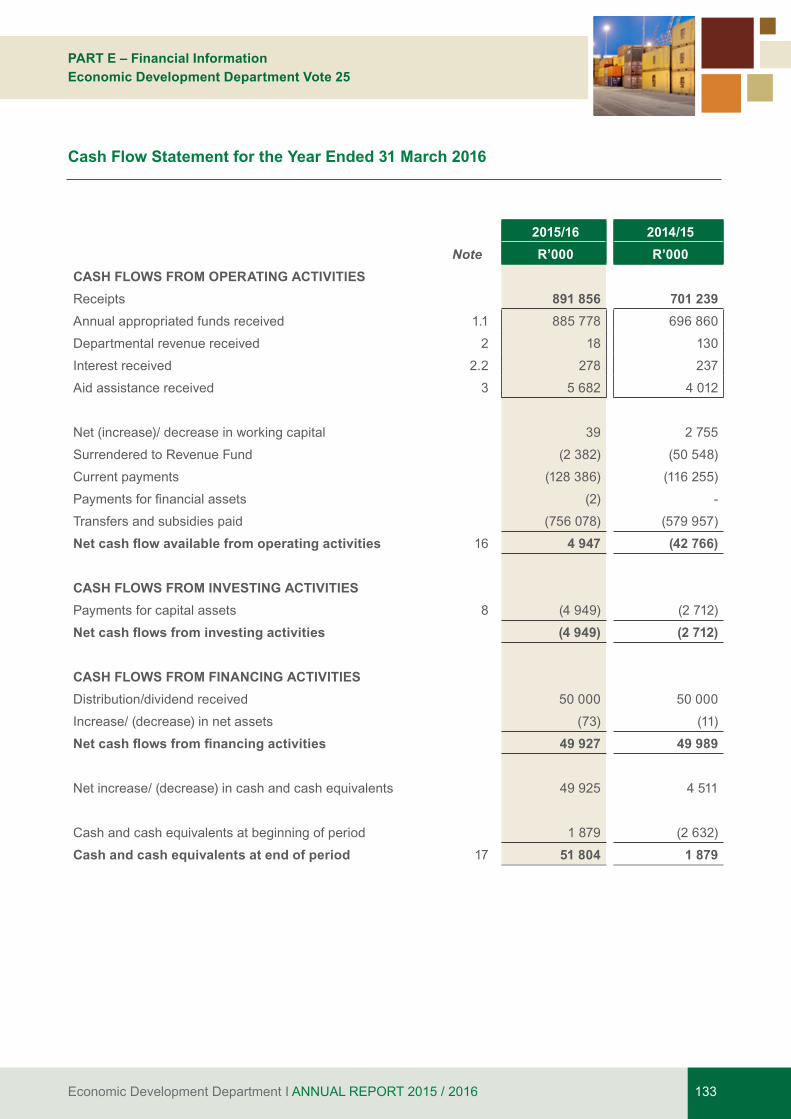
Economic Development Department I ANNUAL REPORT 2015 / 2016 133
PART E – Financial InformationEconomic Development Department Vote 25
2015/16 2014/15 Note R’000 R’000
CASH FLOWS FROM OPERATING ACTIVITIESReceipts 891 856 701 239 Annual appropriated funds received 1.1 885 778 696 860
Departmental revenue received 2 18 130
Interest received 2.2 278 237
Aid assistance received 3 5 682 4 012
Net (increase)/ decrease in working capital 39 2 755
Surrendered to Revenue Fund (2 382) (50 548)
Current payments (128 386) (116 255)
Paymentsforfinancialassets (2) -
Transfers and subsidies paid (756 078) (579 957)
Net cash flow available from operating activities 16 4 947 (42 766)
CASH FLOWS FROM INVESTING ACTIVITIESPayments for capital assets 8 (4 949) (2 712)
Net cash flows from investing activities (4 949) (2 712)
CASH FLOWS FROM FINANCING ACTIVITIESDistribution/dividend received 50 000 50 000
Increase/ (decrease) in net assets (73) (11)
Net cash flows from financing activities 49 927 49 989
Net increase/ (decrease) in cash and cash equivalents 49 925 4 511
Cash and cash equivalents at beginning of period 1 879 (2 632)
Cash and cash equivalents at end of period 17 51 804 1 879
Cash Flow Statement for the Year Ended 31 March 2016
Economic Development Department I ANNUAL REPORT 2015 / 2016134
PART E – Financial InformationEconomic Development Department Vote 25
Summary of significant accounting policies
The financial statements have been prepared inaccordance with the following policies, which have been applied consistently in all material aspects, unless otherwise indicated. Management has concluded that thefinancialstatementspresentfairlythedepartment’sprimary and secondary information.
The historical cost convention has been used, except where otherwise indicated. Management has used assessments and estimates in preparing the annual financial statements. These are based on the bestinformation available at the time of preparation.
Where appropriate and meaningful, additional information has been disclosed to enhance the usefulnessof thefinancialstatementsand tocomplywith the statutory requirements of the Public Finance Management Act (PFMA), Act 1 of 1999 (as amended by Act 29 of 1999), and the Treasury Regulations issued in terms of the PFMA and the annual Division of Revenue Act.
1 Basis of preparation The financial statements have been prepared inaccordancewiththeModifiedCashStandard.
2 Going concern The financial statements have been prepared on agoing concern basis.
3 Presentation currencyAmounts have been presented in the currency of the South African Rand (R) which is also the functional currency of the department.
4 Rounding Unless otherwise stated financial figures have beenrounded to the nearest one thousand Rand (R’000).
5 Foreign currency translationCashflowsarisingfromforeigncurrencytransactionsare translated into South African Rands using the spot exchange rates prevailing at the date of payment / receipt.
6 Comparative information6.1 Prior period comparative information Prior period comparative information has been presented in the current year’s financial statements. Wherenecessaryfigures included in thepriorperiodfinancialstatements have been reclassified to ensure that theformat in which the information is presented is consistent withtheformatofthecurrentyear’sfinancialstatements.
6.2 Current year comparison with budget Acomparisonbetweentheapproved,finalbudgetandactual amounts for each programme and economic classificationisincludedintheappropriationstatement.
7 Revenue7.1 Appropriated fundsAppropriated funds comprises of departmental allocations as well as direct charges against the revenue fund (i.e. statutory appropriation).
Appropriated funds are recognised in the statement offinancialperformanceonthedatetheappropriationbecomes effective. Adjustments made in terms of the adjustments budget process are recognised in the statement of financial performance on the date theadjustments become effective.
The net amount of any appropriated funds due to / from the relevant revenue fund at the reporting date is recognised as a payable / receivable in the statement offinancialposition. 7.2 Departmental revenue Departmental revenue is recognised in the statement of financial performance when received and issubsequently paid into the relevant revenue fund, unless stated otherwise.
Any amount owing to the relevant revenue fund at the reporting date is recognised as a payable in the statementoffinancialposition.
7.3 Accrued departmental revenue Accruals in respect of departmental revenue (excluding taxrevenue)arerecordedinthenotestothefinancialstatements when:• itisprobablethattheeconomicbenefitsorservice
potentialassociatedwiththetransactionwillflowtothedepartment;and
Accounting Policies for the Year Ended 31 March 2016

Economic Development Department I ANNUAL REPORT 2015 / 2016 135
PART E – Financial InformationEconomic Development Department Vote 25
• theamountofrevenuecanbemeasuredreliably.The accrued revenue is measured at the fair value of the consideration receivable.
Accrued tax revenue (and related interest and / penalties) is measured at amounts receivable from collecting agents.
8 Expenditure8.1 Compensation of employees8.1.1 Salaries and wagesSalaries and wages are recognised in the statement of financialperformanceonthedateofpayment.
8.1.2 Social contributionsSocial contributions made by the department in respect of current employees are recognised in the statement offinancialperformanceonthedateofpayment.
Social contributions made by the department in respectofex-employeesareclassifiedastransferstohouseholdsinthestatementoffinancialperformanceon the date of payment.
8.2 Other expenditureOther expenditure (such as goods and services, transfers and subsidies and payments for capital assets) is recognised in the statement of financialperformance on the date of payment. The expense is classifiedasacapitalexpenseifthetotalconsiderationpaid is more than the capitalisation threshold.
8.3 Accrued expenditure payableAccrued expenditure payable is recorded in the notestothefinancialstatementswhenthegoodsarereceived or, in the case of services, when they are rendered to the department or in the case of transfers and subsidies when they are due and payable.
Accrued expenditure payable is measured at cost.
8.4 Leases8.4.1 Operating leasesOperating lease payments made during the reporting period are recognised as current expenditure in the statement of financial performance on the date ofpayment.
The operating lease commitments are recorded in the notestothefinancialstatements.
8.4.2 Finance leases Finance lease payments made during the reporting period are recognised as capital expenditure in the statement of financial performance on the date ofpayment.
The finance lease commitments are recorded inthe notes to the financial statements and are notapportioned between the capital and interest portions. Finance lease assets acquired at the end of the lease term are recorded and measured at the lower of:• cost,beingthefairvalueoftheasset;or• the sum of the minimum lease payments made,
including any payments made to acquire ownership at the end of the lease term, excluding interest.
9 Aid Assistance9.1 Aid assistance receivedAid assistance received in cash is recognised in the statement of financial performance when received.In-kind aid assistance is recorded in the notes to thefinancialstatementsonthedateofreceiptand ismeasured at fair value.
Aid assistance not spent for the intended purpose and any unutilised funds from aid assistance that are required to be refunded to the donor are recognised asapayableinthestatementoffinancialposition.
9.2 Aid assistance paidAid assistance paid is recognised in the statement offinancialperformanceonthedateofpayment.Aidassistance payments made prior to the receipt of funds are recognised as a receivable in the statement of financialposition.
10 Cash and cash equivalentsCash and cash equivalents are stated at cost in the statementoffinancialposition.
Bank overdrafts are shown separately on the face of thestatementoffinancialpositionasacurrentliability.Forthepurposesofthecashflowstatement,cashandcash equivalents comprise cash on hand, deposits held, other short-term highly liquid investments and bank overdrafts.
Economic Development Department I ANNUAL REPORT 2015 / 2016136
PART E – Financial InformationEconomic Development Department Vote 25
11 Prepayments and advancesPrepayments and advances are recognised in the statement of financial position when the departmentreceives or disburses the cash.
Prepayments and advances are initially and subsequently measured at cost.
Prepayments are expensed when the relevant supporting documents are received.
12 Loans and receivablesLoans and receivables are recognised in the statement of financial position at cost plus accrued interest,where interest is charged, less amounts already settled or written-off. Write-offs are made according to the department’s write-off policy.
13 InvestmentsInvestments are recognised in the statement of financialpositionatcost.
14. Impairment of financial assetsWhere there is an indication of impairment of a financial asset, an estimation of the reduction in therecordedcarryingvalue,toreflectthebestestimateoftheamountof thefutureeconomicbenefitsexpectedto be received from that asset, is recorded in the notes tothefinancialstatements.
15 PayablesLoans and payables are recognised in the statement of financialpositionatcost.
16 Capital Assets16.1 Immovable capital assets
Immovable capital assets are initially recorded in the notestothefinancialstatementsatcost. Immovablecapital assets acquired through a non-exchange transaction is measured at fair value as at the date of acquisition.
Where the cost of immovable capital assets cannot be determined reliably, the immovable capital assets are measured at R1 unless the fair value of the asset has been reliably estimated, in which case the fair value is used.
All assets acquired prior to 1 April 2002 (or a later date as approved by the OAG) may be recorded at R1.
Immovable capital assets are subsequently carried at cost and are not subject to depreciation or impairment.Subsequent expenditure that is of a capital nature is added to the cost of the asset at the end of the capital project unless the immovable asset is recorded by another department in which case the completed project costs are transferred to that department.
16.2 Movable capital assetsMovable capital assets are initially recorded in the notes to the financial statements at cost. Movable capitalassets acquired through a non-exchange transaction is measured at fair value as at the date of acquisition. Where the cost of movable capital assets cannot be determined reliably, the movable capital assets are measured at fair value and where fair value cannot be determined;themovableassetsaremeasuredatR1.All assets acquired prior to 1 April 2002 (or a later date as approved by the OAG) may be recorded at R1.
Movable capital assets are subsequently carried at cost and are not subject to depreciation or impairment.Subsequent expenditure that is of a capital nature is added to the cost of the asset at the end of the capital project unless the movable asset is recorded by another department/entity in which case the completed project costs are transferred to that department.
16.3 Intangible assetsIntangible assets are initially recorded in the notes to thefinancialstatementsatcost. Intangibleassetsacquired through a non-exchange transaction are measured at fair value as at the date of acquisition. Internally generated intangible assets are recorded in the notes to the financial statements when thedepartment commences the development phase of the project.
Where the cost of intangible assets cannot be determined reliably, the intangible capital assets are measured at fair value and where fair value cannot be determined;theintangibleassetsaremeasuredatR1.All assets acquired prior to 1 April 2002 (or a later date as approved by the OAG) may be recorded at R1.
Economic Development Department I ANNUAL REPORT 2015 / 2016 137
PART E – Financial InformationEconomic Development Department Vote 25
Intangible assets are subsequently carried at cost and are not subject to depreciation or impairment.
Subsequent expenditure that is of a capital nature is added to the cost of the asset at the end of the capital project unless the intangible asset is recorded by another department/entity in which case the completed project costs are transferred to that department.
17 Provisions and Contingents17.1 ProvisionsProvisions are recorded in the notes to the financialstatements when there is a present legal or constructive obligation to forfeit economic benefits as a result ofevents in the past and it is probable that an outflowofresourcesembodyingeconomicbenefitsorservicepotential will be required to settle the obligation and a reliable estimate of the obligation can be made. The provision is measured as the best estimate of the funds required to settle the present obligation at the reporting date.
17.2 Contingent liabilitiesContingent liabilities are recorded in the notes to the financial statements when there is a possibleobligation that arises from past events, and whose existencewillbeconfirmedonlybytheoccurrenceornon-occurrence of one or more uncertain future events not within the control of the department or when there is a present obligation that is not recognised because it isnotprobable thatanoutflowofresourceswillberequired to settle the obligation or the amount of the obligation cannot be measured reliably.
17.3 Contingent assetsContingent assets are recorded in the notes to the financialstatementswhenapossibleassetarisesfrompast events, and whose existence will be confirmedby the occurrence or non-occurrence of one or more uncertain future events not within the control of the department.
17.4 Commitments Commitments are recorded at cost in the notes to the financial statements when there is a contractualarrangement or an approval by management in a manner that raises a valid expectation that the department will discharge its responsibilities thereby incurring future expenditure that will result in the outflowofcash.
18 Unauthorised expenditureUnauthorised expenditure is recognised in the statement of financial positionuntil such timeas theexpenditure is either:• approvedbyParliamentortheProvincialLegislature
withfundingandtherelatedfundsarereceived;or• approved by Parliament or the Provincial
Legislature without funding and is written off against the appropriation in the statement of financialperformance;or
• transferredtoreceivablesforrecovery.
Unauthorised expenditure is measured at the amount oftheconfirmedunauthorisedexpenditure.
19 Fruitless and wasteful expenditureFruitless and wasteful expenditure is recorded in the notes to the financial statements when confirmed.The amount recorded is equal to the total value of the fruitless and or wasteful expenditure incurred. Fruitless and wasteful expenditure is removed from the notestothefinancialstatementswhenitisresolvedortransferred to receivables for recovery.
Fruitless and wasteful expenditure receivables are measured at the amount that is expected to be recoverable and are de-recognised when settled or subsequently written-off as irrecoverable.
20 Irregular expenditureIrregular expenditure is recorded in the notes to the financial statements when confirmed. The amountrecorded is equal to the value of the irregular expenditure incurred unless it is impracticable to determine, in which case reasons therefor are provided in the note.
Irregular expenditure is removed from the note when it is either condoned by the relevant authority, transferred to receivables for recovery or not condoned and is not recoverable.
Irregular expenditure receivables are measured at the amount that is expected to be recoverable and are de-recognised when settled or subsequently written-off as irrecoverable.
Economic Development Department I ANNUAL REPORT 2015 / 2016138
PART E – Financial InformationEconomic Development Department Vote 25
21 Changes in accounting policies, accounting estimates and errors
Changes in accounting policies that are effected by management have been applied retrospectively in accordance with MCS requirements, except to the extent that it is impracticable to determine the period-specificeffectsorthecumulativeeffectofthechangeinpolicy. In such instances the department shall restate the opening balances of assets, liabilities and net assets for the earliest period for which retrospective restatement is practicable.
Changes in accounting estimates are applied prospectively in accordance with MCS requirements.
Correction of errors is applied retrospectively in the period in which the error has occurred in accordance with MCS requirements, except to the extent that it is impracticabletodeterminetheperiod-specificeffectsor the cumulative effect of the error. In such cases the department shall restate the opening balances of assets, liabilities and net assets for the earliest period for which retrospective restatement is practicable.
22 Events after the reporting dateEvents after the reporting date that are classifiedas adjusting events have been accounted for in the financial statements. The events after the reportingdate thatareclassifiedasnon-adjustingeventsafterthe reporting date have been disclosed in the notes to thefinancialstatements.
25 Capitalisation reserveThecapitalisationreservecomprisesoffinancialassetsand/or liabilities originating in a prior reporting period butwhicharerecognisedinthestatementoffinancialposition for the first time in the current reportingperiod. Amounts are recognised in the capitalisation reserveswhenidentifiedinthecurrentperiodandaretransferred to the National/Provincial Revenue Fund when the underlying asset is disposed and the related funds are received.
26 Recoverable revenueAmounts are recognised as recoverable revenue when apaymentmadeinapreviousfinancialyearbecomesrecoverable from a debtor in the current financialyear. Amounts are either transferred to the National/Provincial Revenue Fund when recovered or are transferred to thestatementoffinancialperformancewhen written-off.
27 Related party transactionsA related party transaction is a transfer of resources, services or obligations between the reporting entity and a related party. Related party transactions within the Minister’s portfolio are recorded in the notes to thefinancialstatementswhenthetransactionisnotatarm’s length.
Key management personnel are those persons having the authority and responsibility for planning, directing and controlling the activities of the department. The number of individuals and their full compensation is recordedinthenotestothefinancialstatements.
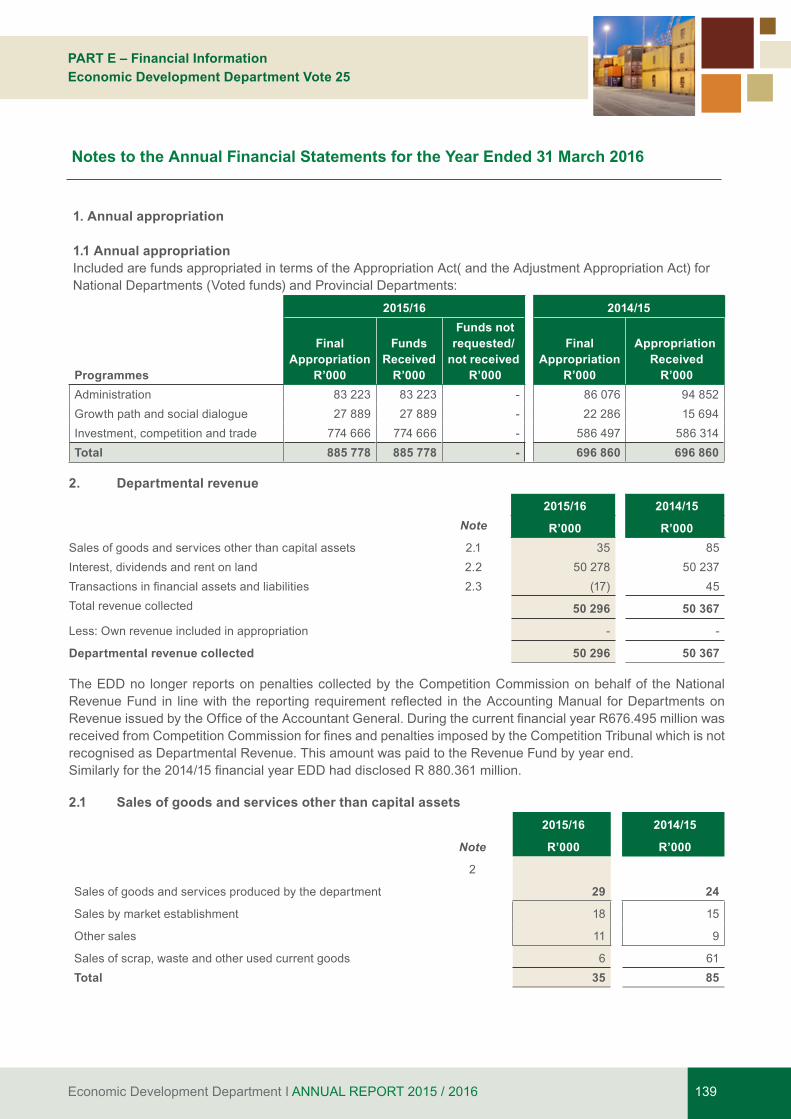
Economic Development Department I ANNUAL REPORT 2015 / 2016 139
PART E – Financial InformationEconomic Development Department Vote 25
1. Annual appropriation
1.1 Annual appropriationIncluded are funds appropriated in terms of the Appropriation Act( and the Adjustment Appropriation Act) for National Departments (Voted funds) and Provincial Departments:
2015/16 2014/15
Programmes
FinalAppropriation
R’000
FundsReceived
R’000
Funds not requested/
not received R’000
FinalAppropriation
R’000
Appropriation Received
R’000 Administration 83 223 83 223 - 86 076 94 852 Growth path and social dialogue 27 889 27 889 - 22 286 15 694 Investment, competition and trade 774 666 774 666 - 586 497 586 314 Total 885 778 885 778 - 696 860 696 860
2. Departmental revenue 2015/16 2014/15
Note R’000 R’000 Sales of goods and services other than capital assets 2.1 35 85 Interest, dividends and rent on land 2.2 50 278 50 237 Transactionsinfinancialassetsandliabilities 2.3 (17) 45 Total revenue collected 50 296 50 367
Less: Own revenue included in appropriation - -
Departmental revenue collected 50 296 50 367
The EDD no longer reports on penalties collected by the Competition Commission on behalf of the National RevenueFund in linewith the reporting requirement reflected in theAccountingManual forDepartmentsonRevenueissuedbytheOfficeoftheAccountantGeneral.DuringthecurrentfinancialyearR676.495millionwasreceivedfromCompetitionCommissionforfinesandpenaltiesimposedbytheCompetitionTribunalwhichisnotrecognised as Departmental Revenue. This amount was paid to the Revenue Fund by year end.Similarlyforthe2014/15financialyearEDDhaddisclosedR880.361million.
2.1 Sales of goods and services other than capital assets 2015/16 2014/15
Note R’000 R’000
2
Sales of goods and services produced by the department 29 24
Sales by market establishment 18 15
Other sales 11 9
Sales of scrap, waste and other used current goods 6 61 Total 35 85
Notes to the Annual Financial Statements for the Year Ended 31 March 2016

Economic Development Department I ANNUAL REPORT 2015 / 2016140
PART E – Financial InformationEconomic Development Department Vote 25
2.2 Interest dividends and rent on land 2015/16 2014/15
Note R’000 R’000
Interest 2 278 237
Dividends 2 50 000 50 000
Total 50 278 50 237 Dividends were received from IDC, a wholly owned subsidiary of EDD as part of investment and transferred to the National Revenue Fund via EDD.
2.3 Transactions in financial assets and liabilities 2015/16 2014/15
Note R’000 R’000
Other Receipts including Recoverable Revenue 2 (17) 45
Total (17) 45
R17 150.93 of other receipts including recoverable revenue includes R 16 050.00 to be recovered from National Revenue Fund as recoverable revenue (debts) reversed during the year.
2.4 Cash received not recognised (not included in the main note) – 2015/16Name of entity Amount
receivedAmount paid to Revenue Fund
Balance
Competition Commissions 676 495 675 445 1 050
Total 676 495 675 445 1 050
Cash received not recognised (not included in the main note) – 2014/15
Name of entity Amount received
Amount paid to Revenue Fund
Balance
Competition Commissions 880 361 880 361 -
Total 880 361 880 361 -
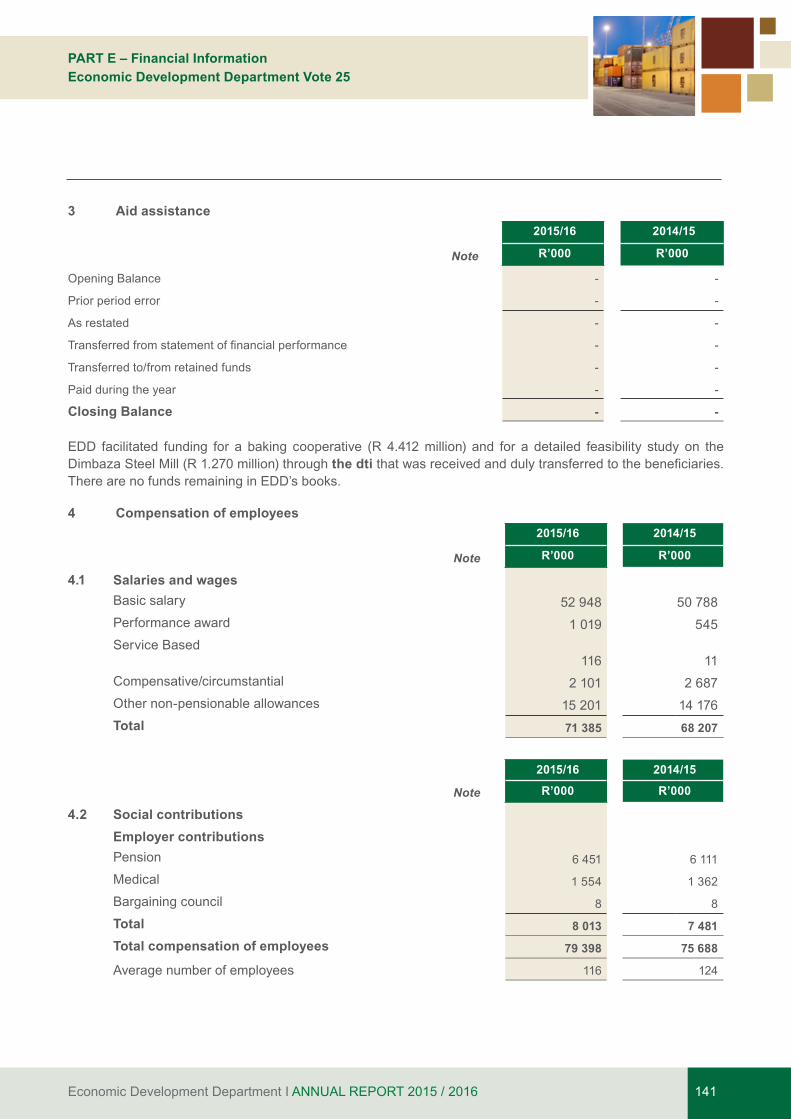
Economic Development Department I ANNUAL REPORT 2015 / 2016 141
PART E – Financial InformationEconomic Development Department Vote 25
3 Aid assistance 2015/16 2014/15
Note R’000 R’000
Opening Balance - -
Prior period error - -
As restated - -
Transferredfromstatementoffinancialperformance - -
Transferred to/from retained funds - -
Paid during the year - -
Closing Balance - -
EDD facilitated funding for a baking cooperative (R 4.412 million) and for a detailed feasibility study on the Dimbaza Steel Mill (R 1.270 million) through the dtithatwasreceivedanddulytransferredtothebeneficiaries.There are no funds remaining in EDD’s books.
4 Compensation of employees 2015/16 2014/15
Note R’000 R’000
4.1 Salaries and wagesBasic salary 52 948 50 788 Performance award 1 019 545 Service Based
116 11 Compensative/circumstantial 2 101 2 687 Other non-pensionable allowances 15 201 14 176 Total 71 385 68 207
2015/16 2014/15
Note R’000 R’000
4.2 Social contributionsEmployer contributionsPension 6 451 6 111
Medical 1 554 1 362
Bargaining council 8 8
Total 8 013 7 481 Total compensation of employees 79 398 75 688
Average number of employees 116 124
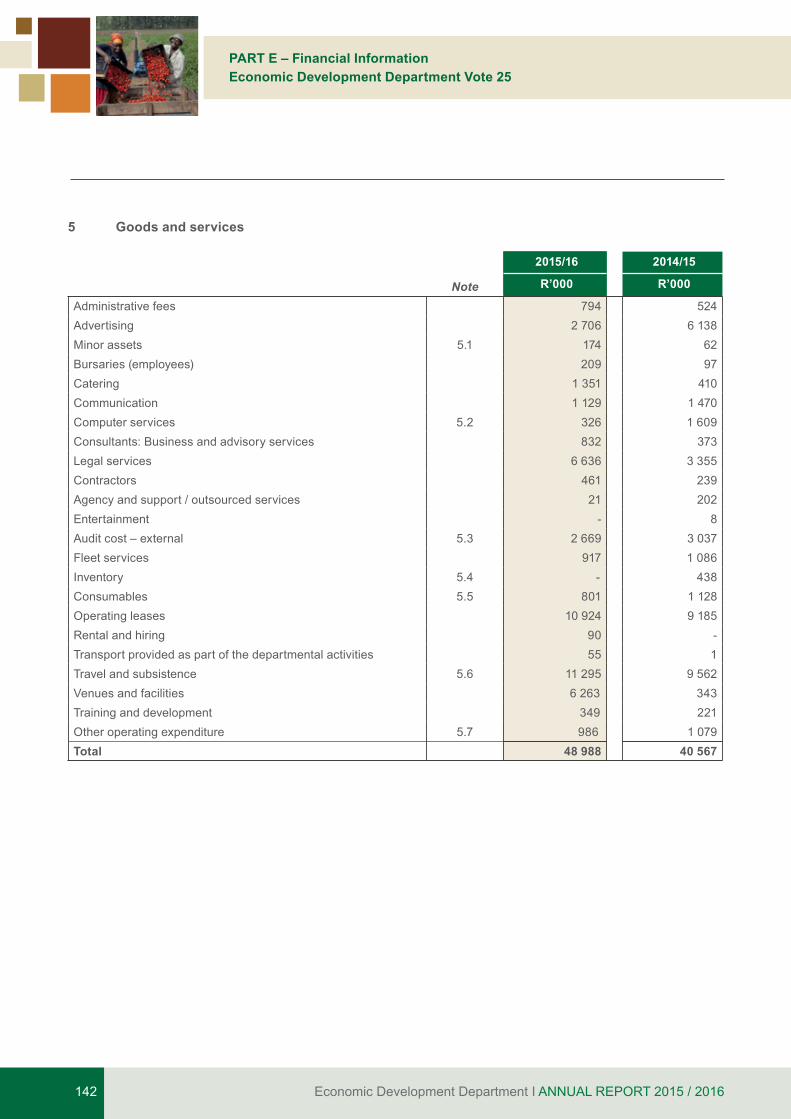
Economic Development Department I ANNUAL REPORT 2015 / 2016142
PART E – Financial InformationEconomic Development Department Vote 25
5 Goods and services
2015/16 2014/15
Note R’000 R’000
Administrative fees 794 524Advertising 2 706 6 138 Minor assets 5.1 174 62 Bursaries (employees) 209 97 Catering 1 351 410 Communication 1 129 1 470 Computer services 5.2 326 1 609Consultants: Business and advisory services 832 373 Legal services 6 636 3 355 Contractors 461 239 Agency and support / outsourced services 21 202 Entertainment - 8 Audit cost – external 5.3 2 669 3 037Fleet services 917 1 086 Inventory 5.4 - 438Consumables 5.5 801 1 128Operating leases 10 924 9 185 Rental and hiring 90 -Transport provided as part of the departmental activities 55 1 Travel and subsistence 5.6 11 295 9 562 Venues and facilities 6 263 343 Training and development 349 221 Other operating expenditure 5.7 986 1 079 Total 48 988 40 567
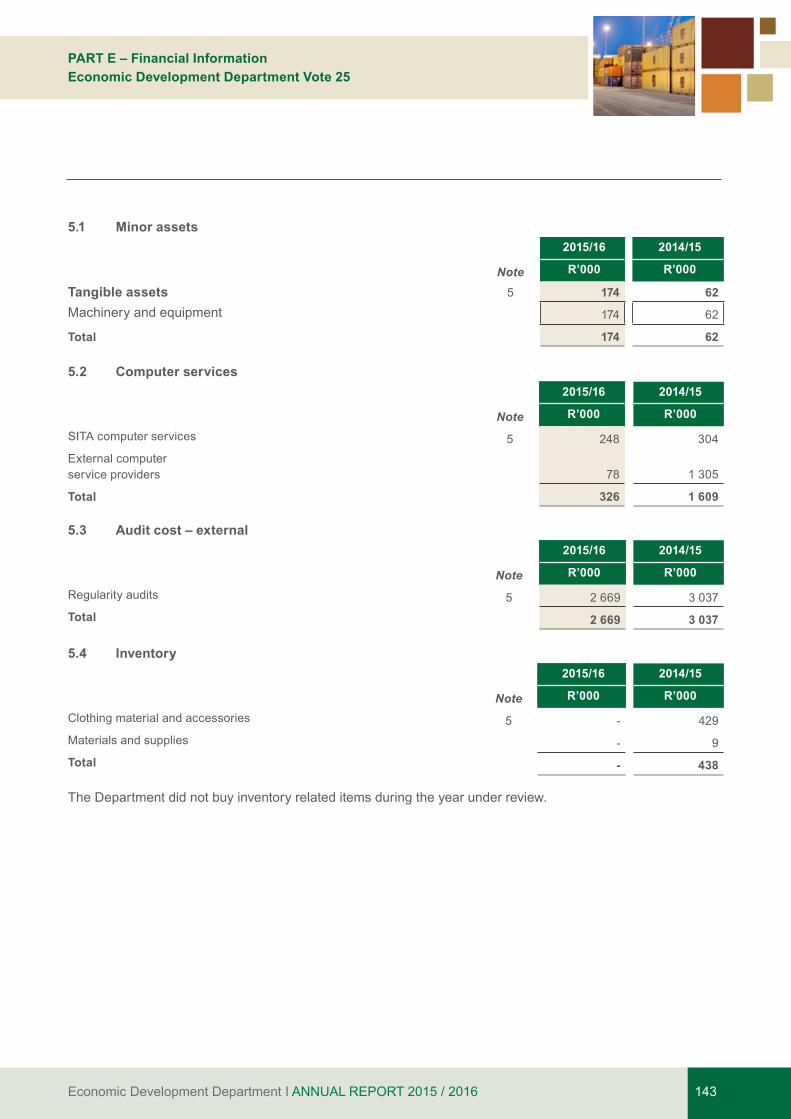
Economic Development Department I ANNUAL REPORT 2015 / 2016 143
PART E – Financial InformationEconomic Development Department Vote 25
5.1 Minor assets 2015/16 2014/15
Note R’000 R’000
Tangible assets 5 174 62 Machinery and equipment 174 62
Total 174 62
5.2 Computer services 2015/16 2014/15
Note R’000 R’000
SITA computer services 5 248 304 External computer service providers
78 1 305
Total 326 1 609
5.3 Audit cost – external 2015/16 2014/15
Note R’000 R’000
Regularity audits 5 2 669 3 037 Total 2 669 3 037
5.4 Inventory 2015/16 2014/15
Note R’000 R’000
Clothing material and accessories 5 - 429 Materials and supplies - 9 Total - 438
The Department did not buy inventory related items during the year under review.

Economic Development Department I ANNUAL REPORT 2015 / 2016144
PART E – Financial InformationEconomic Development Department Vote 25
5.5 Consumables 2015/16 2014/15
Note R’000 R’000
Consumable supplies 5 98 100Uniform and clothing - 19Household supplies 44 35Building material and supplies 3 -Communication accessories 1 5IT consumables 7 10Other consumables 43 31Stationery, printing and office supplies 703 1 028Total 801 1 128
5.6 Travel and subsistence 2015/16 2014/15
Note R’000 R’000
Local 5 10 440 9 158 Foreign 8 55 404 Total 11 295 9 562
5.7 Other operating expenditure 2015/16 2014/15
Note R’000 R’000
Professional bodies, membership and subscription fees 5 - 10 Resettlement costs 5 4 76 Other 5 982 993 Total 986 1 079
Other consists of laundry services, courier and delivery services and printing and publications services.
6. Payments for financial assets 2015/16 2014/15
Note R’000 R’000
Debts written off 6.1 2 - Total 2 -
6.1 Debts written off 2015/16 2014/15
Note R’000 R’000
Other debts written off (Tax debt) 6 2 -
Total 2 -

Economic Development Department I ANNUAL REPORT 2015 / 2016 145
PART E – Financial InformationEconomic Development Department Vote 25
7. Transfers and subsidies 2015/16 2014/15
Note R’000 R’000
Departmental agencies and accounts Annex 1A 338 848 306 820 Public corporations and private enterprises Annex 1B 411 397 268 845 Non-profitinstitutions Annex 1C - 60 Households Annex 1D 151 220 Total 750 396 575 945
All funds received were transferred to the entities accordingly
8. Expenditure for capital assets 2015/16 2014/15
Note R’000 R’000
Expenditure for capital assets
Tangible assets 3 383 2 712 Machinery and equipment 27 3 383 2 712 Intangible assets 1 566 - Software 28 1 566 - Total 4 949 2 712
8.1 Analysis of funds utilised to acquire capital assets 2015/16Voted Funds
Aid assistance TOTAL
R’000 R’000 R’000 Tangible assets 3 383 - 3 383Machinery and equipment 3 383 - 3 383Intangible assets 1 566 - 1 566 Software 1 566 - 1 566 Total 4 949 - 4 949
8.2 Analysis of funds utilised to acquire capital assets 2014/15Voted Funds
Aid assistance TOTAL
R’000 R’000 R’000 Tangible assets 2 712 - 2 712 Machinery and equipment 2 712 - 2 712 Total 2 712 - 2 712

Economic Development Department I ANNUAL REPORT 2015 / 2016146
PART E – Financial InformationEconomic Development Department Vote 25
8.3 Finance lease expenditure included in expenditure for capital assets 2015/16 2014/15
R’000 R’000
Tangible assetsMachinery and equipment 1 403 1 252
Total 1 403 1 252
Finance lease consist of lease for cellphones and photocopy machines contracts.
9. Cash and cash equivalents 2015/16 2014/15
Note R’000 R’000
Consolidated Paymaster General Account 51 716 1 564
Cash on hand 24 24
Investments (Domestic) 64 291
Total 51 804 1 879
R 51 716 million include R50 million of dividends received from IDC. The R 24 000 is the standing petty cash.
10. Prepayments and advances 2015/16 2014/15
Note R’000 R’000
Travel and subsistence - 26
Advances paid 10.1 393 82
393 108
10.1. Advance paid 2015/16 2014/15
Note R’000 R’000
National departments Annex 6 393 82
393 82
An Advance of R 393 thousand was paid to GCIS for co-ordinating government communication system and assisting EDD with planning, implementation and management of communication activities including media buying, production and marketing services.
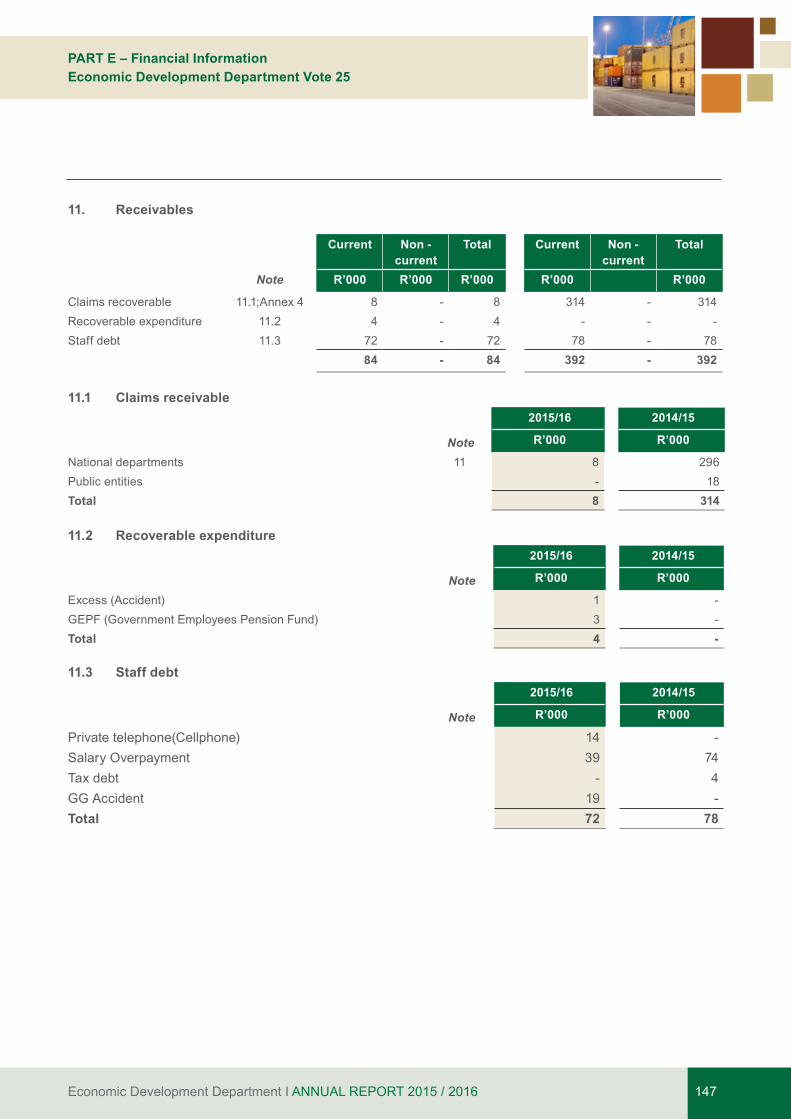
Economic Development Department I ANNUAL REPORT 2015 / 2016 147
PART E – Financial InformationEconomic Development Department Vote 25
11. Receivables
Current Non - current
Total Current Non - current
Total
Note R’000 R’000 R’000 R’000 R’000
Claims recoverable 11.1;Annex4 8 - 8 314 - 314Recoverable expenditure 11.2 4 - 4 - - -Staff debt 11.3 72 - 72 78 - 78
84 - 84 392 - 392
11.1 Claims receivable 2015/16 2014/15
Note R’000 R’000
National departments 11 8 296 Public entities - 18 Total 8 314
11.2 Recoverable expenditure 2015/16 2014/15
Note R’000 R’000
Excess (Accident) 1 - GEPF (Government Employees Pension Fund) 3 - Total 4 -
11.3 Staff debt 2015/16 2014/15
Note R’000 R’000
Private telephone(Cellphone) 14 -Salary Overpayment 39 74 Tax debt - 4 GG Accident 19 -Total 72 78
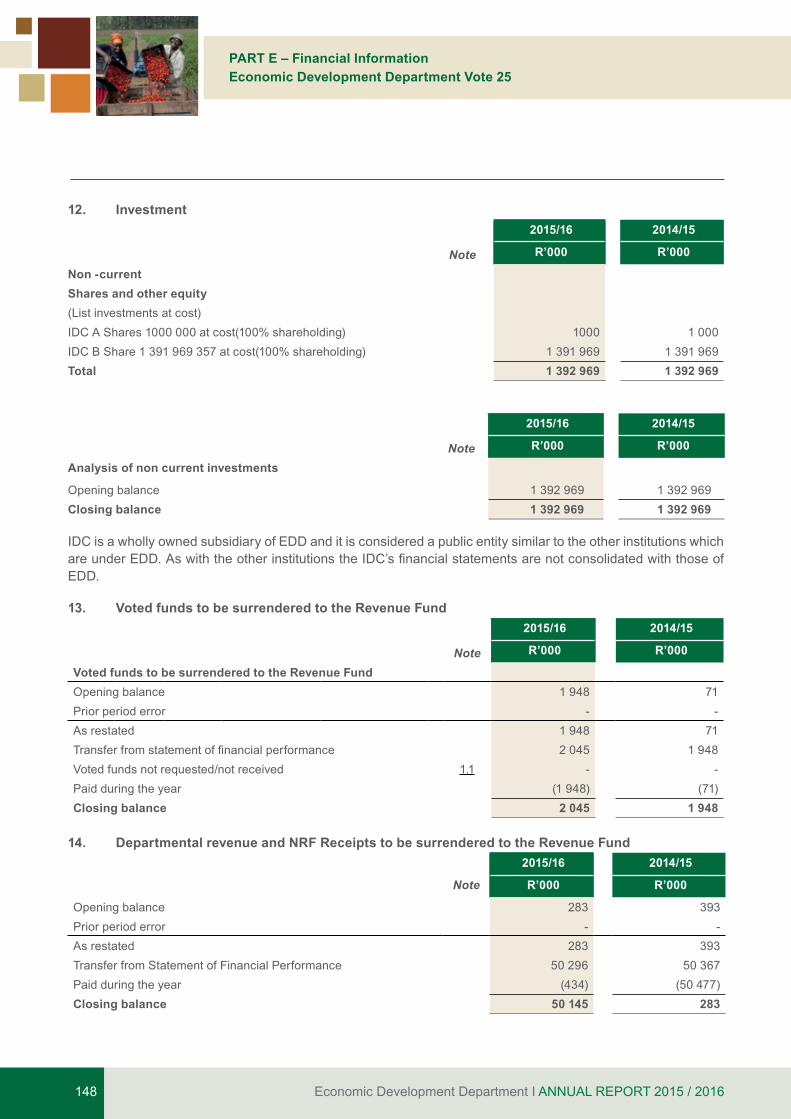
Economic Development Department I ANNUAL REPORT 2015 / 2016148
PART E – Financial InformationEconomic Development Department Vote 25
12. Investment 2015/16 2014/15
Note R’000 R’000
Non -currentShares and other equity(List investments at cost)IDC A Shares 1000 000 at cost(100% shareholding) 1000 1 000 IDC B Share 1 391 969 357 at cost(100% shareholding) 1 391 969 1 391 969 Total 1 392 969 1 392 969
2015/16 2014/15
Note R’000 R’000
Analysis of non current investments
Opening balance 1 392 969 1 392 969 Closing balance 1 392 969 1 392 969
IDC is a wholly owned subsidiary of EDD and it is considered a public entity similar to the other institutions which areunderEDD.AswiththeotherinstitutionstheIDC’sfinancialstatementsarenotconsolidatedwiththoseofEDD.
13. Voted funds to be surrendered to the Revenue Fund 2015/16 2014/15
Note R’000 R’000
Voted funds to be surrendered to the Revenue FundOpening balance 1 948 71 Prior period error - - As restated 1 948 71 Transferfromstatementoffinancialperformance 2 045 1 948 Voted funds not requested/not received 1.1 - -Paid during the year (1 948) (71)Closing balance 2 045 1 948
14. Departmental revenue and NRF Receipts to be surrendered to the Revenue Fund 2015/16 2014/15
Note R’000 R’000
Opening balance 283 393Prior period error - - As restated 283 393 Transfer from Statement of Financial Performance 50 296 50 367 Paid during the year (434) (50 477)Closing balance 50 145 283
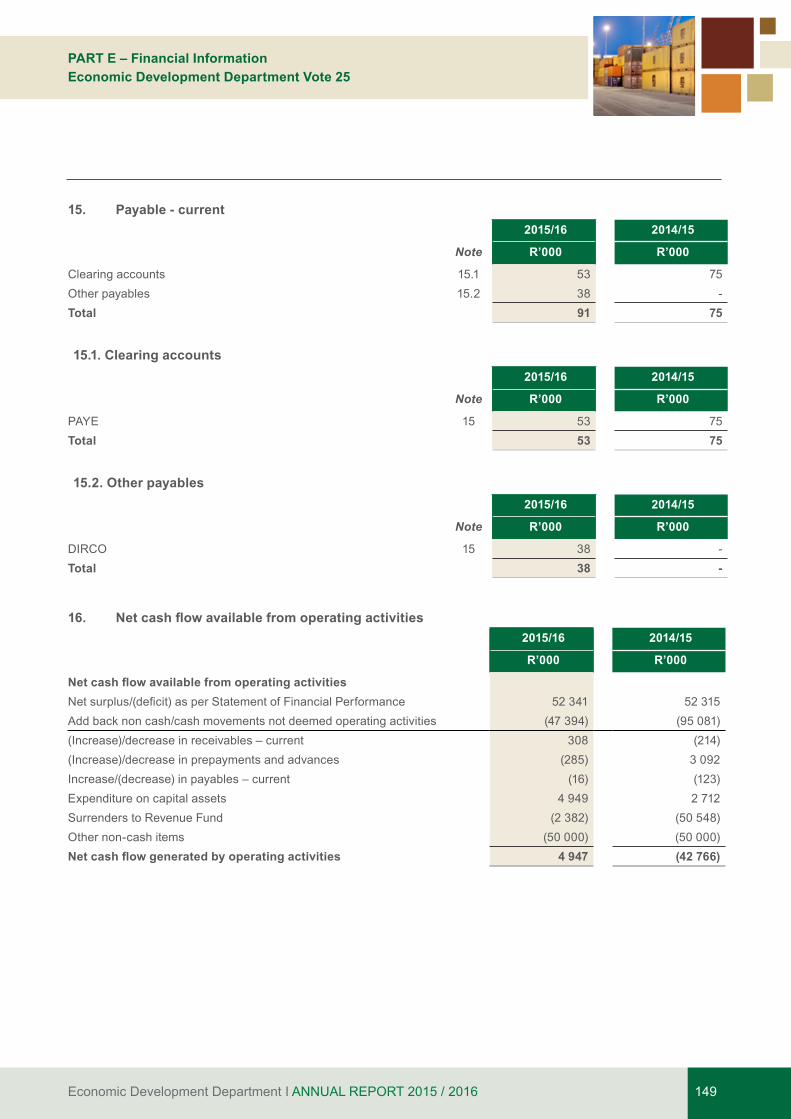
Economic Development Department I ANNUAL REPORT 2015 / 2016 149
PART E – Financial InformationEconomic Development Department Vote 25
15. Payable - current 2015/16 2014/15
Note R’000 R’000
Clearing accounts 15.1 53 75Other payables 15.2 38 -Total 91 75
15.1. Clearing accounts 2015/16 2014/15
Note R’000 R’000
PAYE 15 53 75Total 53 75
15.2. Other payables 2015/16 2014/15
Note R’000 R’000
DIRCO 15 38 -Total 38 -
16. Net cash flow available from operating activities 2015/16 2014/15
R’000 R’000
Net cash flow available from operating activitiesNetsurplus/(deficit)asperStatementofFinancialPerformance 52 341 52 315 Add back non cash/cash movements not deemed operating activities (47 394) (95 081)(Increase)/decrease in receivables – current 308 (214)(Increase)/decrease in prepayments and advances (285) 3 092 Increase/(decrease) in payables – current (16) (123)Expenditure on capital assets 4 949 2 712 Surrenders to Revenue Fund (2 382) (50 548)Other non-cash items (50 000) (50 000)Net cash flow generated by operating activities 4 947 (42 766)
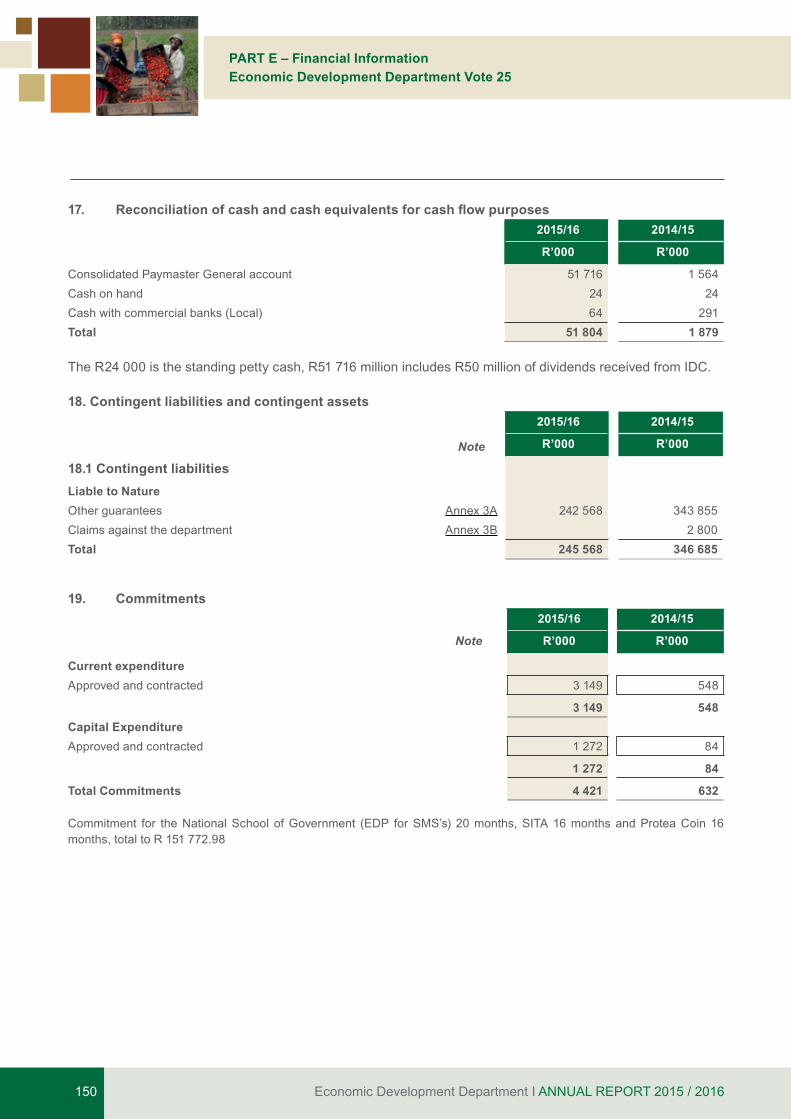
Economic Development Department I ANNUAL REPORT 2015 / 2016150
PART E – Financial InformationEconomic Development Department Vote 25
17. Reconciliation of cash and cash equivalents for cash flow purposes 2015/16 2014/15
R’000 R’000
Consolidated Paymaster General account 51 716 1 564 Cash on hand 24 24 Cash with commercial banks (Local) 64 291 Total 51 804 1 879
The R24 000 is the standing petty cash, R51 716 million includes R50 million of dividends received from IDC.
18. Contingent liabilities and contingent assets 2015/16 2014/15
Note R’000 R’000
18.1 Contingent liabilitiesLiable to NatureOther guarantees Annex 3A 242 568 343 855Claims against the department Annex 3B 2 800 Total 245 568 346 685
19. Commitments 2015/16 2014/15
Note R’000 R’000
Current expenditureApproved and contracted 3 149 548
3 149 548 Capital ExpenditureApproved and contracted 1 272 84
1 272 84
Total Commitments 4 421 632
Commitment for the National School of Government (EDP for SMS’s) 20 months, SITA 16 months and Protea Coin 16 months, total to R 151 772.98
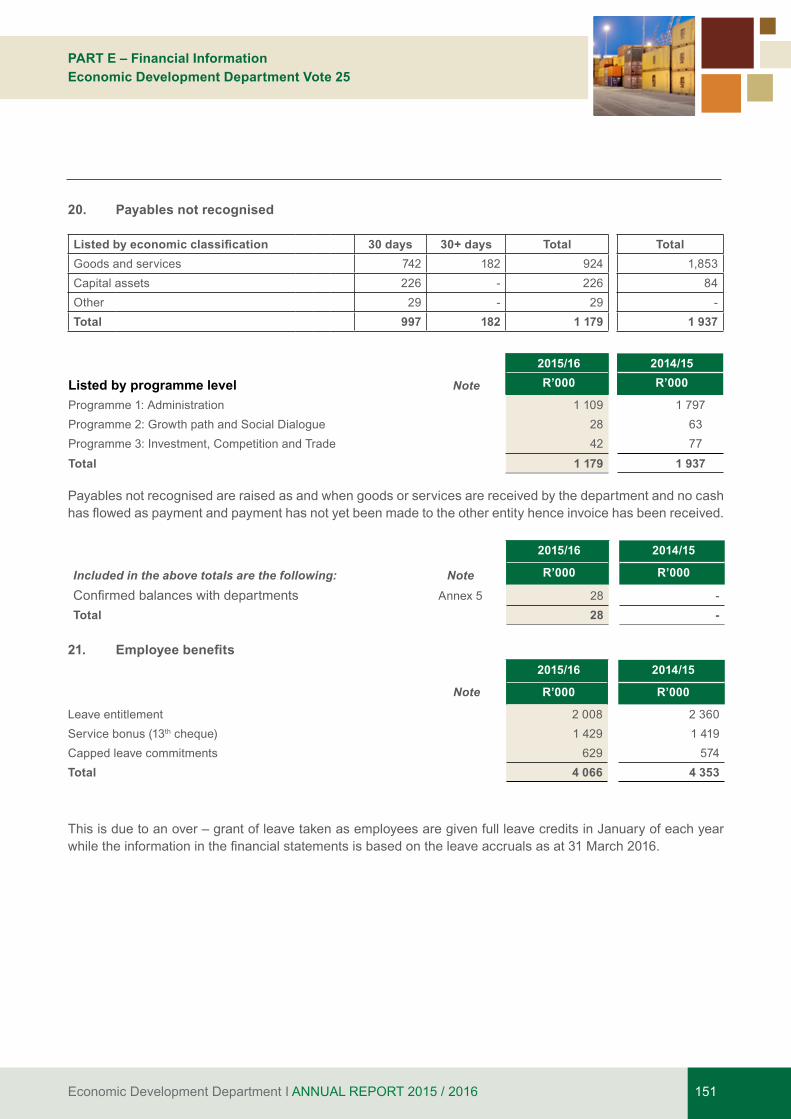
Economic Development Department I ANNUAL REPORT 2015 / 2016 151
PART E – Financial InformationEconomic Development Department Vote 25
20. Payables not recognised
Listed by economic classification 30 days 30+ days Total TotalGoods and services 742 182 924 1,853 Capital assets 226 - 226 84 Other 29 - 29 - Total 997 182 1 179 1 937
2015/16 2014/15
Listed by programme level Note R’000 R’000
Programme 1: Administration 1 109 1 797 Programme 2: Growth path and Social Dialogue 28 63 Programme 3: Investment, Competition and Trade 42 77
Total 1 179 1 937 Payables not recognised are raised as and when goods or services are received by the department and no cash hasflowedaspaymentandpaymenthasnotyetbeenmadetotheotherentityhenceinvoicehasbeenreceived.
2015/16 2014/15
Included in the above totals are the following: Note R’000 R’000
Confirmedbalanceswithdepartments Annex 5 28 - Total 28 -
21. Employee benefits 2015/16 2014/15
Note R’000 R’000
Leave entitlement 2 008 2 360 Service bonus (13th cheque) 1 429 1 419 Capped leave commitments 629 574 Total 4 066 4 353
This is due to an over – grant of leave taken as employees are given full leave credits in January of each year whiletheinformationinthefinancialstatementsisbasedontheleaveaccrualsasat31March2016.
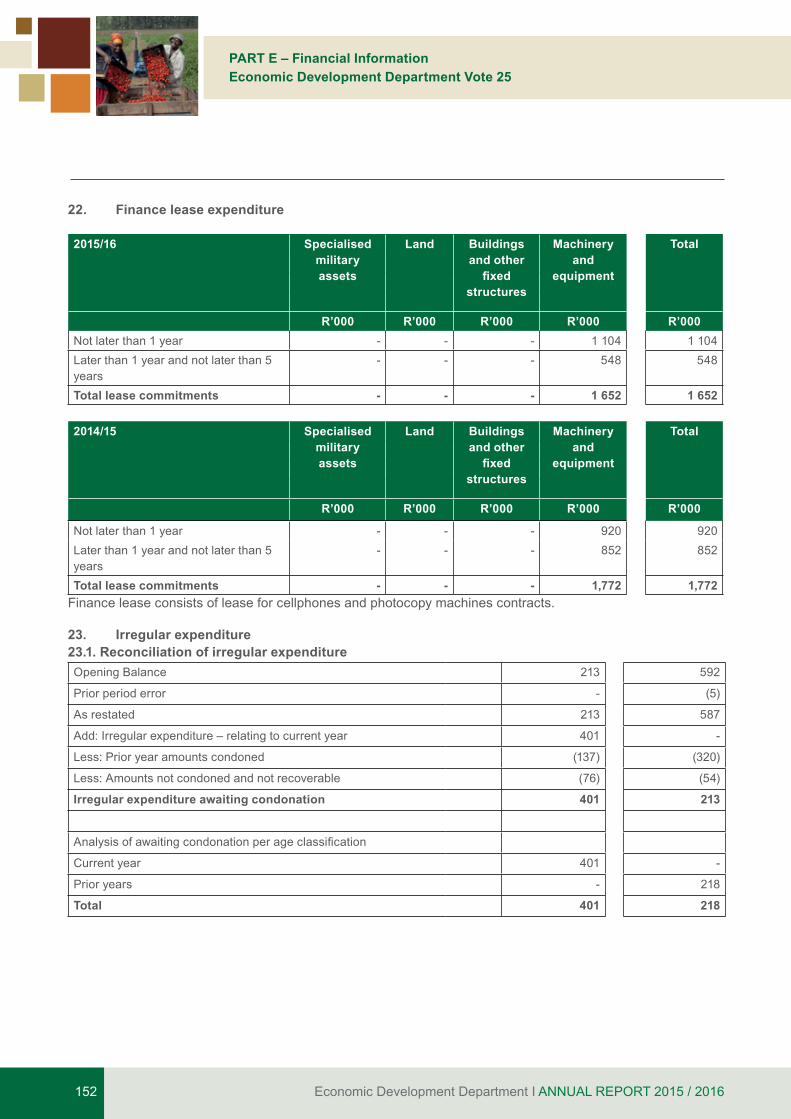
Economic Development Department I ANNUAL REPORT 2015 / 2016152
PART E – Financial InformationEconomic Development Department Vote 25
22. Finance lease expenditure
2015/16 Specialisedmilitaryassets
Land Buildingsand other
fixedstructures
Machineryand
equipment
Total
R’000 R’000 R’000 R’000 R’000Not later than 1 year - - - 1 104 1 104Later than 1 year and not later than 5 years
- - - 548 548
Total lease commitments - - - 1 652 1 652
2014/15 Specialisedmilitaryassets
Land Buildingsand other
fixedstructures
Machineryand
equipment
Total
R’000 R’000 R’000 R’000 R’000
Not later than 1 year - - - 920 920Later than 1 year and not later than 5 years
- - - 852 852
Total lease commitments - - - 1,772 1,772Finance lease consists of lease for cellphones and photocopy machines contracts.
23. Irregular expenditure23.1. Reconciliation of irregular expenditureOpening Balance 213 592
Prior period error - (5)
As restated 213 587
Add: Irregular expenditure – relating to current year 401 -
Less: Prior year amounts condoned (137) (320)
Less: Amounts not condoned and not recoverable (76) (54)
Irregular expenditure awaiting condonation 401 213
Analysisofawaitingcondonationperageclassification
Current year 401 -
Prior years - 218
Total 401 218
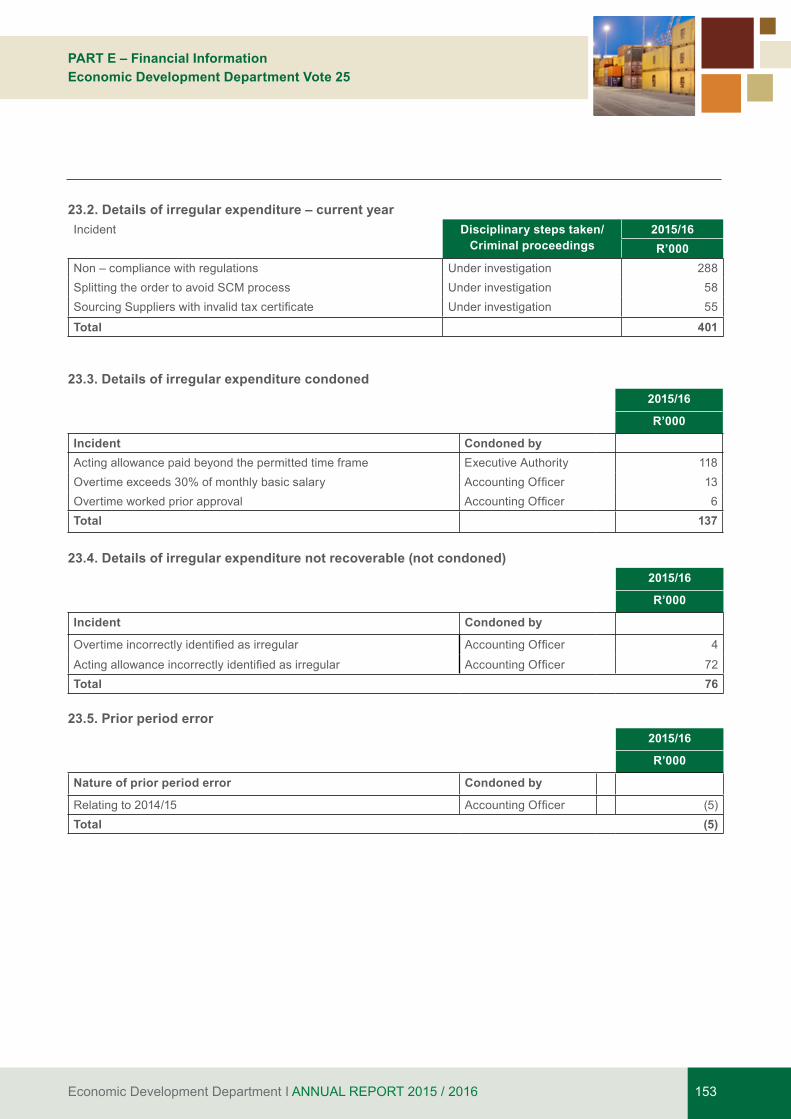
Economic Development Department I ANNUAL REPORT 2015 / 2016 153
PART E – Financial InformationEconomic Development Department Vote 25
23.2. Details of irregular expenditure – current yearIncident Disciplinary steps taken/
Criminal proceedings2015/16R’000
Non – compliance with regulations Under investigation 288Splitting the order to avoid SCM process Under investigation 58SourcingSupplierswithinvalidtaxcertificate Under investigation 55
Total 401
23.3. Details of irregular expenditure condoned2015/16
R’000
Incident Condoned byActing allowance paid beyond the permitted time frame Executive Authority 118Overtime exceeds 30% of monthly basic salary AccountingOfficer 13Overtime worked prior approval AccountingOfficer 6Total 137
23.4. Details of irregular expenditure not recoverable (not condoned)2015/16
R’000
Incident Condoned by
Overtimeincorrectlyidentifiedasirregular AccountingOfficer 4
Actingallowanceincorrectlyidentifiedasirregular AccountingOfficer 72Total 76
23.5. Prior period error2015/16
R’000
Nature of prior period error Condoned by
Relating to 2014/15 AccountingOfficer (5)Total (5)

Economic Development Department I ANNUAL REPORT 2015 / 2016154
PART E – Financial InformationEconomic Development Department Vote 25
24. Related party transactions 2015/16 2014/15
Note R’000 R’000
Revenue received
Interest, dividends and rent on land 50 000 50 000
Total 50,000 50,000
2014/15 2014/15
Note R’000 R’000
Other
Guarantees issued/received 242 568 343 885
Total 242 568 343 885
Guarantees are as a result of loans given to IDC by foreign banks.
List of related party relationshipsEDD had oversight responsibility over the following Public and Trading entities1. Industrial Development Corporation Ltd (IDC)2. Competition Commission3. Competition Tribunal4. International Trade Administration Commission of South Africa (ITAC)
sefa has been transferred to Small Business Department, however the budget allocation has remained with EDD
25. Key management personnelNo. of
Individuals 2014/15 2014/15
R’000 R’000
Politicalofficebearers(providedetailsbelow 2 4 211 4 044
Officials
Level 15 to 16 2 2 266 2 929Level 14(incl CFO if at lower level) 14 14 284 13 464Total 20 731 20 397
Political office bearers consist of:- Minister E Patel- Deputy Minister B Masuku
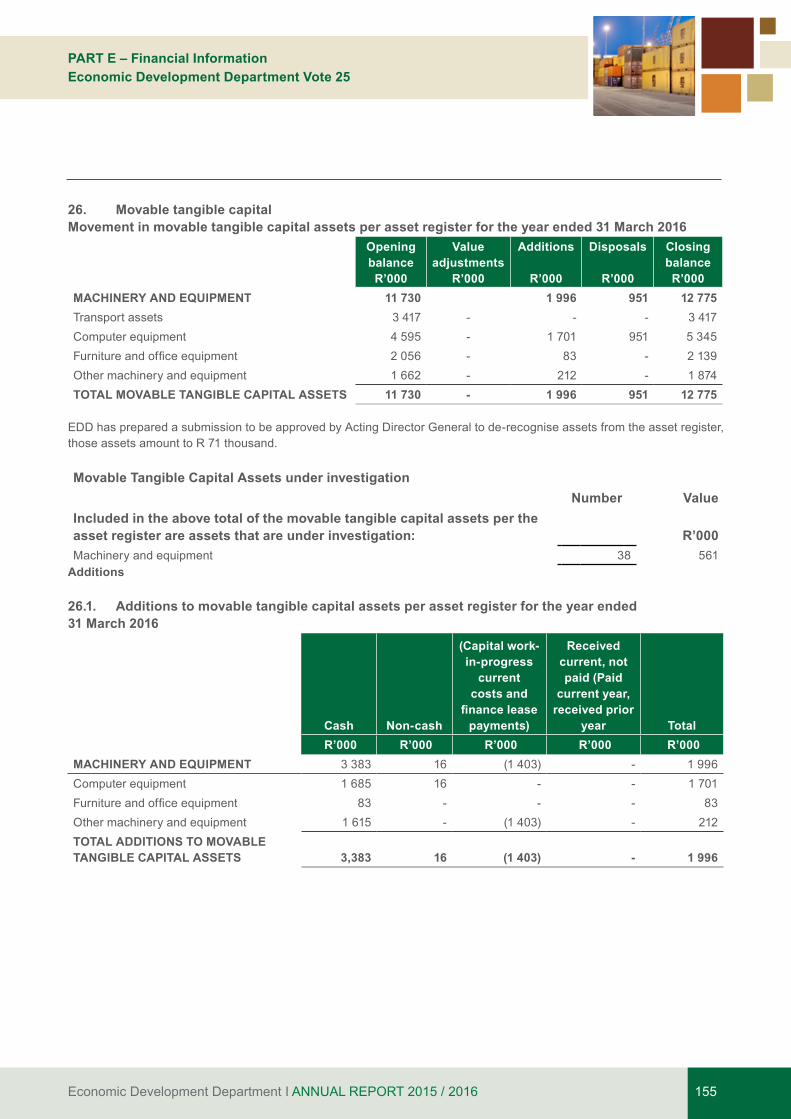
Economic Development Department I ANNUAL REPORT 2015 / 2016 155
PART E – Financial InformationEconomic Development Department Vote 25
26. Movable tangible capitalMovement in movable tangible capital assets per asset register for the year ended 31 March 2016
Opening balanceR’000
Value adjustments
R’000
Additions
R’000
Disposals
R’000
Closing balanceR’000
MACHINERY AND EQUIPMENT 11 730 1 996 951 12 775Transport assets 3 417 - - - 3 417Computer equipment 4 595 - 1 701 951 5 345Furnitureandofficeequipment 2 056 - 83 - 2 139Other machinery and equipment 1 662 - 212 - 1 874TOTAL MOVABLE TANGIBLE CAPITAL ASSETS 11 730 - 1 996 951 12 775
EDD has prepared a submission to be approved by Acting Director General to de-recognise assets from the asset register, those assets amount to R 71 thousand.
Movable Tangible Capital Assets under investigationNumber Value
Included in the above total of the movable tangible capital assets per the asset register are assets that are under investigation: R’000Machinery and equipment 38 561
Additions
26.1. Additions to movable tangible capital assets per asset register for the year ended 31 March 2016
Cash Non-cash
(Capital work-in-progress
current costs and
finance lease payments)
Received current, not paid (Paid
current year, received prior
year Total R’000 R’000 R’000 R’000 R’000
MACHINERY AND EQUIPMENT 3 383 16 (1 403) - 1 996 Computer equipment 1 685 16 - - 1 701 Furnitureandofficeequipment 83 - - - 83 Other machinery and equipment 1 615 - (1 403) - 212 TOTAL ADDITIONS TO MOVABLE TANGIBLE CAPITAL ASSETS 3,383 16 (1 403) - 1 996
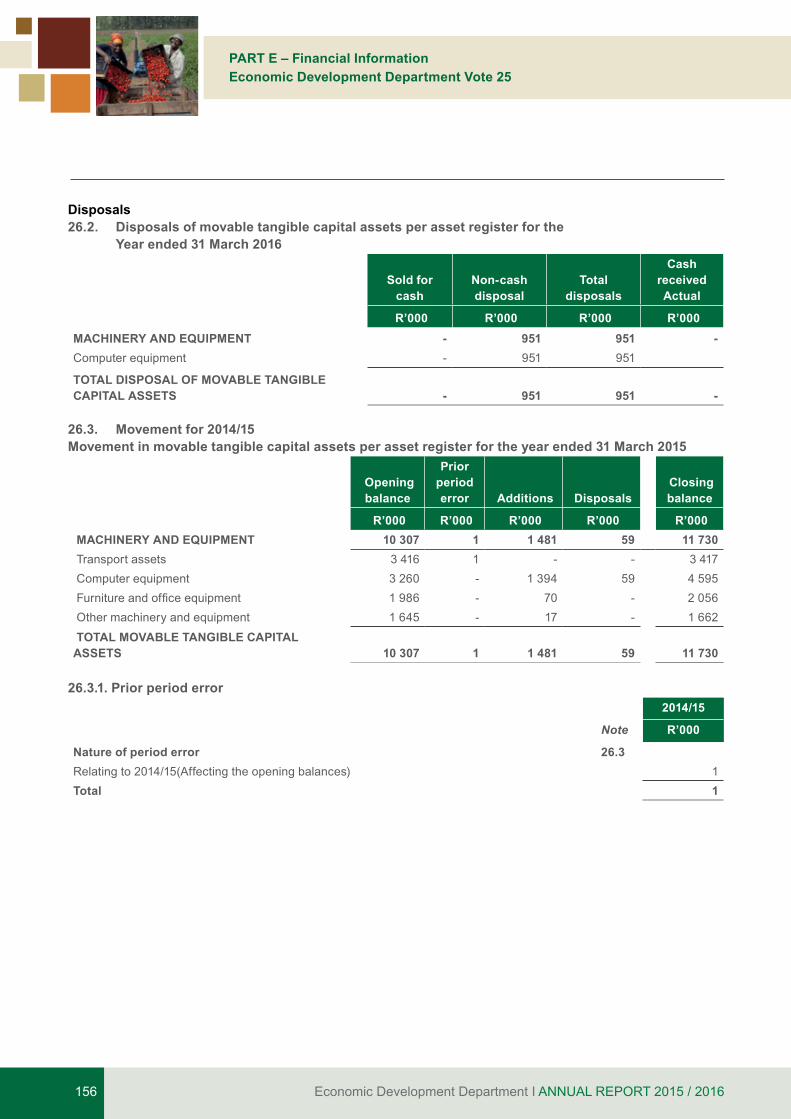
Economic Development Department I ANNUAL REPORT 2015 / 2016156
PART E – Financial InformationEconomic Development Department Vote 25
Disposals26.2. Disposals of movable tangible capital assets per asset register for the Year ended 31 March 2016
Sold for cash
Non-cash disposal
Total disposals
Cash received Actual
R’000 R’000 R’000 R’000 MACHINERY AND EQUIPMENT - 951 951 - Computer equipment - 951 951
TOTAL DISPOSAL OF MOVABLE TANGIBLE CAPITAL ASSETS - 951 951 -
26.3. Movement for 2014/15Movement in movable tangible capital assets per asset register for the year ended 31 March 2015
Opening balance
Prior period error Additions Disposals
Closing balance
R’000 R’000 R’000 R’000 R’000 MACHINERY AND EQUIPMENT 10 307 1 1 481 59 11 730 Transport assets 3 416 1 - - 3 417 Computer equipment 3 260 - 1 394 59 4 595 Furnitureandofficeequipment 1 986 - 70 - 2 056 Other machinery and equipment 1 645 - 17 - 1 662
TOTAL MOVABLE TANGIBLE CAPITAL ASSETS 10 307 1 1 481 59 11 730
26.3.1. Prior period error2014/15
Note R’000
Nature of period error 26.3Relating to 2014/15(Affecting the opening balances) 1Total 1

Economic Development Department I ANNUAL REPORT 2015 / 2016 157
PART E – Financial InformationEconomic Development Department Vote 25
26.4. Minor assetsMovement in minor assets per the asset register for the year ended 31 March 2016
Specialised military assets
Intangible assets
Heritage assets
Machinery and
equipment Biological
assets Total
R’000 R’000 R’000 R’000 R’000 R’000
Opening balance - - - 723 - 723
Value adjustments - - - (3) (3)
Additions - - - 177 - 177
Disposals - - - 20 - 20 TOTAL MINOR ASSETS - - - 877 - 877
Specialised military assets
Intangible assets
Heritage assets
Machinery and
equipment Biological
assets Total
Number of R1 minor assets - - - 8 - 8 Number of minor assets at cost - - - 491 - 491 TOTAL NUMBER OF MINOR ASSETS - - - 499 - 499
Minor Capital Assets under investigationNumber Value
Included in the above total of the minor capital assets per the asset register are assets that are under investigation: R’000Machinery and equipment 66 116
Minor assets Movement in minor assets per the asset register for the year ended 31 March 2015
Specialised military assets
Intangible assets
Heritage assets
Machinery and
equipment Biological
assets Total
R’000 R’000 R’000 R’000 R’000 R’000
Opening balance - - - 674 - 674
Additions - - - 62 - 62
Disposals - - - 13 - 13 TOTAL MINOR ASSETS - - - 723 - 723

Economic Development Department I ANNUAL REPORT 2015 / 2016158
PART E – Financial InformationEconomic Development Department Vote 25
27. Intangible capital assets
Movement in intangible capital assets per asset register for the year ended 31 March 2016Opening balance
Value adjustments Additions Disposals
Closing balance
R’000 R’000 R’000 R’000 R’000
SOFTWARE 1 802 1 566 - 3 368 TOTAL INTANGIBLE CAPITAL ASSETS 1 802 - 1 566 - 3 368
27.1. Additions to intangible capital assets per asset register for the year ended 31 March 2016
Cash Non-cash
(Development work-in-progress
current costs)
Received current, not paid (Paid
current year,
received prior year Total
R’000 R’000 R’000 R’000 R’000 SOFTWARE 1 566 - (1 566) - TOTAL ADDITIONS TO INTANGIBLE CAPITAL ASSETS 1 566 - (1 566) - -
Movement for 2014/15 27.2. Movement in intangible capital assets per asset register for the year ended 31 March 2015
Opening balance
Prior period error Additions Disposals
Closing balance
R’000 R’000 R’000 R’000 R’000 SOFTWARE 1 435 - 367 - 1 802 TOTAL INTANGIBLE CAPITAL ASSETS 1 435 - 367 - 1 802
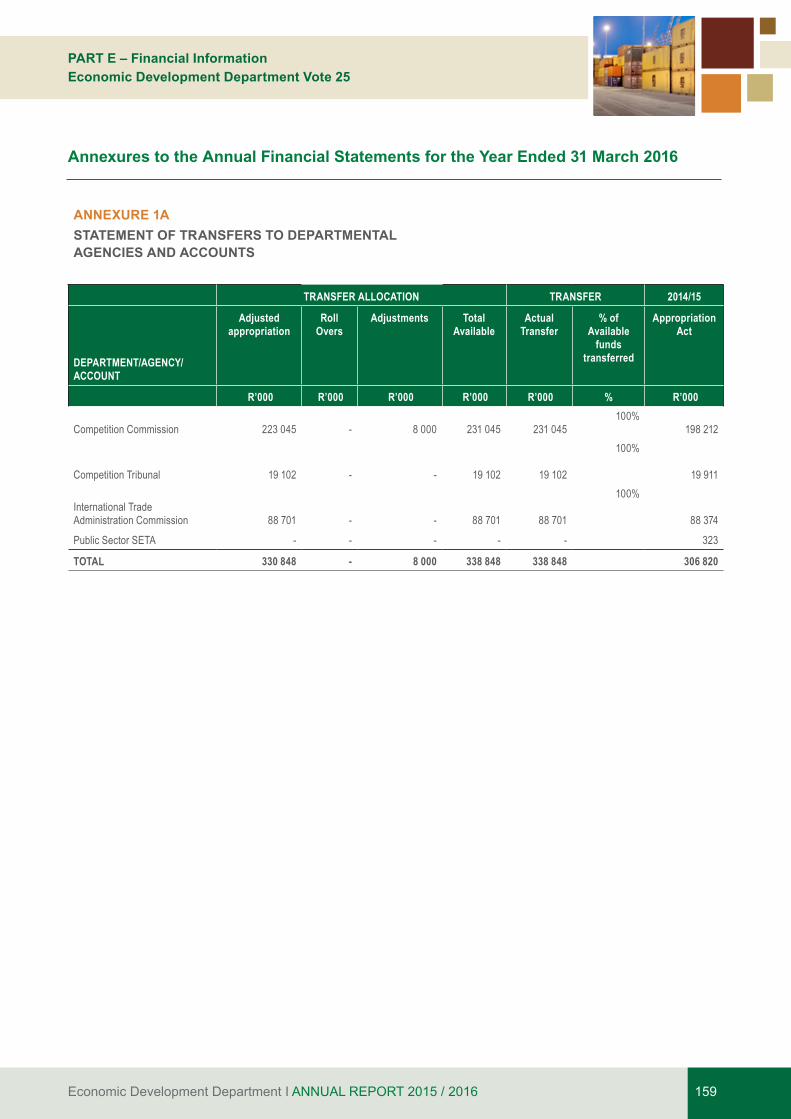
Economic Development Department I ANNUAL REPORT 2015 / 2016 159
PART E – Financial InformationEconomic Development Department Vote 25
ANNEXURE 1ASTATEMENT OF TRANSFERS TO DEPARTMENTAL AGENCIES AND ACCOUNTS
TRANSFER ALLOCATION TRANSFER 2014/15
DEPARTMENT/AGENCY/ACCOUNT
Adjusted appropriation
Roll Overs
Adjustments Total Available
Actual Transfer
% of Available
funds transferred
Appropriation Act
R’000 R’000 R’000 R’000 R’000 % R’000
Competition Commission 223 045 - 8 000 231 045 231 045 100%
198 212
Competition Tribunal 19 102 - - 19 102 19 102
100%
19 911
International Trade Administration Commission 88 701 - -
88 701 88 701
100%
88 374
Public Sector SETA - - - - - 323
TOTAL 330 848 - 8 000 338 848 338 848 306 820
Annexures to the Annual Financial Statements for the Year Ended 31 March 2016

Economic Development Department I ANNUAL REPORT 2015 / 2016160
PART E – Financial InformationEconomic Development Department Vote 25
ANNEXURE 1BSTATEMENT OF TRANSFERS/SUBSIDIES TO PUBLIC CORPORATIONS AND PRIVATE ENTERPRISES
TRANSFER ALLOCATION EXPENDITURE 2014/15
NAME OF PUBLIC CORPORATION/PRIVATE ENTERPRISE
Adjusted appropriation
Act
Roll Overs
Adjustments Total Available
Actual Transfer
% of Available
funds transferred
Capital Current Appropriation Act
R’000 R’000 R’000 R’000 R’000 % R’000 R’000 R’000
Public corporationsINDUSTRIAL DEV CORP-SA LTD:SEFA 406 397 - - 406 397 406 397
100.0% - - 268 845
INDUSTRIAL DEV CORP-SA LTD 5 000 - - 5 000 5 000
100.0% - - -
TOTAL 411 397 - - 411 397 411 397 100.0% - - 268 845

Economic Development Department I ANNUAL REPORT 2015 / 2016 161
PART E – Financial InformationEconomic Development Department Vote 25
ANNEXURE 1CSTATEMENT OF TRANSFERS TO NON-PROFIT INSTITUTIONS
TRANSFER ALLOCATION EXPENDITURE 2014/15
NON-PROFIT INSTITUTIONS
Adjusted appropriation
Act
Roll Overs Adjustments Total Available
Actual Transfer
% of Available funds
transferred
Appropriation Act
R’000 R’000 R’000 R’000 R’000 % R’000 Transfers Mitchell’s Plain Skills Centre - - - - -
60
Total - - - - - 60
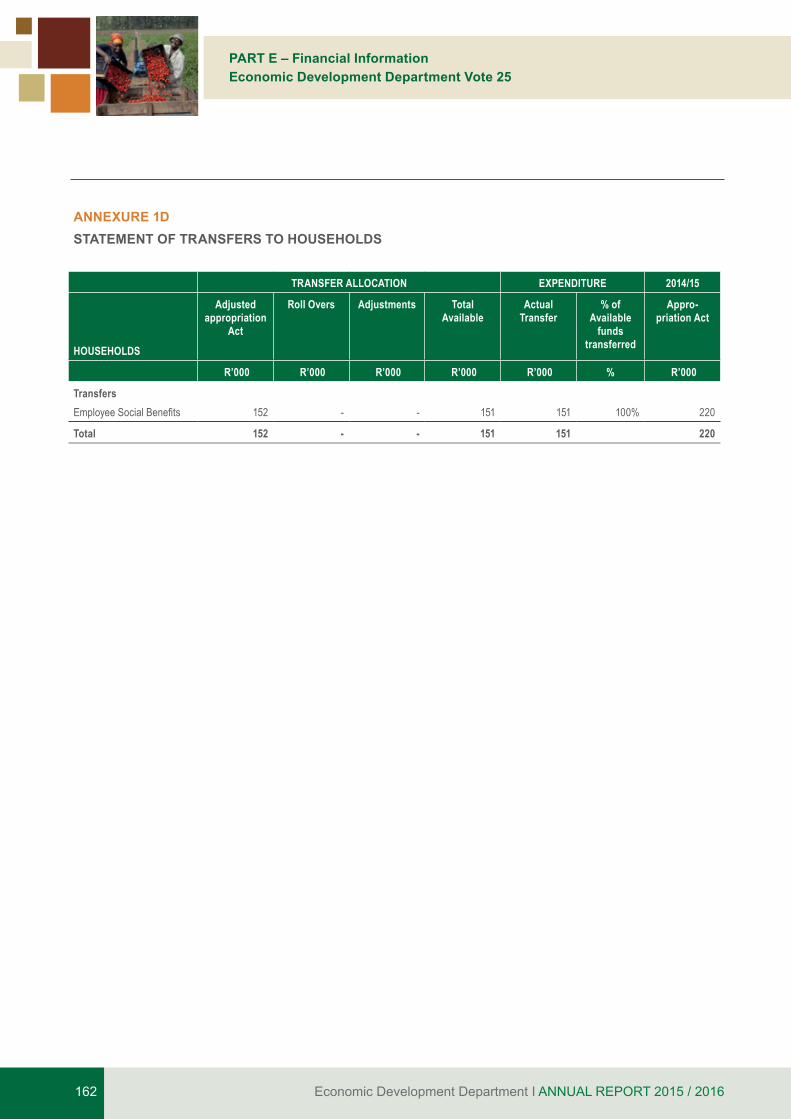
Economic Development Department I ANNUAL REPORT 2015 / 2016162
PART E – Financial InformationEconomic Development Department Vote 25
ANNEXURE 1DSTATEMENT OF TRANSFERS TO HOUSEHOLDS
TRANSFER ALLOCATION EXPENDITURE 2014/15
HOUSEHOLDS
Adjusted appropriation
Act
Roll Overs Adjustments Total Available
Actual Transfer
% of Available
funds transferred
Appro-priation Act
R’000 R’000 R’000 R’000 R’000 % R’000
Transfers Employee Social Benefits 152 - - 151 151 100% 220
Total 152 - - 151 151 220

Economic Development Department I ANNUAL REPORT 2015 / 2016 163
PART E – Financial InformationEconomic Development Department Vote 25
ANNEXURE 1ESTATEMENT OF GIFTS, DONATIONS AND SPONSORSHIPS RECEIVED
2015/16 2014/15
NAME OF ORGANISATION NATURE OF GIFT, DONATION OR SPONSORSHIP R’000 R’000
Received in cashTsogo Sun Donation received for the budget vote guests 80
SACTWU Donation received for the budget vote guests 20
Subtotal 100 -
Received in kindReceived in kind - 2015/2016
CCB (China Construction Bank) Flask and Mugs
EMPS (Employers Mutual Protection Services) Note Pad and Pen
PWC (Price Water Coopers) 7 Diaries and 6 Calenders
Konica Minolta South Africa 5 Calendars
TWF (Travel With Flair) 100 Calenders
Subtotal - -
TOTAL 100 -
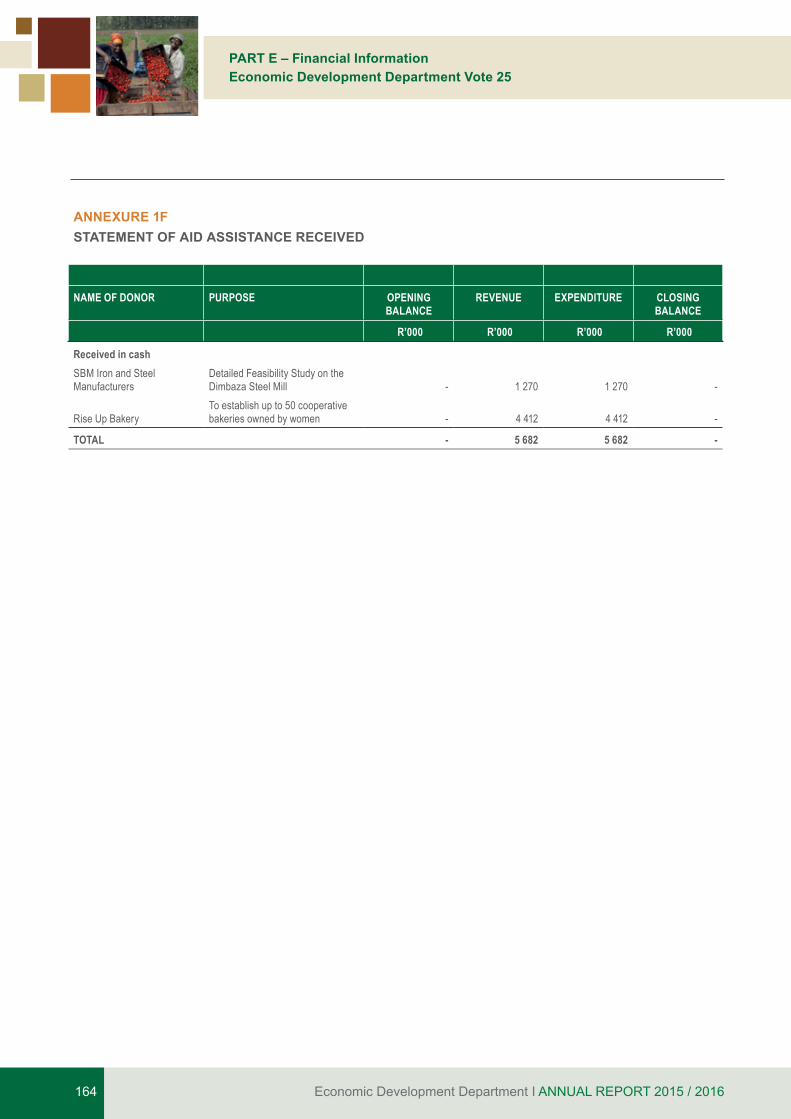
Economic Development Department I ANNUAL REPORT 2015 / 2016164
PART E – Financial InformationEconomic Development Department Vote 25
ANNEXURE 1FSTATEMENT OF AID ASSISTANCE RECEIVED
NAME OF DONOR PURPOSE OPENING BALANCE
REVENUE EXPENDITURE CLOSING BALANCE
R’000 R’000 R’000 R’000
Received in cashSBM Iron and Steel Manufacturers
Detailed Feasibility Study on the Dimbaza Steel Mill - 1 270 1 270 -
Rise Up BakeryTo establish up to 50 cooperative bakeries owned by women - 4 412 4 412 -
TOTAL - 5 682 5 682 -
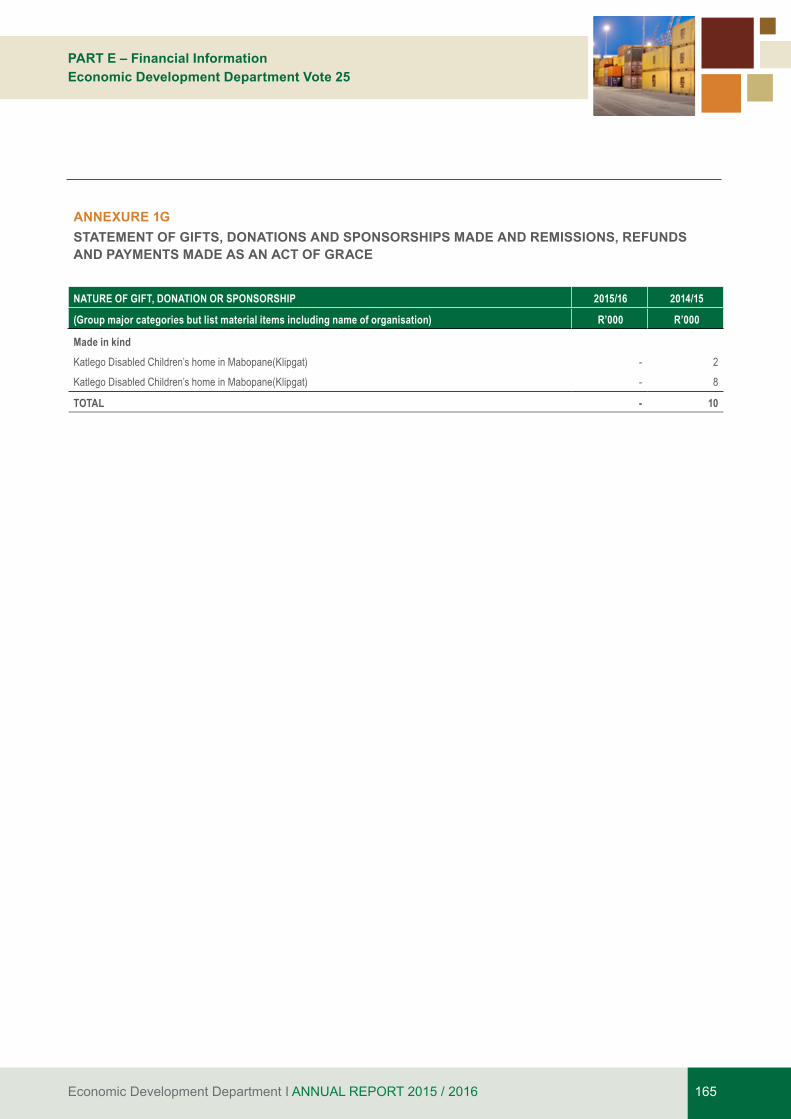
Economic Development Department I ANNUAL REPORT 2015 / 2016 165
PART E – Financial InformationEconomic Development Department Vote 25
ANNEXURE 1GSTATEMENT OF GIFTS, DONATIONS AND SPONSORSHIPS MADE AND REMISSIONS, REFUNDS AND PAYMENTS MADE AS AN ACT OF GRACE
NATURE OF GIFT, DONATION OR SPONSORSHIP 2015/16 2014/15
(Group major categories but list material items including name of organisation) R’000 R’000
Made in kindKatlego Disabled Children’s home in Mabopane(Klipgat) - 2
Katlego Disabled Children’s home in Mabopane(Klipgat) - 8
TOTAL - 10
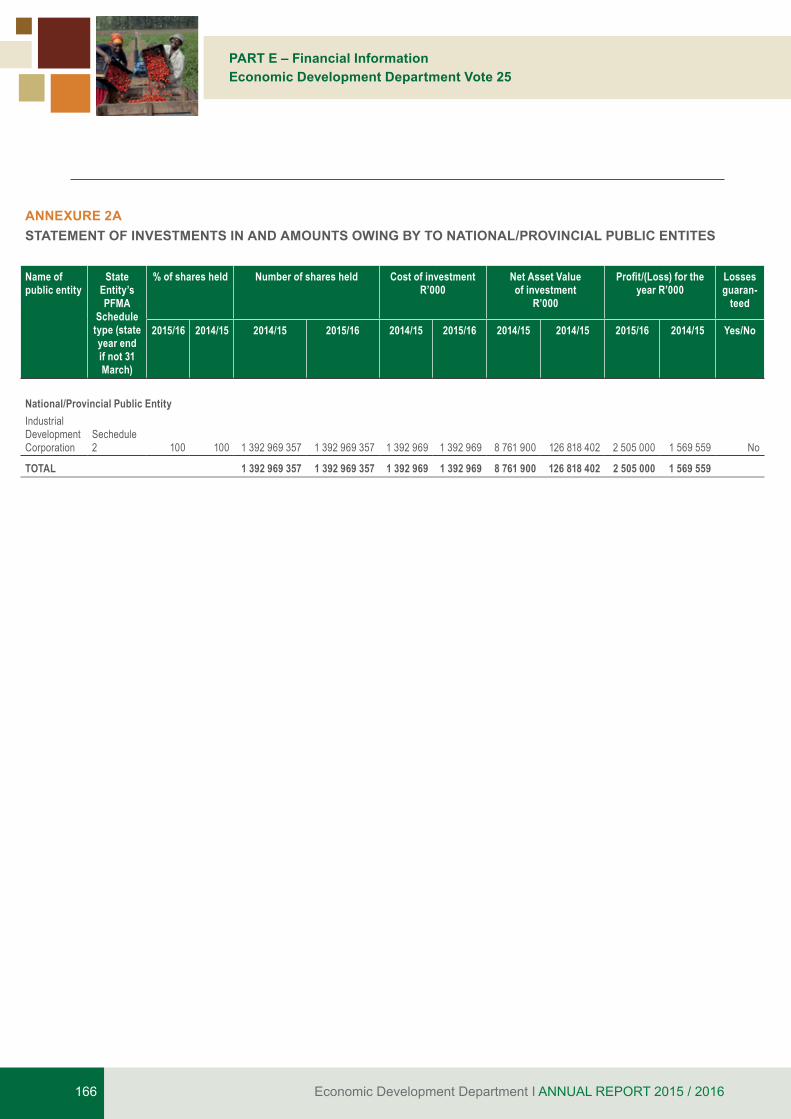
Economic Development Department I ANNUAL REPORT 2015 / 2016166
PART E – Financial InformationEconomic Development Department Vote 25
ANNEXURE 2ASTATEMENT OF INVESTMENTS IN AND AMOUNTS OWING BY TO NATIONAL/PROVINCIAL PUBLIC ENTITES
Name of public entity
State Entity’s PFMA
Schedule type (state year end if not 31 March)
% of shares held Number of shares held Cost of investment R’000
Net Asset Value of investment
R’000
Profit/(Loss) for the year R’000
Losses guaran-
teed
2015/16 2014/15 2014/15 2015/16 2014/15 2015/16 2014/15 2014/15 2015/16 2014/15 Yes/No
National/Provincial Public EntityIndustrial Development Corporation
Sechedule 2 100 100 1 392 969 357 1 392 969 357 1 392 969 1 392 969 8 761 900 126 818 402 2 505 000 1 569 559 No
TOTAL 1 392 969 357 1 392 969 357 1 392 969 1 392 969 8 761 900 126 818 402 2 505 000 1 569 559
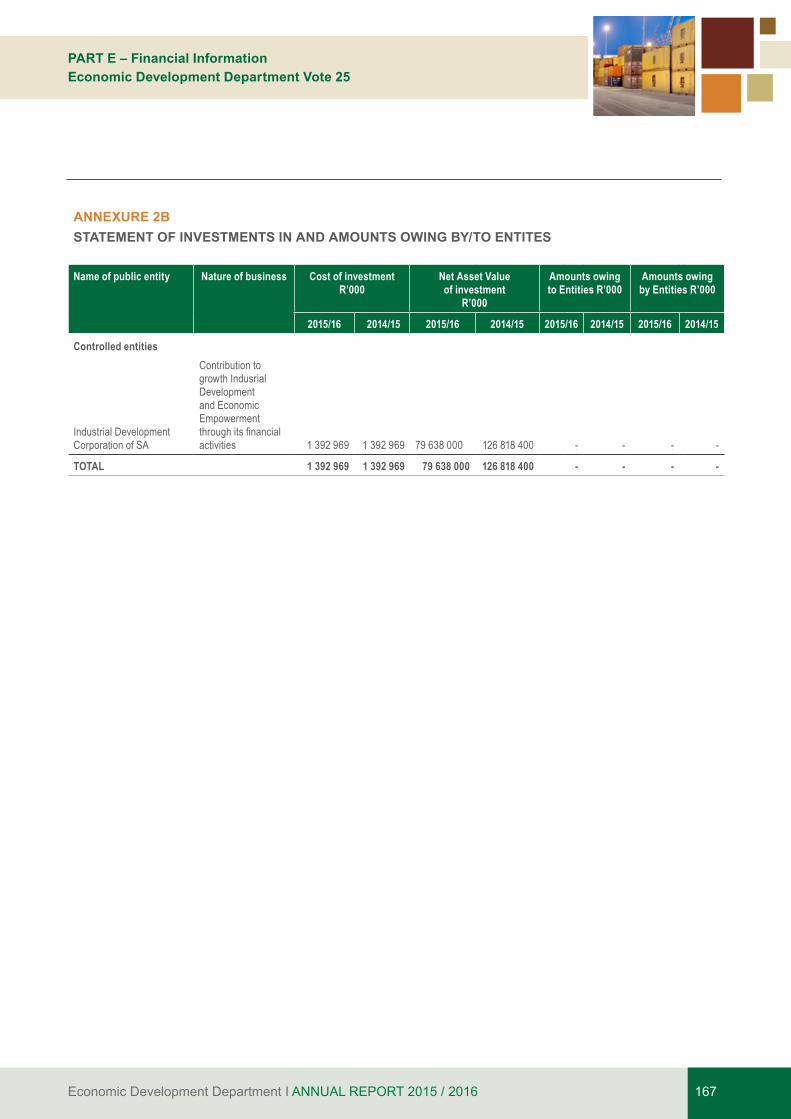
Economic Development Department I ANNUAL REPORT 2015 / 2016 167
PART E – Financial InformationEconomic Development Department Vote 25
ANNEXURE 2ASTATEMENT OF INVESTMENTS IN AND AMOUNTS OWING BY TO NATIONAL/PROVINCIAL PUBLIC ENTITES
Name of public entity
State Entity’s PFMA
Schedule type (state year end if not 31 March)
% of shares held Number of shares held Cost of investment R’000
Net Asset Value of investment
R’000
Profit/(Loss) for the year R’000
Losses guaran-
teed
2015/16 2014/15 2014/15 2015/16 2014/15 2015/16 2014/15 2014/15 2015/16 2014/15 Yes/No
National/Provincial Public EntityIndustrial Development Corporation
Sechedule 2 100 100 1 392 969 357 1 392 969 357 1 392 969 1 392 969 8 761 900 126 818 402 2 505 000 1 569 559 No
TOTAL 1 392 969 357 1 392 969 357 1 392 969 1 392 969 8 761 900 126 818 402 2 505 000 1 569 559
ANNEXURE 2BSTATEMENT OF INVESTMENTS IN AND AMOUNTS OWING BY/TO ENTITES
Name of public entity Nature of business Cost of investment R’000
Net Asset Value of investment
R’000
Amounts owing to Entities R’000
Amounts owing by Entities R’000
2015/16 2014/15 2015/16 2014/15 2015/16 2014/15 2015/16 2014/15
Controlled entities
Industrial Development Corporation of SA
Contribution to growth Indusrial Development and Economic Empowerment through its financial activities 1 392 969 1 392 969 79 638 000 126 818 400 - - - -
TOTAL 1 392 969 1 392 969 79 638 000 126 818 400 - - - -
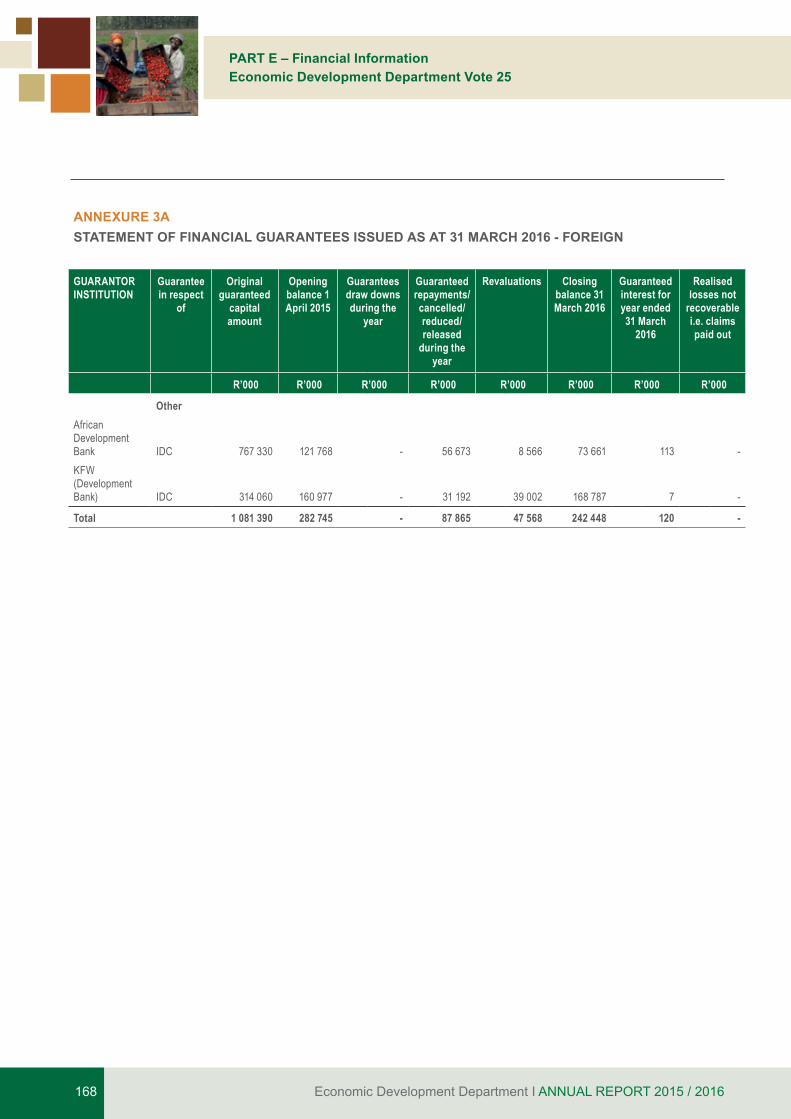
Economic Development Department I ANNUAL REPORT 2015 / 2016168
PART E – Financial InformationEconomic Development Department Vote 25
ANNEXURE 3ASTATEMENT OF FINANCIAL GUARANTEES ISSUED AS AT 31 MARCH 2016 - FOREIGN
GUARANTOR INSTITUTION
Guarantee in respect
of
Original guaranteed
capital amount
Opening balance 1 April 2015
Guarantees draw downs during the
year
Guaranteed repayments/ cancelled/ reduced/ released
during the year
Revaluations Closing balance 31 March 2016
Guaranteed interest for year ended 31 March
2016
Realised losses not
recoverable i.e. claims paid out
R’000 R’000 R’000 R’000 R’000 R’000 R’000 R’000
OtherAfrican Development Bank IDC 767 330 121 768 - 56 673 8 566 73 661 113 - KFW (Development Bank) IDC 314 060 160 977 - 31 192 39 002 168 787 7 -
Total 1 081 390 282 745 - 87 865 47 568 242 448 120 -
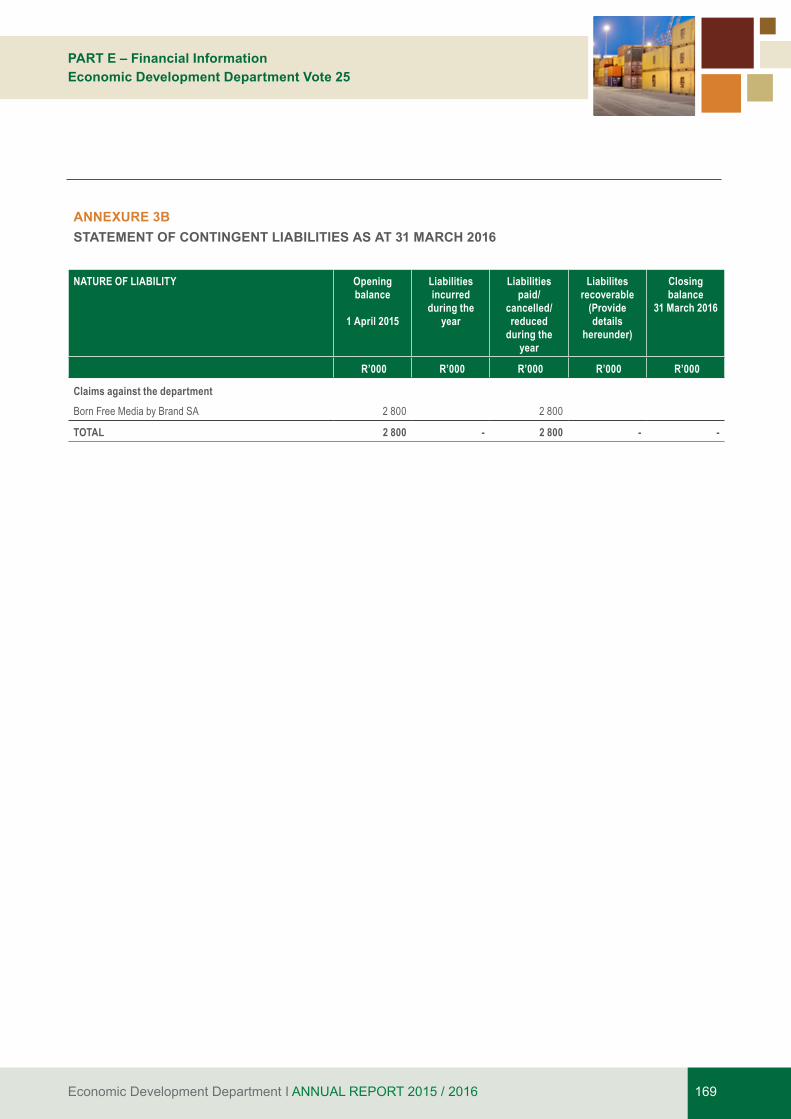
Economic Development Department I ANNUAL REPORT 2015 / 2016 169
PART E – Financial InformationEconomic Development Department Vote 25
ANNEXURE 3BSTATEMENT OF CONTINGENT LIABILITIES AS AT 31 MARCH 2016
NATURE OF LIABILITY Opening balance
1 April 2015
Liabilities incurred
during the year
Liabilities paid/
cancelled/ reduced
during the year
Liabilites recoverable
(Provide details
hereunder)
Closing balance
31 March 2016
R’000 R’000 R’000 R’000 R’000
Claims against the departmentBorn Free Media by Brand SA 2 800 2 800
TOTAL 2 800 - 2 800 - -
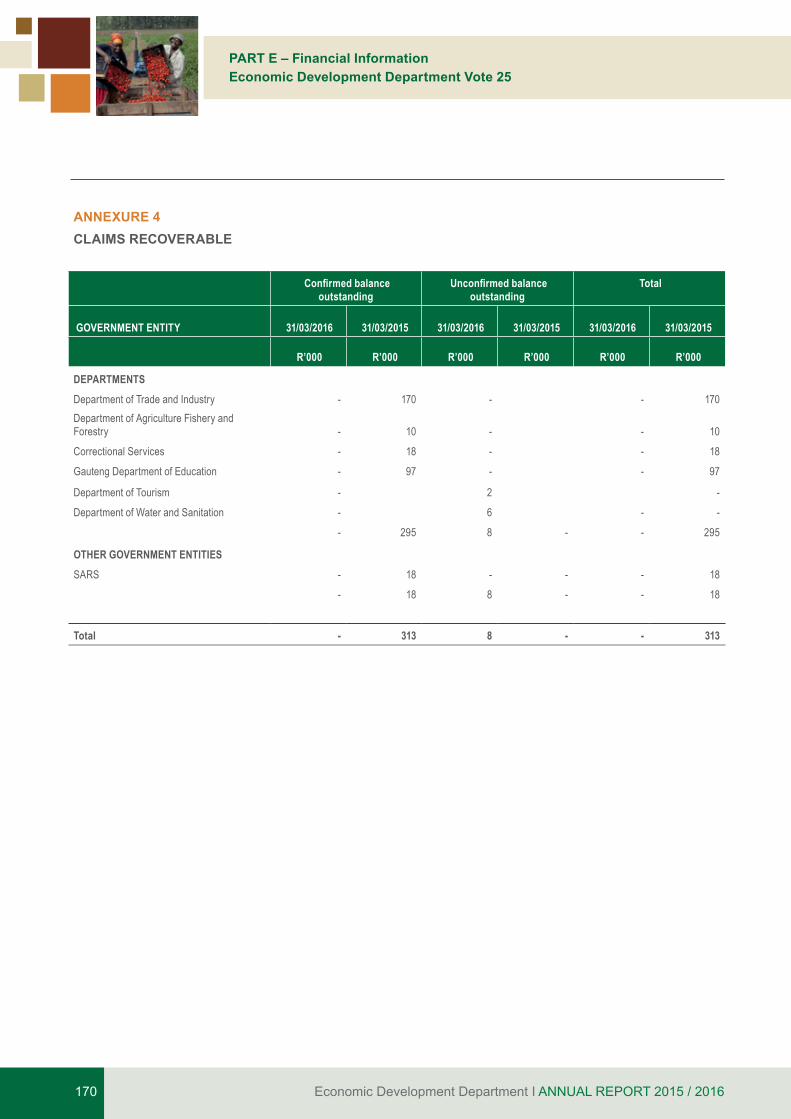
Economic Development Department I ANNUAL REPORT 2015 / 2016170
PART E – Financial InformationEconomic Development Department Vote 25
ANNEXURE 4CLAIMS RECOVERABLE
Confirmed balance
outstanding Unconfirmed balance
outstanding Total
GOVERNMENT ENTITY 31/03/2016 31/03/2015 31/03/2016 31/03/2015 31/03/2016 31/03/2015
R’000 R’000 R’000 R’000 R’000 R’000
DEPARTMENTSDepartment of Trade and Industry - 170 - - 170 Department of Agriculture Fishery and Forestry - 10 - - 10
Correctional Services - 18 - - 18
Gauteng Department of Education - 97 - - 97
Department of Tourism - 2 -
Department of Water and Sanitation - 6 - -
- 295 8 - - 295
OTHER GOVERNMENT ENTITIESSARS - 18 - - - 18
- 18 8 - - 18
Total - 313 8 - - 313
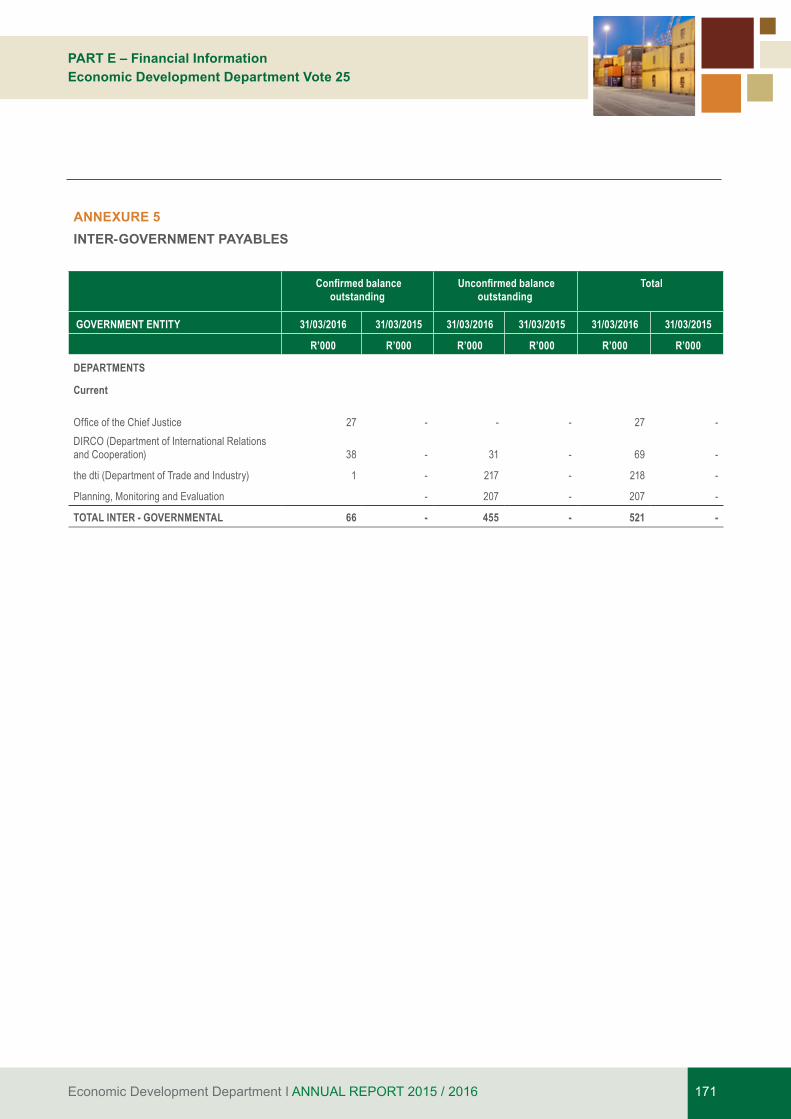
Economic Development Department I ANNUAL REPORT 2015 / 2016 171
PART E – Financial InformationEconomic Development Department Vote 25
ANNEXURE 5INTER-GOVERNMENT PAYABLES
Confirmed balance
outstanding Unconfirmed balance
outstanding Total
GOVERNMENT ENTITY 31/03/2016 31/03/2015 31/03/2016 31/03/2015 31/03/2016 31/03/2015
R’000 R’000 R’000 R’000 R’000 R’000
DEPARTMENTS
Current
Office of the Chief Justice 27 - - -
27
- DIRCO (Department of International Relations and Cooperation) 38 - 31 - 69 -
the dti (Department of Trade and Industry) 1 - 217 - 218 -
Planning, Monitoring and Evaluation - 207 - 207 -
TOTAL INTER - GOVERNMENTAL 66 - 455 - 521 -
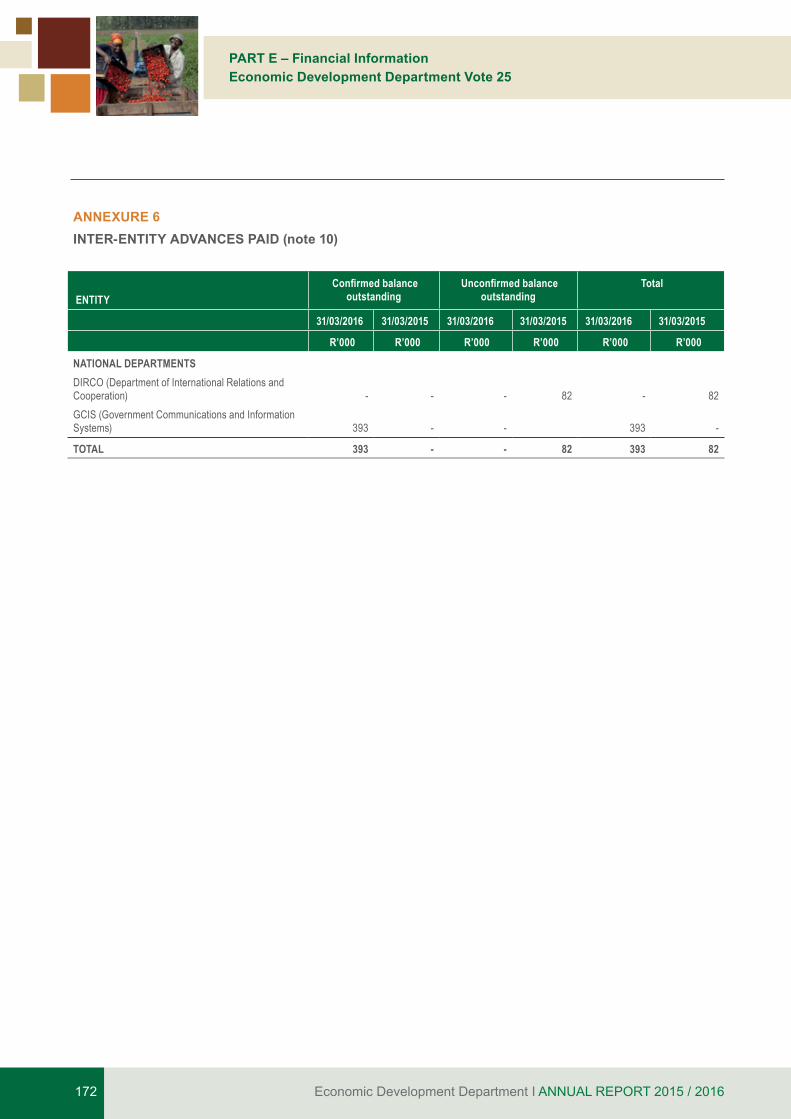
Economic Development Department I ANNUAL REPORT 2015 / 2016172
PART E – Financial InformationEconomic Development Department Vote 25
ANNEXURE 6 INTER-ENTITY ADVANCES PAID (note 10)
ENTITY Confirmed balance
outstanding Unconfirmed balance
outstanding Total
31/03/2016 31/03/2015 31/03/2016 31/03/2015 31/03/2016 31/03/2015
R’000 R’000 R’000 R’000 R’000 R’000
NATIONAL DEPARTMENTSDIRCO (Department of International Relations and Cooperation) - - - 82 - 82 GCIS (Government Communications and Information Systems) 393 - -
393
-
TOTAL 393 - - 82 393 82
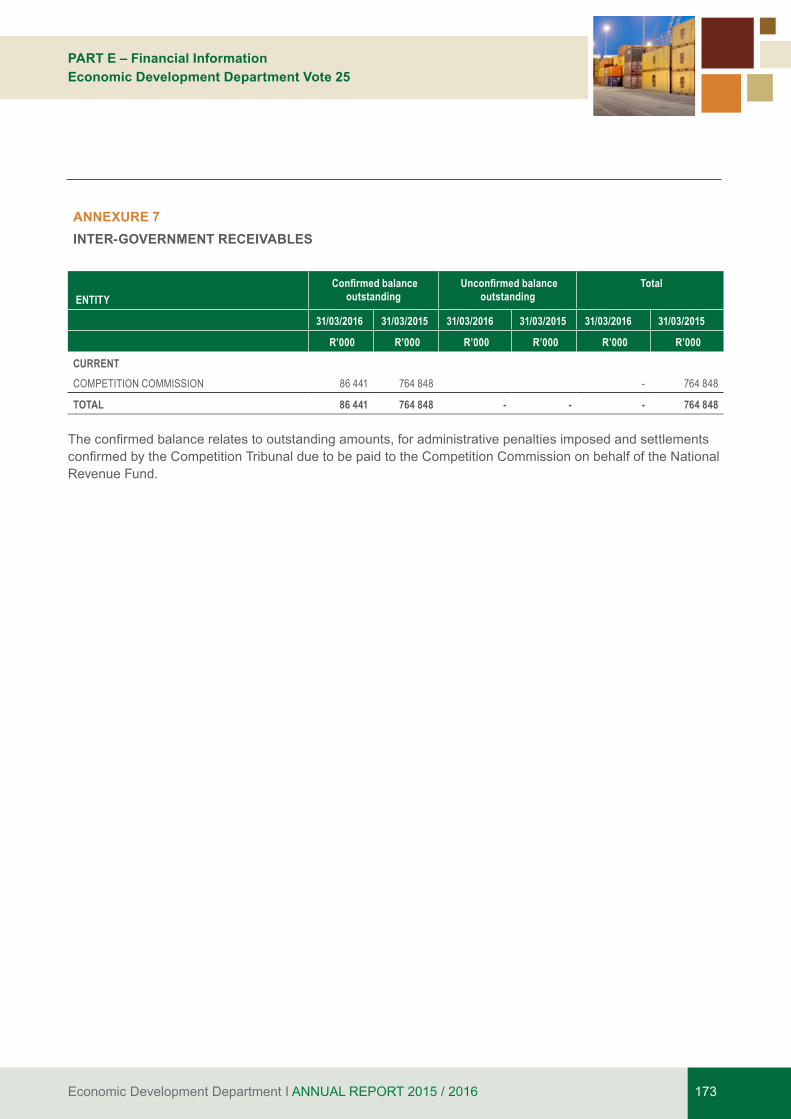
Economic Development Department I ANNUAL REPORT 2015 / 2016 173
PART E – Financial InformationEconomic Development Department Vote 25
ANNEXURE 7 INTER-GOVERNMENT RECEIVABLES
ENTITY Confirmed balance
outstanding Unconfirmed balance
outstanding Total
31/03/2016 31/03/2015 31/03/2016 31/03/2015 31/03/2016 31/03/2015
R’000 R’000 R’000 R’000 R’000 R’000
CURRENTCOMPETITION COMMISSION 86 441 764 848 - 764 848
TOTAL 86 441 764 848 - - - 764 848
Theconfirmedbalancerelatestooutstandingamounts,foradministrativepenaltiesimposedandsettlementsconfirmedbytheCompetitionTribunalduetobepaidtotheCompetitionCommissiononbehalfoftheNationalRevenue Fund.
174 Economic Development Department I ANNUAL REPORT 2015 / 2016
NOTES
Economic Development Department I ANNUAL REPORT 2015 / 2016 175
NOTES

176 Economic Development Department I ANNUAL REPORT 2015 / 2016
NOTES

RP294/2016ISBN: 978-0-621-44879-5
PRETORIAPrivate Bag X149, Pretoria, 00013rd Floor, Block A, the dti Campus77 Meintjies Street, Sunnyside, PretoriaTel: 012 394 3747Fax: 012 394 0255
CAPE TOWNPrivate Bag X9047, Cape Town, 80001st Floor, 120 Plein Street, Cape Town, 8001Tel: 021 466 9800/1Fax: 021 461 0428
RP294/2016ISBN: 978-0-621-44879-5Economic Development Department (EDD)Annual Report for 2015/2016