Economic Crises and the European Revolutions of 1848 · Economic Crises and the European...
51
Economic Crises and the European Revolutions of 1848 * Helge Berger a Mark Spoerer b Final version: October 2000 * The paper has benefited greatly from discussions at the 1848 conference in Offenburg, seminars at the Universitat Pompeu Fabra, Barcelona, the Center for Comparative History of Europe, Berlin, and the EHA Meeting 1998 in Durham, N.C. Rolf Dumke, Timothy Guinnane, Bertrand Roehner, Richard Tilly, Eugene White, and especially Sheilagh Ogilvie provided very helpful comments and suggestions. We would also like to thank Jonas Ljung- berg, Lars Svensson, Jan Luiten van Zanden, and other members of the discussion group eh.res for providing useful references and data. Michael Kopsidis was kind enough to provide data on Prussian grain prices compiled from archival sources. Additional comments by the editor Jan de Vries and a referee considerably improved the paper.
Transcript of Economic Crises and the European Revolutions of 1848 · Economic Crises and the European...
Economic Crises and the
European Revolutions of 1848*
Helge Bergera
Mark Spoererb
Final version: October 2000
* The paper has benefited greatly from discussions at the 1848 conference in Offenburg,
seminars at the Universitat Pompeu Fabra, Barcelona, the Center for Comparative History of
Europe, Berlin, and the EHA Meeting 1998 in Durham, N.C. Rolf Dumke, Timothy
Guinnane, Bertrand Roehner, Richard Tilly, Eugene White, and especially Sheilagh Ogilvie
provided very helpful comments and suggestions. We would also like to thank Jonas Ljung-
berg, Lars Svensson, Jan Luiten van Zanden, and other members of the discussion group
eh.res for providing useful references and data. Michael Kopsidis was kind enough to provide
data on Prussian grain prices compiled from archival sources. Additional comments by the
editor Jan de Vries and a referee considerably improved the paper.

1
Economic Crises and the European Revolutions of 1848
Abstract
Recent historical research tends to view the 1848 revolution in Europe as caused
by a surge of new liberal ideas and by long-term socioeconomic problems.
However, many contemporary observers interpreted much of what was going on
as a consequence of the serious shortfall in food supply that had shaken large parts
of the continent in 1845-47, and the subsequent economic slump, i.e. short-term
causes. Applying standard quantitative methods to a dataset of 27 European
countries, we show that it was mainly economic misery and the fear thereof that
triggered the European revolutions of 1847/48.
JEL: N13
Keywords: revolution, economic crisis, political institutions, hunger, grain prices, industrial
production
a CES, University of Munich, and CESifo
b University of Hohenheim, Stuttgart.
Corresponding author:
Helge Berger, CES, Schackstrasse 4, 80539 Munich, Germany, e-mail: [email protected]
muenchen.de

2
Introduction
In the 1990s, the acceleration of economic and political integration in Western Europe and the
democratization of Eastern Europe led to an increasing interest in the turbulent years of
1848/49, when large parts of the continent experienced a striving for political participation
and self-determination.1 The recent anniversary year gave rise to a wealth of literature,
especially in countries for which the revolution of 1848 meant a first step towards more
democratic political institutions, for instance in countries such as Germany, Austria, Hungary,
or Romania. Many of these studies reflect the trend in historiography from social history to
cultural history. Whereas in the 1970s and 1980s long-term and short-term socioeconomic
determinants played a pivotal role in explaining the 1848 revolutions, short-term economic
factors tend to be marginalized in recent publications. To be sure, even after the culturalistic
turn most historians concede that long-term structural socioeconomic problems contributed to
rising popular discontent, but surprisingly few authors stress the importance of the deep
economic crisis that immediately preceded the revolutionary events. Instead, many attribute
much of the revolutionary activity to the spread of liberal and democratic ideas among
Europeans. This is true for a number of monographs, which mention short-run economic
factors not at all or only in passing, as well as for many edited volumes, which often do not
contain a single paper on the economic crisis preceding the events of 1848.2 To some extent
1 See, e.g., Kaelble, "Viele nationale Revolutionen".
2 We systematically checked monographs and paper collections covering the 1848 revolution
on a national level in English, German, and Latin languages published since the mid 1990s for
discussions of short-term socioeconomic developments such as the increase of food prices
1845-47 or the economic downturn 1846-48 preceding the 1848 turmoils. Höbelt, 1848, and

3
this is also true for an alternative view that points towards the inflexible and increasingly
outdated political institutions of the time, which were ill suited to cope with the societal
problems of early industrialization. Issues at stake were the material deprivation of large parts
of the rural population (pauperism) and state intervention in individual affairs, for instance,
through the military draft system and discretionary taxation.3
Bruckmüller and Häusler, 1848, who analyze the revolution in Austria, do not discuss
economic factors at all. Neither do Schroeder, Transformation, or Broers, Europe, or the
contributions on Hungary in Fischer, Ungarische Revolution. In the account of Judson, Wien,
of the revolution in Austria socioeconomic factors are rarely mentioned. For Switzerland, the
contributions in Hildbrand and Tanner, Zeichen, do not refer to economic factors. Some of the
work on Switzerland collected in Ernst, Tanner, and Weishaupt, Revolution, does mention
economic factors, but economic factors are not found causal for the revolution. Even in the
abundant German anniversary literature the economic crisis is almost totally neglected. See
Dipper and Speck, 1848, Dowe, Haupt, and Langewiesche, Europa 1848, Gall, 1848,
Hardtwig, Revolution, Jansen and Mergel, Revolution, Lill, Revolution, Mommsen,
Ungewollte Revolution, Rill, 1848, Timmermann, 1848, and Langewiesche, Revolutionen.
Notable exceptions are Sperber, European Revolutions, Hahn, "Sozioökonomische Ordnung",
Hein, Revolution, Lévêque, Ébranlement, and Stürmer, Crise. In contrast, earlier accounts of
the 1848 revolutions analyzed long and short-term socioeconomic factors in great detail, see,
e.g., Stearns, Revolutions, pp. 11-35, Charles, Louise, and Richard Tilly, Rebellious Century,
Siemann, Deutsche Revolution, Pinkney, Decisive Years, Wehler, Deutsche
Gesellschaftsgeschichte, pp. 681f., and Price, Revolutions, pp. 7, 24-26.
3 For an overview, see Sperber, European Revolutions, pp. 47-49.

4
However, while ideas and institutions undoubtedly contribute to our understanding of the
necessary preconditions for the European revolutions of 1848, they fail to explain the timing,
simultaneity, or regional distribution of the events. Here a more economic perspective might
be helpful. Many contemporary observers interpreted much of what was going on as a direct
consequence of the serious shortfall in basic food supplies that had shaken the continent in
1845-47 and triggered famine and hunger riots throughout Europe, especially in Ireland,
Flanders, and Silesia.4 A radical variant of this argument interprets the revolutions of 1848 in
the broader context of class conflicts – a view championed by Karl Marx and Friedrich Engels
and later refined by Jürgen Kuczynski.5 However, this materialistic view is by no means
confined to Marxist historiography. Another early example is Ernst Engel, the well-known
nineteenth-century Prussian statistician, who maintained that the economic crisis was what
”triggered the bomb” in many parts of Europe.6 This strong emphasis on economic factors is
also reflected in one strand of the Anglo-Saxon literature, ranging from W.W. Rostow, Eric
Hobsbawm, and George Rudé to Charles, Louise, and Richard Tilly.7 It is supported by a
number of empirical studies of social disorder in the 1840s, which stress the importance of
economic motives.8 For France, Ernest Labrousse explicitly linked the revolutions of 1789,
4 Sigmann, 1848, pp. 183-85.
5 Kuczynski, "Wirtschaftliche und soziale Voraussetzungen."
6 Engel, "Getreidepreise," p. 251 (our translation).
7 Rostow, British Economy, Hobsbawm, "Economic Fluctuations", Rudé, "Why was there no
Revolution", Charles, Louise, and Richard Tilly, Rebellious Century, Richard Tilly,
Zollverein. Also see Stearns, Revolutions, pp. 32-35, Price, Revolutions, pp. 17-22, and
Sperber, European Revolutions, pp. 105-07.
8 See, e.g., R. Tilly, "Popular Disorders," pp. 11-20, Bergmann, "Ökonomische

5
1830, and 1848 with changes in agricultural output and prices.9 However, the disillusion with
empirical social history and the subsequent ascendancy of cultural history has led to a curious
neglect of the short-term economic crises of 1845-48.
By contrast, our findings suggest that it is precisely the analysis of the pre-revolutionary
economic crises that is most helpful in explaining the timing, simultaneity, and regional
distribution of the European turmoil of 1848. In other words, even though ideas and
institutions undoubtedly shaped the events of the late 1840s, it was economic misery and the
fear thereof that triggered the European revolutions. This resurrection of the economic view of
the 1848 revolutions is based on the high correlation between the geographic distribution of
economic distress and political turbulence across Europe. In fact, after identifying the
countries that were hit by a significant food supply shock in 1845-47 and discussing evidence
of a propagation mechanism that prolonged the crisis well into 1848, we find that there is an
almost perfect geographical match between economic crises and revolutionary activities
throughout Europe. We also show that institutions, namely the existence or absence of a
repressive political regime, while adding little to the explanation of the occurrence of
revolutionary activity, had a significant influence on the form such activity took. Revolutions
tended to be more violent if the regime was repressive.
The paper proceeds as follows. Section 2 investigates the size and significance of the grain
price shock which hit most European countries in the second half of the 1840s. To grasp the
extent to which these shocks were indeed unexpected, we estimate the forecast errors of
standard adaptive expectations models for a dataset encompassing wheat prices for 27
countries between 1820 and 1850. It turns out that most European countries experienced a
Voraussetzungen", idem, Wirtschaftskrise, and Gailus, Straße.
9 Labrousse, "1848."

6
severe price shock in 1847. Section 3 explores the propagation mechanism that extended the
crisis well into 1848. We find evidence that falling consumption and investment demand
transformed the negative supply shock in the agricultural sector into a lagged demand shock in
manufacturing. Section 4 constructs the last building block of our argument by drawing a
connection between political activity and its possible economic causes. Section 5 concludes.
The Supply Shock in the Agricultural Sector, 1845-47
The resurrection of the economic view of the 1848 revolutions relies heavily on the
occurrence of a pre-revolutionary economic crisis across Europe. But what defines an
economic crisis? What sort of crisis will trigger political activity by individuals? And which
individuals?
A possible starting point is the concept of a revolution. With respect to the revolutions of
1848, two characteristics stand out among the many definitions available: (i) the use of
violence, or the credible threat of using it as a means to change the political system, and (ii)
collective action, that is, active involvement of “the crowd” in that attempted political
change.10 In the following, we will define a revolution either as widespread violence targeted
at changing the political system or as immediate and substantial constitutional reform
implemented to prevent imminent collective action or violence to that end. The potential or
actual involvement of a large number of individuals has important consequences for our
10 Kimmel, Revolution, pp. 4-7, and Goldstone, Revolution, pp. 7-12. We follow the broader
definitions of Kimmel which do not require that a revolution necessarily be successful. This
broad definition is similar to the notion of revolution in Ch. Tilly, "Revolutions," pp. 519-24
and what he defined later as a “revolutionary situation”, Ch. Tilly, European Revolutions, p.
10.

7
question here. Obviously, our understanding of why a revolution did or did not take place
should not be based solely on an analysis of elites and their economic situation. While
lawyers, publishers, journalists, doctors, and academics were undoubtedly important
protagonists during the 1848 upheavals across Europe, they would not have been able to act
revolutionarily on their own. It was the lower classes who “provided the muscle”. As a
consequence, our focus shifts from the well-known revolutionary protagonists to the average
man or woman, especially in the capitals, where revolutionary activities were most
pronounced.11
A causal nexus between the economic situation of the ordinary population and possible
participation in revolutionary activities requires there to have been a severe popular fear of a
deteriorating socioeconomic situation. Siegenthaler has explained why and how economic
discontent beyond a certain threshold tends to trigger political action.12 Under the conditions
of the restoration, i.e. the absence of effective democratic institutions, this was likely to take
the form of revolutionary activity in the above defined sense. The question is how to measure
both discontent and threshold.
Clearly, the economic view suggests a microeconomic approach. Households feel the ups and
downs of macroeconomic activity through changes in their real budgets. While this is as true
today as it was during the first half of the nineteenth century, the channels through which an
economic crisis would influence the family budget were different then. On the expenditure
side, lower-class households around 1850 still spent between two thirds and three quarters of
their incomes on nourishment.13 The bulk of the food purchased consisted of grain products
11 Labrousse, "1848," p. 77. Quote from Stearns, Revolutions, p. 12.
12 Siegenthaler, Regelvertrauen, pp. 157-164.
13 Phelps Brown and Hopkins, "Seven centuries," p. 297: England 1790 81 per cent, 1904-13

8
and potatoes, which rendered household budgets very sensitive to changes in the prices of
these goods. This sensitivity was greater the smaller the overall size of the budget, as low-
income households tend to allocate even larger portions of their budgets to food-related
expenditures (Engel’s Law).14 In addition, the ability of households to avoid any squeeze on
their budgets by substituting between different types of grain was limited. For the period
1816-50, the literature on Prussia reports correlation coefficients of 0.87 for wheat and rye
prices and 0.67 for wheat and potato prices.15 This high integration of local grain markets in
this period is illustrated by Figure 1. It plots bimonthly percentage changes in wheat prices
over the previous year against a similar series for rye prices between 1820 and 1850 for the
Prussian district of Arnsberg.
Figure 1 about here
In principle, data on grain prices should allow us to obtain an idea of the time path of
household expenditures prior to 1848. Getting a grip on the possible determinants of the
revenue side of household budgets is somewhat more difficult. On the one hand, it is well
78 per cent; Maddalena, Prezzi, p. 330: all households in Milan 1847 63 per cent; Abel,
Agrarkrisen, p. 245: Berlin 1800 73 per cent; Saalfeld, Lebensverhältnisse, pp. 236-39:
Prussian rural workers 1847 59 per cent, urban workers 1837 and 1847 67 per cent. Rural
workers will have produced more food on their own than urban workers.
14 According to Drame et al., Siècle, p. 20, the price elasticity of demand for wheat hovered
around 0.6 throughout nineteenth-century France.
15 See Bass, Hungerkrisen, p. 62. Similar results for Cologne 1818-50 are reported by Ebeling
and Irsigler, "Entwicklung," p. 306.

9
known that nominal industrial wages were fairly stable in the first half of the century.16 To the
extent that this is a valid stylized fact, the easily accessible data on grain prices would also
provide us with data on real wages and, thus, the purchasing power of fully employed
dependent workers. On the other hand, there is hardly any reliable information on effective
working hours or un(der)employment, which makes it almost impossible to compute a
meaningful income series.17 A feasible solution for non-agricultural employment is to turn to
Okun’s Law and try to draw inferences about employment from the overall level of industrial
activity.18 We have good reason to believe that this “law” was also valid for the nineteenth
century (in fact, more so than today), and data on industrial production, at least on a sectoral
level, are available for a number of countries.
Summing up, it seems possible to put together a sufficiently accurate picture of the
economic well-being of households prior to the political turmoil which shook Europe around
1848. Figure 2 takes a first step. It displays time series for grain prices for four large European
economies. With the exceptions of Oldenburg and Russia (both rye prices), all 27 series are
wheat prices. All series were transformed into grams of fine silver per hectolitre, the classical
unit in price history.19 Whenever possible, we tried to gather data for the country’s capital, the
16 See for Germany Gömmel, Realeinkommen, p. 27, and Gerhard, Löhne, for Belgium,
France, and Great Britain Mitchell, International Historical Statistics, p. 181.
17 This point has already been discussed by Hobsbawm, "Machine Breakers," p. 4.
18 See, for a similar approach to the analysis of pre-revolutionary eighteenth-century France,
Weir, "Crise économiques," p. 938.
19 See Braudel and Spooner, "Prices," p. 394. Abel, Agrarkrisen, pp. 290-95, used grams of
silver per kilogram of wheat. In the first half of the nineteenth century, nearly all European
currencies were still on silver or bimetallic standards.

10
likely center of political activity. The regional price series differ only slightly from the
national averages, however.20
Figure 2 about here
Figure 2 reveals both similarities and variations across Europe. Whereas the wheat price
patterns of France and Prussia look very similar, the English and especially the Swedish
experience look different. The English series shows the impact of the easing of the Corn Laws
in 1842 as well as their abolition in 1846. Notwithstanding these and other idiosyncrasies,
however, the series for France, Prussia, and England appear to share a number of regularities.
One of them is the price increase and thus, presumably, a decrease in living standards for the
majority of the population during the 1845-47 period. This should not come as a surprise.
There is evidence of a convergence of European grain markets by this time due to less costly
land and sea transportation.21 Figure 3 further illustrates the phenomenon by comparing the
coefficient of variation between a set of five continental European regions and Prussia since
the early 1820s.
Figure 3 about here
20 For Austria, France, Prussia, and Sweden, where both national and capital series are
available, the coefficient of correlation between both series is on average higher than 0.90 and
never smaller than 0.80. Some regional series show a somewhat larger standard deviation than
the national averages. See Appendix for details on the data.
21 See, for the impact of the Corn Laws on British wheat prices and European wheat-price
convergence, Williamson, "Impact," pp. 124-9.

11
Given its large territory and different climatic zones, Prussia can be regarded as a fairly highly
integrated economic area at this period.22 Compared with this benchmark, the prolonged
period of convergence within Europe is quite remarkable. Starting at levels four times larger,
by the 1840s the regions had reached roughly comparable levels of market integration.
But there are also discrepancies in the time paths portrayed in Figure 2 above. While in France
and Prussia the years 1845-47 are marked by a dramatic increase in grain prices, the price
movements in England and Sweden in these years do not stand out as particularly irregular.
This discrepancy may be important. Consider a household that, based on past experience,
takes the precautions necessary to insure itself against ”regular” and thus in principle
foreseeable swings in the cost of living. Clearly, as long as a price increase stays within the
expected range, we would not expect an extraordinary (or political) reaction. If, however, an
exceptional price ”shock” severely and unexpectedly diminished the real budget of a large part
of the population, such a backlash seems much more likely.
The argument lends itself to a more formal exposition. We can picture households at
any given time t as forming expectations about the cost of living in period t+1 based on an
adaptive expectations model
(1) jt
n
jjtt
et pp −
=+ ∑δ+α=
0,1
ˆˆ ,
where pe and p are expected and actual wheat (or rye) prices and the lag length n is assumed to
be constant. The time dependent parameters tt δα ˆandˆ are OLS coefficients from an
autoregressive model estimated with the present and past observations on p available at time t:
22 Fremdling and Hohorst, "Marktintegration," pp. 100f.

12
(2) tjt
n
jjt pp ε+δ+α= −−
=∑ 1
0
.
ε is a random variable following standard assumptions. That is, households update their
estimates for δα ˆandˆ in every period t to produce the best available forecast about etp 1+ , the
following period’s price level. But the forecast will not be perfect. We can then define a price
”shock”, i.e. a highly unanticipated and irregular price movement in the sense introduced
earlier, as a significant (scaled) forecast error
(3))(
111 ⋅θ
−= ++
+
ett
t
ppe ,
where θ is a scaling factor that increases in the sample length t and the (1 x n) vector of
observations on p used to forecast 1+tp , 1+tp . If we define 2/11
1''1 ])(1[ +
−++≡θ tttt pPPp ,
with tP being the (t x n) matrix of observations used to forecast p in all previous
periods (n+1,..,t), 1+te is just the standard recursive residual from equation (2).23 As
],0[~ 21 ε+ σNet , a significant deviation of the scaled forecast error from zero indicates both a
”shock” in the sense defined above and a structural break in the model.
Computing the scaled forecast errors 1+te for our set of 27 countries is a straightforward
exercise once the lag length n is determined. We set n = 5 for each country, which allows the
AR process – and, thus, the forecasters – to cover both cyclical and non-cyclical regularities in
the time series.24 The majority of the data runs from 1820 to 1850. With the exception of
23 See, e.g., Greene, Econometric Analysis, pp. 216f.
24 Business cycles in wheat prices and similar data were well known to contemporaries. They
are also quite obvious in the present data. For evidence on cycles in grain prices see, for
instance, Bauernfeind and Woitek, "Agrarian Cycles."

13
Finland, all series involved are stationary.25 Figure 4 presents the computed forecast errors and
the respective 2-standard-error bands for the four countries already selected for Figure 2.
Figure 4 about here
The interpretation of the results is fairly easy. If at any point in time the graph deviates
positively (or negatively) from zero, the actual price level of this period exceeded (or fell short
of) the (assumed) expectations of households. If a deviation is larger than two times the
standard errors of the model used to compute the forecast, we observe a significant shock.
It turns out that the results are very much in line with the discussion of the time series
displayed earlier in Figure 2. While both France and Prussia feature a significant positive price
shock in 1846-47 (as well as a corresponding negative shock as prices returned to normal in
1848), England and Sweden do not. The reason for this is that even though both countries
experienced higher prices prior to 1848, these increases stayed within the confines of the
normal ups and downs of the cost of living. This is obvious in the case of Sweden, but it is
also true for England. In England, it is only the fall in prices after the good harvest of 1847
25 Based on standard ADF tests. The price series for Baden, Hesse, Saxony, Sweden, and
Wurttemberg are only stationary around a trend. However, recalculating the AR models with
difference-filtered data or introducing a trend into the estimated model does not change the
results. The same is true for the Finnish series. Only Hesse remains a borderline case. The
complete data set (grain prices as well as computed forecast errors) for the sample is available
on request.

14
that is extraordinary enough to qualify as a shock relative to expectations – albeit a positive
one.26
Before we move on, a brief discussion of the threshold that divides price movements into
“normal” ups and downs and “shocks” is called for. Our 2-standard-error criterion is purely
statistical, i.e., it builds on the conventional notion of statistical significance. From a strictly
historical perspective this might seem somewhat arbitrary. However, the statistical criterion
does not seem an unreasonable approximation of any real-world threshold and might very well
be viewed as a benchmark for a more historical rule of thumb. For instance, simply focusing
on the number of pre-revolutionary years in which grain prices were above their average value
leads to a very similar profile of shocks across countries (see Table 3, col. (iii) below). Such a
rule does, however, ignore the role price expectations might have played for the accumulation
of buffer stocks and, ultimately, for the impact the agrarian crisis had on households. Also
note that the 2-standard-error criterion of the forecast model leads to very robust results. Any
other threshold value in an interval of ±0.18 around 2 produces the very same distribution of
pre-1848 shocks among the countries in our sample. We will return to this issue in Section 3.
From Figure 4 – and from similar figures for the other 23 countries in our sample27 – it
follows that a number of European countries did indeed suffer a significant positive shock to
their cost of living prior to the 1848 revolution. It is tempting to jump ahead and compare the
regional distribution of these findings with the occurrence of political turbulence across the
area under investigation. But there is the problem of timing. Even though there is a certain
amount of variance in the point in time at which the grain crisis hit the economies in our data
26 Ireland (for which we do not have comparable data) was a very different case. See for a
comparable approach Solar, "Great Famine," pp. 114-18.
27 All additional figures are available on request.

15
set, in virtually every case the year 1848 itself was characterized by sizable price decreases,
not increases. To some extent this might be an artifact of the frequency of the data. To see
whether this is the case, Figure 5 shows monthly wheat prices for the region around Paris and
for Berlin.
Figure 5 about here
In both cases, wheat prices were at a low level at the beginning of 1845. The price increase
which followed accelerated in mid-1845, paused briefly around the turn to 1846, and then
continued until mid-1847 when a third consecutive bad harvest was expected all over
Europe.28 Thus, what consumers experienced in both countries was far more than a short
“blip”, instead, it was a seemingly incessant price increase for two and a half years. Moreover,
although prices were falling, they were still somewhat higher in late 1847 and early 1848 than
on average during the previous grain price cycle of 1838-45.29 However, when political unrest
started to spread across Europe in early 1848, the situation as measured by the cost of living
had definitely improved in both countries. Even in Berlin, where prices were on the rise again
later in the year, the surprisingly good harvests in the autumn of 1847 helped household
expenditures to get back to their average levels during the first half of 1848.
To some extent the time lag between the peak of the food price crisis and the political
unrest is not totally unexpected. The reason is that people who face starvation are physically
weak and focus their activities on finding food. It is only after they have regained their
28 Boot, Commercial Crisis, p. 66.
29 The dominant agrarian cycle has a length of eight years, see Bauernfeind and Woitek,
"Agrarian Cycles."

16
physical forces and digested their recent crisis experience that they start to (re)act politically.30
From this perspective, the time lag between the food price peaks and the outbreak of the
revolution at the beginning of 1848 does not necessarily come as a surprise. But there is an
additional economic link between the two events.
Propagation of the Crisis to the Industrial Sector, 1847/48
In fact, one of the reasons why so many contemporary observers such as, for instance, the
economist Wilhelm Roscher, insisted on a close connection between economic crisis and
political unrest was the lagged propagation of the agricultural crisis into other sectors of the
economy.31 Most economies in mid-nineteenth-century Europe were still greatly influenced by
fluctuations in agriculture. With a majority of households earning close to the subsistence
level, price increases in the basic food sector translated into lower demand for all other goods
and, thus, for manufacturers.32 This propagation probably took place with a time lag, as some
households could turn to their savings to smooth consumption. However, it seems plausible to
presume that eventually lower household demand (the consumption channel) and, in addition,
low investment demand (the investment channel) would turn an agricultural crisis such as the
pre-1848 grain price shock into a crisis in the manufacturing sector as well.
30 Stearns, Revolutions, p. 34, see also Tocqueville, Ancien régime, p. 219.
31 Roscher, Kornhandel, pp. 61-65.
32 See for France Labrousse, "Panoramas," who relies on monthly data, and the simulations of
Lévy-Leboyer and Bourguignon, French Economy, pp. 227-31, which show a time lag of one
year. For the Prussian textile industry, see Blumberg, Textilindustrie, pp. 200-05, 382, who
uses quarterly data. See for the general crisis of crafts in 1847/48 Kuczynski, Lage, vol. 1, pp.
178f., idem, Lage, vol. 11, pp. 85-97, and Bergmann, Wirtschaftskrise, pp. 50, 63-70.

17
Before we proceed to explore the evidence on the consumption channel, let us discuss how the
food crisis influenced business attitudes and investment behavior. Several forces possibly had
an impact on investment financing conditions via credit demand and credit supply. During a
negative food supply shock, purchasing power is shifted from (net) food consumers to (net)
food producers. As nutritional status declines toward or even falls below the subsistence level,
demand becomes price-inelastic. This was the case in 1845-47, when net food consumers,
especially urban lower and middle classes, were forced to reduce their savings.33 While their
savings fell, savings by net food producer presumably increased. But since food producers
will have spent at least some of their extra profits on extra purchases of other goods, the
overall effect of the price increase on credit demand must have been positive. By contrast,
credit supply contracted under the rules of specie standard. England, for instance, for which
we have several accounts, experienced a gold drain because her balance of trade turned
negative, thus inducing gold outflows which led to a contraction of domestic money supply.34
A third factor which also resulted in a tightening of the credit market was misspeculation.
When expectations concerning the coming harvest switched from gloomy to optimistic and
massive corn imports from Russia and the United States were reaching the markets, prices
plummeted in mid-1847 and many traders were in desperate need of credit. This further
increased interest rates increased all over Europe.35 In fact, the available data underestimates
33 See, for instance, Obermann, "Wirtschafts- und sozialpolitische Aspekte," for evidence on
dissaving in Prussian lower- and middle-class households.
34 Described in detail by Boot, Commercial Crisis, ch. VI. See also Ward-Perkins,
"Commercial Crisis."
35 See for monthly London market and bank rates Ward-Perkins, "Commercial Crisis," p. 94.
Nearly all European yearly series of short-term interest rates show a local maximum in 1847,

18
the strain put on borrowers because most available interest rate series are regulated bank rates
which were not always adjusted to market conditions. In addition, borrowers were often
subject to credit rationing.36
While most of the available European interest rate series show a local maximum in 1847, the
impact of tighter financial conditions was felt as early as the second half of 1846 and, due to
the planning lags involved in investment demand, well into 1848. Indeed statistical evidence
seems to suggests a negative impact of lagged interest rates on the manufacturing sector. 37
While such exercises are seriously hampered by the quality of the interest rate data (see
above), they seem to be in line with the available anecdotal evidence. For instance, we know
that numerous firms failed between the second half of 1846 and the end of 1848, especially in
the textile sector, and that contemporaries saw lack of credit as one of the main factors behind
this.38 The visible slowdown in railway track investment in France, Germany, and, to a
somewhat lesser extent, England also points in that direction. The profitability of (the mostly
for UK, France, the Netherlands (maximum 1846), Belgium (max. 1848), Prussia, and
Switzerland see Homer, History, pp. 208, 230, 242, 252, 265, 270.
36 So for some interest rates were infinitely high. See for England Boot, Commercial Crisis,
p. 49, and for Prussia Obermann, "Wirtschafts- und sozialpolitische Aspekte," p. 163, and
Lichter, Preußische Notenbankpolitik, p. 22. In England, the commercial crisis was
immediately overcome when the Bank of England was allowed to lend at a bank rate over
eight per cent, see Ward-Perkins, "Commercial Crisis," p. 78, and Boot, Commercial Crisis, p.
52.
37 We comment on selected econometric results in fn. 42 below.
38 See, e.g., Labrousse, "Panoramas," pp. viii-x, Obermann, "Wirtschafts- und sozialpolitische
Aspekte," pp. 162-7, and Wehler, Deutsche Gesellschaftsgeschichte, pp. 648-52.

19
privately owned) German railway companies dropped during the crisis and eventually
investment was scaled back to meet the financing constraints. By contrast, most French
railways had been nationalized and it was lack of public funds due to the food crisis which
made the government cancel railway investment programs. In both countries, this affected the
metals and mining sectors seriously from early/mid-1847 onwards through 1848.39 In
conclusion, it would seem that the deterioration of financing conditions in the wake of the
agrarian crisis 1845-47 had a sizable lagged real effect on firm failures and investment
behavior that transmitted the crisis across sectors and into the critical year of 1848.
Turning from the investment to the consumption channel, we can apply a somewhat more
direct test for the existence of a propagation mechanism. Although there are no reliable data
on household demand for manufactured goods, it seem reasonable to rely on grain prices as a
proxy for the changes in household demand. The question to be addressed is whether there is
evidence for a lagged propagation of the grain crisis into manufacturing and, following
Okun’s Law, possibly to employment. As a first step, we subject the data at hand to a standard
Granger causality test. In a nutshell, the test asks how much of the growth path of, say, French
manufacturing output can be explained by lagged values of French grain prices and vice
versa.40 In both cases the possible determinants are added to an AR model of the endogenous
39 See Labrousse, "1848," idem, "Panoramas", and Spree and Bergmann, "Konjunkturelle
Entwicklung," pp. 314-21. The growth of the German rail-network did not accelerate again
before the 1850s. Ward-Perkins, "Commercial Crisis," p. 87 and Boot, Commercial Crisis, pp.
20, 81, point out that continued railway investment stabilized the UK economy by late 1847.
40 For the calculations in Table 1, we used the price data described in Appendix 3. Replacing
the price data for capital cities by national averages leads to only very slight deviations. The
same is true for the regression results in Table 2 (see below).

20
variable. Causality in the sense of the test should be interpreted conservatively. For instance,
the rejection of the null hypothesis of “no causality” in the case of lagged grain prices
influencing production would suggest that the former series precedes the latter and helps in
forecasting it. Table 1 presents our results. The model is symmetrical, i.e., the first row reports
the number of lags for the AR process as well as the number of lagged exogenous variables
included. The period under consideration is again 1820-50.
Table 1 about here
The main message of Table 1 is that grain prices are indeed Granger causal for manufacturing
in some countries, and the other way around in no single country. The results for Austria and
the Netherlands are somewhat weak, but still suggestive. The results for England fall in the
same category, but here we should not be surprised given England’s leading role in the
process of industrialization. In general, the evidence clearly suggests that changes in grain
prices preceded changes in the growth rate of non-agricultural activity. The results lend
credibility to the claim that the economic crisis of 1845-47, initiated by bad harvests, extended
into 1848 by triggering a crisis in the manufacturing sector. Or did it? After all, the existence
of a Granger causal relationship between grain prices and manufacturing does not necessarily
imply that a significant shock (in the sense defined above) to the former series also causes a
significant shock to the latter.
In order to see whether there are significant shocks in the available production data following
significant shocks in grain prices, we again make use of the method established in Section 2.
Figure 6 presents forecast errors from a model similar to equation (2) for the data used in
Table 1. Again, we set the lag of the AR part uniformly to n = 5 across all countries even

21
though some of the data series are rather short: the French, Prussian, and Habsburg series start
only in 1820, 1828, and 1830, respectively. The remaining series, however, run from 1815-
50.41
Figure 6 about here
Austria, France, Hungary, and Prussia show a significant negative shock to output growth in
manufacturing in 1848, whereas England and Sweden, which were also spared a shock in
grain prices, do not. The borderline case is the Netherlands, which experienced a grain price
shock but not a manufacturing shock. Thus, except for that case, we find that all countries
included in the manufacturing dataset that were hit (or not hit) by a significant positive shock
in grain prices 1846-47 also found themselves suffering (or exempt) from a significant
negative industrial production shock in 1848.42
Even though Figure 6 adds considerably to the evidence produced by the Granger tests
discussed above, there are still reasons why the propagation argument might not yet be
convincing. First, the results concerning production could themselves be influenced by the
revolutionary activity of 1848. After all, workers protesting in the streets are not at their
41 All series are stationary according to standard ADF tests. In the case of The Netherlands
the series is stationary around a trend. The results are robust with regard to changes in the lag
length of the AR model used to compute the forecasts and standard errors.
42 Again the statistical rule identifying “shocks” is quite robust. Table 3 below reveals that
lower thresholds for the forecast errors work equally well. See also footnote 49. See Figure 4
for the grain price forecast errors in the case of England, France, Prussia, and Sweden. All
other figures are, as already mentioned, available on request.

22
workbenches. Second, statistical significance does not guarantee that the strength of the
connection between the agricultural and the manufacturing sector was sufficient to explain the
downturn in production. Describing the correlation between the variables in which we are
interested using a simple multivariate regression model addresses both problems. Our exercise
includes England, France, Prussia, the Habsburg countries, the Netherlands, and Sweden. We
estimate two variants of the following equation:
(4) ttt
m
iitit REVpyy ε+λ+δ+β+α= −
=−∑ 1
1
ˆˆ .
Equation (4) basically describes an AR model with an added structural component.
The y stands for growth rates in manufacturing (in per cent), p are grain prices (in grams of
fine silver per hectolitre), and REV is a time dummy variable that is 1 in 1848 and 0
otherwise.43 The discussion of Granger causality above suggests that grain prices enter with a
lag. The dummy variable takes account of the possibility that the downturn in economic
activity in 1848 might have been a consequence of the revolution and not of the supply shock
in the agricultural sector. Table 2 presents OLS estimates of equation (4).
Table 2 about here
43 We use m = 4 to economize on d.f. We also experimented with one-period lagged nominal
and real interest rates as explanatory variables for England, France, and Prussia. Where
significant, interest rates had a negative impact on output growth. The results with regard to
grain prices and the revolution dummy were similar to the results presented in Table 2.
Additional results available on request.

23
Let us first consider columns (i) without the revolution dummy. From what has been said
about the consumption channel which may have linked the agricultural sector with
manufacturing, we should expect the grain price coefficients to be negative and significant.
Indeed the sign of the impact of grain prices is as anticipated in all cases, and lacks statistical
significance at conventional levels only in the cases of England, the industrial leader, and the
Netherlands.
Given that some of the time series are rather short, the performance of the consumption
channel is quite robust with regard to the introduction of the REV dummy (columns (ii)). The
dummy variable has at least a marginally significant negative impact for France, Hungary, and
Prussia, while the impact on the Swedish and English series is positive. Austria shows a non-
significant negative sign for REV. But while the revolution played some role in shaping
manufacturing activity, an important part of the explanation of the slump in production in
1848 obviously still derives from lagged grain prices. The negative sign of the variable
remains unchanged across countries and, with the exception of Austria and Hungary, at least
marginally significant. In the case of England the grain price variable even becomes
significant at the five percent level after the introduction of 1848 dummy variable. The results
for the Dutch data remain unchanged.44
What was the quantitative impact of the 1847 grain crisis on manufacturing? Take, for
instance, Prussia and France, which display a significant price variable in both columns.
Prices in Prussia (France) increased by 27.12 (37.85) grams fine silver from 1846 to 1847.
Based on the estimated δ coefficients in Table 2, column (ii), this translated into a decrease in
1848 manufacturing levels of about 7.86 (3.03) percentage points or about 32.67 (23.03) per
44 Note that to the extent that the revolution is in fact endogenous to the economic crisis we
should rely on a model excluding the 1848 dummy.

24
cent of the actual 1848 decline in manufacturing. Based on column (i) the decline explained
by the grain crisis is even larger (47.31 and 46.06 per cent, respectively). In England, the
negative impact of the grain price rise on growth in the manufacturing sector remained in the
two-percentage-point range (and too low to force an overall decline in real activity). We can
conclude that the quantitative impact of the grain crisis on the industrial sector was
considerable in France, Prussia, and the Habsburg countries, but not in more highly
industrialized England.
Crisis and Revolution
Section 2 established the existence of a regional pattern of significant shocks to grain prices
and, thus, to the cost of living in a number of European countries between 1845 and 1847.
Section 3 then linked the grain crisis to the manufacturing sector, helping to explain the
propagation of the initial shock into 1848. But we still have to connect our economic findings
with the political data.
It is not altogether straightforward to determine which countries experienced a revolution
or not. For the non-German countries we follow the consensus in the literature, according to
which France, the Italian states, Switzerland, Austria, Bohemia, and Hungary experienced
widespread violence and thus clearly revolutions in any sense of the word. In the broader
sense defined above (see Section 2) Belgium, Denmark, and the Netherlands, which were able
to avoid widespread violence only by undertaking immediate and substantial constitutional
changes, also qualify as revolutionary countries.45 By contrast, the other Scandinavian states,
England, Russia, and Spain neither experienced widespread political violence, nor saw their
45 A possibly critical case could be the Netherlands which Stearns, Revolutions, p. 1, would
not include in the second group.

25
governments forced to change the constitution significantly. For Ireland, which experienced
severe agrarian crime, but arguably no revolutionary action, we could not find reliable grain
price data for our sample period.46
For the German states, an evaluation is much more difficult. The German historiography
of 1848 has long been determined by the Prussia-centered perspective of German unification.
But in the 1840s the German states were fully independent entities with quite different
political paths, some with constitutions (as in southern Germany), others without constitutions
and more or less repressive (such as Prussia). As with the other European countries, we can
divide German territories into three groups. Widespread violence occurred in Baden, Bavaria,
Hamburg, Hesse-Darmstadt, Mecklenburg-Schwerin, Prussia, Saxony, and Württemberg.
Ruling elites which gave in to the threat of violence from the crowd protesting in the streets or
raiding manorial domains in the countryside can be found in Bremen, Brunswick, and
Oldenburg. In each of these states, the ruler immediately granted constitutional changes.
Among the German states in our sample, not one failed to experience either political violence
or immediate reform.47
46 See Ó Gráda, Ireland, and for data sources Solar, "Great Famine," pp. 114f., 120. Note,
however, that the absence of data seems equally spread across the different categories. For
instance, we also lack grain price data for Romania, which experienced severe political
turmoil. For the different states see Stearns, Revolutions, Price, Revolutions, Kaelble, "1848,"
p. 262f., and Goldstone, Revolution, p. 285. The two Italian countries in our sample,
Lombardy and the Papal States, both experienced strong revolutionary turmoil, see Sperber,
European Revolutions, pp. 109f., 222.
47 See Valentin, Geschichte, vol. 1, for the 1848 revolutions in the German states.

26
Our findings are summarized in Table 3, which covers nearly the whole of Europe with
the exceptions of Iceland, Ireland, Portugal, a few Italian and some smaller German states, and
the European countries of the Ottoman Empire. For these countries we were not able to find
compatible grain price data extending back to the 1820s.
Table 3 about here
The data in the first five columns refer to the grain prices in these countries. Column (i)
reports the average wheat or rye prices 1838-45, and column (ii) the maximum price between
1845 and 1848. Column (iii) reports for how many of the years 1845-47 the price was higher
than the average price 1838-45. In column (iv) the maximum price forecast error of the years
1845 to 1848 is divided by the corresponding standard error. Whether the deviation of the
actual from the forecasted price between 1845 and 1848 was a “shock” in the sense defined
above (deviation larger than +2 standard errors), is indicated in column (v). Columns (vi) to
(viii) repeat the shock analysis for those countries for which we have production data. If the
deviation between actual and forecasted industrial growth is less than –2 standard errors, we
speak of a production shock in column (viii).
The next step is to confront these data with the political data in the last two columns.
Column (ix) indicates whether or not the political atmosphere in early 1848 was repressive,
and column (x) indicates whether or not a country experienced a revolution. For countries
with immediate and substantial constitutional changes but no widespread violence, the “yes”
is in parentheses.
Now we are able to give an answer to the question of whether the European revolutions of
1848 were caused or at least strongly influenced by short-term economic factors. Comparing

27
columns (viii) and (x) we find that, with the exception of the Netherlands, in those countries
which experienced a negative industrial production shock, there was a revolution as well. By
contrast, in England and Sweden there was neither an industrial production shock nor a
revolution. It is reassuring that, very much in line with the analysis in the preceding section,
the occurrence and absence of shocks in food prices and manufacturing are highly correlated.
However, evidence for just seven countries may not be totally persuasive.
Therefore, in a second step, we make fuller use of our data set. To do this, we compare
columns (v) and (viii) which register the occurrence of shocks in grain prices and
manufacturing. With the exception of the Netherlands, we find that only countries with a price
shock in 1845-48 experienced a manufacturing shock in 1848, and vice versa. The finding
adds further weight to the hypothesis explored in Section 3 that a propagation mechanism
existed which extended the shock waves of the agrarian crisis into 1848. Consequently, we
can compare the earlier price shocks in column (v) directly with the political data for 1848 in
column (x) even for those countries for which we do not have production data. The result is
surprisingly clear-cut. There is a nearly perfect regional match between the existence of a
grain price shock and a revolution: among the 21 states which experienced revolutionary
turmoil, 20 had been hit by a grain price shock between 1845 and 1847. Only Denmark is an
outlier. By contrast, of the six countries without a revolution, only one, Norway, showed signs
of a price shock in the grain market.48
48 These results are in line with those of Goldstone, Revolution, pp. 343-48, who finds a high
geographical correlation between population pressure and state crises in Europe between 1750
and 1850. Note, however, that our results are immune to the criticism that the explanatory
variable (in our case the price shocks) is endogenous.

28
The outcome is also remarkably robust with regard to the underlying definition of economic
“shocks”. As pointed out earlier, the 2-standard-error threshold is primarily a statistical rule of
thumb. However, a comparison of columns (iv) and (x) reveals that indeed any threshold
value between 1.82 and 2.18 would have resulted in the same proportion of 25 out of 27
countries fitting the economic view.49 The robustness of the result strongly suggests a positive
correlation between the likelihood of the occurrence of a revolution and the size of the price
shock in our sample. Indeed, a simple logit model exercise reveals that an increase in the pre-
revolution grain price forecast error significantly increases the probability of revolutionary
activity (violent and non-violent).50
49 Similarly, column (vii) shows that any threshold between 0 and -2.01 will separate countries
with or without shocks in industrial production in a way that is compatible with the economic
view (except for the Netherlands).
50 We estimated a ML-binary logit model for the occurrence of a revolution with a constant
and the grain price forecast error in 1847 for the 27 countries or regions in our sample. The
LHS variable is constructed as a dummy that takes the value 1 when column (x) in Table 3
shows either a “yes” or a “(yes)” and 0 otherwise. The estimated coefficient for the grain price
forecast error is 1.83 with a s.e. of 0.57 (significant at the 4 percent level). This translates into
an increase in the probability of a revolution for a one-unit increase in the 1847 forecast error
from zero of about 21 percentage points. A one-unit increase from a forecast error level of one
(two) increases the probability of a revolution by about 46 (23) percentage points. McFadden-
R2 is 0.18. The standard deviation of the 1847 forecast errors is 0.88. Using the grain price
forecast error as listed in Table 3, which for some countries deviates from the 1847 figure,
does not change these results. Details available on request.

29
Also note that less sophisticated measures of the depth of the agrarian crisis lead to
comparable findings. For instance, a comparison of columns (iii) and (x) shows that the
number of years in the period 1845-47 in which a country suffered from relatively high grain
prices is a remarkably good indicator of the likelihood of the occurrence of revolutionary
activity in 1848, too. With the exception of Denmark and Spain, politically stable countries
were spared price rises of more than one year. By contrast, countries with a revolution
endured a minimum of two years of above-average prices before 1848.
Figure 7 about here
Is there anything we can say about the outliers? First, regional factors might play a role. The
two countries which do not fit the hypothesis that the economic crisis triggered the revolution
according to the expectations-based shock criterion summarized in column (v), Denmark and
Norway, as well as the Netherlands for which the production data summarized in column
(viii) do not fit, are part of the North Sea area. Moreover, all cases in which countries
experienced price shocks but only moderate, i.e. non-violent, revolutions are also in this
region (see Figure 7). Second, institutional and political factors could be important. An
obvious candidate is poor relief, which might have improved the credibility of a regime.
However, we found it very difficult to gather comparable information for our sample
countries. The most comprehensive comparative study in this respect is that of Lindert, who
compares 10 European countries. It is at least noteworthy in our context that he finds that poor
relief per capita in England and the Netherlands were by far higher than in the other
countries.51
51 See Lindert, "Poor relief," pp. 113-18.

30
An institutional factor which can be assessed, however, is whether a regime was repressive or
not. It is interesting that, as column (ix) in Table 3 indicates, the aforementioned North Sea
countries were all governed by non-repressive or liberal regimes. To pursue this idea, we
employed the logit model for explaining the likelihood of overall revolutionary activity
(discussed above) and a model explaining violent revolutionary activity alone. We find that,
while an increase in the grain price forecast error significantly increases the likelihood of both
violent and non-violent activity, the presence of a repressive political regime only affects the
probability of violent activity. The violent type of revolutionary activity was significantly
more likely to occur under repressive political regimes.52 Our findings thus support the idea
that the character of the regime helped to shape the type of political upheaval in 1848, but that
it was the economic crisis that triggered the event.
Conclusion
Many historians investigating the 1848 revolutions in Europe emphasize the force of ideas as
their leading cause. The economic crisis starting with the bad harvest of 1845 is regarded at
52 Including a dummy variable that takes the value 1 when column (ix) in Table 3 indicates the
presence of a repressive regime and 0 otherwise in the above-mentioned model explaining the
occurrence of a revolution (violent and non-violent) produces no significant effects. The ML-
binary logit model for the occurrence of just violent revolutionary activity includes a constant,
the grain price forecast error in 1847, and the dummy variable indicating the presence of a
repressive regime. The LHS variable is constructed as dummy that takes the value 1 when
column (x) in Table 3 shows a “yes” and 0 otherwise. Both the estimated coefficient for the
grain price forecast error (1.43) and the repressive regime dummy (2.52) were significant at
least at the 4 percent level. McFadden-R2 is 0.26. Details available on request.

31
most as one of numerous enabling factors. In view of the analysis put forward in the present
paper, this view severely underestimates the political dynamics resulting from the extreme
short-term economic fluctuations of 1845-48. A more pointed statement of this economic
view would be that it was economic misery rather than ”ideas” that caused the outbreak of
revolutions in early 1848.
As an initial step, we establish that there exists a propagation mechanism that links the
agricultural crisis of 1845-47 with the subsequent industrial crisis in 1848. Using a number of
standard time series tools, it can be shown that in the period 1820-50 there was a systematic
and significant relationship between the agricultural and the industrial sectors in France,
Prussia, Austria, Hungary, and Sweden, but not in England, the world’s leading and most
highly industrialized economy, nor in the Netherlands. There is evidence that an increase in
grain prices – a good proxy for the cost of living at the time – led to a decline in
manufacturing activity after a certain lag. Thus, the dramatic increase in the prices of basic
foods in 1845-47 must have had a strong negative effect on production and employment in the
industrial sectors by 1848, the year of political unrest. This result is potentially important. It
allows us to draw inferences directly about the occurrence of revolutionary activity from the
rich data on European grain prices.
In a second step, we demonstrate the regional pattern of the economic shocks that hit or
did not hit the European countries prior to the revolutions of 1848. A ”shock” is defined as a
significant forecast error based on an adaptive expectations model. It turns out that this
criterion helps to predict revolutionary activity: if a country was subject to a shock in 1845-48,
it also experienced a revolution and if not, it did not. Using the much sparser available data on
manufacturing we find that France, Prussia, Austria, and Hungary suffered a shock-like
decline in industrial production in 1848 paralleled by significant revolutionary activity. While

32
this result is very much in line with the economic view of the 1848 events, it is based on a
rather small number of observations. However, making use of the link established above
between the agricultural and the manufacturing sector, we can turn to grain prices for help. In
fact, the regional pattern of grain price shocks is very similar to that for manufacturing: if a
country was subjected to a grain price shock between 1845 and 1847, then it experienced a
revolution in 1848. Of 21 countries subject to a grain price shock, 20 follow this crude, but
obviously powerful rule, Norway being the peaceful exception. Among the remaining six
countries which did not suffer strong grain price increases, only Denmark experienced far-
reaching, and in our sense revolutionary, constitutional reform. These results are very robust
with regard to the underlying definition of an economic shock. We conclude that the
occurrence of an economic shock in the later 1840s was an important factor in triggering the
1848 revolutions across Europe.
While institutions, namely the presence or absence of a repressive political regime, add little
to the explanation of the occurrence of revolutionary activity as such, we find that they did
exert a significant influence on the form this activity took. The revolutions of 1848 tended to
be violent in nature if the regime was repressive. We conclude that the presence of repressive
regimes did not trigger events but did help to shape them.
The same could be said about the role of ideas. The peasants and artisans of the 1840s,
suffering a severe deterioration in their socioeconomic status, needed some kind of political
alternative – realistic or not – before they would become revolutionaries. At the time, these
alternatives were offered by peasant leaders who appealed to the traditional and customary
law – Thompson’s “moral economy”53 – and by politically discontented citizens who favored
the new ideas of liberalism and democracy. In contrast to the crises of 1816/17, when there
53 Thompson, "Moral Economy."

33
was still hope that the forces of restoration would not dominate, the crisis of 1845-48 took
place in the context of a much larger and more popular variety of political alternatives that
called for immediate action.54 At least here we see historical singularities. The fact that ideas
served as a catalyst for an upheaval initiated by economic factors transcends a narrow
economistic approach. But although the economic crises did not provide the brains, they did
provide the muscles. The opinion leaders, who pursued their ideals in an undemocratic and
often repressive political environment, needed violence (or the credible threat of it) as a
political instrument, and only the ”crowd” could provide it. Hobsbawm has termed this
”bargaining by riot”.55 We conclude that without the economic crisis of 1845-48, which so
obviously endangered the economic welfare of so many and discredited the ancien régime,
there would not have been the critical mass to support these new ideas. Hence the explanation
of European revolutions of 1848 should not neglect short-term economic factors.
54 The similar food price increase of 1854/55 created neither famine nor social unrest, see
Charles, Louise, and Richard Tilly, Rebellious Century.
55 Hobsbawm, "Machine Breakers," p. 57.

34
Appendix
Data Sources
Political data (intensity of repression, intensity of revolution) are taken for Germany and the
Austrian Empire from Huber, Deutsche Verfassungsgeschichte, chs. VII and VIII, and
Valentin, Geschichte, chs. 4, 6, and 7. For the European states, see Stearns, Revolutions, Price,
Revolutions, Sperber, European Revolutions, and the articles in Dowe, Haupt and
Langewiesche, Europa, ch. I. Numerous other historical works were consulted which are not
in the list of references. Please contact the authors for a list.
Grain price data would ideally be an average for the harvest year, weighted by sales and
expressed in, well, Euros. The currency problem can quite easily be overcome by transforming
recorded local prices per local unit into grams of fine silver per hectolitre. For the conversion
of currencies, measures of capacity, and measures of weight we used Klimpert, Lexikon, at
times checked by and supplemented with data in other literature on the subject. As both the
levels and the volatility of the data are strongly influenced by the way the average is
calculated, we ignored series for the harvest year or ones which relied only on one or two
dates per year. This, for example, is the case for the Lisbon price series of Magalhães
Godinho, Prix, pp. 76-78. Very probably the only series which is partially weighted by sales is
the one for France, where the weighting was (supposed to be) done at the very first level of
recording, i.e. the mairies, see Drame et al., Siècle, ch. 4. Whenever possible, we tried to find
data for the country's capital because these were the prices actually observed (and responded
to) in the political centre. If not stated otherwise, the data are available annually from 1815 to
1850. The abbreviations in parentheses are the country codes used in Figure 7. Country codes
in capitals stand for violent revolutions, in lower cases for no revolution.
1. Austria (AUS; Lower Austria, contains Vienna): Földes, "Getreidepreise," p. 484; miningand industrial production 1830-50 Komlos, Habsburg Monarchy, pp. 294f.
2. Baden (BAD; Mannheim, Heidelberg): "Getreidepreise in Deutschland," p. I.297.

35
3. Bavaria (BAV; Munich): Seuffert, Statistik, p. 124.
4. Belgium (Bel): Seuffert, Statistik, p. 401.
5. Bohemia (BOH; Prague): Schebek, Collektiv-Ausstellung, pp. 99-101.
6. Bremen (Bre): Gerhard and Kaufhold, Preise, pp. 204f.
7. Brunswick (Bru): Soetbeer, Beiträge, p. 8.
8. Denmark (Den; Copenhagen, 1819-50): Weisz, "Getreidepreise," p. 397, wheat prices1819-32 extrapolated by using rye prices from Földes, "Getreidepreise," p. 489. Thecorrelation between the wheat and rye series 1833-50 is 0.72.
9. England (eng; London): Rostow, British Economy, p. 125, cf. also Weisz,"Getreidepreise," p. 350; British industrial production Crafts and Harley, "OutputGrowth," p. 727.
10. Finland (fin): Földes, "Getreidepreise," p. 492.
11. France (FRA; département Seine-et-Oise, surrounds Paris): Labrousse, Romano, andDreyfus, Prix, 196f.; industrial production 1820-50 Lévy-Leboyer and Bouguignon,French economy, table A-IV.
12. Hamburg (HAM): "Getreidepreise in Deutschland," p. I.296.
13. Hesse (HES; 1822-50): Mittheilungen der hessischen Zentralstelle, p. 334.
14. Hungary (HUN; Pest, 1819-50): Földes, "Getreidepreise," p. 485; mining and industrialproduction 1830-50 Komlos, Habsburg Monarchy, p. 294f.
15. Lombardy (LOM; Milan): Maddalena, Prezzi, p. 379.
16. Mecklenburg (MEC; Rostock): "Getreidepreise im Grossherzogthum Mecklenburg," pp.26, 28.
17. Netherlands (Net; Utrecht): Posthumus and Ketner, Inquiry, pp. 422f.; industrialproduction Smits, Horlings, and van Zanden, "Measurement," pp. 62f.
18. Norway (nor; 1820-50): Földes, "Getreidepreise," p. 518.
19. Oldenburg (Old; rye prices 1817-50): "Durchschnittspreise," p. 5.
20. Papal States (PAP; Rome): Földes, "Getreidepreise," p. 482.
21. Prussia (PRU; Berlin): 1815 Seuffert, Statistik, p. 386; 1816-60 Engel, "Getreidepreise," p.257; woolen weaving production 1828-50 Blumberg, Deutsche Textilindustrie, p. 382.
22. Russia (rus; Moscow, rye prices): Mironov, Chlebnie ceny, pp. 235-37.
23. Saxonia (SAX; Dresden 1820-50): Mittheilungen des statistischen Vereins, pp. 66f. (1820-31, obvious misprint for 1821 corrected), Seuffert, Statistik, p. 375 (1832-50).
24. Spain (spa; Barcelona): price index (1913=100) from Sardà, Política Monetaria, pp. 303-05, rebased in prices by Consejo Superior Bancario, Dictamen, pp. 39, 109. Obviousmisprint for 1848 corrected.
25. Sweden (swe; Stockholm): Jörberg, History of Prices, pp. 124-27; industrial productionSchön, Historiska nationalräkenskaper, table II.
26. Switzerland (swi): Historische Statistik, p. 480.
27. Württemberg (WUR): Mährlen and Trüdinger, "Durchschnittspreise," II.120f.

36
ReferencesAbel, Wilhelm. Agrarkrisen und Agrarkonjunktur. 3rd edn. Hamburg: Parey, 1978.Amtsblatt der Königlichen Regierung zu Potsdam und der Stadt Berlin. Nowawes 1840-1849.Bass, Hans-Heinrich. Hungerkrisen in Preußen während der ersten Hälfte des 19. Jahrhunderts. St. Katharinen:
Scripta Mercaturae, 1991.Bauernfeind, Walter, and Ulrich Woitek. "Agrarian Cycles in Germany 1339-1670: A Spectral Analysis of Grain
Prices and Output in Nuremberg." Explorations in Economic History 33, no. 4 (1996): 459-78.Bergmann, Jürgen. "Ökonomische Voraussetzungen der Revolution von 1848. Zur Krise von 1845 bis 1848 in
Deutschland." In Geschichte als politische Wissenschaft, edited by Jürgen Bergmann, Klaus Megerle, andPeter Steinbach, 24-54. Stuttgart: Klett-Cotta, 1979.
___. Wirtschaftskrise und Revolution. Handwerker und Arbeiter 1848/49. Stuttgart: Klett-Cotta, 1986.Blumberg, Horst. Die deutsche Textilindustrie in der industriellen Revolution. Berlin: Akademie, 1965.Boot, H.M. The Commercial Crisis of 1847. Hull: Hull University Press, 1984.Braudel, Fernand P., and Frank Spooner. "Prices in Europe from 1450 to 1750." In Cambridge Economic
History of Europe, vol. 4, 374-486. Cambridge: Cambridge University Press, 1967.Broers, Michael. Europe after Napoleon: Revolution, reaction and romanticism, 1814-1848. Manchester:
Manchester University Press, 1996.Bruckmüller, Ernst, and Wolfgang Häusler, eds. 1848. Revolution in Österreich. Vienna: öbv & hpt, 1999.Consejo Superior Bancario. Dictamen de la Comisión nombrada por Real orden de 9 de enero de 1929, para el
estudio de la implantación del patrón de oro. Madrid: Samarán, 1929.Crafts, N.F.R., and C. Knick Harley. "Output Growth and the British Industrial Revolution." Economic History
Review 45, no. 4 (1992): 703-30.Dipper, Christof, and Ulrich Speck, eds. 1848. Revolution in Deutschland. Frankfurt/Main: Insel, 1998.Dowe, Dieter, Heinz-Gerhard Haupt, and Dieter Langewiesche, eds. Europa 1848, Bonn: Dietz, 1998.Drame, Sylvie, et al. Un siècle de commerce du blé en France 1825-1913. Paris: Economica, 1991."Durchschnittspreise des Getreides und einiger anderen Nahrungsmittel im Grossherzogthum Oldenburg aus den
Jahren 1817 bis 1858." Statistische Nachrichten über das Grossherzogthum Oldenburg 4 (1860): 1-43.Ebeling, Dietrich, and Franz Irsigler. "Zur Entwicklung von Agrar- und Lebensmittelpreisen in der
vorindustriellen und industriellen Zeit." Archiv für Sozialgeschichte 19, no. 1 (1979): 299-329.Engel, Ernst. "Die Getreidepreise, die Ernteerträge und der Getreidehandel im preussischen Staate." Zeitschrift
des Königl. Preussischen Statistischen Bureaus 1 (1861): 249-89.Ernst, Andreas, Albert Tanner, and Matthias Weishaupt, eds. Revolution und Innovation. Die konfliktreiche
Entstehung des schweizerischen Bundesstaates von 1848. Zurich: Chronos, 1998.Fischer, Holger, ed. Die ungarische Revolution von 1848/49. Vergleichende Aspekte der Revolutionen in Ungarn
und Deutschland. Hamburg: Krämer, 1998.Földes, Béla. "Die Getreidepreise im 19. Jahrhundert." Jahrbücher für Nationalökonomie und Statistik III.29
(1905): 467-518.Fremdling, Rainer, and Gerd Hohorst. "Marktintegration der preußischen Wirtschaft im 19. Jahrhundert." In
Industrialisierung und Raum, edited by Rainer Fremdling and Richard Tilly, 57-104. Stuttgart: Klett-Cotta,1979.
Gailus, Manfred. Straße und Brot. Sozialer Protest in den deutschen Staaten unter besonderer BerücksichtigungPreußens, 1847-1849. Göttingen: Vandenhoeck & Ruprecht, 1990.
Gall, Lothar, ed. 1848: Aufbruch zur Freiheit. Berlin: Nicolai, 1998.Gerhard, Hans-Jürgen, ed. Löhne im vor- und frühindustriellen Deutschland. Göttingen: Schwartz, 1984.Gerhard, Hans-Jürgen, and Karl Heinrich Kaufhold. Preise im vor- und frühindustriellen Deutschland.
Grundnahrungsmittel. Göttingen: Schwartz, 1990. "Die Getreidepreise im Grossherzogthum Mecklenburg-Schwerin während des Zeitraums von 1771 bis 1870."
Beiträge zur Statistik Mecklenburgs 7, no. 3/4 (1873)."Die Getreidepreise in Deutschland seit dem Ausgang des 18. Jahrhunderts." Vierteljahrshefte zur Statistik des
Deutschen Reichs 44 (1935): I.273-321.Goldstone, Jack A. Revolution and Rebellion in the Early Modern World. Berkeley: University of California
Press, 1991.Gömmel, Rainer. Realeinkommen in Deutschland. Ein internationaler Vergleich (1810-1914). Nuremberg, 1978.Greene, William H. Econometric Analysis. 2nd edn. New York: Macmillan, 1993.Hahn, Hans-Werner. "Die sozioökonomische Ordnung der Nation." In Revolution in Deutschland 1848, edited
by Christof Dipper and Ulrich Speck, 366-80. Frankfurt/Main: Insel, 1998.Hardtwig, Wolfgang, ed. Revolution in Deutschland und Europa 1848/49. Göttingen: Vandenhoeck & Ruprecht.Hein, Dieter. Die Revolution von 1848/49. Munich: Beck, 1998.

37
Hildbrand, Thomas, and Albert Tanner, ed. Im Zeichen der Revolution: der Weg zum schweizerischenBundesstaat 1798-1848. Zurich: Chronos, 1997.
Historische Statistik der Schweiz. Zurich: Chronos, 1996.Höbelt, Lothar. 1848 - Österreich und die deutsche Revolution. Wien: Amalthea, 1998.Hobsbawm, Eric. "Economic Fluctuations and some Social Movements since 1800." Economic History Review
5, no. 1 (1952): 1-25.___. "The Machine Breakers." Past and Present 1, no. 1 (1952): 57-70.Homer, Sidney. A History of Interest Rates. 2nd edn. New Brunswick: Rutgers, 1977.Huber, Ernst. Deutsche Verfassungsgeschichte. Vol. 2. Der Kampf um Einheit und Freiheit 1830 bis 1850. 2nd
edn. Stuttgart: Kohlhammer, 1968.Jacobs, Alfred, and Hans Richter. Die Großhandelspreise in Deutschland von 1792 bis 1934. Berlin:
Hanseatische Verlagsanstalt, 1935.Jansen, Christian, and Thomas Mergel, eds. Die Revolution von 1848/49. Göttingen: Vandenhoeck & Ruprecht,
1998.Jörberg, Lennart. A History of Prices in Sweden 1732-1914. Vol. 1. Lund: CWK Gleerup, 1972.Judson, Pieter M. Wien brennt. Die Revolution von 1848 und ihr liberales Erbe. Vienna: Böhlau, 1998.Kaelble, Hartmut. "1848: Viele nationale Revolutionen oder eine europäische Revolution?" In Revolution in
Deutschland und Europa 1848/49, edited by Wolfgang Hardtwig, 260-78. Göttingen: Vandenhoeck &Ruprecht, 1998.
Kimmel, Michael S. Revolution. A Sociological Interpretation. Cambridge: Polity Press, 1990.Klimpert, Richard. Lexikon der Münzen, Maße, Gewichte, Zählarten und Zeitgrößen aller Länder dieser Erde.
2nd edn. Berlin: Regenhardt, 1896.Komlos, John. The Habsburg Monarchy as a Customs Union. Economic Development in Austria-Hungary in the
Nineteenth Century. Princeton: Princeton University Press, 1983.Kopsidis, Michael. "Marktintegration und Entwicklung der westfälischen Landwirtschaft 1780-1880." Ph.D. diss,
University of Munster, 1995.Kuczynski, Jürgen. "Die wirtschaftlichen und sozialen Voraussetzungen der Revolution von 1848/1849." In Zur
Frühgeschichte der deutschen Gewerkschaftsbewegung 1800-1849, edited by Elisabeth Todt and HansRadandt, 7-32. Berlin: Freie Gewerkschaft, 1950.
Kuczynski, Jürgen. Die Lage der Arbeiter unter dem Kapitalismus. Vol. 1. Darstellung der Lage der Arbeiter inDeutschland von 1789 bis 1849. Vol. 11. Studien zur Geschichte der zyklischen Überproduktion inDeutschland 1825 bis 1866. Berlin: Akademie 1961.
Labrousse, Ernest. "1848, 1830, 1789. Comment naissent révolutions." In Actes du congrès historique ducentenaire de la révolution. Paris, 1948.
Labrousse, Ernest. "Panoramas de la crise." In Aspects de la crise et de la dépression de l"économie française aumilieu du XIXe siècle 1846-1851, edited by idem, III-XXIV. Paris: Presses Universitaires de France, 1956.
Labrousse, Ernest, Ruggiero Romano, and F.-G. Dreyfus. Le prix du froment en France au temps de la monnaiestable (1726-1913). Paris: SEVPEN, 1970.
Langewiesche, Dieter, ed. Die Revolutionen von 1848 in der europäischen Geschichte: Ergebnisse undNachwirkungen. Munich: Oldenbourg, 2000.
Lévêque, Pierre. "Ébranlement et restauration de l'ordre social." In La révolution de 1848 en France et enEurope, edited by Sylvie Aprile et al., 69-126. Paris: Édition sociales, 1998.
Lévy-Leboyer, Maurice, and François Bourguignon. The French economy in the nineteenth century. Cambridge:Cambridge University Press, 1990.
Lichter, Jörg. Preußische Notenbankpolitik in der Formationsphase des Zentralbanksystems. Berlin: Duncker &Humblot, 1999.
Lill, Rudolf, ed. Die Revolution von 1848/49 in Deutschland und Europa. Karlsruhe: Kulturreferat der Stadt,1998.
Lindert, Peter. "Poor relief before the Welfare State: Britain versus the Continent." European Review ofEconomic History 2, no.2 (1998): 101-40.
Maddalena, Aldo de. Prezzi e Mercedi a Milano dal 1701 al 1860. Milan: Banca Commerciale, 1974.Magalhães Godinho, Vitorino. Prix et Monnaies au Portugal 1750-1850. Paris: Colin, 1955.Mährlen, Hermann, and O. Trüdinger (1896) "Die Durchschnittspreise von Getreide in Württemberg 1766-
1895." Württembergische Jahrbücher für Statistik und Landeskunde (1896): II.117-22.Mironov, Boris N. Chlebnye ceny v Rossii za dva stoletija (XVIII - XIX vv.). Leningrad: Nauka, 1985.Mitchell, B.R. International Historical Statistics. Europe 1750-1988. 3rd edn. New York: Stockton, 1992.Mittheilungen der hessischen Zentralstelle für die Landesstatistik 5 (1871).Mittheilungen des statistischen Vereins für das Königreich Sachsen 2 (1832).Mommsen, Wolfgang J. 1848: Die ungewollte Revolution. Die revolutionären Bewegungen in Europa 1830-
1849. Frankfurt/Main: Fischer, 1998.

38
Obermann, Karl. "Wirtschafts- und sozialpolitische Aspekte der Krise von 1845-1847 in Deutschland,insbesondere in Preußen." Jahrbuch für Geschichte 7 (1972): 141-174.
Ó Gráda, Cormac. Ireland Before and After the Famine. Explorations in Economic History, 1800-1925, 2nd edn.Manchester: Manchester University Press, 1993.
Phelps Brown, Ernest H., and Sheila V. Hopkins. "Seven Centuries of the Prices of Consumables, compared withBuilders' Wage-rates." Economica 23 (1956): 296-314.
Pinkney, David H. Decisive years in France, 1840-1847. Princeton: Princeton University Press, 1986.Posthumus, Nicolaas W., and F. Ketner. Inquiry into the History of Prices in Holland. Vol. 2. Leiden: Brill,
1964.Price, Roger. The Revolutions of 1848. Atlantic Highlands: Humanities Press, 1989.Rill, Bernd, ed. 1848. Epochenjahr für Demokratie und Rechtsstaat in Deutschland. Munich: Hanns-Seidel-
Stiftung, 1998.Roscher, Wilhelm. Über Kornhandel und Theuerungspolitik. 3rd edn. Stuttgart: Cotta, 1852.Rostow, Walt W. British Economy of the Nineteenth Century. Oxford: University Press, 1948.Rudé, George. "Why was there no Revolution in England in 1830 or 1848?" In Studien über die Revolution,
edited by Manfred Kossok, 231-44. Berlin: Akademie, 1969.Saalfeld, Diedrich. "Lebensverhältnisse der Unterschichten Deutschlands im neunzehnten Jahrhundert." Interna-
tional Review of Social History 28, no. 3 (1983): 215-53.Sardà, Juan. La Política Monetaria y las fluctaciones de la Economía española en el siglo XIX. Madrid: Diana,
1948.Schebek, Edmund. Collektiv-Ausstellung von Beiträgen zur Geschichte der Preise veranstaltet zur Welt-
Ausstellung 1873 Wien von der Handels- und Gewerbekammer in Prag. Prague: Mercy, 1873.Schön, Lennart. Historiska nationalräkenskaper för Sverige: Industri och hantverk 1800-1980. Lund:
Ekonomisk-historika föreningen, 1988.Schroeder, Paul W. The Transformation of European Politics 1763-1848. Oxford: Clarendon, 1994.Seuffert, Georg K. Statistik des Getreide- und Viktualien-Handels im Königreich Bayern mit Berücksichtigung
des Auslandes. Munich: Weiß, 1857.Siegenthaler, Hansjörg. Regelvertrauen, Prosperität und Krisen. Die Ungleichmäßigkeit wirtschaftlicher und
sozialer Entwicklung als Ergebnis individuellen Handelns und sozialen Lernens. Tübingen: Mohr Siebeck,1993.
Siemann, Wolfram. Die deutsche Revolution von 1848/49. 1st edn. Frankfurt/Main: Suhrkamp, 1985.Sigmann, Jean. 1848. Les révolutions romantiques et democratiques de l'Europe. Paris: Calmann-Lévy, 1970.Smits, J.P, E. Horlings, and J.L. van Zanden. "The Measurement of Gross National Product and its Components.
The Netherlands, 1800-1913." Research Memorandum No. 1, N.W. Posthumus Institute, Utrecht University,1997.
Soetbeer, Adolph. Beiträge zur Statistik der Preise, Hamburg: Kümpel, 1858.Solar, Peter "The Great famine was no ordinary subsistence crisis." In Famine: the Irish experience, 900-1900,
edited by E. Margaret Crawford, 112-33. Edinburgh: Donald, 1989.Sperber, Jonathan. The European Revolutions, 1848-1851. Cambridge: Cambridge University Press, 1994.Spree, Reinhard, and Jürgen Bergmann. "Die konjunkturelle Entwicklung der deutschen Wirtschaft 1840 bis
1864." In Sozialgeschichte heute, edited by Hans-Ulrich Wehler, 289-325. Göttingen: Vandenhoeck &Ruprecht, 1974.
Stearns, Peter N. The Revolutions of 1848. London: Weidenfeld & Nicolson, 1974.Stürmer, Michael. Crise, révolution et conjoncture 1848-1849. Bonn: Bouvier, 1999.Thompson, E.P. "The Moral Economy of the English Crowd in the Eighteenth Century." Past and Present 50,
no. 1 (1971): 76-136.Tilly, Charles. "Revolutions and Collective Violence." In Handbook of Political Science, edited by Fred I.
Greenstein and Nelson W. Polsby. Vol. 3, 483-555. Reading/Mass.: Addison-Wesley, 1975.Tilly, Charles. European Revolutions, 1492-1992. Oxford: Blackwell, 1993.Tilly, Charles, Louise Tilly, and Richard H. Tilly. The Rebellious Century, 1830-1930. Harvard: Harvard
University Press, 1975.Tilly, Richard H. "Popular Disorders in 19th Century Germany. A Preliminary Survey." Journal of Social
History 4, no. 1 (1970): 1-40.___. Vom Zollverein zum Industriestaat. Die wirtschaftlich-soziale Entwicklung Deutschlands 1834 bis 1914.
Munich: dtv, 1990.Timmermann, Heiner, ed. 1848. Revolution in Europa. Verlauf, politische Programme, Folgen und Wirkungen.
Berlin: Duncker & Humblot, 1999.Tocqueville, Alexis de. L'ancien régime et la revolution. 2nd edn. Paris: Lévy, 1856.Valentin, Veit. Geschichte der deutschen Revolution von 1848-49. Vol. 1. Weinheim: Beltz Quadriga, 1998
(original 1930).

39
Ward-Perkins, C.N. "The Commercial Crisis of 1847." Oxford Economic Papers 2, no. 2 (1950): 75-94.Wehler, Hans-Ulrich. Deutsche Gesellschaftsgeschichte. Vol. 2. Von der Reformära bis zur industriellen und
politischen "Deutschen Doppelrevolution". Munich: Beck, 1989.Weir, David R. "Les crises économiques et les origines de la Révolution française." Annales E.S.C. 46, no. 5
(1991): 917-51.Weisz, B. "Die Getreidepreise im XIX. Jahrhundert mit besonderer Berücksichtigung der Preis-Schwankungen."
Statistische Monatsschrift 3 (1877): 345-70, 393-401.Williamson, Jeffrey. "The Impact of the Corn Laws Just Prior to Repeal." Explorations in Economic History 27,
no. 2 (1990): 123-56.

40
Figure 1: Integration of Prussian Grain Markets, 1820-50
-0.3
-0.2
-0.1
0.0
0.1
0.2
0.3
-0.4 -0.2 0.0 0.2 0.4
RYE
WH
EA
T
Notes: Growth rates are the annual first differences of the
original price series in logs. For illustrative purposes,
Figure 1 omits an outlier (-0.43, -0.56). The full (the
abbreviated) sample produces a highly significant
coefficient of correlation of 0.77 (0.73). Due to seasonality
in rye and wheat prices, the coefficient for the raw data is
much larger: 0.93 (full sample).
Source: Kopsidis, Marktintegration, Table Vg/1 ff.

41
Figure 2: European Wheat Prices, 1820-50
60
80
100
120
140
20 25 30 35 40 45 50
ENGLAND
60
80
100
120
140
160
20 25 30 35 40 45 50
FRANCE
20
40
60
80
100
120
20 25 30 35 40 45 50
PRUSSIA
40
50
60
70
80
90
100
20 25 30 35 40 45 50
SWEDEN
Notes: All series are transformed into grams of fine silver per
hectolitre. The series are for London, the region around Paris,
Berlin, and Stockholm county.
Sources: see Appendix.
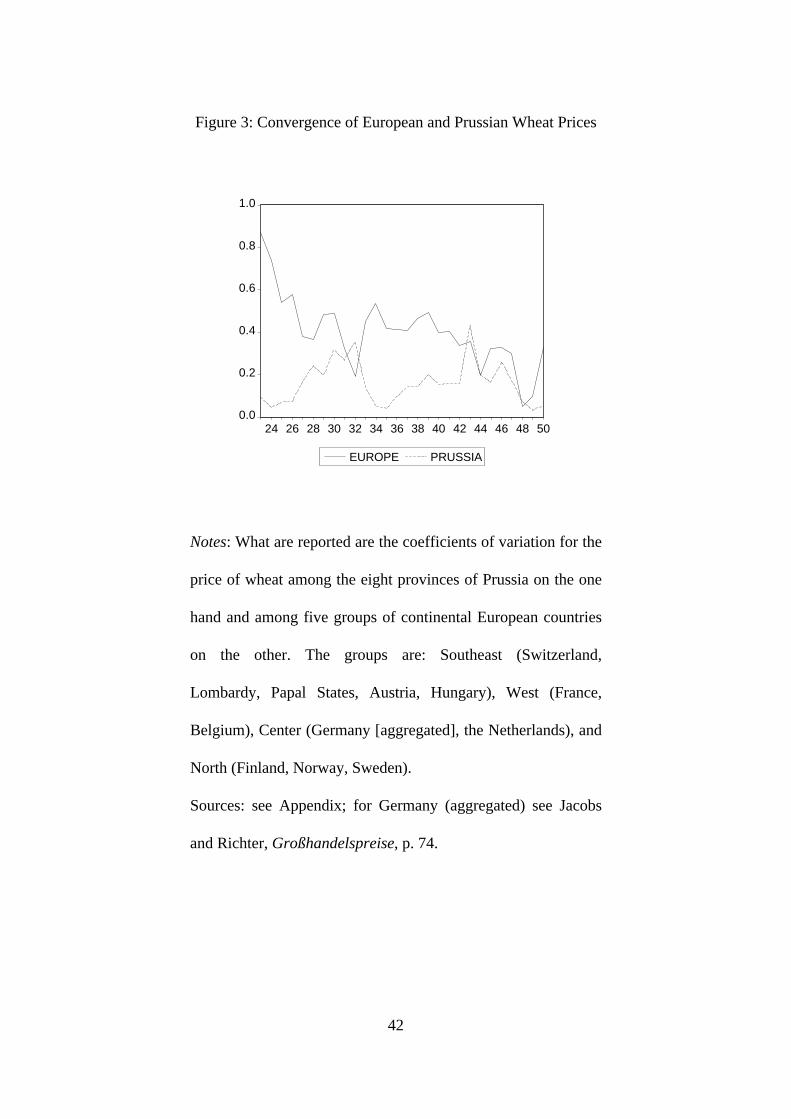
42
Figure 3: Convergence of European and Prussian Wheat Prices
0.0
0.2
0.4
0.6
0.8
1.0
24 26 28 30 32 34 36 38 40 42 44 46 48 50
EUROPE PRUSSIA
Notes: What are reported are the coefficients of variation for the
price of wheat among the eight provinces of Prussia on the one
hand and among five groups of continental European countries
on the other. The groups are: Southeast (Switzerland,
Lombardy, Papal States, Austria, Hungary), West (France,
Belgium), Center (Germany [aggregated], the Netherlands), and
North (Finland, Norway, Sweden).
Sources: see Appendix; for Germany (aggregated) see Jacobs
and Richter, Großhandelspreise, p. 74.

43
Figure 4: Forecast Errors in Grain Prices
-60
-40
-20
0
20
40
60
26 28 30 32 34 36 38 40 42 44 46 48 50
ENGLAND
-60
-40
-20
0
20
40
60
26 28 30 32 34 36 38 40 42 44 46 48 50
FRANCE
-60
-40
-20
0
20
40
60
26 28 30 32 34 36 38 40 42 44 46 48 50
PRUSSIA
-60
-40
-20
0
20
40
60
26 28 30 32 34 36 38 40 42 44 46 48 50
SWEDEN
Notes: See text and Figure 2.
Sources: see Appendix.
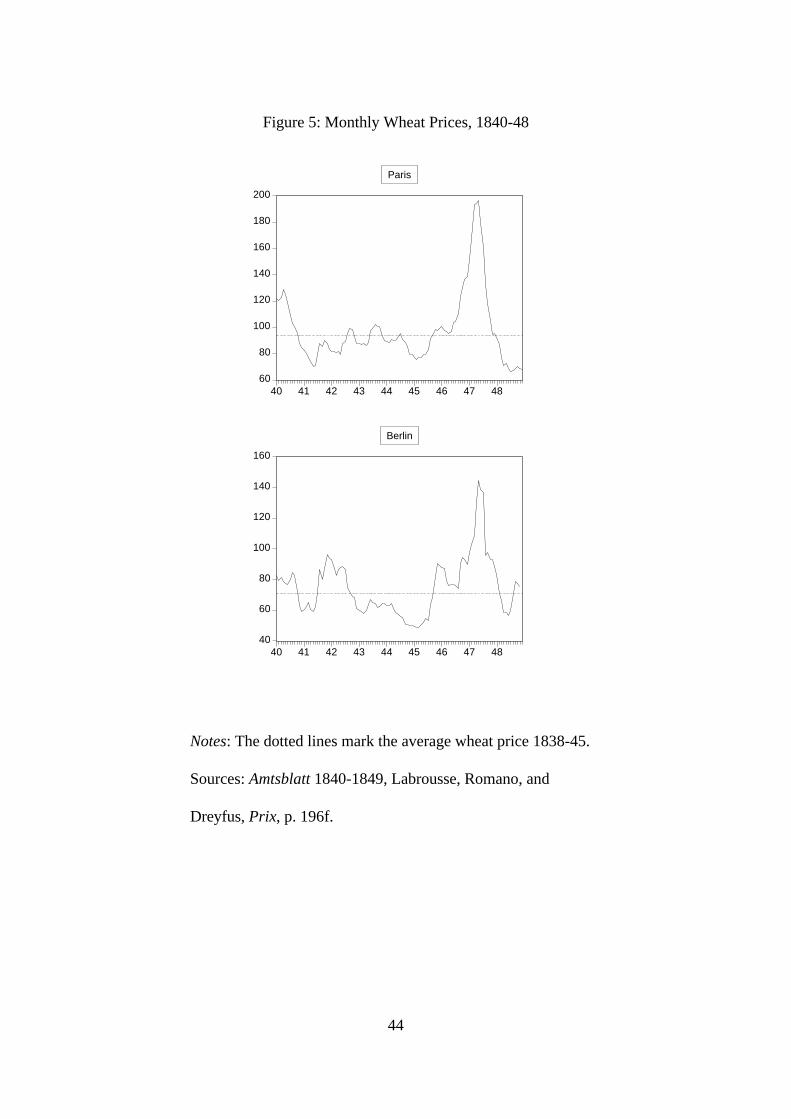
44
Figure 5: Monthly Wheat Prices, 1840-48
60
80
100
120
140
160
180
200
40 41 42 43 44 45 46 47 48
Paris
40
60
80
100
120
140
160
40 41 42 43 44 45 46 47 48
Berlin
Notes: The dotted lines mark the average wheat price 1838-45.
Sources: Amtsblatt 1840-1849, Labrousse, Romano, and
Dreyfus, Prix, p. 196f.

45
Figure 6: Shocks to Manufacturing, 1820-50
-30
-20
-10
0
10
20
30
42 43 44 45 46 47 48 49 50
AUSTRIA
-30
-20
-10
0
10
20
30
28 30 32 34 36 38 40 42 44 46 48 50
ENGLAND
-30
-20
-10
0
10
20
30
32 34 36 38 40 42 44 46 48 50
FRANCE
-30
-20
-10
0
10
20
30
42 43 44 45 46 47 48 49 50
HUNGARY
-30
-20
-10
0
10
20
30
34 36 38 40 42 44 46 48 50
THE NETHERLANDS (detrended)
-30
-20
-10
0
10
20
30
40 41 42 43 44 45 46 47 48 49 50
PRUSSIA
-30
-20
-10
0
10
20
30
28 30 32 34 36 38 40 42 44 46 48 50
SWEDEN
Notes: See text. All growth rates in percent. Prussia: textile
production only. The Netherlands: model includes trend.
Sources: see Appendix.

46

47
Table 1: Granger TestsCountry Direction Lag 1 Lag 2 Lag 3 Lag 4 Lag 5Austria Grain Prices → Manufacturing
Manufacturing → Grain prices0.050.70
0.070.45
0.120.70
0.080.89
0.140.86
England Grain Prices → ManufacturingManufacturing → Grain prices
0.130.55
0.070.89
0.090.12
0.05*0.20
0.100.36
France Grain Prices → ManufacturingManufacturing → Grain prices
0.060.28
0.01*0.50
0.01*0.61
0.060.89
0.170.66
Hungary Grain Prices → ManufacturingManufacturing → Grain prices
0.01*0.17
0.00*0.06
0.03*0.08
0.02*0.08
0.150.13
Netherlands
Grain Prices → ManufacturingManufacturing → Grain prices
0.140.40
0.240.74
0.180.40
0.160.34
0.200.37
Prussia Grain Prices → ManufacturingManufacturing → Grain prices
0.03*0.77
0.00*0.43
0.01*0.44
0.060.15
0.03*0.23
Sweden Grain Prices → ManufacturingManufacturing → Grain prices
0.00*0.20
0.00*0.44
0.00*0.61
0.01*0.46
0.02*0.13
Notes: P(F-Stat) for Granger tests at different lag lengths. All data are annual.
Numbers marked “*” allow rejection of the H0: ”no causality” at conventional
levels. Granger causality is commonly interpreted as meaning that the series that is
”causal” precedes the other series and contains information useful in predicting it.
Grain prices are in levels, production data are in growth rates computed as first
differences of the raw data in logs. Prussia: textile production only.
Sources: see Appendix.

48
Table 2: Equation (4) ttt
m
iitit REVpyy ε+λ+δ+β+α= −
=−∑ 1
1
ˆˆ
Austria England France Hungary Netherlands Prussia Sweden(i) (ii) (i) (ii) (i) (ii) (i) (ii) (i) (ii) (i) (ii) (i) (ii)
α 21.19***(6.33)
13.99*(2.25)
13.54**(2.31)
15.42**(2.65)
9.58(1.52)
5.54(0.83)
4.20***(3.79)
0.66(0.24)
7.74(1.07)
8.81(1.10)
31.78***(3.91)
23.18**(2.49)
10.87***(3.70)
11.05***(3.48)
1ˆ −ty -0.94 -0.92 -0.61 -0.54 -0.51 -0.45 -0.18 -0.11 -0.39 -0.38 -0.70 -0.65 -0.68 -0.71
2ˆ −ty -0.80 -0.56 -0.62 -0.59 -0.68 -0.48 0.58 -0.58 -0.14 -0.15 -0.76 -0.64 -0.34 -0.31
3ˆ −ty -0.63 -0.53 -0.27 -0.31 -0.18 -0.05 0.54 1.26 -0.18 -0.20 -0.09 -0.13 -0.37 -0.39
4ˆ −ty -0.33 -0.28 -0.32 -0.43 -0.39 -0.33 -0.21 0.20 -0.20 0.18 0.18 0.09 -0.16 -0.19
1−tp -0.22***(4.81)
-0.11(1.10)
-0.07(1.65)
-0.09**(2.18)
-0.16***(3.59)
-0.08*(1.80)
-0.09***(3.37)
-0.04(1.11)
-0.06(0.95)
-0.07(0.92)
-0.42***(4.11)
-0.29**(2.49)
-0.14***(3.07)
-0.15***(2.86)
REVt -9.82(1.63)
10.49***(3.17)
-12.38***(3.71)
-6.55*(1.88)
4.01(0.58)
-13.08**(2.77)
2.22(1.29)
Period 1835-1850
1835-1850
1820-1850
1820-1850
1825-1850
1825-1850
1835-1850
1835-1850
1820-1850
1820-1850
1833-1850
1833-1850
1820-1850
1820-1850
2R 0.64 0.66 0.28 0.36 0.39 0.64 0.46 0.53 0.18 0.15 0.57 0.59 0.49 0.48
Notes: HAC t-statistics (absolute) in brackets below coefficients. ***/**/* indicates significance at the 1/5/10 per cent level. In all cases the
AR(m=4) elements of the models are jointly significant at conventional levels (Wald-F-test). Q-tests (at lag 1 and larger) suggest no autocorrelation
of the residuals. In the case of Prussia we have used textile production only. The models for England, France, the Netherlands, and Sweden include a
linear and a quadratic trend term (not reported).
Sources: see Appendix.

49
Table 3: Agrarian, Industrial, and Political Shocks in Europe, 1845-48
Country
Average wheatprice 1838-45
grams finesilver perhectolitre
(i)
Wheat pricemax(1845-48)
grams finesilver perhectolitre
(ii)
No. of years1845-47
wheat price> average1838-45
(iii)
Wheat priceforecast errormax(1845-
48)over SE
(iv)
Priceshock
1845-48?
(v)
Industrialgrowth1848
(in per cent)
(vi)
Productionforecast
error 1848 over
SE (vii)
Productionshock 1848?
(viii)
Repressionbefore1848?
(ix)
Revolution1848?
(x)Austria 52.89 103.96 (47) 3 2.62 (47) yes -8.04 -2.49 yes yes yesBaden 76.96 136.57 (47) 3 2.31 (46) yes - - - no yesBavaria 70.02 127.28 (47) 3 2.74 (47) yes - - - yes yesBohemia 61.48 101.23 (47) 2 2.41 (46) yes - - - yes yesFrance 93.82 149.18 (47) 2 2.71 (47) yes -10.64 -2.63 yes no yesHamburg 67.11 108.72 (47) 2 2.45 (46) yes - - - no yesHesse-Darmstadt
76.68 119.69 (47) 3 2.24 (45) yes - - - no yes
Hungary 39.01 92.34 (47) 3 2.38 (47) yes -4.93 -2.02 yes yes yesLombardy 88.32 119.13 (47) 2 2.19 (47) yes - - - yes yesMecklenburg-Schw.
72.91 110.89 (47) 2 2.27 (46) yes - - - yes yes
Papal States 73.99 105.12 (47) 2 2.56 (47) yes - - - no yesPrussia 71.20 110.68 (47) 2 2.41 (47) yes -24.02 -2.48 yes yes yesSaxony 73.30 125.21 (47) 2 2.23 (47) yes - - - yes yesSwitzerland 87.88 146.72 (47) 2 2.76 (47) yes - - - no yesWürttemberg 75.90 128.70 (47) 3 2.57 (46) yes - - - no yes(...)
Table 3 to be continued on following page!

50
(...) Table 3 continued from previous page!
Country
Average wheatprice 1838-45
grams finesilver perhectolitre
(i)
Wheat pricemax(1845-48)
grams finesilver perhectolitre
(ii)
No. of years1845-47
wheat price> average1838-45
(iii)
Wheat priceforecast errormax(1845-
48)over SEb
(iv)
Priceshock
1845-48?
(v)
Industrialgrowth1848
(in per cent)
(vi)
Productionforecast
error 1848 over
SE (vii)
Productionshock 1848?
(viii)
Repressionbefore1848?
(ix)
Revolution1848?
(x)
Belgium 93.80 140.13 (47) 2 2.54 (47) Yes - - - no (yes)Bremen 76.12 109.51 (47) 2 2.59 (47) Yes - - - no (yes)Brunswick 62.33 100.29 (47) 2 2.23 (47) Yes - - - no (yes)Denmark 66.32 81.51 (47) 2 1.16 (46) no - - - no (yes)Netherlands 82.58 135.99 (47) 2 2.33 (47) yes -4.06 0.57 no no (yes)Oldenburga 52.13 79.34 (47) 3 2.51 (45) yes - - - no (yes)
England 115.31 134.68 (47) 1 1.81 (47) no 3.94 1.09 no no NoFinland 73.57 73.69 (45) 1 -0.34 (46) no - - - yes NoNorway 89.28 119.74 (47) 2 2.13 (47) yes - - - no NoRussiaa 50.72 44.12 (48) 0 -0.10 (46) no - - - yes NoSpain 105.34 141.27 (47) 2 1.75 (47) no - - - yes noSweden 75.76 81.44 (45) 1 1.52 (45) no 1.69 1.08 no no no
Notes: a Rye. b SE – standard error of forecast in selected year.
Sources: see Appendix