Economic and Financial Profile of Québec - 2012 Edition ECONOMIC AND FINANCIAL PROFILE OF QUÉBEC...
30
2012 Economy Public Finances Financing ECONOMIC AND FINANCIAL PROFILE OF QUÉBEC
Transcript of Economic and Financial Profile of Québec - 2012 Edition ECONOMIC AND FINANCIAL PROFILE OF QUÉBEC...

2012
Economy Public Finances
Financing
ECONOMIC AND FINANCIAL
PROFILEOF QUÉBEC

2012 Edition | EConoMiC And FinAnCiAL PRoFiLE oF QUÉBEC
This document is produced by the ministère des Finances du Québec.
The figures shown in this document are those available as of June 1st, 2012.
For information, contact: Secrétariat général et coordination ministérielle
12, rue Saint-Louis, bureau 2.08 Québec (Québec) G1R 5L3 Phone: 418 691-2250 Fax: 418 646-0923 Email: [email protected]
This document is available on the Web at: www.finances.gouv.qc.ca
Subscription available
Legal deposit Bibliothèque et Archives nationales du Québec June 2012 ISBN 978-2-550-65120-8 (Print) ISBN 978-2-550-65121-5 (PDF)
© Gouvernement du Québec
sECtions
1. Economy
QuéBEc, AN ExcELLENT BuSINESS ENvIRoNmENT
2. Public financEs
QuéBEc, RIGouRouS mANAGEmENT oF PuBLIc FINANcES
3. financing
QuéBEc, AN oNGoING PRESENcE oN cANADIAN AND INTERNATIoNAL mARkETS
Québec’s economy: creative, innovative,competitive and open to the world
2012Economic and financial
profilEof québEc

QUÉBEC iN 2012
1. the largest province in canada by surface area, Québec ranks second on the basis of population with more than 8 million people.
2. Québec’s gross domestic product is $335 billion, representing almost 20% of canada’s economy.
3. a natural gateway to north america, Québec has access to a market of 460 million consumers through its participation in the north american free trade agreement (nafta).
4. public finances are rigourously managed. the Québec government has undertaken to return to fiscal balance by 2013-2014 while maintaining the Quality of public services.
5. investing in Québec means enjoying competitive tax treatment and low location and operating costs for businesses.
6. Québec stands out with its highly educated workforce and remarkable development potential in advanced sectors and the development of natural resources, highlighted particularly in the plan nord.
Today’s Québec
a dynamic economy, a vasT TerriTory, abundanT naTural resources, rigorous managemenT of public finances, remarkable human capiTal
2012 Edition | EConoMiC And FinAnCiAL PRoFiLE oF QUÉBEC


5 Economic outlook
6 An economy driven by its human capital
7 An innovative economy
8 An economy focused on high technology
10 A competitive economy
11 An economy open to the world
12 Abundant natural resources
14 the Plan nord
15 Hydro-Québec
sECtion 1
Economy
A place of growth
and investment

Economic outlook
québEc’s Economy continuEs to grow Québec has a dynamic and resilient economy that emerged from the last recession in good shape. Québec’s economy continued to grow in 2011, with real GDP posting a gain of 1.7%, after rising by 2.5% in 2010.
Real GDP growth is expected to continue in 2012, amounting to 1.5%, and then accelerate to 1.9% in 2013.
• Strong domestic demand will continue to sustain economic growth in Québec in 2012 and 2013. It will be based both on the strength of household consumption, supported by job creation, and the significant expected increase in business investment.
• Québec’s exports will be stimulated by the growth of its trading partner and robust global demand for natural resources.
ECONOMiC iNDiCATORS (percentage change)
QUÉBEC 2011 2012 2013real gross domestic product 1.7 1.5 1.9
gross domestic product 4.9 3.8 4.1
real consumption 1.7 1.4 1.9
housing starts (thousands) 48.4 45.7 41.6
real business non-residential investment 10.3 4.6 4.6
real total exports 2.0 3.4 3.4
unemployment rate 7.8 8.0 7.9
job creation (thousands) 38.5 21.3 35.7
consumer price index 3.0 2.5 1.8
CANADA 2011 2012 2013treasury bills – 3 months (%) 0.9 0.9 1.0
bonds – 10 years (%) 2.8 2.3 3.0
canadian dollar (us cents) 101.3 98.9 97.1
Labour market in good shape Québec’s labour market experienced positive growth in 2011.
• for the year as a whole, 38 500 jobs were created in Québec, with the unemployment rate falling by two-tenths, to 7.8%.
the continuation of economic growth should result in the creation of 21 300 jobs in 2012 and 35 700 in 2013. the labour market’s good performance will thus help keep the unemployment rate at about 8.0% in 2012 and 2013, a historically low level.
SOURCES: INSTITUT DE LA STATISTIQUE DU QUÉBEC, STATISTICS CANADA AND MINISTÈRE DES FINANCES DU QUÉBEC.
QUÉBEC REAL GDP (percentage change)
2.0
2.5
1.71.5
1.9
1982-2009 2010 2011 2012 2013
1983 1993 1998 2003 2008 2013
15
13
11
9
7
5
8.57.8 7.9
SOURCES: STATISTICS CANADA AND MINISTÈRE DES FINANCES DU QUÉBEC.
UNEMPLOYMENT RATE IN QUÉBEC (per cent)
1988
SOURCES: INSTITUT DE LA STATISTIQUE DU QUÉBEC, STATISTICS CANADA, ONTARIO MINISTRY OF FINANCE AND IHS GLOBAL INSIGHT.
REAL GDP – QUÉBEC AND ITS MAIN PARTNERS(index, 4th quarter of 2007 = 100)
Québec Canada
United States Ontario
2007 2008 2009 20112010
104.7103.5
101.1
100.8

Economy6 2012 Edition | EConoMiC And FinAnCiAL PRoFiLE oF QUÉBEC
0.930.90
0.880.880.88
0.820.58
0.71
0.5 0.6 0.7 0.8 0.9 1.0 1.1
United States
United Kingdom
Japan
Italy
RussiaCanadaFrance
Québec
1.02Germany
1983 1985 1987 1989 1991 1993 1995 1997 1999 2001 2003 2005
Québec OntarioCanada G8 averageOECD average
2009
3.0
2.5
2.0
1.5
1.02007
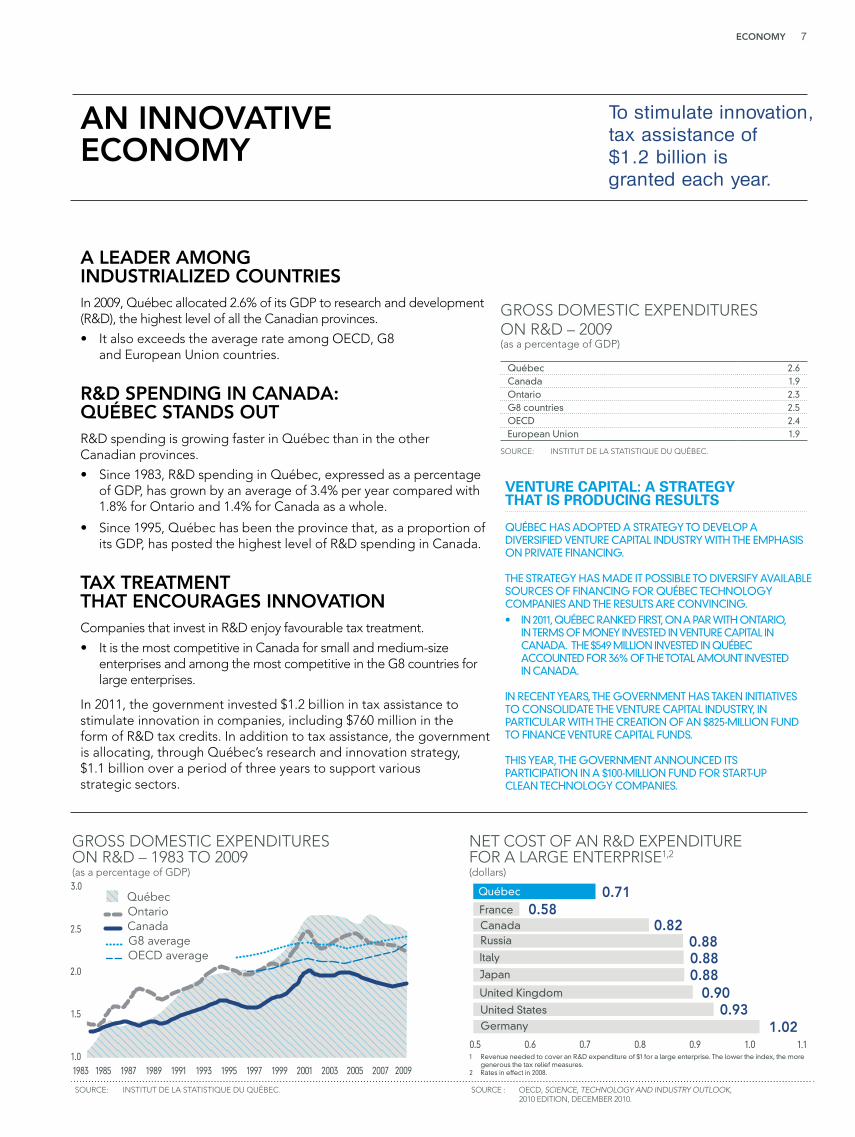
GROSS DOMESTIC EXPENDITURES ON R&D – 1983 TO 2009 (as a percentage of GDP)
NET COST OF AN R&D EXPENDITUREFOR A LARGE ENTERPRISE1,2
(dollars)
SOURCE: INSTITUT DE LA STATISTIQUE DU QUÉBEC. SOURCE : OECD, SCIENCE, TECHNOLOGY AND INDUSTRY OUTLOOK, 2010 EDITION, DECEMBER 2010.
1 Revenue needed to cover an R&D expenditure of $1 for a large enterprise. The lower the index, the more generous the tax relief measures.2 Rates in effect in 2008.
38.1%
5.5%0 to 8 years
Post-secondary studies diploma or certificate
11.8%Partial
secondary studies
8.3%Partial
post-secondary studies
15.2%Completed
secondary school
21.0%Universitydegree
DISTRIBUTION OF QUÉBEC’S WORKFORCE BY LEVEL OF SCHOOLING – 2011(as a percentage of the population age 15 to 64)
SOURCE: STATISTICS CANADA.
Québec Ontario BritishColombia
Alberta Canada
46.7
37.433.8
26.1
35.9
KNOWLEDGE OF TWO OR MORE LANGUAGES (as a percentage of total population)
SOURCE: STATISTICS CANADA, 2006 CENSUS.
10.5
36.2
6.6
30.8
6.0
27.8
3.8
22.3
6.5
29.4
BilingualTrilingual or more
an Economy drivEn by its human caPital
an Economy that wElcomEs qualifiEd workErs and thE ParticiPation of ExPEriEncEd workErsQuébec attracts more than 50 000 immigrants a year from every country, contributing to the depth of its qualified labour pool. It has entered into agreements with ontario and France to promote labour mobility.
Québec also relies on the know-how of experienced workers. Accordingly, a tax credit on earned income was put in place as of 2012 for workers age 65 or over.
In addition, employers that make use of workers age 65 or over may claim, as of 2013, a reduction in their contributions to the Health Services Fund.
moreover, businesses receive a refundable tax credit for manpower training in the manufacturing, mining and forestry sectors.
a PoPulation fluEnt in many languagEs• Almost half of Québec’s population speaks at least two languages: 36% are bilingual and 11% are trilingual.
• The world’s second largest French-speaking city after Paris, montréal is a cosmopolitan and culturally rich metropolis that is home to at least 80 ethnic groups. The metropolitan area has close to four million inhabitants.
Québec’s workforce consists of skilled, educated and experienced workers.
an educated workforce
QUÉBEC hAS A lARgE pOOl Of EDUCATED wORkERS.
• 83% Of wORkERS iN QUÉBEC hAvE A SECONDARy OR pOST-SECONDARy SChOOl DiplOMA.
• 21% Of ThE wORkiNg AgE pOpUlATiON hOlDS A UNivERSiTy DEgREE.
Economy 7
0.930.90
0.880.880.88
0.820.58
0.71
0.5 0.6 0.7 0.8 0.9 1.0 1.1
United States
United Kingdom
Japan
Italy
RussiaCanadaFrance
Québec
1.02Germany
1983 1985 1987 1989 1991 1993 1995 1997 1999 2001 2003 2005
Québec OntarioCanada G8 averageOECD average
2009
3.0
2.5
2.0
1.5
1.02007
GROSS DOMESTIC EXPENDITURES ON R&D – 1983 TO 2009 (as a percentage of GDP)
NET COST OF AN R&D EXPENDITUREFOR A LARGE ENTERPRISE1,2
(dollars)
SOURCE: INSTITUT DE LA STATISTIQUE DU QUÉBEC. SOURCE : OECD, SCIENCE, TECHNOLOGY AND INDUSTRY OUTLOOK, 2010 EDITION, DECEMBER 2010.
1 Revenue needed to cover an R&D expenditure of $1 for a large enterprise. The lower the index, the more generous the tax relief measures.2 Rates in effect in 2008.
an innovativE Economy
a lEadEr among industrializEd countriEsIn 2009, Québec allocated 2.6% of its GDP to research and development (R&D), the highest level of all the canadian provinces.
• It also exceeds the average rate among oEcD, G8 and European union countries.
r&d sPEnding in canada: québEc stands outR&D spending is growing faster in Québec than in the other canadian provinces.
• Since 1983, R&D spending in Québec, expressed as a percentage of GDP, has grown by an average of 3.4% per year compared with 1.8% for ontario and 1.4% for canada as a whole.
• Since 1995, Québec has been the province that, as a proportion of its GDP, has posted the highest level of R&D spending in canada.
tax trEatmEnt that EncouragEs innovationcompanies that invest in R&D enjoy favourable tax treatment.
• It is the most competitive in canada for small and medium-size enterprises and among the most competitive in the G8 countries for large enterprises.
In 2011, the government invested $1.2 billion in tax assistance to stimulate innovation in companies, including $760 million in the form of R&D tax credits. In addition to tax assistance, the government is allocating, through Québec’s research and innovation strategy, $1.1 billion over a period of three years to support various strategic sectors.
Venture capitaL: a strategy that is producing resuLts Québec has adopted a strategy to develop a diversified venture capital industry with the emphasis on private financing.
the strategy has made it possible to diversify available sources of financing for Québec technology companies and the results are convincing. • in 2011, Québec ranked first, on a par with ontario, in terms of money invested in venture capital in canada. the $549 million invested in Québec accounted for 36% of the total amount invested in canada.
in recent years, the government has taken initiatives to consolidate the venture capital industry, in particular with the creation of an $825-million fund to finance venture capital funds.
this year, the government announced its participation in a $100-million fund for start-up clean technology companies.
to stimulate innovation,tax assistance of $1.2 billion is granted each year.
GRoSS DomESTIc ExPENDITuRES oN R&D – 2009 (as a percentage of GDP)
Québec 2.6canada 1.9ontario 2.3g8 countries 2.5oecd 2.4european union 1.9
SouRcE: INSTITuT DE LA STATISTIQuE Du QuéBEc.

Economy8 2012 Edition | EConoMiC And FinAnCiAL PRoFiLE oF QUÉBEC
an Economy focusEd on high tEchnology
Advanced technologies make a major contribution to Québec’s economy.
lifE sciEncEsThe life sciences industry employs nearly 26 400 people in Québec in more than 340 companies.
The pharmaceutical sector alone represents more than 8 100 jobs in Québec. Nine of the world’s ten largest pharmaceutical companies, such as Pfizer, merck, Sanofi-aventis and Boehringer Ingelheim, have facilities in Québec. In addition, Québec accounts for 30% of canada’s output of pharmaceutical products and drugs.
The medical devices industry is enjoying robust growth. over the past five years, more than $130 million has been invested in this sector in Québec. The industry has more than 115 companies, most of them SmEs, employing approximately 5 500 people. many multinational companies have opened facilities in Québec, including Becton Dickinson, medtronic, Elekta, Nobel Biocare, Zimmer and otto Bock.
• In 2008, medtronic acquired cryocath, a Québec company, for $400 million, providing it with innovative technology for the safe and permanent treatment of a type of cardiac arrhythmia by cryoablation. The technology has been approved in Europe and in December 2010, the company received authorization to market it in the united States.
Québec also holds a major position in North America in the biotechnology sector. more than half of Québec biotechnology firms specialize in human health.
• In December 2010, Theratechnologies, a Québec biotechnology company, received Food and Drug Administration (FDA) approval for EGRIFTA®, which is still the first and only treatment for excess abdominal fat in patients with lipodystrophy associated with HIv.
Furthermore, some companies in the life sciences sector specialize in the manufacture of natural health products, such as Neptune Technologies & Bioressources, which markets, under the Nko® brand, an oil rich in omega-3 sourced from processing krill.
aeronautics the aeronautics sector employs more than 42 000 workers in Québec. the sector had sales of $11.7 billion in 2011. aircraft and parts account for 16.7% of the volume of Québec’s international exports of goods.
• more than 50% of canada’s aeronautics workforce is in Québec.
• nearly 55% of the aeronautical products delivered by canada come from Québec.
Québec’s aeronautics industry includes more than 200 companies specialized in making airplanes, helicopters, engines, parts and flight simulators. many of these occupy a dominant position on the international scene:
• bombardier aerospace, the world’s third-largest manufacturer in terms of sales;
• bell helicopter textron canada, major player in the manufacture of civil helicopters with one third of the world helicopter fleet;
• pratt & whitney canada, leader in the design and production of engines for regional aircraft and helicopters and in small and medium power turbines for business aircraft.
accordingly, the greater montréal region is recognized internationally as one of the major world centres of aeronautics, along with seattle and toulouse.
Economy 9
muLtimedia
in 15 years, Québec has become canada’s leader in video games creation. over the last decade, the industry in Québec has experienced annual workforce growth in excess of 20%.
many large international companies have chosen Québec to carry out their activities, particularly because of the talent of its creators, the reputation of the games that have been developed here and its advantageous tax system. thus, over the years, the following companies have opened studios in Québec, many being located in montréal:
• activision, babel, electronic arts, funcom, gameloft, sQuare enix (eidos), thQ, ubisoft
and warner bros.
moreover, many Québec companies, such as behaviour interactive, frima studio and sava transmedia, now occupy a significant position in the video game market.
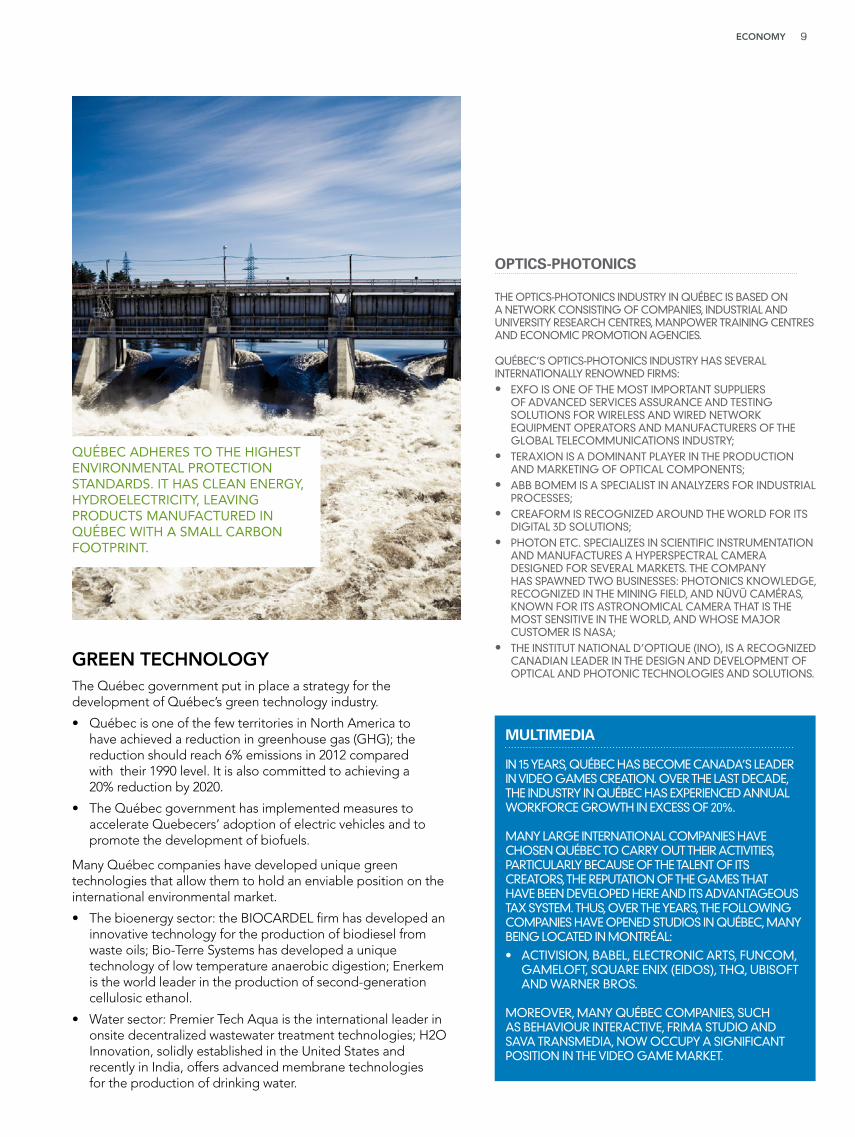
grEEn tEchnologyThe Québec government put in place a strategy for the development of Québec’s green technology industry.
• Québec is one of the few territories in North America to have achieved a reduction in greenhouse gas (GHG); the reduction should reach 6% emissions in 2012 compared with their 1990 level. It is also committed to achieving a 20% reduction by 2020.
• The Québec government has implemented measures to accelerate Quebecers’ adoption of electric vehicles and to promote the development of biofuels.
many Québec companies have developed unique green technologies that allow them to hold an enviable position on the international environmental market.
• The bioenergy sector: the BIocARDEL firm has developed an innovative technology for the production of biodiesel from waste oils; Bio-Terre Systems has developed a unique technology of low temperature anaerobic digestion; Enerkem is the world leader in the production of second-generation cellulosic ethanol.
• Water sector: Premier Tech Aqua is the international leader in onsite decentralized wastewater treatment technologies; H2o Innovation, solidly established in the united States and recently in India, offers advanced membrane technologies for the production of drinking water.
optics-photonics
the optics-photonics industry in Québec is based on a network consisting of companies, industrial and university research centres, manpower training centres and economic promotion agencies.
Québec’s optics-photonics industry has several internationally renowned firms:• exfo is one of the most important suppliers of advanced services assurance and testing solutions for wireless and wired network eQuipment operators and manufacturers of the global telecommunications industry; • teraxion is a dominant player in the production and marketing of optical components;• abb bomem is a specialist in analyzers for industrial processes;• creaform is recognized around the world for its digital 3d solutions; • photon etc. specializes in scientific instrumentation and manufactures a hyperspectral camera designed for several markets. the company has spawned two businesses: photonics knowledge, recognized in the mining field, and nüvü caméras, known for its astronomical camera that is the most sensitive in the world, and whose major customer is nasa;• the institut national d’optiQue (ino), is a recognized canadian leader in the design and development of optical and photonic technologies and solutions.
Québec aDheReS to the hIGheSt envIRonmental PRotectIon StanDaRDS. It haS clean eneRGy, hyDRoelectRIcIty, leavInG PRoDuctS manufactuReD In Québec wIth a Small caRbon footPRInt.

Economy10 2012 Edition | EConoMiC And FinAnCiAL PRoFiLE oF QUÉBEC
BUSINESS LOCATION AND OPERATING COSTS1 – 2012 (index, United States = 100)
COMPARISON OF MARGINAL EFFECTIVE TAX RATES (METR)1 ON INVESTMENT – 2014 (per cent)
SOURCES: KPMG AND MINISTÈRE DES FINANCES DU QUÉBEC.
1 METRs are indicators of the impact of the tax system on new investments. They represent the effect of all tax expenses and rules affecting the return on invested capital. In particular, they take into account the tax on capital, sales tax, corporate income tax, depreciation rules and rates as well as accounting methods for inventories.
SOURCE: MINISTÈRE DES FINANCES DU QUÉBEC.
1 Average of 19 activity sectors – Québec and major industrialized countries.
60 70 80 90 100 110
Québec
13.8
Canada International
Canadian average
British Columbia
OntarioAlberta Small open
economies
OECD United States
18.3 16.2
27.1
18.1 17.720.4
34.7
Japan
United States
G7
Germany
France
Canada
United Kingdom
Québec
Italy
109.4101.1100.0
99.097.9
96.195.094.594.3
a comPEtitivE Economy
Low business Location and operating costs QUÉBEC’S BUSiNESS lOCATiON AND OpERATiNg COSTS ARE COMpETiTivE wiThiN CANADA AND COMpARE wEll wiTh ThOSE iN ThE MAjOR iNDUSTRiAlizED COUNTRiES.
ACCORDiNg TO ThE MOST RECENT figURES, ThESE COSTS ARE 5.7% lOwER ThAN iN ThE UNiTED STATES AND 4.8% BElOw ThE AvERAgE Of ThE g7 COUNTRiES.
iN pARTiCUlAR, QUÉBEC STANDS OUT wiTh COMpETiTivE lABOUR COSTS AS wEll AS A COMpETiTivE TAx SySTEM.
statistics canada’s survey on private and public investment (march 2012) indicates that the value of non-residential investment in Québec should rise by 7.3% in 2012.
manufacturing investments will exceed $5 billion for the second year in a row.
a comPEtitivE tax systEm for invEstmEnt
companies in Québec operate under a globally competitive tax system for new investments.
Québec’s tax rate on investment is lower than the average rates of the united States, the G7 countries and oEcD countries. moreover, it is one of the lowest in canada, mainly due to:
• an investment tax credit on acquisitions of manufacturing and processing equipment;
• the refund of the sales tax paid on capital goods.
Many tax incentives enable Québec businesses to reduce their operating costs.

Economy 11
an Economy oPEn to thE world
Québec is developing and diversifying its export markets.
SHARES OF INTERNATIONAL EXPORTS ACCORDING TO TRADING PARTNER(as a percentage of international exports of goods, in nominal terms)
SOURCES: INSTITUT DE LA STATISTIQUE DU QUÉBEC AND MINISTÈRE DES FINANCES DU QUÉBEC.
BREAKDOWN OF EXPORTSBY PRODUCT CATEGORY – 2011 (as a percentage of international exports of goods, in real terms)
SOURCES: INSTITUT DE LA STATISTIQUE DU QUÉBEC AND MINISTÈRE DES FINANCES DU QUÉBEC.
United States
84.577.6
67.6
Europe
9.2 12.2 14.6
Other countries
6.2 10.217.8
20062011
200116.6%
29.5%Other
Machinery and equipment
3.2%Automobiles and parts
16.0%Primary metals
8.4%Pulp and paper
16.7%Aircraft and parts
3.0%Metals and minerals
6.6%Chemical products
Note: Figures have been rounded off, so the total may not correspond to the total indicated.
an Economy intEgratEd with thE north amErican markEtQuébec enjoys an advantageous geographical situation. It is one of the major gateways to the huge North American market. • Québec has more than 3 000 km of coastline. The Saint Lawrence Seaway, consisting of the gulf, estuary and Saint Lawrence River, provide preferred access for merchandise trade in North America.
• There are 55 airports in Québec, including two international platforms, namely montréal’s Pierre-Elliott-Trudeau international airport (third-largest in canada) and Québec city’s Jean Lesage international airport.
Thanks, among other things, to the Free Trade Agreement (FTA) and the North American Free Trade Agreement (NAFTA), Québec’s international exports have grown from 21% of nominal GDP in 1988 to 26% in 2011. Interprovincial exports represent 19% of Québec’s GDP.
increasingLy diVersified exports the products exported by Québec and their destinations are increasingly diverse. although the united states remain Québec’s largest trading partner, with 67.6% of exports in 2011, a growing share of Québec’s exports is shipped to high-growth countries such as china, india, brazil, mexico and south korea.
between 2001 to 2011, Québec’s exports to europe and countries other than the united states have grown steadily, their proportion rising:
• from 9.2% to 14.6% to europe;
• from 6.2% to 17.8% to other countries.
the products exported by Québec in 2011 are also diversified:
• aircraft and parts, the top exports, accounted for 16.7% of exports;
• machinery and eQuipment represented 16.6%;
• primary metals accounted for 16.0%. Québec’s export outlook is very encouraging, in particular because of growing demand from emerging economies for Québec’s natural resources.
Québec’s ports
Québec has five international ports. in particular:• the port of montréal, the most direct intermodal link between the industrial heart of north america and markets of northern europe and the mediterranean;• the port of sept-Îles, which is the largest ore port in north america. - this port’s capacity will reach 50 million tonnes per year thanks to investments of $220 million for the construction of a deep-water multi-user wharf.

Economy12 2012 Edition | EConoMiC And FinAnCiAL PRoFiLE oF QUÉBEC
RISE IN COMMODITY PRICES – BETWEEN 2009 AND 2011(per cent)
MINING PRODUCTION IN QUÉBEC (billions of dollars, in nominal terms)
SOURCE: BLOOMBERG. SOURCE: NATURAL RESOURCES CANADA.
0 50 100 150
Iron ore
Copper
Aluminum
Zinc
Gold
Nickel
116.0
70.1
61.5
55.2
43.2
31.8
1981 1986 1991 1996 2001 2006 2011
7
6
4
2
0
5
3
1
8
abundant natural rEsourcEs
strong global dEmand for raw matErials: an oPPortunity for québEc
The strength of global demand for raw materials over the last two years has resulted in rapid growth of the prices of the main ores extracted or processed in Québec.
• Between 2009 and 2011, prices have increased by 116.0% for iron, 70.1% for copper, 61.5% for gold, 55.2% for nickel, 43.2% for aluminum and 31.8% for zinc.
This demand is reflected in the value of mining output in Québec, which has almost doubled between 2005 and 2011.
• The natural resources sector thus represents, in 2011, close to 23% of the volume of Québec’s international exports of goods.
Québec is a major player on the aluminum and iron markets. In 2011, its exports accounted for more than 80% of canadian exports of aluminum and more than 40% of iron ore exports.
In addition, Québec’s importance on the nickel and zinc markets should grow over the coming years, as these metals are among those most in demand.
GIven the SIGnIfIcant onGoInG mInInG InveStmentS, mInInG PRoDuctIon ShoulD contInue to make GaInS oveR the next few yeaRS.

Economy 13
natural resources account for close to one quarter of Québec’s international exports.
mining resources Québec stands apart with its remarkable mining potential, in particular development potential for iron, zinc, nickel, silver and gold.
in 2011, mining companies invested a record $2.7 billion in Québec, a 5.6% increase from 2010. in 2012, investments are expected to hit a new peak of $4.4 billion, an increase of 62% from 2011.1
the opening up of northern Québec is an opportunity for the mining industry, because it offers very attractive development prospects.
1 statistics canada, Public and Private Investment in Canada, Intentions, march 2012.
forest resources A COUNTRy Of lAkES AND RivERS, QUÉBEC iS AlSO A lAND Of fORESTS. iNDEED, QUÉBEC’S fORESTS ACCOUNT fOR 20% Of CANADA’S AND 2% Of ThE wORlD’S fORESTS.
QUÉBEC’S fORESTS ARE MANAgED RESpONSiBly.
• ThEy ARE MANAgED TO ENSURE ThEiR lONg-TERM viABiliTy AND SUSTAiNABlE DEvElOpMENT.
• ThE fOREST iNDUSTRy iS pUTTiNg iNNOvATiON AND CREATiviTy TO wORk wiTh ThE DEvElOpMENT AND MARkETiNg Of high vAlUE-ADDED pRODUCTS.
•

Economy14 2012 Edition | EConoMiC And FinAnCiAL PRoFiLE oF QUÉBEC
continuing the deVeLopment of the pLan nord
the government is continuing its initiatives to oversee the development of the plan nord and ensure the success of its implementation.• a new government corporation, the société du plan nord, will be formed to coordinate the implementation of public investments.• a new subsidiary of investissement Québec, ressources Québec, offers financial solutions and support to companies wishing to invest in the mining and hydrocarbons sectors. with a portfolio of $1.2 billion, it intervenes and takes eQuity stakes in projects on its own behalf and for the government.
thE Plan nord the Plan nord, the project of ageneration, aims at developingnorthern Québec for the benefit of Québec as a whole.
a hugE PotEntial to bE dEvEloPEd sustainably
The Plan Nord covers an immense and majestic territory. It encompasses almost 1.2 million km2, i.e. approximately 72% of the area of Québec. It boasts vast hydroelectric, mining and forestry potential as yet untapped. Indeed, the Québec government has launched the Plan Nord to promote the development of these natural resources.• major investments in transportation infrastructure will be made
to open up the territory and foster the emergence of new development projects.
• Prospecting activities will be undertaken to promote and attract private investment in the territory of the Plan Nord.
invEstmEnts of morE than $80 billion ovEr 25 yEarsunprecedented development is expected in this territory thanks to public and private investment that may exceed $80 billion, supporting on average about 20 000 jobs per year for 25 years.
The Plan Nord follows a sustainable development model that will help develop the resources available in the territory while protecting the environment and ecosystems.
• To this effect, the government has undertaken to set aside 50% of the territory of the Plan Nord for non-industrial purposes, i.e. environmental protection and biodiversity conservation.
the GoveRnment announceD StuDIeS foR thRee majoR InfRaStRuctuRe PRojectS: natuRal GaS SeRvIce foR the côte-noRD, an electRIcIty tRanSmISSIon lIne to nunavIk anD a RaIl lInk connectInG the PoRt of SePt-ÎleS anD the labRaDoR tRouGh.
new funding for the pLan nord fund to support the implementation of its northern Québec development strategy, the government set up the plan nord fund, a new special fund supplied chiefly by the tax spinoffs attributable to investments in the territory.

Economy 15
MAJOR PRODUCERS OF HYDROELECTRICITY IN THE WORLD – 2011 (terawatt hours)
COMPARATIVE INDEX OF ELECTRICITY PRICES – RESIDENTIAL CUSTOMERS (consumption: 1 000 kWh/month)
SOURCES: HYDRO-QUÉBEC AND ASSOCIATION INTERNATIONALE POUR L’HYDROÉLECTRICITÉ (IHA).
SOURCE : HYDRO-QUÉBEC, COMPARISON OF ELECTRICITY PRICES IN MAJOR NORTH AMERICAN CITIES, 2011.
Note: Monthly invoices excluding taxes. Rates in force on April 1, 2011.Note: Québec’s production does not include supplies from Churchill Falls.
Mon
tréal
100
Win
nipe
g
107
Seat
tle
113
Vanc
ouve
r
113
Mia
mi
133
Otta
wa
161
St. J
ohn'
s
182
Detro
it
188
Toro
nto
189
Halif
ax
200
Bost
on
233
Calg
ary
256
New
York
325
China Brazil United States
Québec RussiaRest ofCanada
Norway
663
450
325
191 182 153 122
hydro-québEc the La Romaine complexis one of the country’s largest infrastructure projects with investments of $6.5 billion.
HYDRo-QuéBEc – 2011 HIGHLIGHTS (millions of dollars)
income 12 392
net earnings 2 611
total assets 69 637
staff level (persons) 22 501
installed capacity (mw) 36 971
SouRcE: HYDRo-QuéBEc’S 2011 ANNuAL REPoRT.
a Pillar in favour of sustainablE dEvEloPmEnt in québEc Québec has one of the most abundant supplies of water in the world. There are more than 130 000 watercourses. more than 40% of canada’s water resources lie within its territory. The Québec government has developed this potential since the founding, in 1944, of Hydro-Québec, a government corporation of which it is the sole shareholder.
Hydro-Québec produces, transmits and distributes electricity. It develops essentially renewable energy, especially hydro-electricity. Its production base includes in particular 60 hydroelectric power stations, with installed capacity of 36 971 megawatts (mW). Hydro-Québec supports the development of other power options – like wind power and biomass – through its purchases from private producers.
For a number of years, Hydro-Québec has promoted energy efficiency and implemented programs that produce energy savings for its customers.
In 2011, hydro power accounted for 98% of Hydro-Québec’s electricity production. This is a green and renewable source of energy with a high degree of operating flexibility and a very small greenhouse gas (GHG) footprint. In comparison, a coal-fired plant emits 100 times more. As a result, the electricity sector represents only 0.6% of GHG emissions in Québec.
Hydro-Québec is therefore actively pursuing development of Québec’s hydroelectric potential. The 2006-2015 Québec energy strategy and Hydro-Québec 2009-2013 Strategic Plan call for the addition of 4 500 mW of hydro power. Two major projects, which are among the largest infrastructure projects in canada, are underway.
• construction of the Eastmain-1-A and Sarcelle power plants (918 mW), featuring a construction budget of $5.0 billion, with commissioning to be completed in 2012. - The project is a great success, the French observatoire des énergies renouvelables describing it as a model regarding the integration of environmental constraints.
• construction of the La Romaine complex (1 550 mW), with planned investment of $6.5 billion and which has reached its cruising speed. - The project includes the development of four power plants to provide annual production of 8.0 terawatt hours. - more than 1 100 workers were at work on the site in may 2012; their number could exceed 2 300 in 2014. - The facilities will be brought on stream gradually from 2014 to 2020.
these major renewable energy projects will enable hydro-Québec to secure Quebecers’ supply of electricity and create spare capacity to accommodate new wealth-creating businesses, while optimizing its exports.
hydro-Québec’s transmission network, the largest in north america, includes 33 630 km of lines with interconnections with the neighbouring provinces and the northeastern united states. hydro-Québec is continuing discussions on its possible participation in a planned underground transmission line between Québec and new york state. with its new hydroelectric projects, hydro-Québec intends to consolidate its place on these markets and market its surplus. hydro-Québec’s electricity production also puts Québec in fourth place among the world’s producers of hydroelectricity and allows consumers in Québec to enjoy electricity rates among the lowest in north america.

17 Rigourous management of public finances17 stay the course towards fiscal balance and debt reduction
A collective effort
18 A funding plan for the major government missions
Controlling spending
19 diversified revenue sources
the Canadian federation
20 Long-term management of infrastructure investments
21 the Generations Fund, a positive step for our future21 debt repayment: a priority for the government
Banking on water, Québec’s blue gold
sECtion 2
Public financEs
A rigourous management of public finances

rigourous managEmEnt of Public financEs
stay thE coursE towards fiscal balancE and dEbt rEduction Since 2009-2010, the Québec government has taken significant steps to support the economy, secure economic recovery and return to fiscal balance by 2013-2014. the government’s strategy has produced results:
• budget deficits in Québec have been smaller than elsewhere;
• the recession has not been as deep, enabling a faster return to fiscal balance.
the government is staying the course on returning to fiscal balance and reducing the debt, while fostering long-term economic development. budgetary objectives are being met over the time period covered by the plan to restore fiscal balance.
• for 2011-2012, the budget deficit is estimated at $3.3 billion.
• for 2012-2013, the budget deficit objective of $1.5 billion is maintained.
• lastly, a balanced budget is forecast for 2013-2014.
SOURCE : MINISTÈRE DES FINANCES DU QUÉBEC.
BUDGETARY BALANCE FROM 2009-2010 TO 2013-20141
(millions of dollars)
2009-2010 2010-2011 2011-2012 2012-2013 2013-2014
2000
300-1 500
300-3 300-3 150-3 174 Contingency
reserves
Support the economy and prepare for recovery
Restore �scal balance
Sustainable path: sound public �nances
1 Budgetary balance within the meaning of the Balanced Budget Act.
SUMMARy Of BUDgETARy TRANSACTiONS, BUDgET 2012-2013 (millions of dollars)
2011-2012 2012-2013 2013-2014budgetary revenue1 65 539 69 395 72 524
% change 4.6 5.9 4.5
budgetary expenditure1 –68 836 –70 879 –72 578
% change 2.5 3.0 2.4
consolidated entities2 1 145 1 195 1 295
contingency reserves –300 –300 –200
SURplUS (DEfiCiT) –2 452 –589 1 041
payments of revenue
dedicated to the
generations fund –848 –911 –1 041
budget balance3 –3 300 –1 500 —
as a % of gdp 1.0 0.4 —
1 corresponds to the revenue and expenditure of the general fund.2 included in consolidation adjustments.3 budgetary balance within the meaning of the balanced budget act.

financEs publiquEs18 2012 Edition | EConoMiC And FinAnCiAL PRoFiLE oF QUÉBECPublic financEs18
A SIGNIFICANT REDUCTION IN THE GROWTH OF THE GOVERNMENT’S CONSOLIDATED EXPENDITURE1
(per cent)
BREAKDOWN OF PROGRAM SPENDING BY GOVERNMENT DEPARTMENT – 2012-2013
2006-07 2007-08 2008-09 2009-10
BEFORE THE PLAN2
Average from 2006-2007 to 2009-2010: 5.7%
2010-11 2011-12 2012-13 2013-14
WITH THE PLAN2
Average from 2010-2011 to 2013-2014: 2.8%
22%Other government
departments
48%Health and Social Services
26%Education, Recreation
and Sport
4%Family and Seniors
1 Excluding debt service.2 Plan to restore �scal balance.
4.9
6.55.8 5.6
3.6 3.5
2.0 2.2
Real data
rigourous managEmEnt of Public financEs
controlling sPEndingAlong with British columbia and New Brunswick, Québec is the canadian province that has best controlled its spending since 2003-2004. • consolidated expenditure excluding debt service has risen by 5.3% per year on average from 2003-2004 to 2010-2011 in Québec, compared with 6.3% in the other provinces.
For the period from 2010-2011 to 2013-2014, average annual growth in consolidated expenditure excluding debt service will be 2.8%, a significant decrease compared to the 5.7% observed from 2006-2007 to 2009-2010.
a funding pLan for the major goVernment missions
unprecedented efforts have been made to ensure stable funding of the major government missions, despite the actions taken to slow spending growth.
with these funding plans, close to 50% of the government’s consolidated expenditure is covered by a medium-term financial framework. these funding plans will make it possible to:
• increase government funding for health by 5% per year on average from 2009-2010 to 2013-2014;
• invest an additional $967 million to ensure the excellence and performance of Québec universities by 2016-2017;
• carry out the work needed to offset the maintenance deficit of the road network with funding from the land transportation network fund;
• foster sustainable forest development, through allocations of more than $500 million annually until 2016-2017, while increasing revenues from royalties and duties on timber.
a meDIum-teRm funDInG Plan waS eStablISheD foR health, unIveRSItIeS, RoaD anD PublIc tRanSIt InfRaStRuctuRe anD the foReStRy SectoR.

Public financEs 19
BREAKDOWN OF THE GOVERNMENT’S OWN SOURCE REVENUE – 2011-2012
FEDERAL TRANSFERS – 1980-1981 TO 2012-2013 (as a percentage of budgetary revenue)
11.9%
30.7%Consumption taxes
Health Services Fund
36.5%Personal
income tax
9.1%Government enterprises
8.1%Corporate
income tax
3.7%Other revenue
28.8%
14.6%
23.2%
1980-81 1985-86 1990-91 1995-96 2000-01 2005-06 2012-13
the government is stayingthe course to restore fiscalbalance by 2013-2014.
the canadian federation QUÉBEC iS pART Of CANADA, A fEDERATiON CREATED iN 1867.
ThE RESpONSABiliTiES Of ThE fEDERAl gOvERNMENT AND ThE TEN pROviNCES ARE DEfiNED iN ThE CONSTiTUTiON.
• ThE fEDERAl gOvERNMENT iS RESpONSiBlE fOR iNTERNATiONAl TRADE, NATiONAl DEfENCE, CURRENCy, MONETARy pOliCy AND EMplOyMENT iNSURANCE, AMONg OThER ThiNgS.
• ThE pROviNCES hAvE ExClUSivE jURiSDiCTiON iN MANy fiElDS iNClUDiNg hEAlTh, EDUCATiON, SOCiAl SERviCES AND MUNiCipAl AffAiRS. ThE vARiOUS ORDERS Of gOvERNMENT iN CANADA COllECT REvENUE EQUivAlENT TO 34% Of gDp, Of whiCh:
• 44% iS COllECTED By ThE fEDERAl gOvERNMENT;
• 56% iS COllECTED By pROviNCiAl gOvERNMENTS AND lOCAl ADMiNiSTRATiONS (MUNiCipAliTiES AND SChOOl BOARDS).
divErsifiEd rEvEnuE sourcEs
The Québec government’s revenue comes from two sources:
• own-source revenue (77.2%);
• federal transfers (22.8%).
most own-source revenue is derived from personal income tax (36.5%) and taxes on consumption (30.7%).
In addition, Québec is one of the six provinces that receive transfer payments under the federal equalization program.
• Québec and the nine other provinces also receive transfers for social programs such as health and post-secondary education.

financEs publiquEs20 2012 Edition | EConoMiC And FinAnCiAL PRoFiLE oF QUÉBECPublic financEs20
ANNUAL INVESTMENTS UNDER THE QUÉBEC INFRASTRUCTURES PLAN(as a percentage of GDP)
CHANGE IN THE STOCK OF PUBLIC CAPITAL (as a percentage of GDP, 2002 dollars)
2.8
2.1
1.61.4
1.2
1997-98 2001-02 2005-06 2009-10 2013-14 2017-18 2021-22 2025-26
SOURCES: MINISTÈRE DES FINANCES DU QUÉBEC AND SECRÉTARIAT DU CONSEIL DU TRÉSOR.
Québec Québec - ForecastCanada
40
35
30
25
20
151961 1971 1981 1991 2001 2011 2021
SOURCES: STATISTICS CANADA AND MINISTÈRE DES FINANCES DU QUÉBEC.
Québec Québec - Forecast
22.5
28.131.7
long-tErm managEmEnt of infrastructurE invEstmEnts To improve the quality of infrastructures, the Québec government implemented a major public infrastructure investment plan extending to 2025-2026. This plan was intensified to support the economy and employment during the last recession.
Beginning in 2013-2014, the annual investment targets will decline, reaching $8.0 billion in 2015-2016, and remain stable thereafter. These targets will make it possible to:
• complete the major projects that are in progress;
• fund new priority projects and finish offsetting the maintenance deficit by 2022-2023 pursuant to the Act to promote the maintenance and renewal of public infrastructures.
The capping of infrastructure investment targets will result in a decrease in their importance in the economy, from a peak of 2.8% in 2012-2013 to 1.6% by 2025-2026. Nevertheless, the annual level of investment as a percentage of GDP will remain higher than what prevailed prior to 2008.
moreover, with these investment targets, the size of the stock of public capital in the economy, a key productivity and economic growth factor, will continue to rise. This upgrading will restore the stock of public capital to what prevailed in the early 1980s.
ThE lEvEl Of iNvESTMENT iS SET, iN ThE QUÉBEC iNfRASTRUCTURES plAN, AT $44.2 BilliON fOR 2011-2016, iNClUDiNg $9.8 BilliON fOR 2012-2013. ThiS will AllOw ThE CONSTRUCTiON AND RESTORATiON Of MANy ROADS, MUNiCipAl iNfRASTRUCTURE pROjECTS, SChOOlS AND hOSpiTAlS iN EvERy REgiON Of QUÉBEC.
Public financEs 21
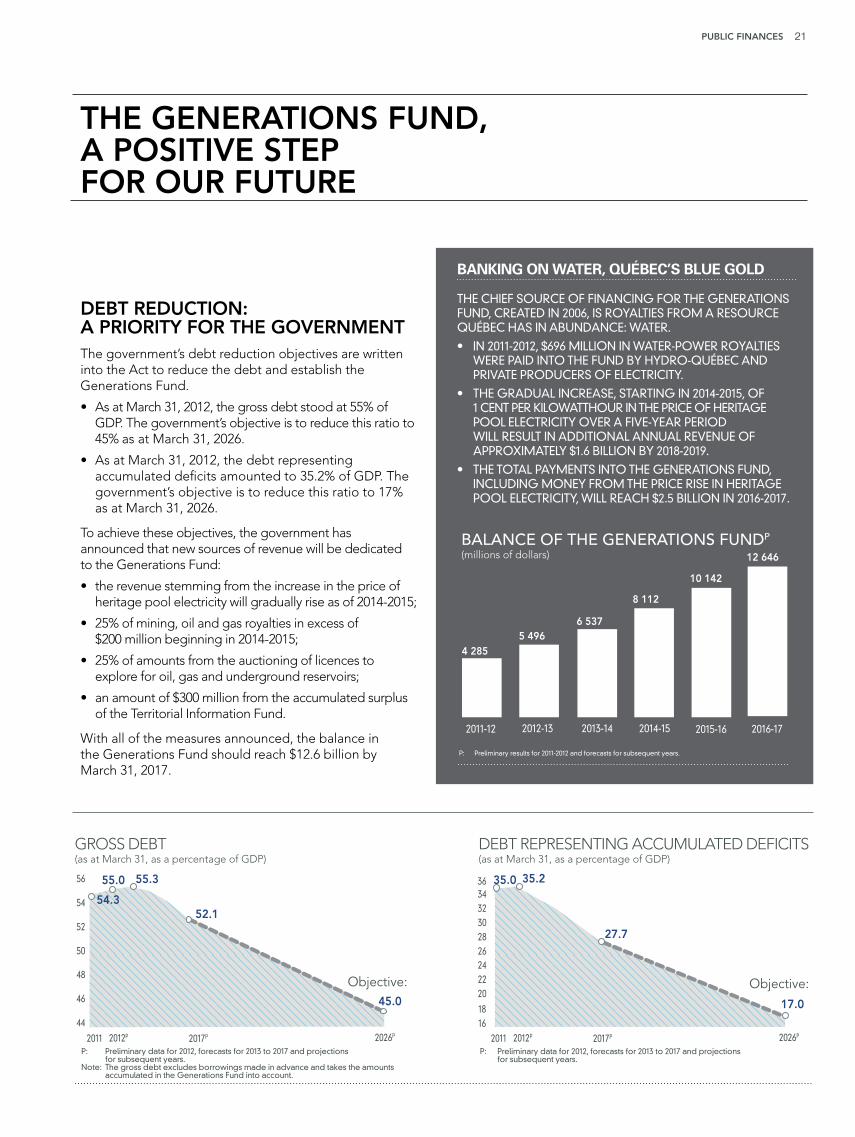
banking on water, Québec’s bLue goLd the chief source of financing for the generations fund, created in 2006, is royalties from a resource Québec has in abundance: water.
• in 2011-2012, $696 million in water-power royalties were paid into the fund by hydro-Québec and private producers of electricity.
• the gradual increase, starting in 2014-2015, of 1 cent per kilowatthour in the price of heritage pool electricity over a five-year period will result in additional annual revenue of approximately $1.6 billion by 2018-2019.
• the total payments into the generations fund, including money from the price rise in heritage pool electricity, will reach $2.5 billion in 2016-2017.
BALANCE OF THE GENERATIONS FUNDP
(millions of dollars)
4 2855 496
6 537
8 112
10 142
2011-12 2012-13 2013-14 2014-15 2015-16
P: Preliminary results for 2011-2012 and forecasts for subsequent years.
12 646
2016-17
thE gEnErations fund, a PositivE stEP for our futurE
DEBT REPRESENTING ACCUMULATED DEFICITS (as at March 31, as a percentage of GDP)
P: Preliminary data for 2012, forecasts for 2013 to 2017 and projections for subsequent years.
17.0
35.235.0
1618
2022242628303234
27.7
Objective:
2011 2026P2012P 2017P
36
GROSS DEBT(as at March 31, as a percentage of GDP)
P: Preliminary data for 2012, forecasts for 2013 to 2017 and projections for subsequent years.Note: The gross debt excludes borrowings made in advance and takes the amounts accumulated in the Generations Fund into account.
44
46
48
50
52
54
56
Objective:45.0
52.1
55.355.0
54.3
2011 2026P2012P 2017P
dEbt rEduction: a Priority for thE govErnmEntThe government’s debt reduction objectives are written into the Act to reduce the debt and establish the Generations Fund.
• As at march 31, 2012, the gross debt stood at 55% of GDP. The government’s objective is to reduce this ratio to 45% as at march 31, 2026.
• As at march 31, 2012, the debt representing accumulated deficits amounted to 35.2% of GDP. The government’s objective is to reduce this ratio to 17% as at march 31, 2026.
To achieve these objectives, the government has announced that new sources of revenue will be dedicated to the Generations Fund:
• the revenue stemming from the increase in the price of heritage pool electricity will gradually rise as of 2014-2015;
• 25% of mining, oil and gas royalties in excess of $200 million beginning in 2014-2015;
• 25% of amounts from the auctioning of licences to explore for oil, gas and underground reservoirs;
• an amount of $300 million from the accumulated surplus of the Territorial Information Fund.
With all of the measures announced, the balance in the Generations Fund should reach $12.6 billion by march 31, 2017.

23 the government’s financing program
24 A major issuer on the Canadian market
25 An ongoing and recognized presence on international markets
27 debt management
28 High credit quality
A strategy of diversifying sources of financing
sECtion 3
financing

thE govErnmEnt’s financing Program
gEnEral fund and financing fund the essential goals of financing are to:
• meet new financing requirements, in particular for capital investments and in government corporations;
• repay maturing borrowings;
• contribute to sinking funds for future payment of retirement benefits and future employee benefits to public and parapublic sector employees.
FINANCING PROGRAMP
(millions of dollars)
2011-2012 2012-2013 2013-2014
20 148
14 95017 773
P: Preliminary results for 2011-2012 and forecasts for subsequent years.
fiNANCiNg pROgRAM(millions of dollars)
2011-2012p 2012-2013p 2013-2014p
gENERAl fUND1
net financial requirements2,3 6 124 2 732 297
repayments of borrowings 7 034 4 519 4 476
change in cash position -4 518 -4 401 —
deposits to the retirement plans sinking fund (rpsf) 1 000 — —
transactions under the credit policy4 -644 — —
additional contributions to the sinking fund relating to borrowings — 3 000 3 000
pre-financing 4 401 — —
TOTAl – general fund 13 397 5 850 7 773
fiNANCiNg fUND 3 360 5 100 4 500including: repayment of borrowings 548 1 254 1 251
fiNANCEMENT-QUÉBEC 3 391 4 000 5 500including: repayment of borrowings 1 962 1 866 3 722
TOTAl 20 148 14 950 17 773including: repayment of borrowings 9 544 7 639 9 449 p: preliminary results for 2011-2012 and forecasts for subsequent years.n.b.: a negative amount indicates a source of financing and a positive amount, a financial requirement.1 the general fund corresponds to the former name of the consolidated revenue fund.2 the amounts exclude net financial requirements of consolidated entities.3 net financial requirements are adjusted to reflect the non-receipt of revenues of the rpsf and of funds dedicated to employee future benefits.4 under its credit policy, which is designed to limit counterparty risk, the government received $644 million in 2011-2012 following exchange rate movements. these receipts reduce financial requirements to be satisfied with new borrowings.
financement-Québec financement-Québec is a government corporation that borrows on financial markets to meet the financing needs of institutions of the health and education networks relating to their capital investments.
• the Québec government guarantees the borrowings of financement-Québec.
• these organizations thus enjoy lower borrowing costs.
incrEasE of prudEntial cash rEsourcEs this year, the government is implementing a new policy to increase the level of prudential cash resources. the objective is to increase the government’s cash resources by $6 billion over the next two years. these funds may be used in the event of significant upheaval on financial markets.

2012 Edition | EConoMiC And FinAnCiAL PRoFiLE oF QUÉBECfinancing24
YIELD ON QUÉBEC SECURITIES (per cent)
SOURCES: PC-BOND AND MINISTÈRE DES FINANCES DU QUÉBEC.
Long-term securities (10 years) 3-month Treasury bills
2002 2003 2004 2005 2006 2007 2008 2009 2010 2011 2012
7.0
6.0
5.0
4.0
3.0
2.0
1.0
0.02002 2003 2004 2005 2006 2007 2008 2009 2010 2011 2012
1.6
1.4
1.2
1.0
0.8
0.6
0.4
0.2
0.0
1.8 Québec-Canada Ontario-Canada
YIELD SPREAD ON LONG-TERM (10-YEAR) SECURITIES(per cent)
SOURCE: PC-BOND.
diVersification by maturity Québec borrows at all maturities on the canadian market. in recent years, where market conditions have been favourable, Québec has floated a number of very long-term issues. to date, the longest maturity for a Québec security is in 2076.
in 2011-2012, 3.7% of borrowings completed had a maturity of 5 years, 25.0%, from 6 to 9 years, 46.9%, 10 years and 24.4%, 30 years.
BORROWINGS COMPLETEDIN 2011-2012P BY MATURITY
46.9%10 years1
24.4%30 years2
3.7%5 years
P: Preliminary results.1 Includes borrowings maturing in 2021 and 2022.2 Includes chie�y borrowings maturing in 2041 and 2043.
25.0%6 to 9 years
a maJor issuEr on thE canadian markEt
liquid Public offEringsPublic offerings form the majority of the government’s transactions on the canadian market.
To foster the liquidity of its securities, the government sets benchmark issues and increases their size until the amount outstanding is considered optimal.
BENcHmARk ISSuES IN cANADA(millions of dollars)
COUpON (%)
iSSUE DATE
MATURiTy DATE
AMOUNT OUTSTANDiNg
short term 5.25 2003 2013 2 152
5.50 2004 2014 2 500
5.00 2005 2015 2 500
4.50 2006 2016 3 000
medium term 4.50 2007 2017 4 000
4.50 2008 2018 4 000
4.50 2009 2019 5 000
4.50 2010 2020 5 900
4.25 2011 2021 6 000
3.50 2011 2022 4 500
9.375 1993 2023 2 202
long term 6.00 1998 2029 2 737
6.25 2000 2032 4 200
5.75 2003 2036 4 083
5.00 2006 2038 5 000
5.00 2009 2041 8 000
4.25 2011 2043 4 500
very long term 5.00 2006 2051 420
various 2006 2056 1 500
6.70 2006 2062 150
various 2009 2065 385
6.35 2006 2065 940
various 2007 2076 500

financing 25
DATE OF THE FIRST QUÉBEC BOND ISSUES (by currency)
1998 1999 2001 2005 2006 20071874 1879 1968 1972 1991 19971992
Dut
ch g
uild
er
Poun
d s
terli
ng
US
do
llar
Ge
rman
mar
k
Swis
s fr
anc
Yen
Fre
nch
fran
c
Italia
n lir
a
Span
ish
pe
seta
Swe
dis
h cr
ow
nLu
xem
bo
urg
fran
Euro
Aus
tral
ian
do
llar
Ne
w Z
eal
and
do
llar
Me
xica
n p
eso
Ho
ng K
ong
do
llar
an ongoing and rEcognizEd PrEsEncE on intErnational markEts
MARkET COUpON (%)
iSSUEDATE
MATURiTyDATE
OUTSTANDiNg (millions)1
iSSUES iN US DOllARS4.875 2004 2014 1 000
4.60 2005 2015 1 000
5.00 2006 2016 1 250
5.125 2006 2016 1 500
4.625 2008 2018 1 000
3.50 2010 2020 1 500
2.75 2011 2021 1 400
7.50 1993 2023 1 000
7.125 1994 2024 1 000 7.50 1999 2029 1 500
issues in euros4.25 2003 2013 1 000
3.625 2005 2015 1 500
3.375 2005 2016 1 500
4.75 2008 2018 1 250 5.00 2009 2019 1 500
issues in other currenciesswiss franc 3.50 2008 2014 250
3.125 2009 2015 350
2.25 2005 2015 500
2.625 2006 2017 500
3.375 2008 2018 250
2.875 2009 2021 200
yen 1.60 2001 2013 50 000
australian $ 5.75 2005 2015 450
6.50 2011 2021 225
new zealand $ 6.75 2005 2015 300
mexican peso 8.27 2006 2016 1 500
1 in millions of units of the currency.
divErsification by markEt
Financing transactions are carried out regularly on major international markets, i.e. in the united States, Europe and Asia.
To ensure good liquidity on the secondary market, large issues are floated.
over the last ten years, 19% of borrowings were in foreign currencies. In 2011-2012, the Québec government carried out 8.1% of its borrowings on foreign markets.
québEc’s activitiEs on intErnational markEts
Since 2001, Québec has made 16 benchmark issues in uS dollars and in euros:
• ten issues in uS dollars for a total of uS$11.4 billion;
• six issues in euros for a total of €8.25 billion.
Québec plans to remain a regular issuer on international markets. The objective is to issue one benchmark in uS dollars and one in euros each year.
a longstanding PrEsEncE on intErnational markEts
Québec has borrowed for more than 40 years in Europe and Asia.
• The first borrowing in German marks occurred in 1968.
• The first borrowing in yen was in 1972. - Indeed, Québec was the second foreign government to borrow in yen.
It should be noted that Québec’s presence on international financial markets dates back to 1874 in London and 1879 in New York, when Québec was the first foreign borrower on that market.

2012 Edition | EConoMiC And FinAnCiAL PRoFiLE oF QUÉBECfinancing26
Québec’s august 2011 borrowing in us doLLars the most recent bond issue in us dollars was carried out on august 25, 2011. demand came from more than 50 investors and was such as to enable an issue of us$1.4 billion with a maturity of 10 years. this transaction earned first prize for 2011, in the category “sub-sovereign/municipal” issuers, awarded by the financial magazine euroweek.
Québec now has ten benchmark issues in the us market with maturities ranging between 2014 and 2029.
GEOGRAPHIC BREAKDOWN OF PURCHASES OF THE AUGUST 2011 US$1.4-BILLION ISSUE
85%North America
1%Asia
4%Middle East
10%Europe
divErsifiEd Pool of invEstors Québec regularly meets with investors in the united States, Europe and Asia. This strategy, which was introduced several years ago, enables Québec to expand and diversify its investor base.
rEcognition by intErnational financial markEtsThe financial magazine Euroweek has awarded prizes to Québec for its transactions in uS dollars and in euros carried out in 2001, 2002, 2003, 2005, 2008, 2009 and 2011. The International Financing Review also awarded a prize for Québec’s issue in Swiss francs in 2005.
BREAKDOWN BY TYPE OF INVESTOR OF PURCHASES OF THE AUGUST 2011 US$1.4-BILLION ISSUE
4%Central banks
15%Pension funds and insurance
companies
1%Businesses
79%Fund managers
1%Banks
HISTORY OF BORROWINGS BY CURRENCY1
(per cent)
P: Preliminary results.1 Borrowings of the general fund, borrowings for the �nancing fund and borrowings of Financement-Québec.
66.7
97.774.6
60.284.4
100.0
68.581.3
33.3
2.3
25.439.8
15.631.5
18.7
91.8
8.2
2010-2011
91.9
8.1
2011-2012P2002-2003 2003-2004 2004-2005 2005-2006 2006-2007 2007-2008 2008-2009 2009-2010
Foreign currency Canadian dollar
euro market: Québec present from the beginning Québec was the first canadian province to borrow in euros, on january 11, 1999, i.e. 11 days after the birth of the currency.
Québec carried out its first benchmark issue in euros in june 2001.

financing 27
dEbt managEmEnt
debt management allows the government to achieve savings on debt service.
STRUCTURE OF GROSS DEBT BY CURRENCYAS AT MARCH 31, 2012P
STRUCTURE OF THE GROSS DEBT BYINTEREST RATE AS AT MARCH 31, 2012P
P: Preliminary results.
AFTER TAKING INTEREST RATE ANDCURRENCY SWAPS INTO ACCOUNT
99.5%CA$
0.5%Other currencies
AFTER TAKING INTEREST RATE ANDCURRENCY SWAPS INTO ACCOUNT
P: Preliminary results
P: Preliminary results.
87.9%
12.1%
Floating rate
Fixed rate
THE GovERNmENT’S GRoSS DEBT AS AT mARcH 31, 2012P
(billions of dollars)
consolidated direct debt 159.3
net retirement plans and employee future benefits liability 28.8
less:amount accumulated in the generations fund -4.3
gross debt 183.8
p: preliminary results.
debt ThE gOvERNMENT’S gROSS DEBT iNClUDES ThE DiRECT DEBT, ThE NET liABiliTy UNDER ThE RETiREMENT plANS AND ThE NET liABiliTy fOR EMplOyEE fUTURE BENEfiTS. ThE gROSS DEBT iS REDUCED By ThE AMOUNTS ACCUMUlATED iN ThE gENERATiONS fUND.
pREliMiNARy RESUlTS ShOw ThAT ThE gROSS DEBT STOOD AT $183.8 BilliON AS AT MARCh 31, 2012, EQUivAlENT TO 55.0% Of gDp.
minimizE cost and riskThe government’s debt management strategy seeks to minimize the cost of the debt while limiting the risk tied to fluctuations in exchange rates and interest rates.
Borrowings are made where funds are available, at the lowest possible cost.
Interest rate and currency swaps are used to achieve the desired debt proportions:• by currency;• by type of rate, i.e. fixed or floating rate.

2012 Edition | EConoMiC And FinAnCiAL PRoFiLE oF QUÉBECfinancing28
high crEdit quality
MATURITY OF THE LONG-TERM DEBT AS AT MARCH 31, 2012P
(millions of dollars)
P: Preliminary results.Note: The long-term debt includes the direct debt of the general fund, the debt contracted to make advances to the Financing Fund and the debt of Financement-Québec.
ANNUAL AVERAGE
2012-2013 2013-2014 2014-2015 2015-2016 2016-2017 2017-2018 2018-2019 2019-2020 2020-2021 2021-2031 2031-2041 2041-2077
4801 9142 292
8 6608 1039 3599 193
13 466
10 314
13 045
9 4497 639
commEnts from crEdit-rating agEnciEs moody’s − sEPtEmbEr 2011
“The Province of Quebec’s long-term debt ratings of Aa2 reflect the province’s inherent credit strengths, including a large and diverse economy that supports its sizeable own-source resources and considerable policy flexibility over budgetary outcomes through an unfettered access to a broad range of taxes as well as the ability to adjust its expenditure base when required.”
“The government’s commitment to ease back on debt accumulation through planned reductions in cash requirements and contribution to a debt reserve fund are of key importance to the credit outlook.”
standard & Poor’s − sEPtEmbEr 2011
“The affirmation [of the rating] reflects our view of the province’s robust economic growth prospects in 2011 and 2012, adequate cash and investment holdings, support from the federal government, and commitment to debt reduction.”
a stablE maturity schEdulE
Diversifying borrowings by maturity results in a smooth refinancing schedule, which ensures a regular presence on financial markets. The average maturity of the debt is 12 years.
CREDiT RATiNgS
AgENCy RATiNg OUTlOOk
moody’s aa2 stable
standard & poor’s (s&p) a+ stable
dominion bond rating service (dbrs) a (high) stable
fitch ratings (fitch) aa- stable
japan credit rating agency (jcr) aa+ stable